2012 - 電気事業連合会 · nation’s first electric power company, ... lighting because of...
TRANSCRIPT

The Federation of Electric Power Companies of Japan
ELECTRICIT Y REVIEW JAPANThe Federation of Electric Power Companies of Japan
Printed in Japan 2012.09
ELECTRICIT Y REVIEW JAPANThe Federation of Electric Power Companies of JapanKeidanren-kaikan, 1-3-2, Otemachi, Chiyoda-ku, Tokyo 100-8118, Japan http://www.fepc.or.jp/english/index.html
2012

(North latitude)45゜
40゜
130゜ 135゜ 140゜ 145゜(East longitude)
The Ten Electric Power Companies by Service Area
35゜
KYUSHU Electric Power Co.SHIKOKU Electric Power Co.
The KANSAI Electric Power Co.
TOHOKU Electric Power Co.
The TOKYO Electric Power Co.
The CHUGOKU Electric Power Co.
HOKURIKU Electric Power Co.
HOKKAIDO Electric Power Co.
The OKINAWA Electric Power Co.
CHUBU Electric Power Co.
Sources: Handbook of Electric Power Industry and othersNote: Data in 1965 is based on nine companies.
0
100
200
300
400
500
600
700
800
900
1,000
Sources: Handbook of Electric Power Industry and othersNote: Data in 1965 is based on nine companies.
1965 1975 1985 1999 2010 2011
144.0
28.3
521.9
133.3
346.6
81.5
248.2
(TWh)
(FY)2009
816.9
285.0
Electric Lights(Households)
Power Demand for Ten Companies
858.5
304.2
906.4
289.0
859.8
Japan’s Energy Supply Situation and Nuclear Safety
Ten Electric Power Companies & Market Liberalization
Electric Power Sources
Nuclear Fuel Cycle
Environmental Conservation
International Exchanges
Location of Power Stations
FEPC
Data
Business Addresses
2
4
6
8
10
15
16
18
19
24
Note:Nine Companies include Hokkaido, Tohoku, Tokyo, Chubu, Hokuriku, Kansai, Chugoku, Shikoku and Kyushu.Ten Companies include the above Nine Companies plus Okinawa.
Electricity was first used in Japan on March 25, 1878 at the Institute of Technology in Toranomon, Tokyo when an arc lamp was switched on in commemoration of the opening of the Central Telegraph Office. In those days, electricity was still unfamiliar and uncommon not only in Japan but also in Europe and the United States. In 1886, Tokyo Electric Lighting, a private company, commenced operations as the nation’s first electric power company, and began supplying electricity to the public in the following year.
In the early days, use of electricity grew primarily for lighting because of its safety and cleanness, and gradually found broader applications as a power source to replace the steam engine. By 1896, the number of electric utilities established throughout the nation reached a total of 33. The early 20th century marked the establishment of long-distance transmission technology. As larger thermal and hydro power plants were introduced, generation costs fell and electricity came into wider use throughout the country. Consequently, electricity became an indispensable energy source for peoples’ lives and industry.
In the years that followed, the electricity utility business grew in tandem with the modernization of Japan and development of its industry. At the same time, the electric utility industry experienced a major restructuring that led to the dissolution of 700 electric utilities, which merged to create five major electric utilities after the First World War. During the Second World War, the electric utility industry was completely state-controlled and utilities were integrated into Nihon Hatsusoden Co. (a nationwide power generating and
transmitting state-owned company) and nine distribution companies.
After the end of World War II in 1945, supply and demand for electricity remained very tight in Japan. A series of intense discussions were held on restructuring the electric utility industry as one of the measures for democratizing the economy. As a result, nine regional privately owned and managed General Electricity Utilities— Hokkaido, Tohoku, Tokyo, Chubu, Hokuriku, Kansai, Chugoku, Shikoku and Kyushu Electric Power Companies — were established in 1951 and assumed the responsibility of supplying electricity to each region. This fundamental structure remains to this day, and with the return of Okinawa to Japan in 1972, Okinawa Electric Power Co. joined as a tenth member.
At the end of the 20th century, a trend toward deregulation and competition took hold throughout society, and the electric utility industry started to be liberalized. In December 1995, organizations such as the independent power producers (IPP) were allowed to provide electricity wholesale services and in March 2000, electricity retail supply for extra-high voltage users (demand exceeding 2MW) was liberalized. The scope of retail liberalization was then expanded in April 2004 to users of more than 500kW, and subsequently in April 2005 to users of more than 50kW. Thus, a Japanese model of liberalization based on fair competition and transparency while maintaining the vertical integration of generation, transmission and distribution to ensure a stable supply of electricity, was established.
History of Japan’s Electric Utility Industry

LNG tanker
2 3
0
70
80
90
100
Dependence on Imported Energy Sources by Major Countries (2010)
Japan’s Reliance on Middle East Crude Oil of Total Imports
-80
-60
-40
-20
0
20
40
60
80
100
Source: IEA "Energy Balances of OECD Countries 2012 Edition”, IEA "Energy Balances of Non-OECD Countries 2012 Edition”
(%)
Source: Petroleum Association of Japan
(%)
25
83 Nuclear Energy not included in domestic energy
98
60
71
81
96
48
91
32
22
-58
-49
JapanItaly South Korea
GermanyFrance
U.S.A.India
U.K.BrazilChina
Canada
Russia
(FY)'65 '70 '75 '80 '85 '90 '95 '00 '10'05
84.6
78.2
71.4
68.8
78.6
87.1
89.1
86.6
71.5
83
262735
7
-84-78
9 99
Nuclear Energy included in domestic energy
82
88.3
0
100
200
300
400
500
600Oil
LPG
LNG
Coal
New Energy etc.
Geothermal
Hydro
Nuclear
0
200
400
600
800
1,000
1,200Oil etc.
LNG
Coal
New Energy etc.
Geothermal
Hydro
Nuclear0
50
100
150
200
250
300Oil etc.
LNG
Coal
New Energy
Geothermal
Hydro
Nuclear69(12%)
17 3%116 3%
123(21%)
88(15%)
18(3%)
255(43%)
〔588〕
99(18%)
19 3%130 5%
107(19%)
89(16%)
18(3%)
190(34%)
〔553〕
107(21%)
92(18%)
71(14%)
17(3%)
168(33%)
〔515〕
(GW) (TWh)
2030 (FY)Projected
2020Projected
2005
Nuclear
Coal
LNG
LPG
Hydroelectric
Oil
Geothermal
Nuclear
Coal
LNG
Hydroelectric
Oil etc.
Geothermal
Nuclear
Coal
LNG
Hydroelectric
Oil etc.
Geothermal
Long-term Energy Supply and Demand Outlook (August 2009) -Maximum Introduction Case-
49.58(21%)
45.74(19%)
58.74(24%)
37.67(16%)
46.62(19%)
0.522.50
2030 (FY)Projected
2020Projected
2005
3.25.6 1%
8%
252.9(26%)
81.3
304.8(31%)
233.9(24%)
107.2(11%)
〔988.9〕
3.457.5
190.5(18%)
80.5
434.5(42%)
231.1(22%)
48.5(5%)
〔1,046.0〕
2030 (FY)Projected
2020Projected
2005
Primary Energy SupplyGeneration CapacityComposition by Source
Power OutputComposition by Source
(million kls of crude oil equivalent)
60.15(21%)
49.25(18%)
57.67(21%)
37.88(14%)
42.06(15%)
33.00(12%)0.53
〔280.54〕
63.15(21%)
50.77(17%)
48.81(17%)
30.03(10%)
59.75(20%)
42.06(14%)
1.20
〔295.77〕
5%
8%
7.590.7
134.6(14%)
88.9
469.5(49%)
137.1(14%)
36.3(4%)
〔964.6〕
9%
9%1%
20 4%238 5%
New Energy etc.
New Energy New Energy etc.
Note: (1) (*)This case assumes utmost dissemination of equipment, of which energy e�ciency performance will signi�cantly improve with cutting-edge technologies that are already at the deployment stage, without imposing obligatory measures on the people.
(2)Figures may not add up to the totals due to rounding.Source: The Energy Supply and Demand Subcommittee of the Adcisory Committee for Natural Resources and Energy
(*)
〔241.37〕
1%
Resource-poor Japan is dependent on imports for 96% of its primary energy supply; even if nuclear energy is included in domestic energy, dependency is still at 82%. �us, Japan’s energy supply structure is extremely vulnerable. Following the two oil crises in the 1970s, Japan has diversi�ed its energy sources through increased use of nuclear energy, natural gas and coal, as well as the promotion of energy e�ciency and conservation. Despite these improvements, oil still accounts for about 50% of Japan’s primary energy supply, and nearly 90% of imported oil comes from the politically unstable Middle East. Moreover, prospects for importing electricity from neighboring countries are very poor because Japan is an island nation. In addition, there is an urgent need for global warming countermeasures such as reduction of carbon dioxide emissions from the use of energy. To ensure Japan’s stable electricity supply, it is crucial to establish an optimal combination of power sources that can concurrently deliver energy security, economic e�ciency, and environmental
conservation, while placing top priority on safety.Concerning Japan’s energy policy, the Japanese
Government will develop the Japanese model of the optimal combination of power sources, based on detailed studies on the cost of the nuclear fuel cycle and the amount of renewable energy that can be introduced across the country, while thoroughly implementing safety measures for nuclear power generation. �rough these activities, the government intends to draw up a new Framework of Nuclear Energy Policy and a new Basic Energy Plan by the summer of 2012.
Recognizing the severity of the accident at the Fukushima Dai-ichi nuclear power station where all sources of power for unit 1 through 4 failed due to the Great East Japan Earth-quake and Tsunami of March 11, 2011, the electric power companies of Japan have committed to reinforcing safety assurance measures at their nuclear power plants focusing on measures against tsunami.
�e companies have taken both tangible and intangible measures immediately following the Fukushima accident, including deploying additional emergency power source vehicles and �re engines, preparing manuals, and imple-menting emergency drills, as emergency safety measures to prevent fuel damage by continuously cooling the reactor and spent fuel pit under any circumstances.
�e electric power companies have taken diverse measures to ensure that the above-mentioned measures are e�ective, such as reinforcing the on-site communication
system and preparing high-dose resistant protective clothing to allow necessary actions to be taken even in the event of a severe accident. �e companies are also taking medium- to long-term measures which include installing additional permanent emergency power supply units on high ground, constructing coastal levees, modifying watertight facilities, and installing large-capacity temporary seawater pumps, in case of a station blackout and loss of sea water cooling systems to increase their safety margin.
�e companies are also performing stress tests to compre-hensively evaluate the safety of their nuclear power plants, including introducing the above-mentioned emergency safety measures.
Surveys on the Fukushima Dai-ichi accident may highlight additional measures that should be taken, and the electric power companies are ready to respond accordingly to the latest �ndings.
Japan’s Energy Supply Situation and Basic Policy Electric Power Companies’ Commitment for Safety Measures at Nuclear Power Plants
Japan’s Energy Supply Situation and Nuclear Safety
写真: Deployment of emergency power supply cars and �re engines写真: Measures to prevent �ooding such as replacement by watertight doors
LNG Terminal
Power Source Vehicle
Fire Engine
Tide Wall
Watertight Door
After measures
Tide wall (New construction)
Tide wall (New construction)
Nuclear reactor building Present condition
4 5
Business Category De�nition
Business of supplying electricity to meet general demand (license required)
Business of supplying a General Electricity Utility with electricity for use in its General Electricity Business, using the Electric Facilities with total capacity exceeding 2 GW (license required)
Business of supplying electricity to meet demand at a speci�ed service point (license required)
Business of supplying electricity (excluding licensed electricity businesses) to meet a demand exceeding 50kW from electricity users (Speci�ed-Scale Demand), which are conducted by a General Electricity Utility in an area other than its service area, or conducted by a person other than a General Electricity Utility (noti�cation required)
Supply of electricity to a General Electricity Utility for use in its General Electricity Business (excluding supply through a Cross-Area Wheeling Service) based on a contract of electricity supply exceeding 1 MW for at least 10 years or exceeding 100 MW for at least 5 years
General Electricity Business
Wholesale Electricity Business
Speci�ed Electricity Business
Speci�ed-Scale Electricity Business(Commonly called PPSs)
Wholesale Supply(Commonly called IPPs)
Classification of Businesses Specified in the Electricity Utilities Business Act (extract from the Act)
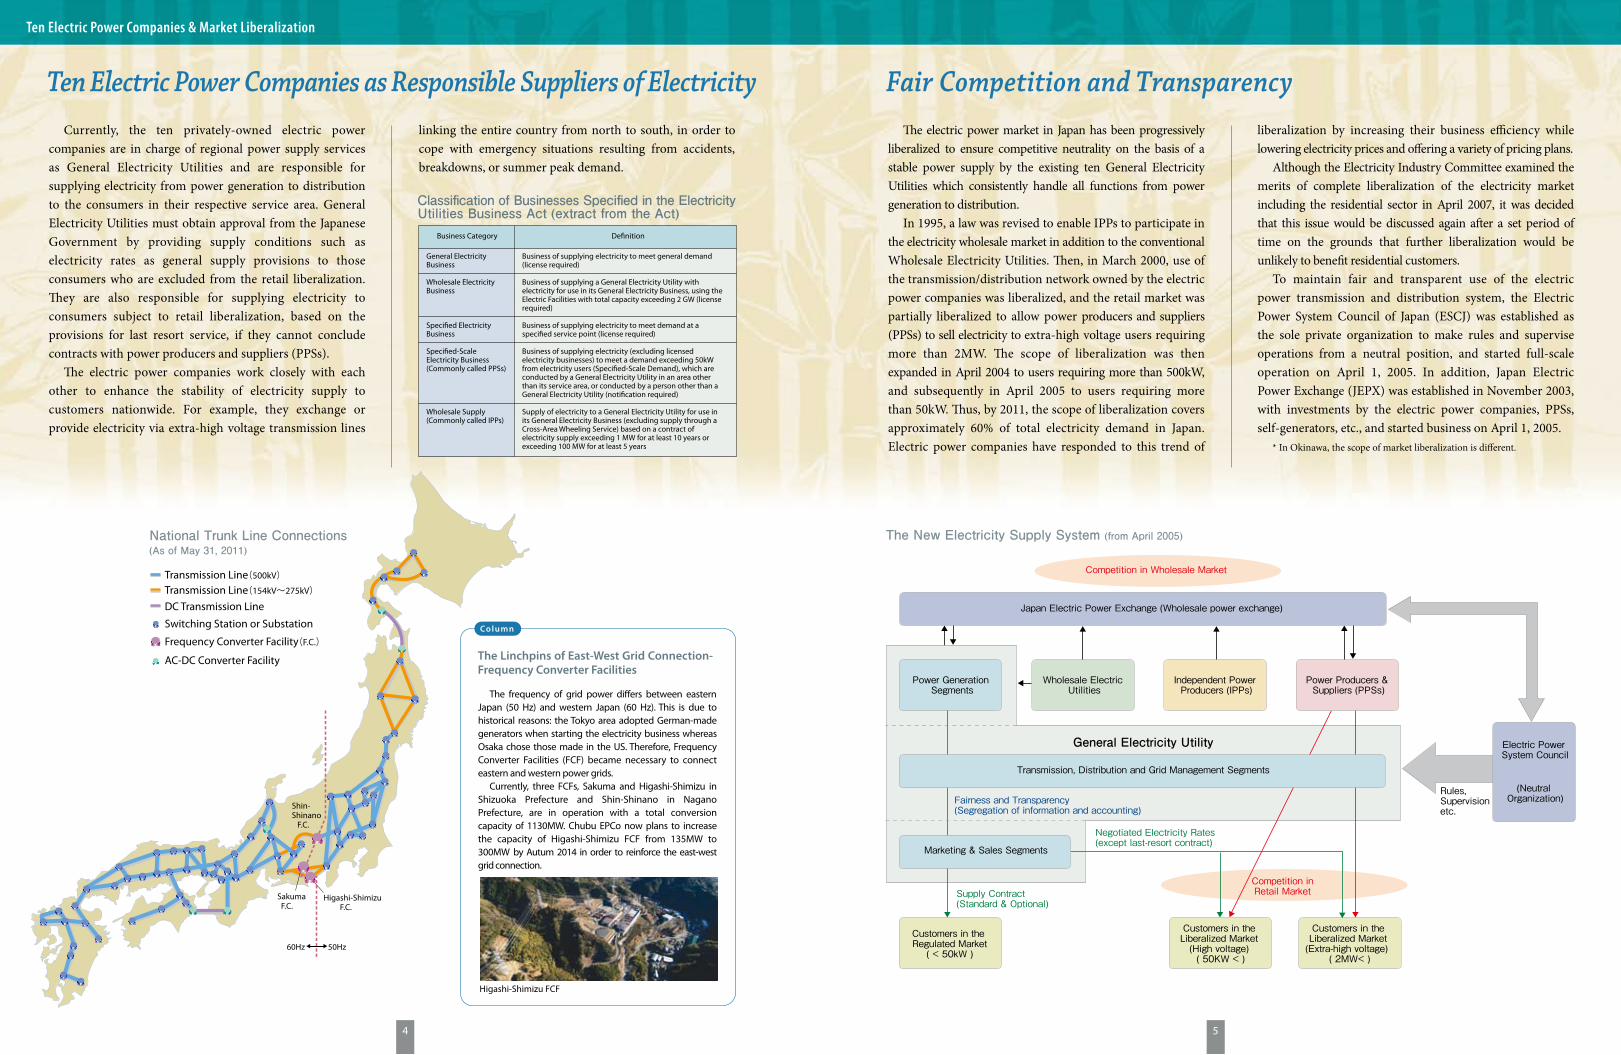
Transmission Line(500kV)
Transmission Line(154kV~275kV)
Switching Station or Substation
Frequency Converter Facility(F.C.)
AC-DC Converter Facility
DC Transmission Line
National Trunk Line Connections(As of May 31, 2011)
The New Electricity Supply System (from April 2005)
Japan Electric Power Exchange (Wholesale power exchange)
Customers in the
Regulated Market
( < 50kW )
Customers in the
Liberalized Market
(High voltage)
( 50KW < )
Customers in the
Liberalized Market
(Extra-high voltage)
( 2MW< )
Competition in
Retail Market
Competition in Wholesale Market
Wholesale Electric
Utilities
General Electricity Utility
Fairness and Transparency
(Segregation of information and accounting)
Negotiated Electricity Rates
(except last-resort contract)
Supply Contract
(Standard & Optional)
Independent Power
Producers (IPPs)
Electric Power
System Council
(Neutral
Organization)
Rules,
Supervision
etc.
60Hz 50Hz
Shin-Shinano F.C.
Sakuma F.C.
Higashi-Shimizu F.C.
Transmission, Distribution and Grid Management Segments
Marketing & Sales Segments
Power Generation Segments
Column
The Linchpins of East-West Grid Connection- Frequency Converter Facilities
The frequency of grid power di�ers between eastern Japan (50 Hz) and western Japan (60 Hz). This is due to historical reasons: the Tokyo area adopted German-made generators when starting the electricity business whereas Osaka chose those made in the US. Therefore, Frequency Converter Facilities (FCF) became necessary to connect eastern and western power grids.
Currently, three FCFs, Sakuma and Higashi-Shimizu in Shizuoka Prefecture and Shin-Shinano in Nagano Prefecture, are in operation with a total conversion capacity of 1130MW. Chubu EPCo now plans to increase the capacity of Higashi-Shimizu FCF from 135MW to 300MW by Autum 2014 in order to reinforce the east-west grid connection.
Power Producers & Suppliers (PPSs)
Currently, the ten privately-owned electric power companies are in charge of regional power supply services as General Electricity Utilities and are responsible for supplying electricity from power generation to distribution to the consumers in their respective service area. General Electricity Utilities must obtain approval from the Japanese Government by providing supply conditions such as electricity rates as general supply provisions to those consumers who are excluded from the retail liberalization. �ey are also responsible for supplying electricity to consumers subject to retail liberalization, based on the provisions for last resort service, if they cannot conclude contracts with power producers and suppliers (PPSs).
�e electric power companies work closely with each other to enhance the stability of electricity supply to customers nationwide. For example, they exchange or provide electricity via extra-high voltage transmission lines
linking the entire country from north to south, in order to cope with emergency situations resulting from accidents, breakdowns, or summer peak demand.
�e electric power market in Japan has been progressively liberalized to ensure competitive neutrality on the basis of a stable power supply by the existing ten General Electricity Utilities which consistently handle all functions from power generation to distribution.
In 1995, a law was revised to enable IPPs to participate in the electricity wholesale market in addition to the conventional Wholesale Electricity Utilities. �en, in March 2000, use of the transmission/distribution network owned by the electric power companies was liberalized, and the retail market was partially liberalized to allow power producers and suppliers (PPSs) to sell electricity to extra-high voltage users requiring more than 2MW. �e scope of liberalization was then expanded in April 2004 to users requiring more than 500kW, and subsequently in April 2005 to users requiring more than 50kW. �us, by 2011, the scope of liberalization covers approximately 60% of total electricity demand in Japan. Electric power companies have responded to this trend of
liberalization by increasing their business e�ciency while lowering electricity prices and o�ering a variety of pricing plans.
Although the Electricity Industry Committee examined the merits of complete liberalization of the electricity market including the residential sector in April 2007, it was decided that this issue would be discussed again a�er a set period of time on the grounds that further liberalization would be unlikely to bene�t residential customers.
To maintain fair and transparent use of the electric power transmission and distribution system, the Electric Power System Council of Japan (ESCJ) was established as the sole private organization to make rules and supervise operations from a neutral position, and started full-scale operation on April 1, 2005. In addition, Japan Electric Power Exchange (JEPX) was established in November 2003, with investments by the electric power companies, PPSs, self-generators, etc., and started business on April 1, 2005.
* In Okinawa, the scope of market liberalization is di�erent.
Ten Electric Power Companies as Responsible Suppliers of Electricity Fair Competition and Transparency
Ten Electric Power Companies & Market Liberalization
Higashi-Shimizu FCF

6 7
0 2 4 6 8 10 12 14 16 18 20 22 24
Base Load Supply
Mid-range Load Supply
Peak Load Supply
HydroelectricPumped-storageType
HydroelectricRegulating Pondage and Reservoir Type
(Example) Combination of Power Sources
Oil
Nuclear
LNG and Other Gas
Hydroelectric (Inflow type) and Geothermal
Coal
Hydroelectric and nuclear power provides base load supply, while coal and LNG are major power sources for mid-range load supply. Oil-�red and pumped-storage hydroelectric power respond to peak demand �uctuation and contribute to consistent stable supply of electricity.
Electric power companies in resource-poor Japan are committed to developing an optimal combination of power sources that combines various energy sources such as hydro, thermal and nuclear power in order to provide electricity, which is essential for modern living, in a stable manner at the lowest prices.
As electricity is nearly impossible to store in large quantities, electric power companies generate electricity by combining various power sources, considering optimal operational and economic performance, to ensure that the �uctuating demand, such as during the daytime in the height of summer, can always be met.
Hydroelectric PowerHydroelectric power has been one of the few self-su�cient
energy resources in resource-poor Japan for more than 100 years. Hydroelectric power is an excellent source in terms of stable supply and generation cost over the long term. �ough it used to compare unfavorably with thermal power for some time, hydroelectric power saw a renaissance following the oil crisis.
Although the steady development of hydroelectric power plants is desired, Japan has used nearly all potential sites for constructing large-scale hydroelectric facilities, and so recent developments have been on a smaller scale. As the gap in demand between daytime and nighttime continues to widen, electric power companies are also developing pumped-storage power generation plants to meet peak demand. �e share of pumped-storage generation facilities of the total hydroelectric power capacity in Japan is growing year by year.
Optimal Combination of Power Sources
Electric Power Sources
Thermal PowerInitially, coal was the dominant fuel for thermal power
generation in Japan, but it later lost that place to oil. Today, a diverse range of fuels including coal, oil, and LNG are used for the important generating role that thermal power plants play. In particular, in response to global environmental concerns, electric power companies are promoting the introduction of LNG �red plants, as they emit less CO2 and other pollutants.
To enhance thermal e�ciency further, combined-cycle power plants with both gas and steam turbines have been installed. As a result, gross thermal e�ciency (maximum designed value) has exceeded 50%. In the future, we will continue to research and develop new technologies in order to increase thermal e�ciency as well as the use of integrated coal gasi�cation combined cycle (IGCC) power generation.
Nuclear PowerJapan’s �rst commercial nuclear power plant started
operation in Ibaraki Prefecture in 1966. Currently, nuclear power generation is an important power source, accounting for nearly one-third of Japan’s total electric power output.
Electric utility industry believes that nuclear power generation will retain an important position in the optimal combination of power sources from the viewpoint of assuring energy security and mitigating global warming.
Japanese electric utilities are �rmly committed to implementing extensive safety measures following the recent accident at the Fukushima Dai-ichi Nuclear Power Station, reinforcing the mechanism to re�ect the latest �ndings both in Japan and overseas, and enhancing the safe operation of the country's nuclear power plants.
We will also continue to publish the latest information to contribute to the safety of nuclear power generation throughout the world.
Okumino Hydroelectric Power Station (Pumped-storage)
Arimine Daiichi Hydroelectric Power Station
Kawasaki Thermal Power Station (LNG Combined-cycle) Tomari Nuclear Power Station (PWR)
Reihoku Thermal Power Station (Coal-fired) Shimane Nuclear Power Station (Unit No.3, ABWR, Under Construction)

8 9
JNFL(Rokkasho-mura)
Aomori
Tokyo
Vitrified Waste Storage Center
Uranium Mine
Uranium ore
Refining Plant
Uranium Enrichment Plant
UF6
Reconversion Plant
ConversionPlant
Reprocessing Plant
MOX Fuel Fabrication Plant
Spent fuel
Nuclear Power Plant
UraniumFuel FabricationPlant
Recovered
Uranium
High-level
radioactive waste
Yellow cake
(U3O8)
UF6
UO2
UO2
(Depleted Uranium)
MOX Fuel
Assemblies
Spent-fuel Storage Center(Interim Storage Facility)
Final disposal of high-level radioactive waste Low-level Radioactive
Waste Disposal Center
Low-level
radioactive
waste
Spent fuel
Spent fuel
Uranium
Fuel
Recovered
Uranium,
Plutonium
The Closed Nuclear Fuel Cycle
Iyasakatai, Rokkasho-mura,Kamikita-gun, Aomori Prefecture
Oishitai, Rokkasho-mura,Kamikita-gun, Aomori Prefecture
Maximum capacity: 800 ton-U/year
Storage capacity for spent fuel: 3,000 ton-U
Under construction Under construction
Start of construction: 1993Start of operation: 2013(planned)
Start of construction: 2010Start of operation: 2016(planned)Start of operation:
2016(planned)
Start of construction: 1992Start of storage: 1995
Start of construction: 1988Start of operation: 1992
Start of construction: 1990Start of operation: 1992
Cumulative number ofstored canisters: 1,414
Cumulative number ofstored drums: 240,051
Present capacity: 150 ton-SWU/year
Maximum capacity:130 ton-HM/year (*)
Storage capacity for wastes returned from overseas plants: 2,880 canisters of vitri�ed waste
Planned to be expanded to 600,000m3 (equivalent to 3 million 200 liter drums)
Facility ReprocessingPlant
MOX fuel fabricationplant
Vitri�ed wastestorage center
Uranium enrichmentplant
Low-level radioactivewaste disposal center
Site
Capacity
CurrentStatus
Schedule
Outline of JNFL’s Nuclear Fuel Cycle Facilities (as of December 31, 2011)
Planned to be expanded to a maximum capacity of 1,500 ton-SWU/year (*)
(*) "ton-HM" stands for "tons of heavy metal" which indicates the weight of plutonium and uranium metallic content in MOX. "SWU" stands for "Separative Work Unit" which is a measure of the work expended during an enrichment process of uranium
Sources: JNFL’s website and others
The Safeguards ProgramColumn
Start of the “Active Test” and the Recovery of MOX Powder at Rokkasho Reprocessing Plant
On March 31, 2006, JNFL started the �nal-stage testing, called the “Active Test”, at Rokkasho Reprocessing Plant. The Active Test processes real spent fuel and validates the plant’s safety features and the performance of equipment and facilities before the start of commercial operations. On November 16, 2006, JNFL successfully recovered MOX powder through the testing. The most remarkable feature of the manufacturing technology at the Rokkasho plant is called co-denitration. The process, developed in Japan, does not yield pure plutonium, but produces MOX powder, which deters proliferation and will be fabricated into MOX fuel for reactors.
Material Accounting Report/Activities Report
Non-nuclear Facilities
Nuclear Facilities Material AccountingReport
Activities Report
Inspection Inspection
IAEA
AssessmentReport Domestic
Safeguards SystemSupervised by theMinistry of Education.Culture Sports,Science andTechnology
The Safeguards Program
Material Accounting Report/Activities Report
Non-nuclear Facilities
Nuclear FacilitiesMaterial Accounting
Report
Activities Report
Inspection Inspection
IAEA
AssessmentReport Domestic
Safeguards SystemSupervised by theMinistry of Education.Culture Sports,Science andTechnology
The electric power industry in Japan intends to introduce MOX fuel in 16 to 18 nuclear reactors by �scal 2015. In December 2009, Japan’s �rst nuclear power generation using MOX fuel started at Genkai Nuclear Power Plant Unit 3 of Kyushu Electric Power Company.
On April 23, 2008, METI permitted Electric Power Development Co. Ltd. (EPDC) to construct the Ohma Nuclear Power Plant (ABWR, 1,383MW) in the town of Ohma in Aomori Prefecture. This marks the �rst construction of a nuclear power plant at a new site in Japan within the past ten years. Ohma Nuclear Power Plant is the world’s �rst full-MOX nuclear power plant; it seeks to load the full core with the MOX fuel, thus playing a pivotal role in enhancing the �exibility of Japan’s MOX fuel utilization program. EPDC plans to start operations in 2012.
Status of MOX Fuel Utilization
The nuclear fuel cycle is a series of processes consisting of reprocessing spent fuel that has been used at nuclear power plants and recovering and recycling plutonium and residual uranium as nuclear fuel.
Japan has chosen a closed nuclear fuel cycle policy since the dawn of its nuclear power generation development. Having few resources, Japan decided to recycle spent nuclear fuel domestically in order to establish nuclear power as a homegrown energy source. The benefits of a closed nuclear fuel cycle for Japan are significant: it adds to long-term energy security by reducing dependence on imported fuels; it conserves uranium resources; and it reduces the amount of high-level radioactive waste that must be disposed of.
Reprocessing is a chemical process that recovers plutonium and reusable uranium from spent fuel and separates radioactive wastes into more manageable forms. Once recovered, the plutonium is ready to be re-introduced into the nuclear power plants in the form known as
uranium-plutonium mixed oxide (MOX) fuel. Japan’s electric power companies have continuously committed to a plan to utilize recovered plutonium – in the form of MOX fuel – in 16 to 18 nuclear reactors by fiscal 2015 at the latest.
In the past, Japan has relied on countries such as the U.K. and France to reprocess most of the spent fuel it produced.
However, to place Japan’s domestic nuclear fuel cycle on a firmer footing, Japan Nuclear Fuel Limited (JNFL) is preparing to start the commercial operation of a reprocessing plant in 2012 at a site in Rokkasho-mura in the northern prefecture of Aomori. In addition, JNFL engages in uranium enrichment, temporary storage of vitrified waste, and disposal of low-level radioactive waste. JNFL also has plans to construct a MOX fuel fabrication plant.
Electric utilities regard nuclear power as an important power source for Japan from the viewpoints such as assuring energy security and mitigating global warming. We will make utmost effort to establish the nuclear fuel cycle on the premise of securing thorough safety.
Japan’s electric power companies are fully committed to implementing the closed nuclear fuel cycle and plutonium utilization program consistent with all domestic laws and international nonproliferation standards. Since 1955, the domestic laws of Japan require that all nuclear activities, including commercial activities, be conducted only for peaceful purposes. Also, since 1968, Japan has embraced the “Three Non-Nuclear Principles,” which state that Japan will not possess, produce, or permit the entry of nuclear weapons into its territory.
In addition, in 1976, the Government of Japan ratified the Nuclear Non-Proliferation Treaty (NPT) and thereby obligated itself to a national policy not to produce or acquire nuclear weapons. In order to ensure the application of more extensive safeguards, Japan signed the IAEA Additional Protocol in 1998, which allows the IAEA to carry out a range of additional inspection measures. In accordance with national laws, Japan’s electric power
companies submit reports on material accounting and safeguards activities to the Minister of Education, Culture, Sports, Science and Technology, and accept joint inspections by the IAEA and Japanese regulatory authorities to check the reports.
The results of each of these Japanese initiatives were reflected in the IAEA’s conclusion in June 2004, which stated that all the nuclear materials in Japan are protected under IAEA safeguards and are not being diverted to the manufacture of nuclear weapons. As a result, more effective and efficient IAEA safeguards known as integrated safeguards commenced in Japan in September 2004.
Japan's Nuclear Fuel Cycle The Peaceful Use of Nuclear Energy
Nuclear Fuel Cycle
JNFL's Reprocessing Plant

10 11
0
200
400
600
800
1,000Fuel Combustion
Facilites/Operations
0
100
200
300
400
500
600
700
800
900
1,000
使用電力量
原子力
CO2排出量
0.0
0.1
0.2
0.3
0.4
0.5
0.6
0.7
CO2原単位
1970
Coal Oil LNG LNGcombined
Solar
Wind
Nuclear
Geothermal
Hydro
19901975 1980 1985 20102000 20051995
288.2
858.5
374
Electricity Consumption
Nuclear Power Generation
CO2 Emissions Volume
CO2 EmissionsIntensity
Histrical Trends in CO2 Emissions from Power Generation (excluding self-generators)
Electricity Consumption (TWh) Nuclear Power Generation (TWh)
CO2 Emissions Intensity(kg-CO2/kWh)
(g-CO2/kWh)
CO2 Emissions Intensity over the Entire Lifecycle by Source
(FY)
599
474
376
98
38 25 20 13 11
476
123
695
43
864
79
Note: (1) Based on total CO2 emissions from all energy consumed in energy extraction, transportation, re�ning, plant operation and maintenance, etc. in addition to burning of the fuel.
(2)Data for nuclear power: 1) includes spent fuel reprocessing in Japan (under development), MOX fuel use in thermal reactors (assuming recycling once) and disposal of high level radioactive waste, and 2) is based on the capacity-weighted average of CO2 emissions intensities of existing BWR and PWR plants in Japan, which are 19g-CO2/kWh and 21g-CO2/kWh respectively.
Source: Report of the Central Research Institute of Electric Power Industry, etc.Note: The numerical value of “0.350*“ and “317*“ reflected Kyoto Mechanisum credit.Source: FEPC
943
738
CO2 Emissions (million metric tons-CO2)
0.413
0.350 *
317 *
Decarbonization of Energy at Supply-side (Lowering of CO2 emissions intensity)
Improvement of the Energy Usage Efficiency at Demand-side
Research and Development
Promotion of nuclear power generation based on the premise safety assurance
Development and expansion of use of renewable energy sourcesHydroelectric, geothermal, solar, wind, and biomass power generation
Further improvement of thermal efficiency of thermal power plantsIntroduction of LNG combined-cycle power plant, Improvement of thermal efficiency of coal thermal power plants
Reduction of transmission and distribution lossHigh-voltage transmission, low-loss transformers
Electrification promotion, energy conservation and expansion of high efficiency electric equipmentHeat pumps, heat storage air conditioning, electric vehicles, and othersParticipation in energy saving and CO2 reduction activities by utilizing the domestic credit system
Utilization of untapped energy sourcesHeat recovery from river water, waste incineration facilities and substations
PR-activities and provision of information aimed at energy conservation and CO2 reductionHousehold eco-account book, exhibitions on energy-saving appliances and seminars on energy-saving
Load leveling promotion such as with heat pump & thermal storage systemsThermal storage type air conditioning/hot-water supply, etc
Clean coal technology, next-generation electric power transmission and distribution technology(Smart Grid), CO2 capture and storage technologies
Supply-side
Demand-sideUltra-high efficiency heat pump, electric vehicle technology,etc
Expanding use of non-fossil energy sources
Improving efficiency of electric power equipment
Active utilization of the Kyoto Mechanisms
Sectral approachesInternational Electricity Partnership (IEP), etc
International efforts
Research and Development
Energy conservation
Efforts in office-use energy conservation and the use of company-owned vehiclesReduction of amount of power consumptionIntroduction of electric vehicles and fuel-efficient vehicles
Efforts by electric utility industry as users
Efforts for environmental conservation including countermeasures against global warming, creating a recycling-based society and managing chemical substances, are key challenges for the electric utility industry. In particular, emissions of carbon dioxide (CO2), a major cause of global warming, are closely related to energy utilization in economic activities and daily life, and so the reduction of CO2 emissions is a major challenge for the industry.
With the major assumption of a stable supply of high-quality and inexpensive electricity to customers, the electric power companies are making the necessary efforts on both the supply and demand sides of electricity including supplying low-carbon energy, and improving/promoting high-efficiency electrical devices to enhance the efficient use of electricity by customers. The companies are also conducting various projects for R&D and international cooperation.
CO2 emissions accompanying electricity consumption may increase or decrease depending on various conditions such as weather and the status of electricity use by customers, which cannot be controlled by the utilities themselves.
Therefore, the electric utility industry is striving to achieve the voluntary target of reducing the CO2 emissions intensity (emissions per unit of user end electricity) averaged over the five fiscal years from 2008 to 2012, by approximately 20% from the level in FY 1990 (to approximately 0.34 kg-CO2/kWh) by using the CO2 emissions intensity that the electric utilities can affect by their own efforts.
The CO2 emissions intensity of user end electricity in fiscal 2010 was 0.350 kg-CO2/kWh, down 16% from the FY 1990 level.
Nuclear power emits no carbondioxide (CO2) in the process of power generation, and even considering CO2 emissions over the entire life cycle of various energy sources, those from nuclear power are lower than those from thermal power, and are even lower than those from solar or wind power.
Considering that nuclear power generation will continuously play a key role in combating global warming, the industry is committed to making utmost effort to improve the safety of nuclear power generation and to restore the trust of citizens.
The electric companies are also striving to increase the share of LNG-fired thermal power which has the advantage
of relatively low CO2 emissions, and to improve the efficiency of thermal power plants.
Currently operating state-of-the-art gas turbine combined cycle power plants have achieved the world’s highest level of 59% in thermal efficiency, by, for example, raising the combustion temperature at the gas turbines.
As a result of our efforts to expand the use of nuclear power generation and LNG-fired thermal power generation, and to improve the efficiency of thermal power generation, even though the electricity demand in Japan is now 3.5 times greater since the oil crisis of the 1970s, the CO2
emission intensity (end use electricity) in fiscal 2010 was approx. 41% lower than in fiscal 1970.
Measures by the Electric Utility Industry to Suppress CO2 Emissions Decarbonization of Energy on the Supply-side
Environmental Conservation
Promoting nuclear power generation assuming safety, and improving the thermal efficiency of thermal power plants further
12 13
Comparison of Thermal Power Plant Efficiency in Japan and Other Countries
(Year)19901992 199419961998 2000 2002 2006 200820040
30
32
34
36
38
40
42
44
46
豪州
韓国
インド
中国
米国
ドイツ
フランス
北欧
英国・アイルランド
日本
Japan
U.K./lreland
Northern EuropeKorea RP
France
Germany
U.S.A.
AustraliaChina
India
(%)
*Thermal e�ciency is the gross generating e�ciency based on the weighted averages of e�ciencies for coal, petroleum and gas (low heat value standard).
*Comparisons are made after converting Japanese data (higher heating value standard) to lower heating value standard, which is generally used overseas. The �gures based on lower heating value are around 5-10% higher than the �gures based on higher heating value.
*Private power generation facilities, etc. not covered.
Thermal Efficiency
0
500
1,000
1,500
2,000
2,500
3,000
3,500
4,000
4,500
Wind
Photovoltaic
Column
In October 2008, the FEPC of Japan, Edison Electric Institute of the United States, and EURELECTRIC of Europe jointly announced the establishment of the International Electricity Partnership (IEP) to realize a global low-carbon future through advanced electric power technologies.
On December 15, 2009, the members of IEP presented their technology roadmap entitled “Roadmap for a Low-Carbon Power Sector by 2050” on site at COP15 in Copenhagen, Denmark. In addition to providing analysis of the electric power technology and policies needed to realize a low-carbon society, this Roadmap may also be used as a guideline for transferring advanced electric power technologies to developing countries as a tool of sectoral approaches for reducing greenhouse gas emissions.
International Electricity Partnership(IEP)
APP is a framework for inter-regional partnership for responding to the challenges of growing energy demand, energy security, climate change, and so on. Under this framework, the seven participating countries (United States, Australia, China, India, South Korea, Japan and Canada) are pursuing the development, transfer and spread of clean and energy-e�cient technologies.
CO2 emissions from the seven participating countries account for more than half of global CO2 emissions, and so these seven countries’ e�orts for reducing CO2 emissions will have a global impact. Electric utilities in Japan have been actively involved in these e�orts.
The activities of the APP were completed by the end of April 2011, and will be taken over by the Global Superior Energy Performance Partnership (GSEP).
Participation in Asia-Paci�c Partnership (APP)on Clean Development and Climate
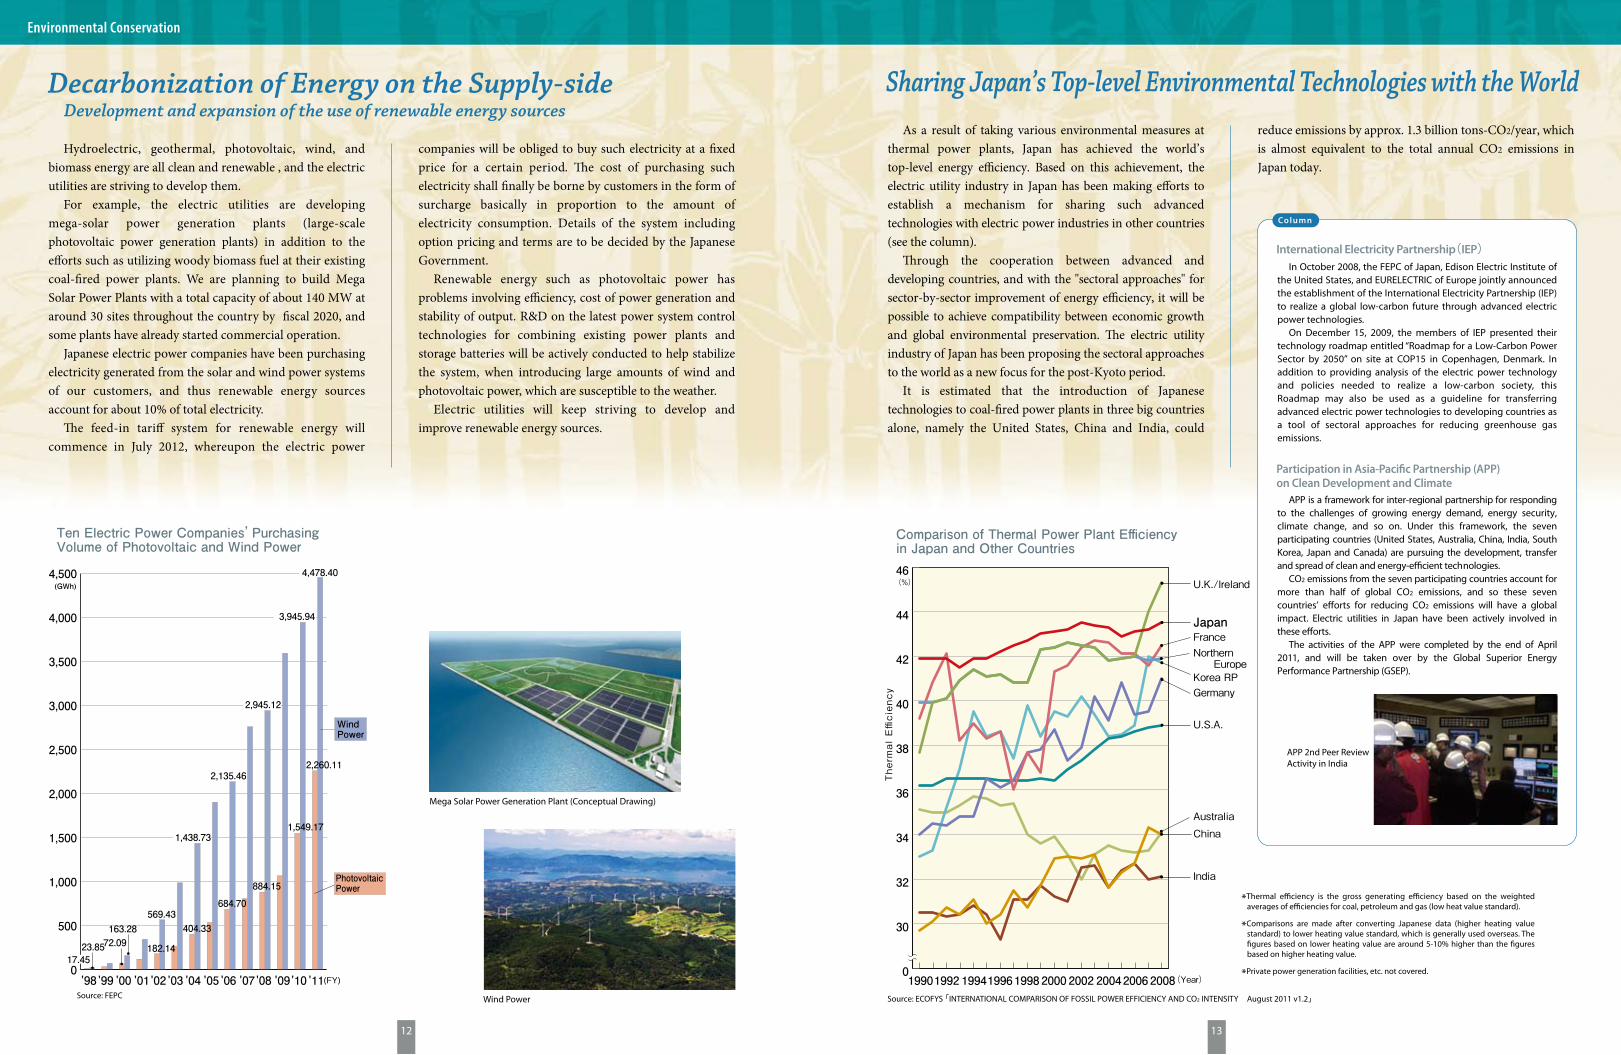
Ten Electric Power Companies’ Purchasing Volume of Photovoltaic and Wind Power
Source: FEPC Source: ECOFYS 「INTERNATIONAL COMPARISON OF FOSSIL POWER EFFICIENCY AND CO2 INTENSITY August 2011 v1.2」
'98 '99 '01'02 '03 '06 '07'08 '09'10 '11'05'04'00
WindPower
PhotovoltaicPower
72.09163.28
(GWh)
182.14
1,438.73
(FY)
569.43404.33
684.70
2,135.46
884.15
2,945.12
1,549.17
3,945.94
2,260.11
4,478.40
17.4523.85
As a result of taking various environmental measures at thermal power plants, Japan has achieved the world’s top-level energy e�ciency. Based on this achievement, the electric utility industry in Japan has been making e�orts to establish a mechanism for sharing such advanced technologies with electric power industries in other countries (see the column).
�rough the cooperation between advanced and developing countries, and with the "sectoral approaches" for sector-by-sector improvement of energy e�ciency, it will be possible to achieve compatibility between economic growth and global environmental preservation. �e electric utility industry of Japan has been proposing the sectoral approaches to the world as a new focus for the post-Kyoto period.
It is estimated that the introduction of Japanese technologies to coal-�red power plants in three big countries alone, namely the United States, China and India, could
reduce emissions by approx. 1.3 billion tons-CO2/year, which is almost equivalent to the total annual CO2 emissions in Japan today.
Hydroelectric, geothermal, photovoltaic, wind, and biomass energy are all clean and renewable , and the electric utilities are striving to develop them.
For example, the electric utilities are developing mega-solar power generation plants (large-scale photovoltaic power generation plants) in addition to the e�orts such as utilizing woody biomass fuel at their existing coal-�red power plants. We are planning to build Mega Solar Power Plants with a total capacity of about 140 MW at around 30 sites throughout the country by �scal 2020, and some plants have already started commercial operation.
Japanese electric power companies have been purchasing electricity generated from the solar and wind power systems of our customers, and thus renewable energy sources account for about 10% of total electricity.
�e feed-in tari� system for renewable energy will commence in July 2012, whereupon the electric power
companies will be obliged to buy such electricity at a �xed price for a certain period. �e cost of purchasing such electricity shall �nally be borne by customers in the form of surcharge basically in proportion to the amount of electricity consumption. Details of the system including option pricing and terms are to be decided by the Japanese Government.
Renewable energy such as photovoltaic power has problems involving e�ciency, cost of power generation and stability of output. R&D on the latest power system control technologies for combining existing power plants and storage batteries will be actively conducted to help stabilize the system, when introducing large amounts of wind and photovoltaic power, which are susceptible to the weather.
Electric utilities will keep striving to develop and improve renewable energy sources.
Sharing Japan’s Top-level Environmental Technologies with the WorldDecarbonization of Energy on the Supply-side
Environmental Conservation
Development and expansion of the use of renewable energy sources
Mega Solar Power Generation Plant (Conceptual Drawing)
Wind Power
APP 2nd Peer Review Activity in India

14 15
LondonParis
Bangkok
JAPAN
Doha
Washington, D.C.
KitchenCompressor
ExpansionValve
CO2 Refrigerant Cycle
Pump
Electricity
AtmosphericHeat
2
Water Heat Exchanger
Energy Obtainedfor
Hot Water Supply
3
Temperature Control Knob
Tank
Air Heat Exchanger
Water
Heating
Bathtub
Shower
Floorheating
Heat Pump Unit Hot Water Storage Tank
CO2 emissions reduction potential
approx. 131.14 million t-CO2
0 5,000 10,000 15,000 (10,000t-CO2)
1
1+2 =3
= 3Electricity Energy Atmospheric Heat1 Energy Obtained for Hot Water Supply
Hot
Water
Supply
Cold
Water
Supply
+ 2
CO2 emissionswith current systems(Fiscal 2002 results)
CO2 emissionsif heat pumps fully penetrate the consumer and industry sectors Source: Calculations by The Heat Pump & Thermal
Storage Technology Center of Japan
Beijing
Homehot water supply
Commercialhot watersupply
Homeheating
Commercialair conditioning Industry sector
Please feel free to contact your nearest office.
Overseas Offices
WASHINGTON, D.C.
●The Federation of Electric Power Companies of Japan, Washington O�ce
The Federation’s Washington Office was established in January 1994. Its principal objectives are to study U.S. energy policies and to exchange information with U.S. energy opinion leaders in order to promote a greater understanding of the Japanese electric power industry.
1901 L Street, N.W., Suite 600, Washington, D.C. 20036, U.S.A. Tel: (202) 466-6781 Fax: (202) 466-6758 Established in 1994
●Tokyo Electric Power Co., Inc., Washington Office
1901 L Street, N.W., Suite 720, Washington, D.C. 20036, U.S.A. Tel: (202) 457-0790 Fax: (202) 457-0810 Established in 1978●Chubu Electric Power Co., Inc., Washington Office
900 17th Street, N.W., Suite 1220, Washington, D.C. 20006, U.S.A. Tel: (202) 775-1960 Fax: (202) 331-9256 Established in 1982
LONDON
●Tokyo Electric Power Co., Inc., London Office
Berkeley Square House, Berkeley Square, London W1J 6BR, U.K. Tel: (020) 7629-5271 Fax: (020) 7629-5282 Established in 1982●Chubu Electric Power Co., Inc., London Office
Nightingale House, 65 Curzon Street, London W1J8PE, U.K. Tel: (020) 7409-0142 Fax: (020) 7408-0801 Established in 1985
PARIS
●Kansai Electric Power Co., Inc., Paris Office
3, rue Scribe 75009, Paris, FRANCE Tel: 01 43 12 81 40 Fax: 01 43 12 81 44 Established in 2008
BANGKOK
●Chubu Elecric Power Co., Inc., Bangkok Office
Unit 4, 18th Floor, M. Thai Tower, All Seasons Place, 87 Wireless Road, Phatumwan, Bangkok 10330, THAILAND Tel: (02) 654-0688 Fax: (02) 654-0689 Established in 2006
DOHA
●Chubu Elecric Power Co., Inc., Doha Office
4th Floor, Al Salam Tower, Al Corniche P.O.Box 22470, Doha, QATAR Tel: (974) 4836-830 Fax: (974) 4834-841 Established in 2007
BEIJING
●Tokyo Electric Power Co., Inc., Beijing Office
Unit 1 Level 11, Tower W1. The Towers Oriental Plaza No.1 East Chang An Avenue, Dong Cheng District Beijing 100738, People’s Republic of China Tel: (10) 8518-7771 Established in 2011
Column
Electric Vehicle Deployment PlanThe electric power companies of Japan have been
working hard to achieve full-scale commercialization of environmentally-e�cient electric vehicles, such as conducting driving tests and developing new fast battery chargers jointly with automobile manufacturers. To expand the use of electric vehicles, the electric power companies jointly decided to introduce about 10,000 electric vehicles (including plug-in hybrid vehicles) in total for commercial use by FY2020.
Japan’s electric power companies remain active on a worldwide basis. In order to cope with global warming and to ensure the safety of nuclear power generation, international cooperation is indispensable. Each of the electric power companies in Japan has individual agreements with overseas utilities in order to facilitate exchanges on a wide range of information such as power generation, customer relations, distribution and quality
Strengthening International Communication and Cooperation
Environmental Conservation
control. The industry’s top executives actively participate in international meetings such as the International Electricity Summit and the World Association of Nuclear Operators (WANO) to exchange views, while we also accept trainees from overseas. We import most of our fuel such as oil and coal from overseas countries and also keep our doors open to foreign companies on the purchase of equipment such as generators.
EcoCute Hot Water Supply Structure: CO2 Retrigerant
Heat Pump Hot Water Heater
CO2 Reduction Effect of Heat Pump
International Exchanges
In Japan, the energy demand for water heating constitutes about 30% of the total energy demand in the household sector, and so energy-saving and CO2 reduction measures in this area are very effective. Electric power companies have been working hard to develop and promote electric appliances and systems to reduce CO2 emissions. One example is EcoCute, a water heating system with a heat pump that uses CO2 as refrigerant.
EcoCute heats water by transferring the thermal energy in air, which is freely available, to water by means of refrigerant. With a single unit of electric energy for heat pump operation and two units of thermal energy from air, it produces three units of thermal energy.
Thanks to this principle, CO2 emissions are cut by about 50% compared with conventional combustion type water heaters. Because of this advantage, the government and industry are jointly promoting the use of heat pump
systems as a key means of preventing global warming in the consumer sector (household and commercial sectors). When heat pump systems fully penetrate the consumer and industrial sectors, the resulting CO2 emissions reduction will amount to about 12% of the present annual CO2 emissions in Japan, which is about 1.2 billion tons-CO2.
Demand-side Efforts for CO2 Reduction
Electric Vehicle(Mitsubishi Motors Corporation, i MiEV)
Fast Battery Charger
EcoCute Heat Pump Unit (left) and Hot Water Storage Tank
16 17
Principal Thermal Power Plants (1,000MW or greater)
Installed Capacity (MW) CompanyName of Plant Fuel
HokkaidoTohokuTohokuTohokuTohokuTokyoTokyoTokyoTokyoTokyoTokyoTokyoTokyoTokyoTokyoTokyoTokyoTokyoTokyoTokyo ChubuChubuChubuChubuChubuChubuChubuChubuChubuHokurikuHokurikuHokurikuKansaiKansaiKansaiKansai
KansaiKansaiKansaiKansaiKansaiKansaiChugokuChugokuChugokuChugokuShikokuShikokuKyushuKyushuKyushuKyushuKyushuEPDCEPDCEPDCEPDCEPDC
Tomato-atsumaHigashi NiigataHaramachiAkitaNoshiroFuttsuKashimaHironoSodegauraAnegasakiYokohamaChibaYokosukaHigashi OgishimaGoiKawasakiMinami YokohamaShinagawaOhiHitachinakaKawagoeHekinanChitaShin NagoyaAtsumiChita DainiYokkaichiNishi NagoyaTaketoyoToyama ShinkoNanaootaTsurugaKainanSakaikoGoboNanko
MaizuruHimeji DainiHimeji DaiichiTanagawa DainiAkoAioiYanaiTamashimaMisumiShin OnodaSakaideAnanShin OitaShin KokuraReihokuBuzenSendaiTachibanawanMatsuuraTakeharaIsogo Shin Matsushima
CoalLNG, other GasCoalCrude, Fuel OilCoalLNGCrude, Fuel OilCrude, Fuel Oil, CoalLNGCrude, Fuel Oil, LNG, LPG, NGLCrude, Fuel Oil, LNG, NGLLNGCrude, Fuel Oil, other Gas, Diesel OilLNGLNGLNGLNGLNGCrudeCoalLNGCoalCrude, Fuel Oil, LNGLNGCrude, Fuel OilLNGLNGCrude, Fuel Oil, NaphthaCrude, Fuel OilCrude, Fuel Oil, CoalCoalCoalCrude, Fuel OilLNGCrude, Fuel OilLNG
CoalLNGLNGCrude, Fuel OilCrude, Fuel OilCrude, Fuel OilLNGCrude, Fuel OilCoalCoalCrude, Fuel Oil, other GasCrude, Fuel OilLNGLNGCoalCrude, Fuel OilCrude, Fuel OilCoalCoalCoalCoalCoal
As of March 31, 2011
(Continued)
123456789101112131415161718192021222324252627282930313233343536
404142
373839
43444546474849505152535455565758
Installed Capacity (MW) CompanyName of Plant Fuel
1,6504,8102,0001,3001,2005,0404,4003,8003,6003,6003,3252,8802,2742,0001,8861,5001,1501,1401,0501,0004,8024,1003,9663,0581,9001,7081,2451,1901,1251,5001,2001,2002,1002,0001,8001,800
1,8001,6501,4421,2001,2001,1251,4001,2001,0001,0001,4461,2452,2951,8001,4001,0001,0002,1002,0001,3001,2001,000
Note:EPDC=Electric Power Development Co., Ltd.
1
2
3
4 5 67
9
8
10
1213
1415
16
17
18
19
2120
22
23
24
25
2627
28
30
313229
33
34
3536
37
4538
40
41
42
43
1
2
4
5
3
7
910
8
13
1416
6
151218
11
19
17 57
23
25
28 24
31
21
22
20
26
2927
30
3237
33
33
34
35
36
39
40
4142
1
3
4
2
56
7
8
910
11
12
13
14
15
16
17
43
44
45
4647
4854
50
49
52
53
51
56
55
58
44
=Hydroelectric Power Plant (150MW or greater)
=Thermal Power Plant (1,000MW or greater)
=Nuclear Power Plant
12311235612341234567345121231234123412123123412
12
PWRPWRPWRBWRBWRBWRBWRBWRBWRBWRBWRBWRBWRBWRBWRBWRBWRBWRABWRABWRBWRBWRABWRBWRABWRPWRPWRPWRPWRPWRPWRPWRPWRPWRPWRPWRBWRBWRPWRPWRPWRPWRPWRPWRPWRPWRPWRBWRBWRPWR
5795799121,1005248258257841,1001,1001,1001,1001,1001,1001,1001,1001,1001,1001,3561,3561,1001,1371,3805401,2063405008268268268708701,1751,1751,1801,1804608205665668905595591,1801,1808908901,1003571,160
1989.61991.42009.122005.121984.61995.72002.11978.41979.101982.41984.21985.61987.81985.91990.91993.81994.81990.41996.111997.71987.81993.92005.11993.72006.31970.111972.71976.121974.111975.111985.11985.61979.31979.121991.121993.21974.31989.21977.91982.31994.121975.101981.31994.31997.71984.71985.111978.111970.31987.2
Tomari
Higashi-DoriOnagawa
FukushimaDaiichiFukushima Daini
Kashiwazaki Kariwa
Hamaoka
Shika
Mihama
Takahama
Ohi
Shimane
Ikata
Genkai
Sendai
Tokai DainiTsuruga
Type of Reactor
Installed Capacity (MW) Start
Hokkaido
TohokuTohoku
Tokyo
Tokyo
Tokyo
Chubu
Hokuriku
Kansai
Kansai
Kansai
Chugoku
Shikoku
Kyushu
Kyushu
Japan Atomic Power Co.Japan Atomic Power Co.
Company
(Estimated start)
13
ABWRABWRABWR
1,3851,3731,383
2017.32011.122014.11
Higashi-DoriShimaneOhma
TokyoChugokuEPDC
ATR(Prototype)FBR(Prototype)
165280
FugenMonju
Japan Atomic Energy AgencyJapan Atomic Energy Agency
123412
(Estimated start)
2 2 6 1 2 3 3 4
BWRABWRABWRABWRABWRABWRAPWRAPWRAPWR
8251,3851,3851,4001,3731,3731,5901,5381,538
FY2020FY2020~FY2019~FY2019~FY2015FY2020FY20192016.32017.3
Namie-OdakaHigashi-DoriHigashi-DoriHamaokaKaminoseki
SendaiTsuruga
TohokuTohokuTokyoChubuChugoku
KyushuJapan Atomic Power Co.
Total 9 Units 12,407MW
Total 50 Units 46,148MW
Total 7 Units 4,358MW
1
23
4
5
6
7
8
9
10
11
12
13
14
15
1617
Unit Number
Name of Plant
Note: PWR=Pressurized Water Reactor, BWR=Boiling Water Reactor, APWR=Advanced Pressurized Water Reactor, ABWR=Advanced Boiling Water Reactor, GCR=Gas Cooled Reactor, ATR=Advanced Thermal Reactor, FBR=Fast Breeder Reactor
NiikappuTakamiDaini NumazawaShin TakasegawaTamaharaImaichiShiobaraKazunogawaAzumiKannagawaMidonoYagisawaShinanogawaOkuminoOkuyahagi DainiTakane DaiichiOkuyahagi DaiichiMazegawa DaiichiArimine DaiichiOkutataragiOkawachiOkuyoshinoKisenyamaKurobegawa DaiyonMatanogawaNabaraShin NariwagawaHongawaOmarugawaTenzanOhiraHitotsuseShin ToyoneShimogoOkukiyotsuNumapparaOkukiyotsu DainiOkutadamiTagokuraSakumaIkeharaTedorigawa DaiichiNaganoMiboroOtori
2002004601,2801,2001,0509008006234702452401771,5007803403152882651,9321,2801,2064663351,2006203036159006005001801,1251,0001,000675600560395350350250220215182
HokkaidoHokkaidoTohokuTokyoTokyoTokyoTokyoTokyoTokyoTokyoTokyoTokyoTokyoChubuChubuChubuChubuChubuHokurikuKansaiKansaiKansaiKansaiKansaiChugokuChugokuChugokuShikokuKyushuKyushuKyushuKyushuEPDCEPDCEPDCEPDCEPDCEPDCEPDCEPDCEPDCEPDCEPDCEPDCEPDC
Type
Pumped StoragePumped StoragePumped StoragePumped StoragePumped StoragePumped StoragePumped StoragePumped StoragePumped StoragePumped StoragePumped StoragePumped Storage Pumped StoragePumped StoragePumped StoragePumped StoragePumped Storage
Pumped StoragePumped StoragePumped StoragePumped Storage
Pumped StoragePumped StoragePumped StoragePumped StoragePumped StoragePumped StoragePumped Storage
Pumped StoragePumped StoragePumped StoragePumped StoragePumped Storage
Pumped Storage
Pumped Storage
12345678910111213141516171819202122232425262728293031
CompanyName of Plant
Principal Hydroelectric Power Plants (150MW or greater)As of March 31, 2011As of May 31, 2011
Installed Capacity (MW)
3233343536373839404142434445
Total 3 Units 4,141MW
460784784784540840166
2011.52011.52011.52011.52009.12009.11998.3
Tokyo
Chubu
Japan Atomic Power Co.
BWRBWRBWRBWRBWRBWRGCR
FukushimaDaiichi
Hamaoka
Tokai
11
In Operation
Under Construction
End of Operation
Others
Preparing for Construction
Nuclear Power Plants
39
(*)(*)
(*)(*)
(*) In May, 2011, Tokyo Electric Power Company decided to decommission Units 1 to 4 and to abolish plans to build Unit 7 and 8 at Fukushima Daiichi Nuclear Power Station which was severely damaged due to the Tohoku-Paci�c Ocean Earthquake and the tsunami that followed after on March 11, 2011.
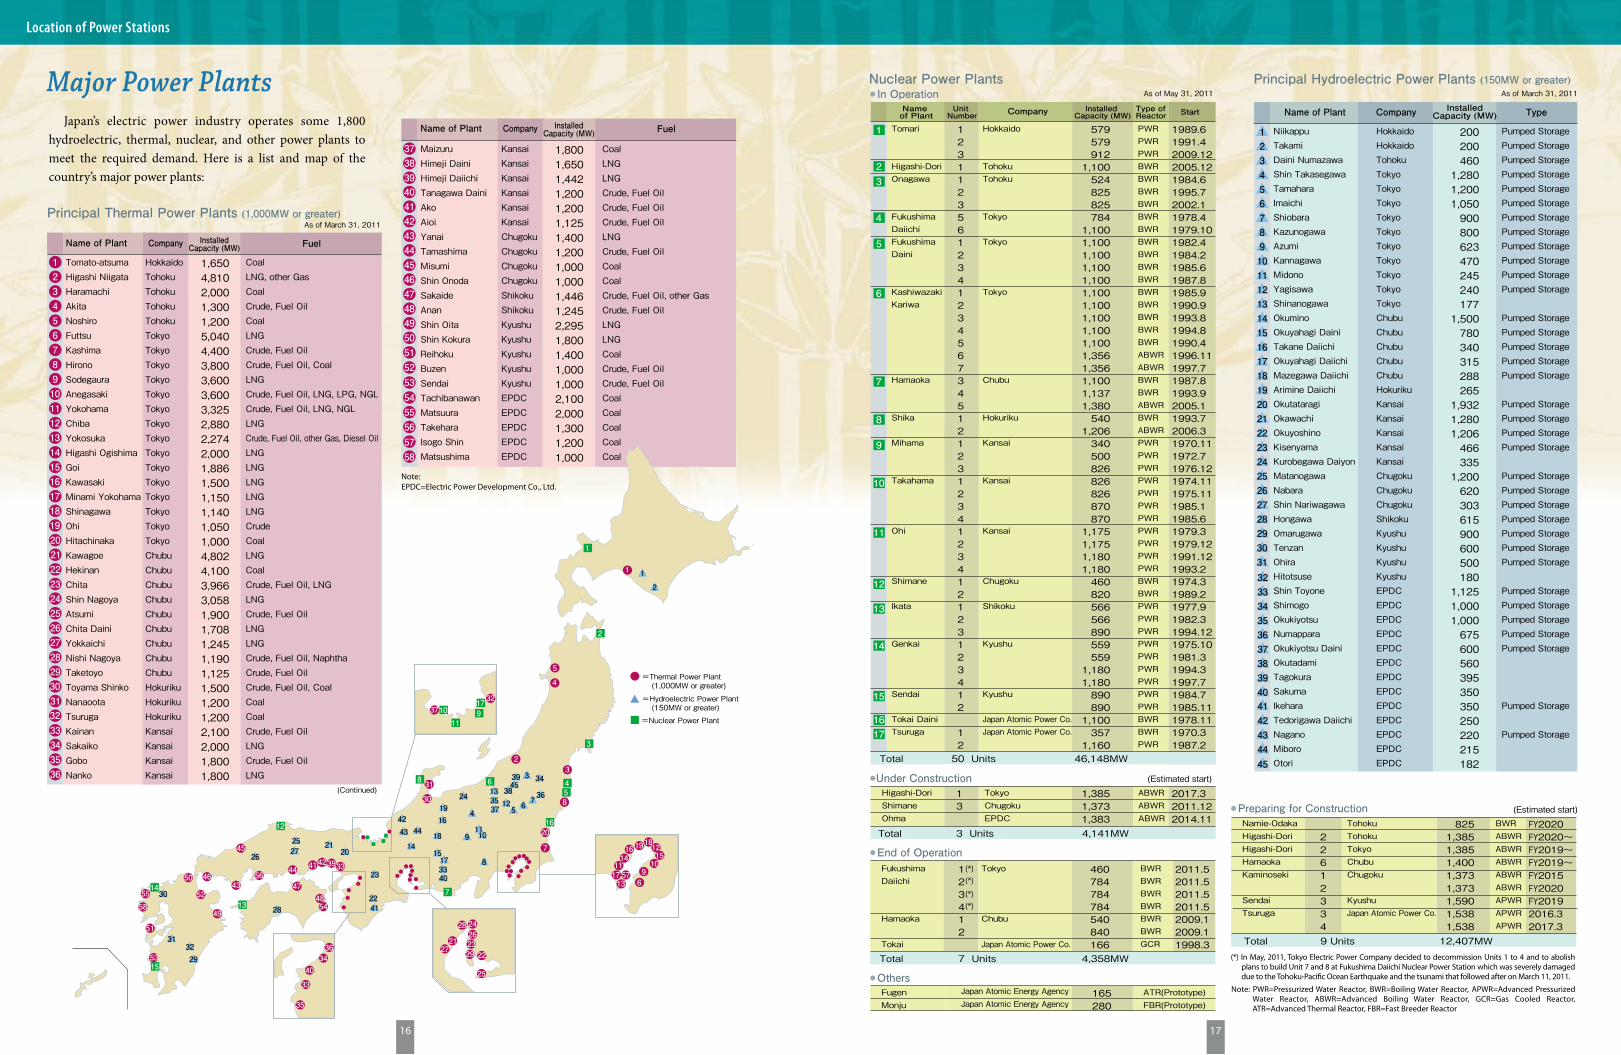
Japan’s electric power industry operates some 1,800 hydroelectric, thermal, nuclear, and other power plants to meet the required demand. Here is a list and map of the country’s major power plants:
Major Power Plants
Location of Power Stations
18
Organization of FEPC
Board of Directors
Chairman
Vice Chairman
Secretary General
Washington O�ce
General A�airs
General Planning
Public Relations
Business
Siting & Environment
Nuclear Power
Power System Planning and Operations
Engineering
Information Systems and Telecommunications
Research & Development
New Organization Preparatory O�ce for Reactor Safety
Senior ManagingDirector
Nuclear Fuel Cycle Promotion Headquarters
FukushimaSupport Headquarters
Geological RepositoryPromotion Headquarters
The Federation of Electric Power Companies
FEPC
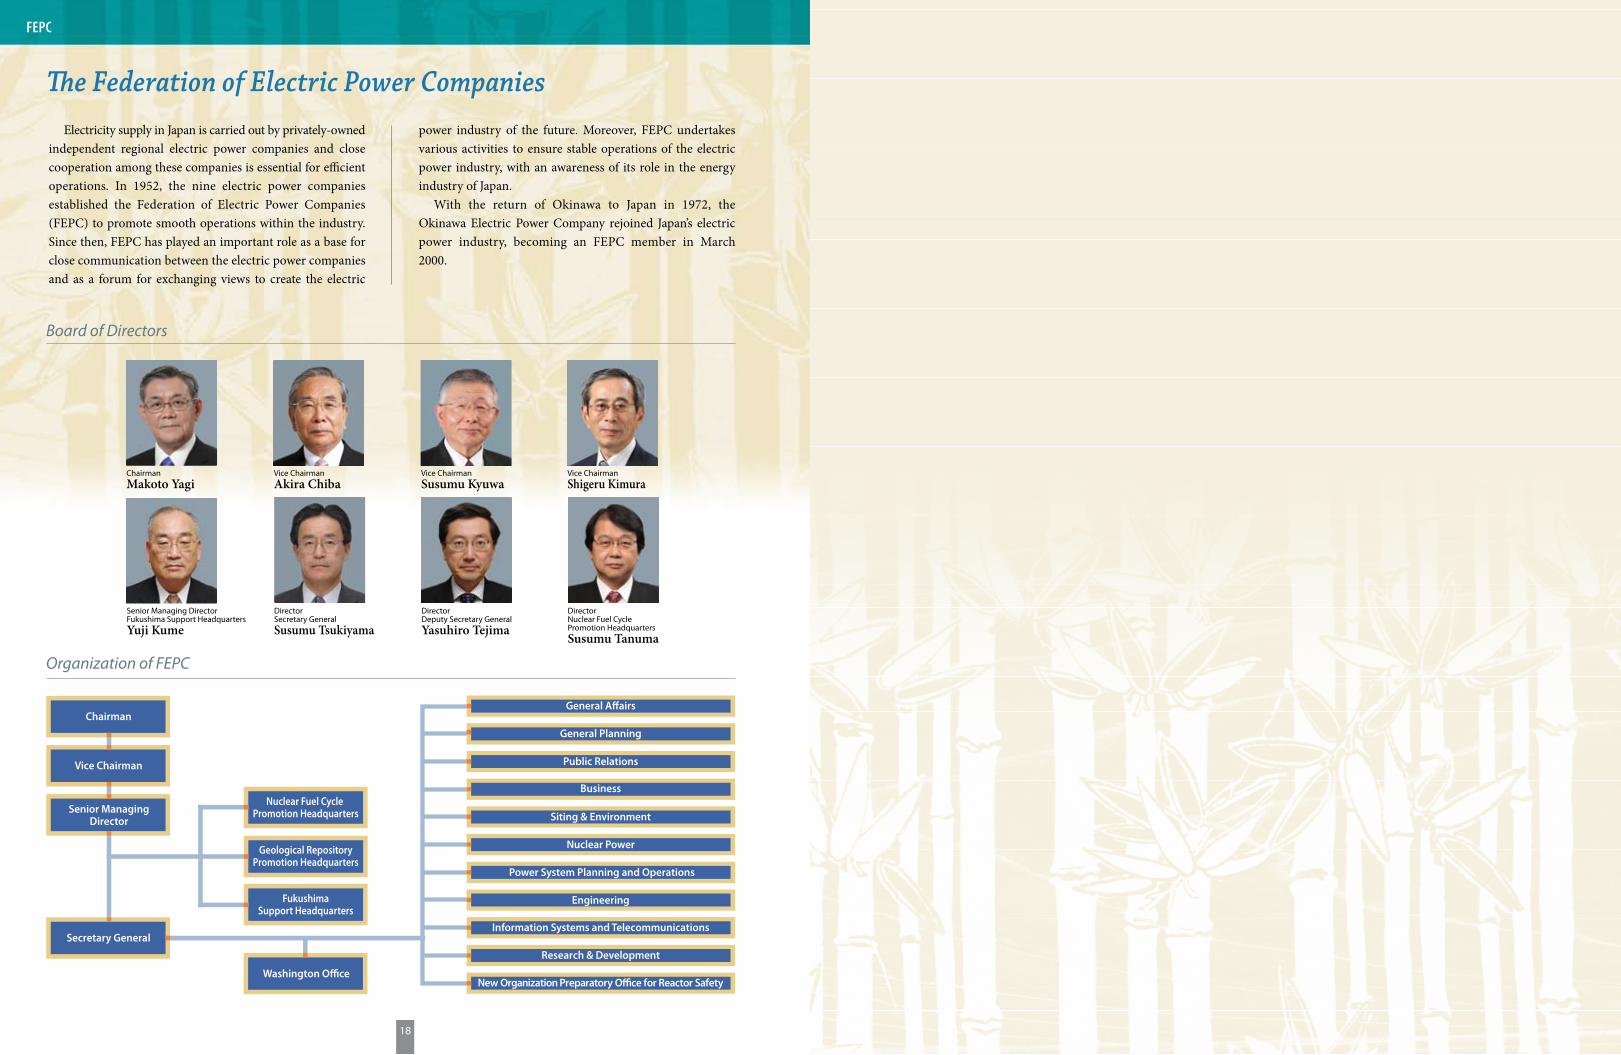
Electricity supply in Japan is carried out by privately-owned independent regional electric power companies and close cooperation among these companies is essential for efficient operations. In 1952, the nine electric power companies established the Federation of Electric Power Companies (FEPC) to promote smooth operations within the industry. Since then, FEPC has played an important role as a base for close communication between the electric power companies and as a forum for exchanging views to create the electric
power industry of the future. Moreover, FEPC undertakes various activities to ensure stable operations of the electric power industry, with an awareness of its role in the energy industry of Japan.
With the return of Okinawa to Japan in 1972, the Okinawa Electric Power Company rejoined Japan’s electric power industry, becoming an FEPC member in March 2000.
Electricity was �rst used in Japan on March 25, 1878 at the Institute of Technology in Toranomon, Tokyo when an arc lamp was switched on in commemoration of the opening of the Central Telegraph O�ce. In those days, electricity was still unfamiliar and uncommon not only in Japan but also in Europe and the United States. In 1886, Tokyo Electric Lighting, a private company, commenced operations as the nation’s �rst electric power company, and began supplying electricity to the public in the following year.
In the early days, use of electricity grew primarily for lighting because of its safety and cleanness, and gradually found broader applications as a power source to replace the steam engine. By 1896, the number of electric utilities established throughout the nation reached a total of 33. �e early 20th century marked the establishment of long-distance transmission technology. As larger thermal and hydro power plants were introduced, generation costs fell and electricity came into wider use throughout the country. Consequently, electricity became an indispensable energy source for peoples’ lives and industry.
In the years that followed, the electricity utility business grew in tandem with the modernization of Japan and development of its industry. At the same time, the electric utility industry experienced a major restructuring that led to the dissolution of 700 electric utilities, which merged to create �ve major electric utilities a�er the First World War. During the Second World War, the electric utility industry was completely state-controlled and utilities were integrated into Nihon Hatsusoden Co. (a nationwide power generating and
transmitting state-owned company) and nine distribution companies.
A�er the end of World War II in 1945, supply and demand for electricity remained very tight in Japan. A series of intense discussions were held on restructuring the electric utility industry as one of the measures for democratizing the economy. As a result, nine regional privately owned and managed General Electricity Utilities— Hokkaido, Tohoku, Tokyo, Chubu, Hokuriku, Kansai, Chugoku, Shikoku and Kyushu Electric Power Companies — were established in 1951 and assumed the responsibility of supplying electricity to each region. �is fundamental structure remains to this day, and with the return of Okinawa to Japan in 1972, Okinawa Electric Power Co. joined as a tenth member.
At the end of the 20th century, a trend toward deregulation and competition took hold throughout society, and the electric utility industry started to be liberalized. In December 1995, organizations such as the independent power producers (IPP) were allowed to provide electricity wholesale services and in March 2000, electricity retail supply for extra-high voltage users (demand exceeding 2MW) was liberalized. �e scope of retail liberalization was then expanded in April 2004 to users of more than 500kW, and subsequently in April 2005 to users of more than 50kW. �us, a Japanese model of liberalization based on fair competition and transparency while maintaining the vertical integration of generation, transmission and distribution to ensure a stable supply of electricity, was established.
History of Japan’s Electric Utility Industry
Vice ChairmanAkira Chiba
Senior Managing DirectorFukushima Support HeadquartersYuji Kume
Vice ChairmanSusumu Kyuwa
Director Secretary GeneralSusumu Tsukiyama
Vice ChairmanShigeru Kimura
Director Nuclear Fuel CyclePromotion HeadquartersSusumu Tanuma
ChairmanMakoto Yagi
Director Deputy Secretary GeneralYasuhiro Tejima
19
D a t aD a t a
c o n t e n t sCompany Data
Changes in Electric Power Generation
Power Generation Composition by Source in Major Countries
Changes in Electricity Sales for Ten Companies
Changes in Electricity Sales for Ten Companies(to large industrial and commercial customers)
Investment by Type of Power Facility for Ten Companies
Changes in Electricity Sales* / Consumption** for Major Countries
SOx and NOx Emissions per Unit of Electricity Generated by Thermal Power in Each Country
Country Comparison of Thermal E�ciency, Transmission and Distribution Loss, and Annual Load Factor
Comparison of CO2 Emissions Intensity by Country
20
20
20
21
21
21
22
22
23
23

20 21
OthersHydroNuclearnatural GasOilCoal
Power Generation Composition by Source in Major Countries (2010)
Sources: Energy Balances of OECD Countries 2012 Edition, Energy Balances of Non-OECD Countries 2012 Edition
Coal Oil Natural Gas Nuclear Hydroelectric Others
Sweden
Italy
U.K.
Brazil
France
Germany
Canada
India
Russia
Japan
China
U.S.A.
OECDTotal
6.02
17.0
4.4319.2723.381.10
45.80
17.11 9.6351.127.2714.87
7.40 3.0525.9527.428.7727.41
57.823.04
14.918.541.22
14.47
11.9 2.3
3.17
2.712.32.868.0
3.28 14.8422.6013.961.34
43.98
16.116.450.20.9
16.0
0.3 2.0 1.7 1.4
0.4
77.6
Korea0.74 0.61
1.83 1.19 1.94
10.9975.94
44.7138.94 11.39
4.211.03
4.66
1.29 0.95
2.8 6.67.1 78.23.12.2
16.44 6.2446.3028.78
29.923.81 20.7744.14
0.00
12.45 5.6721.0823.442.8534.52
(%)
Company Data (Fiscal year ending March 31, 2011)
Company Capital Stock(Million yen)
Hokkaido
Tohoku
Tokyo
Chubu
Hokuriku
Kansai
Chugoku
Shikoku
Kyushu
Okinawa
Total
114,291
251,441
900,975
430,777
117,641
489,320
185,527
145,551
237,304
7,586
2,880,413
Total Assets(Million yen)
Generating Capacity
(MW)
1,576,200
3,700,844
14,255,958
5,033,619
1,351,703
6,457,593
2,635,191
1,316,794
3,890,891
368,596
40,587,389
7,419
17,206
64,988
32,828
8,057
34,877
11,986
6,963
20,330
1,919
206,575
36,265
90,290
316,646
142,339
32,748
164,592
68,307
32,468
95,439
8,504
987,597
545,592
1,540,663
5,064,625
2,136,246
480,994
2,419,890
999,596
520,954
1,356,317
150,704
15,215,581
32,302
82,706
293,386
130,911
29,543
151,078
62,395
29,100
87,474
7,521
906,417
3,972
7,405
28,713
10,463
2,088
13,479
5,199
2,841
8,477
842
83,479
5,553
12,769
38,561
16,894
4,793
22,394
9,896
5,985
12,678
1,567
131,090
ElectricitySupplied
(GWh)
Revenues fromElectricity Sales
(Million yen)
ElectricitySales(GWh)
Number ofCustomers(Thousands)
Number ofEmployees
Changes in Electric Power Generation
Fiscal Year
Ten Companies Hydro
Thermal
Geothermal
Nuclear
Subtotal
Industry-Owned and Others
Total
61.0
295.2
1.2
148.0
505.5
166.4
672.0
65.4
392.0
1.4
181.1
639.9
217.4
857.3
1985 1990
57.7
456.6
2.6
266.1
783.0
329.6
1,112.6
2009
56.5
506.1
2.5
247.1
812.2
334.1
1,146.3
2008
62.9
485.4
2.4
271.3
822.0
334.9
1,156.9
2010
57.2
538.3
2.7
249.5
847.7
345.0
1,192.8
2007
60.0
459.3
2.9
287.0
809.2
348.7
1,157.9
2005
66.5
426.4
3.0
302.5
798.4
293.1
1,091.5
2000
62.3
401.1
2.8
271.4
737.6
252.3
989.9
1995
(TWh)
Changes in Electricity Sales for Ten Companies
Fiscal Year
Residential (Lighting)
Commercial and Industrial
Commercial
Small Industrial
Large Industrial
Others
Eligible Customers’ Use
Total
177.4
481.5
116.3
100.1
248.1
17.0
—
658.9
1990
289.7
629.8
—
—
—
12.7
580.1
919.5
2007
285.0
573.5
—
—
—
12.0
528.4
858.5
2009
304.2
602.2
—
—
—
12.0
554.7
906.4
2010
285.3
603.7
—
—
—
12.1
556.9
888.9
2008
281.3
601.3
—
—
—
13.4
548.4
882.6
2005
254.6
583.3
157.9
115.8
74.8
15.0
219.8
837.9
2000
224.6
532.4
152.8
108.0
254.7
16.9
—
757.0
1995
(TWh)
Changes in Electricity Sales for Ten Companies (to large industrial and commercial customers)
Fiscal Year
Mining
Foodstu�s
Textiles
Pulp and Paper
Chemicals
Oil and Coal Products
Rubber
Clay and Stone
Iron and Steel
Non-ferrous Metals
Machinery
Others
Subtotal
Railways
Others
Total
1.5
11.3
6.8
11.9
27.4
2.4
3.5
15.0
41.3
12.3
57.3
22.1
212.7
16.4
19.0
248.1
1990
0.8
17.2
4.0
9.4
26.1
1.8
2.8
10.3
29.7
14.7
69.0
27.4
213.1
18.1
29.6
260.9
2009
0.9
17.7
4.5
9.9
27.9
2.1
3.1
11.5
36.3
16.0
74.0
29.0
232.9
18.1
29.4
280.4
2010
0.9
17.3
2.8
10.6
29.4
1.9
3.1
11.4
35.4
15.7
75.7
28.7
232.9
18.7
30.0
281.6
2008
0.9
17.2
3.2
11.0
31.3
1.7
3.3
12.1
39.6
16.8
82.6
30.5
250.3
18.7
30.3
299.3
2007
1.0
15.4
3.1
10.3
27.7
1.5
3.4
11.0
36.2
14.1
74.0
27.6
225.2
19.0
29.6
273.8
2005
1.3
15.3
3.9
10.5
25.9
1.5
3.5
11.9
36.5
14.2
69.8
27.0
221.2
18.1
27.7
267.0
2000
1.4
13.2
5.1
9.5
25.4
2.6
3.4
14.4
38.3
13.1
62.9
24.4
213.8
17.9
23.0
254.7
1995
(TWh)
Mining andIndustry
Source: Handbook of Electric Power Industry
Source: Handbook of Electric Power Industry
Source: Handbook of Electric Power Industry
Source: Handbook of Electric Power Industry
Investment by Type of Power Facility for Ten Companies
Fiscal Year
(Billion yen)
Note: Figures rounded down to nearest digitSource: Handbook of Electric Power Industry
Generation
Distribution,others
Total
695
1,074
1,770
2003
516
996
1,512
2004
449
1,048
1,497
2005
499
1,029
1,529
2006
654
1,199
1,854
2007
816
1,308
2,124
2008
771
1,262
2,034
2009
887
1,235
2,123
2010
Data Data

22 23
0.0
0.2
0.4
0.6
0.8
1.0
Comparison of CO2 Emissions Intensity by Country (2010)
Italy U.S.A.Canada GermanyFrance U.K.Japan
CO2
Emis
sion
s In
tens
ity (k
g-CO
2/kW
h)N
on-fo
ssil
pow
er s
ourc
eRa
tio o
f ene
rgy
gene
rate
d (%
)
Sources: Energy Balances of OECD Countries 2012 Edition, Energy Balances of Non-OECD Countries 2012 Edition
0.39 0.430.470.45
China
0.80
India
76
11
3
15
58
2610
2317 20
6
4
217
1
0 312
315
Nuclear Power
Hydroelectric Power
New Energy, Waste
0.09
0
20
40
60
80
100
1616
0.52
0.97
3
7
3
0.17
SOx and NOx Emissions per Unit of Electricity Generated by Thermal Power in Each Country
(g/kWh)
Japan(*)
(2010)U.S.A.(2005)
Canada(2005)
Germany(2005)
France(2005)
U.K.(2005)
Italy(2005)
0.20.2
1.21.4
3.1 3.2
0.7
Note: (*) = 10 Electric Power Companies + Electric Power Development CompanySources: Estimate based on “OECD Environmental Data Compendium 2006/2007” and IEA "Energy Balances of OECD Countries 2008 Edition” FEPC (for Japan)
Sulfur Oxides (SOx)
Nitrogen Oxides (NOx)
0
1
2
3
4
0.6
1.4
0.8
3.3
0.8
1.6
3.4
2
U.S.A.
(*)All electric utilities
U.K.
(*)All electric utilities
Germany
(**)Electricity consumption
Canada
(*)All electric utilities
France
(**)Electricity consumption
Italy
(*)All electric utilities
Japan
(*)Ten companies
(TWh)
Residential
Commercial and Industrial
Others
Total
Residential
Commercial and Industrial***
Others
Total
Residential
Commercial and Industrial
Others
Total
Residential
Commercial and Industrial
Others
Total
High voltage
Low voltage
Total
Residential
Commercial and Industrial
Others
Total
Residential
Commercial and Industrial
Others
Total
Changes in Electricity Sales* / Consumption** for Major Countries
1,359.2
2,294.2
7.5
3,661.0
116.8
198.4
13.7
328.9
141.3
323.8
69.1
534.2
151.0
188.5
148.2
487.7
265.8
185.7
451.5
66.9
210.1
11.5
288.5
281.3
601.3
—
882.6
2005
1,380.0
2,345.3
7.7
3,733.0
125.8
191.9
14.2
331.9
139.5
331.5
71.2
542.2
161.2
174.6
165.5
501.3
263.0
198.0
461.0
68.4
218.3
11.9
298.7
285.3
603.7
—
888.9
2008
1,364.5
2,224.6
7.8
3,596.9
122.5
177.8
13.5
313.8
139.2
208.9
143.0
491.1
160.2
141.0
152.9
454.1
250.8
202.3
453.1
68.7
201.7
11.9
282.4
285.0
573.6
—
858.5
2009
1,392.2
2,364.1
8.2
3,764.6
122.8
194.6
13.5
331.2
140.2
330.6
70.4
541.2
158.6
180.5
158.0
497.0
261.3
187.0
448.3
67.2
219.5
11.6
298.3
289.7
629.8
—
919.5
2007
1,292.0
2,248.3
7.2
3,547.5
115.5
194.6
13.5
323.6
140.4
322.5
69.0
531.9
151.0
179.8
147.6
478.4
266.4
182.3
448.7
66.6
205.7
11.1
283.4
272.5
592.9
—
865.4
2004
1,275.8
2,211.1
6.8
3,493.7
115.8
195.0
13.6
324.3
139.1
317.7
68.2
525.0
147.6
183.7
145.2
476.5
261.9
175.1
437.0
65.0
202.8
10.9
278.7
259.7
574.7
—
834.3
2003
(***) Including public facilitiesSource: Overseas Electric Power Industry Statistics (2011)
1,351.5
2,311.0
7.4
3,669.9
116.4
198.1
13.8
328.3
141.5
328.6
69.5
539.6
148.6
183.3
145.6
477.5
258.1
188.9
447.0
67.6
217.9
11.9
297.4
278.3
611.1
—
889.4
2006
Country Comparison of Thermal E�ciency, Transmission and Distribution Loss, and Annual Load Factor
Source: Overseas Electric Power Industry Statistics (2011)
U.S.A.
U.K.
Germany(Former W. Germany)
Canada
France
Italy
JapanTen Companies(Nine Companies)
1985 1990 1995
(%)
Thermal E�ciency
Transmission and Distribution Loss
Annual Load Factor
Thermal E�ciency
Transmission and Distribution Loss
Annual Load Factor
Thermal E�ciency
Transmission and Distribution Loss
Annual Load Factor
Thermal E�ciency
Transmission and Distribution Loss
Annual Load Factor
Thermal E�ciency
Transmission and Distribution Loss
Annual Load Factor
Thermal E�ciency
Transmission and Distribution Loss
Annual Load Factor
Thermal E�ciency
Transmission and Distribution Loss
Annual Load Factor
32.7
6.1
62.0
32.9
8.7
57.8
(39.3)
(4.8)
(63.2)
32.0
9.2
65.1
33.1
7.7
57.6
37.1
9.0
53.7
(38.2)
(5.8)
(60.4)
32.9
5.7
60.4
33.9
8.1
62.2
(39.8)
(4.3)
(68.6)
34.5
7.7
65.7
35.8
7.5
62.9
37.7
7.0
52.4
38.8
5.7
56.8
33.4
7.0
59.8
36.2
8.6
65.4
38.2
5.0
(71.9)
32.6
6.8
66.0
34.5
7.4
67.9
38.6
6.7
50.3
38.9
5.5
55.3
2009
N/A
5.8
63.3
36.4
7.8
64.2
41.0
5.4
72.5
32.2
9.1
N/A
N/A
6.9
60.1
44.3
6.4
N/A
41.8
5.2
66.7
2008
N/A
6.8
60.5
36.0
8.0
67.6
41.4
N/A
75.9
30.8
6.2
N/A
N/A
6.8
66.9
44.5
6.0
N/A
41.3
5.1
61.0
2005
34.2
6.8
58.7
35.5
8.7
66.1
41.6
5.7
77.0
33.4
5.9
69.2
N/A
6.6
64.1
42.7
6.2
58.4
40.9
5.1
62.4
2000
33.3
6.9
61.2
36.2
9.0
67.4
40.6
4.6
74.5
32.9
8.0
68.5
42.0
6.8
69.5
39.0
6.4
59.0
40.6
5.2
59.5
Data Data

24
The Federation of Electric Power Companies of Japan (FEPC)Keidanren-kaikan, 1-3-2, Otemachi, Chiyoda-ku, Tokyo 100-8118, JapanTel: (03) 5221-1440 URL http://www.fepc.or . jp
Hokkaido Electric Power Co., Inc.2, Higashi 1-chome, Odori, Chuo-ku, Sapporo, Hokkaido 060-8677, JapanTel: (011) 251-1111 URL http://www.hepco.co. jp
Tohoku Electric Power Co., Inc.1-7-1 Honcho, Aoba-ku, Sendai 980-8550, JapanTel: (022) 225-2111 URL http://www.tohoku-epco.co. jp
The Tokyo Electric Power Co., Inc.1-3, Uchisaiwai-cho 1-chome, Chiyoda-ku, Tokyo 100-8560, JapanTel: (03) 6373-1111 URL http://www.tepco.co. jp
Chubu Electric Power Co., Inc.1, Higashi-shincho, Higashi-ku, Nagoya 461-8680, JapanTel: (052) 951-8211 URL http://www.chuden.co. jp
Hokuriku Electric Power Co., Inc.15-1, Ushijima-cho, Toyama 930-8686, JapanTel: (076) 441-2511 URL http://www.rikuden.co. jp
The Kansai Electric Power Co., Inc.6-16, Nakanoshima 3-chome, Kita-ku, Osaka 530-8270, JapanTel: (06) 6441-8821 URL http://www.kepco.co. jp
The Chugoku Electric Power Co., Inc.4-33, Komachi, Naka-ku, Hiroshima 730-8701, JapanTel: (082) 241-0211 URL http://www.energia.co. jp
Shikoku Electric Power Co., Inc.2-5, Marunouchi, Takamatsu 760-8573, JapanTel: (087) 821-5061 URL http://www.yonden.co. jp
Kyushu Electric Power Co., Inc.1-82, Watanabe-dori 2-chome, Chuo-ku, Fukuoka 810-8720, JapanTel: (092) 761-3031 URL http://www.kyuden.co. jp
The Okinawa Electric Power Co., Inc.2-1, Makiminato 5-chome, Urasoe, Okinawa 901-2602, JapanTel: (098) 877-2341 URL http://www.okiden.co. jp
Electric Power Development Co., LTD. (EPDC)15-1, Ginza 6-chome, Chuo-ku, Tokyo 104-8165, JapanTel: (03) 3546-2211 URL http://www.jpower.co. jp
The Japan Atomic Power Company (JAPC)1-1,Kanda-Mitoshiro-cho, Chiyoda-ku, Tokyo 101-0053, Japan Tel: (03) 6371-7400 URL http://www.japc.co. jp
Japan Nuclear Fuel Limited (JNFL)4-108 Aza Okitsuke, Oaza Obuchi, Rokkasho-mura, Kamikita-gun, Aomori 039-3212, JapanTel: (0175) 71-2000 URL http://www.jn�.co. jp
Japan Atomic Energy Agency (JAEA)4-49, Muramatsu, Tokai-mura, Naka-gun, Ibaraki 319-1184, JapanTel: (029) 282-1122 URL http://www.jaea.go. jp
Central Research Institute of Electric Power Industry (CRIEPI)6-1, Ohtemachi 1-chome, Chiyoda-ku, Tokyo 100-8126, JapanTel: (03) 3201-6601 URL http://cr iepi .denken.or . jp/
Japan Electric Power Information Center, Inc. (JEPIC)15-33, Shibaura 4-chome, Minato-ku, Tokyo 108-0023, JapanTel: (03) 6361-8210 URL http://www.jepic.or . jp
World Association of Nuclear Operators Tokyo Centre (WANO-TC)11-1, Iwado-kita 2-chome, Komae, Tokyo 201-8511, JapanTel: (03) 3480-4809 URL http://www.wano.info
BusinessAddressesBusinessAddresses

The Federation of Electric Power Companies of Japan
ELECTRICIT Y REVIEW JAPANThe Federation of Electric Power Companies of Japan
Printed in Japan 2012.09
ELECTRICIT Y REVIEW JAPANThe Federation of Electric Power Companies of JapanKeidanren-kaikan, 1-3-2, Otemachi, Chiyoda-ku, Tokyo 100-8118, Japan http://www.fepc.or.jp/english/index.html
2012