20130721 第4回valuation勉強会
TRANSCRIPT

Valuation in FED
2013/7/21(Sun) 1

自己紹介
• 名前
• 所属
• 勉強会に参加したきっかけ
2
3
Contents
• Part1 Foundations of Value
• Part2 Core Valuation Techniques
• Part3 Intrinsic Value and the Stock Market
• Part4 Managing for Value
• Part5 Advanced Valuations Issues
• Part6 Special Situations

Review of previous studied contents
4

5
Contents
• Part1 Foundations of Value
• Part2 Core Valuation Techniques
• Part3 Intrinsic Value and the Stock Market
• Part4 Managing for Value
• Part5 Advanced Valuations Issues
• Part6 Special Situations

What is value In the context of valua3on and
in your life ?
6

What is Value?
• Value is defining dimension of measurement in a market economy.
• Value is a particularly helpful measure of performance because it takes into account the long-term interests of all the stakeholders in a company,not just shareholders.
• Competition among value-focused companies also helps to ensure that capital,human capital,and natural resources are used efficiency across the economy,leading to higher living standards for everyone.
7
(P3)

Fundamental principles of corporate finance
Companies create value by investing capital to generate future cash flow at rate of return that exceed their cost of capital. (P17)
8

Two core principles of value creation
• The combination of growth and return on invested capital(ROIC) relative to its cost is what drives value. – Companies can sustain strong growth and high returns
on invested capital only if they have a well-defined competitive advantage.
• Conservation of value – Anything that doesn't increase cash flow doesn't create
value. – M・M theory
9
(P4)

10
Growth and ROIC:Drives of Value
Return on investment capital
Revenue growth
Cash flow
Cost of of Capital
Value

11
Contents
• Part1 Foundations of Value
• Part2 Core Valuation Techniques
• Part3 Intrinsic Value and the Stock Market
• Part4 Managing for Value
• Part5 Advanced Valuations Issues
• Part6 Special Situations

12
Part2
6. Framework for Valuation 7. Reorganizing the Financial Statements 8. Analysand Performance and Competitive Position 9. Forecasting Performance 10. Estimating Continuing Value 11. Estimating the Cost of Capital 12. Moving from Enterprise Value to per Share 13. Calculating and Interpreting Results 14. Using Multiple

13
Framework for DCF-Based Valuation
EXHIBIT 6.1 Model Measure Discount factor Assessment
Enterprise discounted cash flow Free cash flow Weighted average
cost of capital Works best for projects, business units, and companies that manage their capital structure to a target level.
Discounted economic profit Economic profit Weighted average
cost of capital Explicity highlights when a company creates value.
Adjusted present value Free cash flow Unlevered cost of equity Highlights changing capital structure more
easily than WACC-based models.
Capital cash flow Capital cash flow Unlevered cost of equity
Compresses free cash flow correctly because capital structure is embedded within the cash flow.Best used when valuing financial institutions.
Equity cash flow Cash flow to equity Levered cost of
equity Difficult to implement correctly because capital structure is embedded within the cash flow. Best used when valuing financial institutions.
(P104)

14
Home Depot:Enterprise DCF
Forcaset year Free cash flow($ million)
Discount factor(@ 8.5%)
Present value of FCF
(& million)2009 5,909 0.922 5,448
2010 2,368 0.850 2,013
2011 1,921 0.784 1,506
2012 2,261 0.723 1,634
2013 2,854 0.666 1,9022014 3,074 0.614 1,889
2015 3,308 0.567 1,874
2016 3,544 0.522 1,852
2017 3,783 0.482 1,822
2018 4,022 0.444 1,787Continuing value 92,239 0.444 40,966Present value of cash flow 62,694
Midyear adjustment factor 1.041 Value of operations 65,291
Value of excess cash -Value of long-term investments 361Value of tax loss carry-forwards 112Enterprise value 65,764
Less:Value of debt (11,434)Less:Value of capitalized operating leases (8,298)Equity value 46,032
Number of shares outstanding(December 2008) 1.7 Equity value per share 27.1
Forecasting performance
Estimating Continuing Value

Ice Break again
15
16
Part2
6. Framework for Valuation 7. Reorganizing the Financial Statements 8. Analysand Performance and Competitive Position 9. Forecasting Performance 10. Estimating Continuing Value 11. Estimating the Cost of Capital 12. Moving from Enterprise Value to per Share 13. Calculating and Interpreting Results 14. Using Multiple

17
Part2
6. Framework for Valuation 7. Reorganizing the Financial Statements 8. Analysand Performance and Competitive Position 9. Forecasting Performance 10. Estimating Continuing Value 11. Estimating the Cost of Capital 12. Moving from Enterprise Value to per Share 13. Calculating and Interpreting Results 14. Using Multiple

18
Growth and ROIC:Drives of Value
Return on investment capital
Revenue growth
Cash flow
Cost of of Capital
Value
What is・・・
• Enterprise Value?
• Equity Value?
• Value per share?
19

Moving from Enterprise Value to per Share
• To determine enterprise value, add to the value of core operations the value of nonoperating assets, such as excess cash and nonconsolidated subsidiaries.
• To convert enterprise value to equity value, subtract short-term and long term debt, debt equivalent(such as unfunded pension liabilities), and hybrid securities(such as employee stock options).
• Finally, to estimate value per share, divide the resulting equity value by the most recent number of undiluted shares outstanding.
20

21
Enterprise valuation of a multibusiness company
Unit A Unit B Unit C Corporate center
Value of operations
Nonoperating assets
Enterprise Value
Value of debt
Equity Value
Exhibit6.3 P106
Value of operating units
200
30
560
125
200
225
520
40
360

When converting core operations to enterprise value
• Avoid double-counting
• Evaluate interdependencies between the value of core operations and the value of noncore operations assets.
22

Sample Comprehensive Valuation
23 P274 Exhibit12.1

Valuing non-operating assets
• Although not included in operations, nonoperating assets still represent value to the shareholder.
• We must estimate the market value of each non operating asset separately and add the resulting value to the DCF value of operations to arrive at enterprise value.
24
Asset debt
equity Nonoperating asset

Valuing non-operating assets
• Excess cash and marketable securities
• Nonconsolidated subsidiaries and equity investments – For equity stakes between 20% and 50%, the equity holding in
the subsidiary is reported in the parent B/S at the investment’s historical cost plus any reinvested income.
– For equity stakes below 20%, the equity holding are shown at historical cost on the parent’s B/S.
25
Asset debt
equity Nonoperating asset

Valuing non-operating assets
• Publicly traded subsidiaries – If the subsidiary is publicly listed, use the market value for the
company’s equity stake.
• Privately held subsidiaries – Simplified cash flow to equity valuation – Multiple valuation – Tracking portfolio
• If you know when the stake was aquired, you can approximate its current market value by applying the relative price change for a portfolio of comparable stocks over the same holding period.
26
Asset debt
equity Nonoperating asset
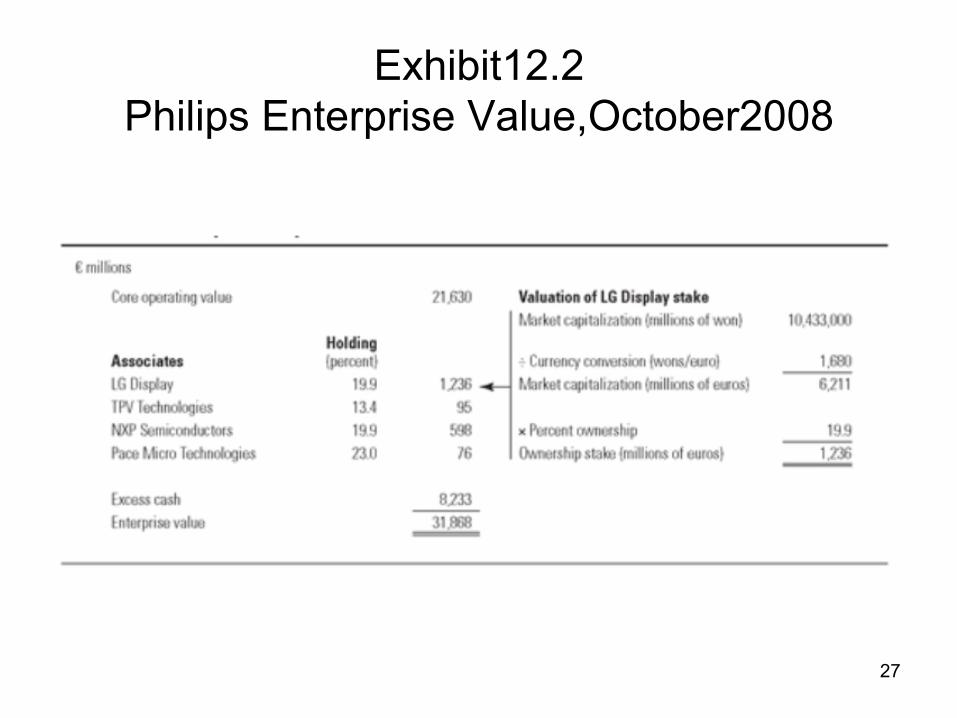
Exhibit12.2 Philips Enterprise Value,October2008
27

Valuing non-operating assets
• Loans to other companies • Finance subsidiaries • Discontinued operations • Excess real estate • Tax loss carry-forwards • Excess pension assets
28
Asset debt
equity Nonoperating asset
Valuing debt and debt equivalents
• Remember, deduct only those financial claims that are not incorporated as part of free cash flow.
• Be aware that not all financial claims have to be reported on the B/S, so make sure to search the footnotes carefully for undisclosed liabilities.
29

Valuing debt and debt equivalents
• Debt • Highly levered companies
– For distressed companies, the value of the debt requires will be at a significant discount to its book value and will fluctuate with value of the enterprise
• Operating leases • Securitized receivables • Unfunded pension and other postretirement
liabilities
30 Asset
Debt
equity
Debt and Debt
equivalents

Valuing debt and debt equivalents
• Provisions – Ongoing operating provisions – Long-term operating provisions – Nonoperating provisions – Income-smoothing provisions don’t represent actual
future cash outlays • Contingent liabilities
31
Asset
Debt
equity
Debt and Debt
equivalents

Valuation of equity using scenario analysis
32
P283 Exhibit12.5
Valuing hybrid securities and minority interests
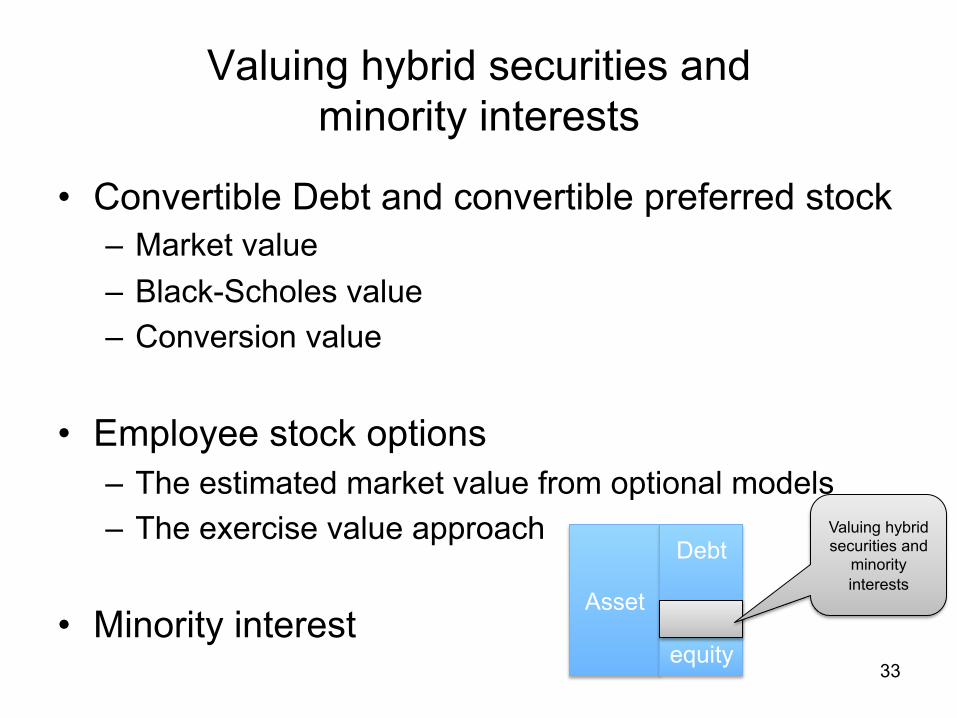
• Convertible Debt and convertible preferred stock – Market value – Black-Scholes value – Conversion value
• Employee stock options – The estimated market value from optional models – The exercise value approach
• Minority interest 33
Asset
Debt
equity
Valuing hybrid securities and
minority interests

34
Enterprise valuation of a multibusiness company
Unit A Unit B Unit C Corporate center
Value of operations
Nonoperating assets
Enterprise Value
Value of debt
Equity Value
Exhibit6.3 P106
Value of operating units
200
30
560
125
200
225
520
40
360

Estimating value per share
• Assuming that you have used an option-based valuation approach for convertible bonds and employee options, divide the total equity value by the number of undiluted shares outstanding.
35

36
Part2
6. Framework for Valuation 7. Reorganizing the Financial Statements 8. Analysand Performance and Competitive Position 9. Forecasting Performance 10. Estimating Continuing Value 11. Estimating the Cost of Capital 12. Moving from Enterprise Value to per Share 13. Calculating and Interpreting Results 14. Using Multiple

Calculating and Interpreting Results
• Even a carefully planned model can have mechanical errors or errors in economic logic. – Learn the ins and outs of your valuation by changing
each forecast input one at a time. – Use scenario analysis. – A major caveat
37
Is the model technically Robust?
• In the unadjusted financial statements, the balance sheet should balance every year, both historically and in forecast years.
• In the rearranged financial statements, check that the sum of invested capital plus nonoperating assets equals the cumulative sources of financing.
• Does the change in excess cash and debt line up with the cash flow statement?
38

Is the Model economically consistent?
• Are the patterns intended? • Are the patterns reasonable? • Are the patterns consistent with industry dynamics? • Is a steady state reached for the company’s economics by the end
of the explicit forecasting period?
39
(P298 Exhibit13.1)

Are the results plausible?
• Once the model is technically sound and economically consistent, test whether its valuation results are plausible. – Compare your results with the market value. – Perform a sound multiple analysis
• Chapter14 describes how to do a proper multiples analysis.
40

Sensitivity Analysis
• Assessing the impact of individual drivers • Analyzing trade-offs
– Raising prices leads to fewer purchases, lowering inventory results in more missed sales, and entering new markets often affects both growth and margin.
41
(P299 Exhibit13.2)

Valuations Isocurves by growth and margin
42
(P300 Exhibit13.3)

Creating scenarios
43
Broad economics conditions
Competitive structure of the
industry
Financing capabilities of the
company
Internal capabilities of the company
How critical are these forecasts to the result? Some industries are more dependent on basic economic conditions than others are.
A scenario that assumes substantial increases in market share is less likely in a highly competitive and concentrated market than in an industry with fragmented and inefficient competition.
Should the company raise equity if too much debt is projected?
Necessary to achieve the business results predicted in scenario

経営戦略全史
44
「この数十年間の経営戦略史をもっとも簡潔に語れば、『60年代に始まったポジショング派が80年代までは圧倒的で、それ以降はケイパビリティ派が優勢』となります。」 「『やってみなくちゃわからない、どんなポジションニングでどのケイパビリティで戦うべきなのか、ちゃちゃっと試行錯誤して決めよう』というやり方です。」
Five forces
45
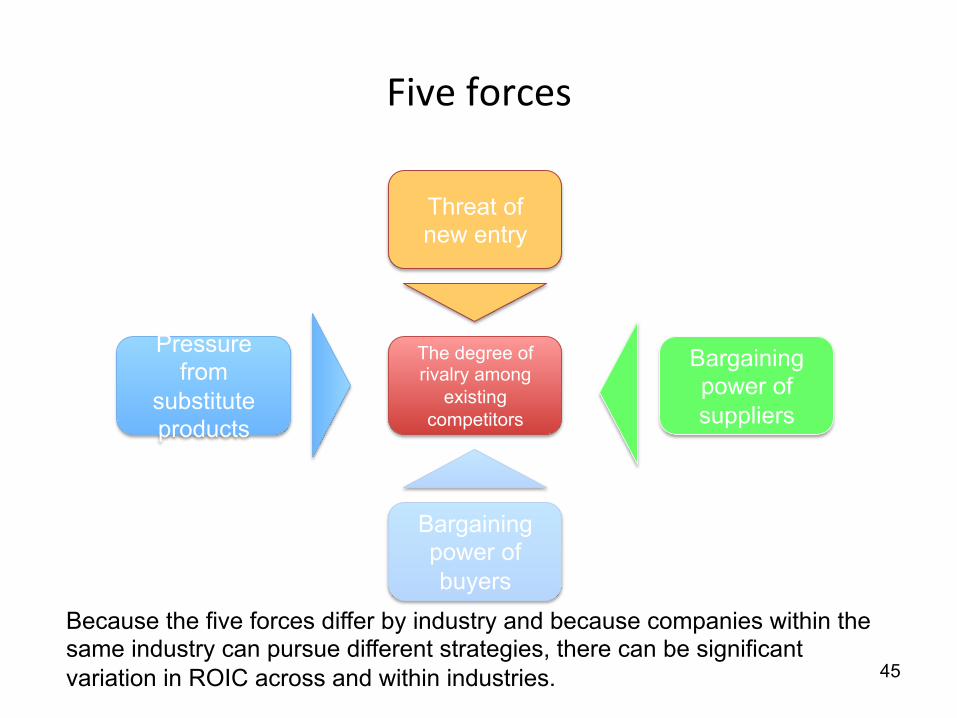
Threat of new entry
Bargaining power of suppliers
The degree of rivalry among
existing competitors
Pressure from
substitute products
Bargaining power of buyers
Because the five forces differ by industry and because companies within the same industry can pursue different strategies, there can be significant variation in ROIC across and within industries.

Can companies keep their compe33ve advantages over 3me?
46
The image of traditional sustainable competitive advantage
The image of a succession of temporal competitive advantage
入山章栄(2012)『世界の経営学者はいま何を考えているのか』英治出版 P71

Whether are the markets your company belongs to competitive or not ?
How is your company’s positioning?
47

Key value drivers by scenario
48
Scenario1:If the new product is a top seller, revenue growth will more than than double over the next few years. Scenario2:If the product launch fails, however growth will continue to erode as the company’s current products become obsolete.

Example of a Scenario Approach to DCF Valuation
49
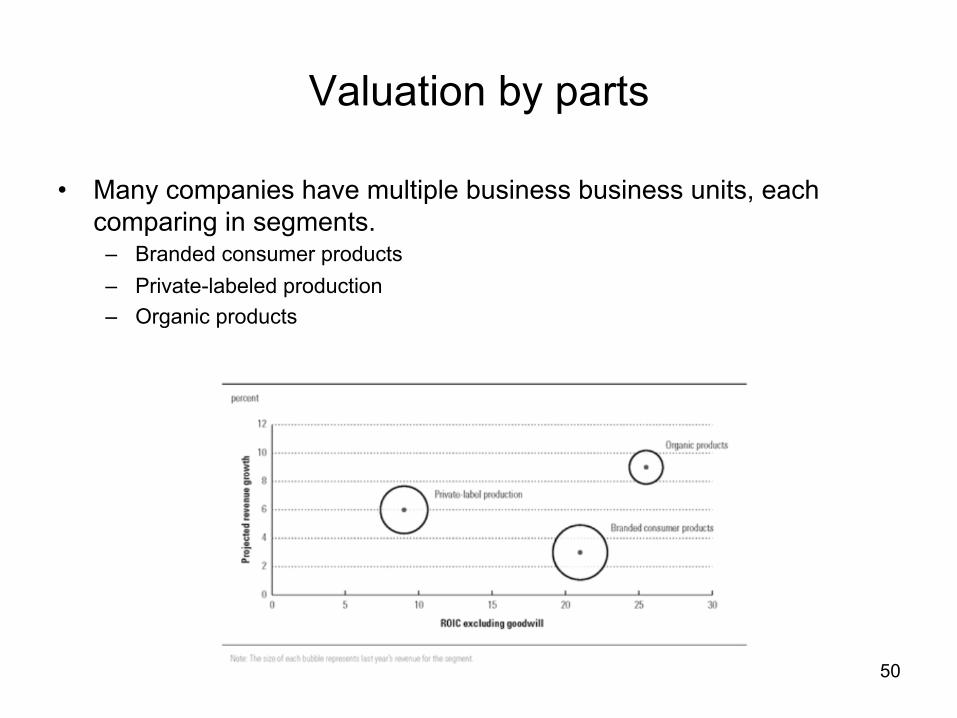
Valuation by parts
• Many companies have multiple business business units, each comparing in segments.
– Branded consumer products – Private-labeled production – Organic products
50
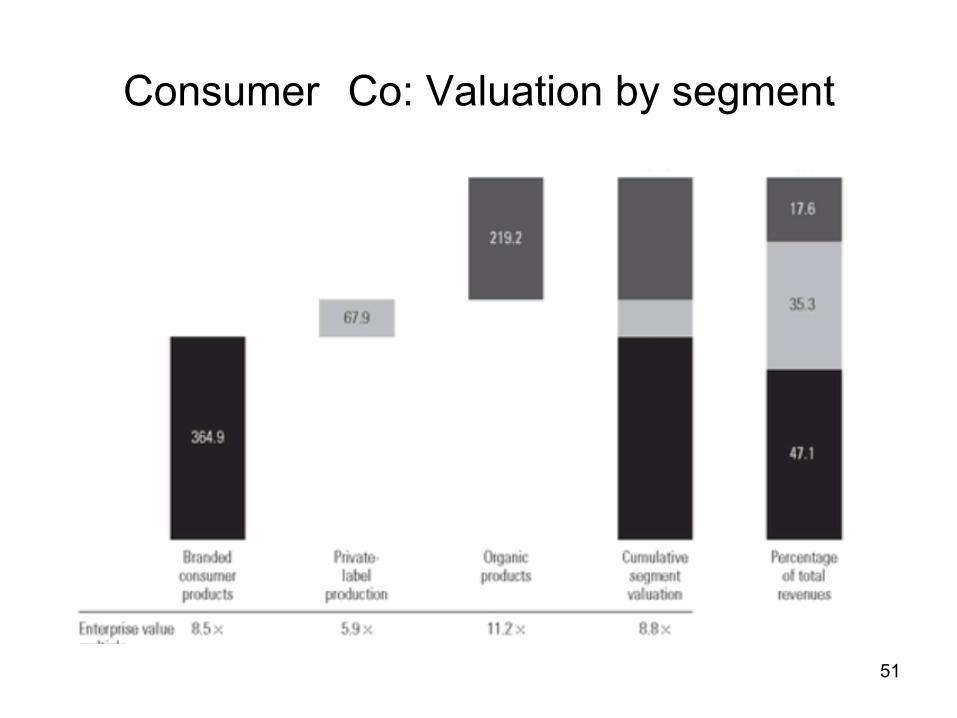
Consumer Co: Valuation by segment
51

Creating business unit Financial Statement
• Corporate cost – The aggregate cost of human resource services provided by the corporate parent
can be allocated by the number of employees in each business unit. – Keeping the corporate center as a separate unit reveals how much of a drag it
creates on the company’s value.
• Intercompany sales – To arrive at consolidated corporate results, accountants eliminate the internal
revenues, costs and profits to prevent double counting.
• Reorganizing the financial statements with incomplete information – NOPLAT – Invested capital
• Cost of Capital – To determine a business unit’s cost of capital, you need the unit’s target capital
structure, its cost of equity.
52
53
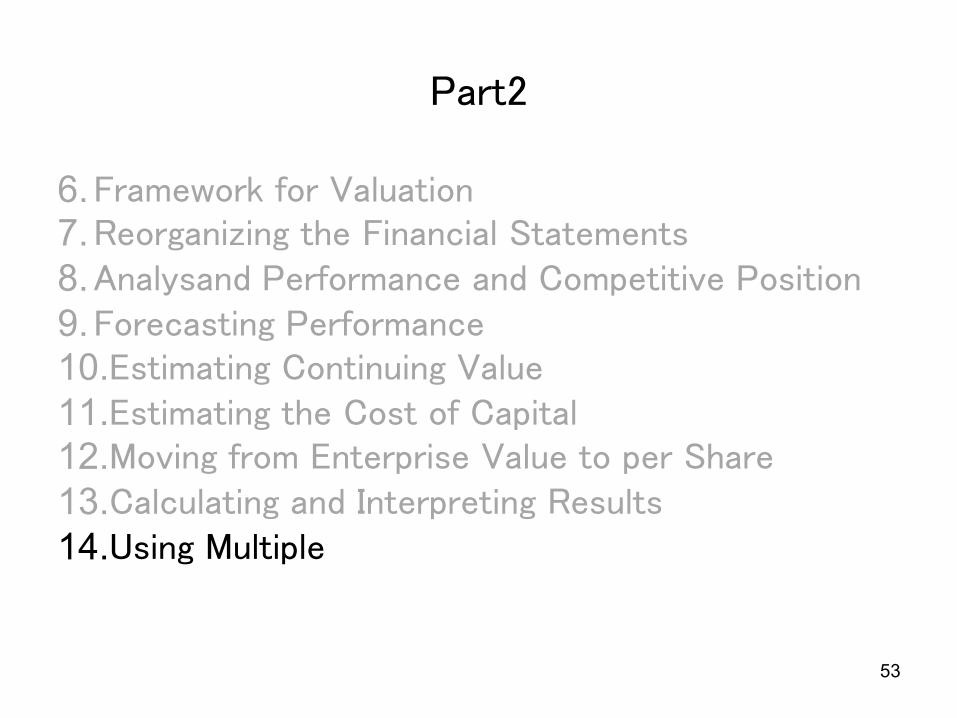
Part2
6. Framework for Valuation 7. Reorganizing the Financial Statements 8. Analysand Performance and Competitive Position 9. Forecasting Performance 10. Estimating Continuing Value 11. Estimating the Cost of Capital 12. Moving from Enterprise Value to per Share 13. Calculating and Interpreting Results 14. Using Multiple
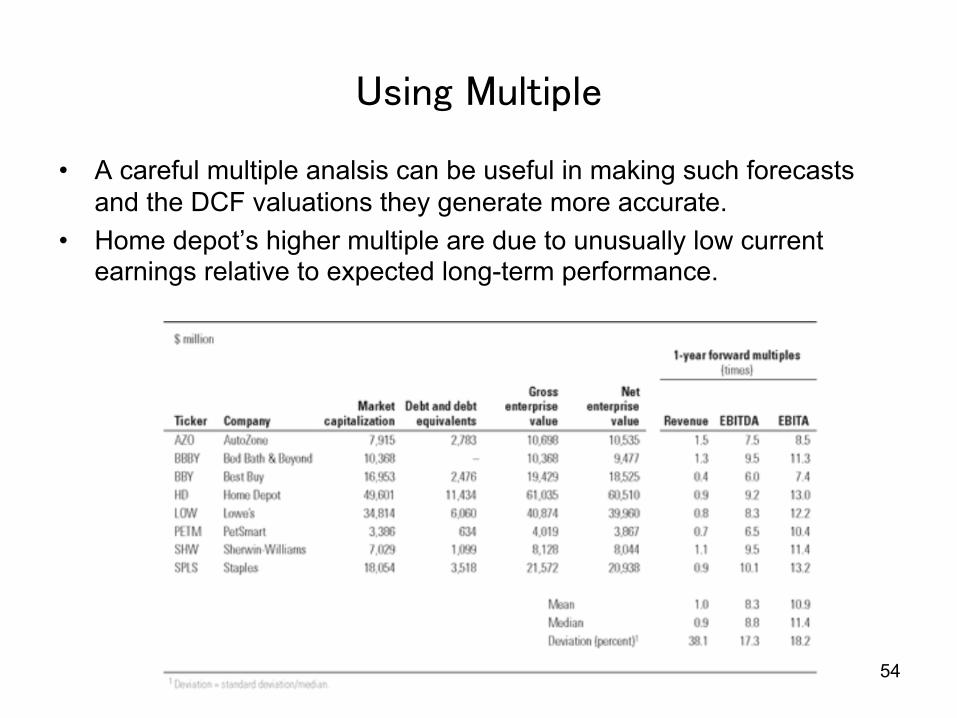
Using Multiple
• A careful multiple analsis can be useful in making such forecasts and the DCF valuations they generate more accurate.
• Home depot’s higher multiple are due to unusually low current earnings relative to expected long-term performance.
54
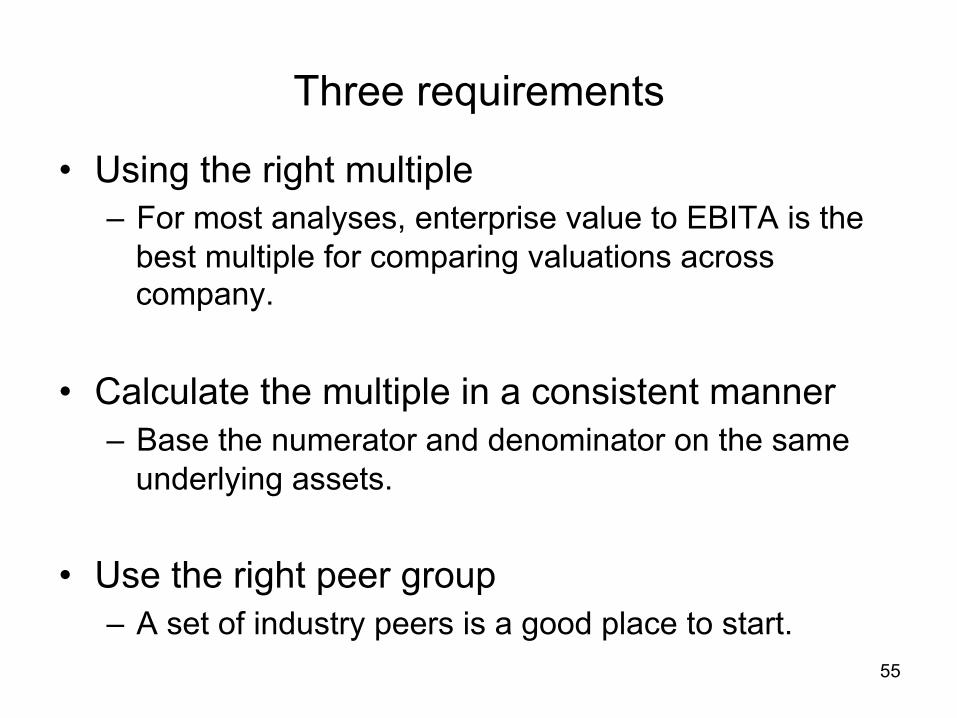
Three requirements
• Using the right multiple – For most analyses, enterprise value to EBITA is the
best multiple for comparing valuations across company.
• Calculate the multiple in a consistent manner – Base the numerator and denominator on the same
underlying assets.
• Use the right peer group – A set of industry peers is a good place to start.
55

Cash-flow based valuation formula
56
Value=NOPLATt=1 1−
gROIC
"
#$
%
&'
WACC− g
Value=EBITA(1−T ) 1− g
ROIC"
#$
%
&'
WACC− g
ValueEBITA
=(1−T ) 1− g
ROIC"
#$
%
&'
WACC− g
From the equation, we can see that four factors drive the EV to EBITA multiple: Ø the company’s growth rate, Ø its return on invested capital, Ø the operating tax rate, Ø and the cost of capital.

Distribution of enterprise value to EBITA
57
The majority fall between 7 times and 11 times EBITA.
P316 exhibit 14.2
Why EV to EBITA, not Price to Earnings?
58
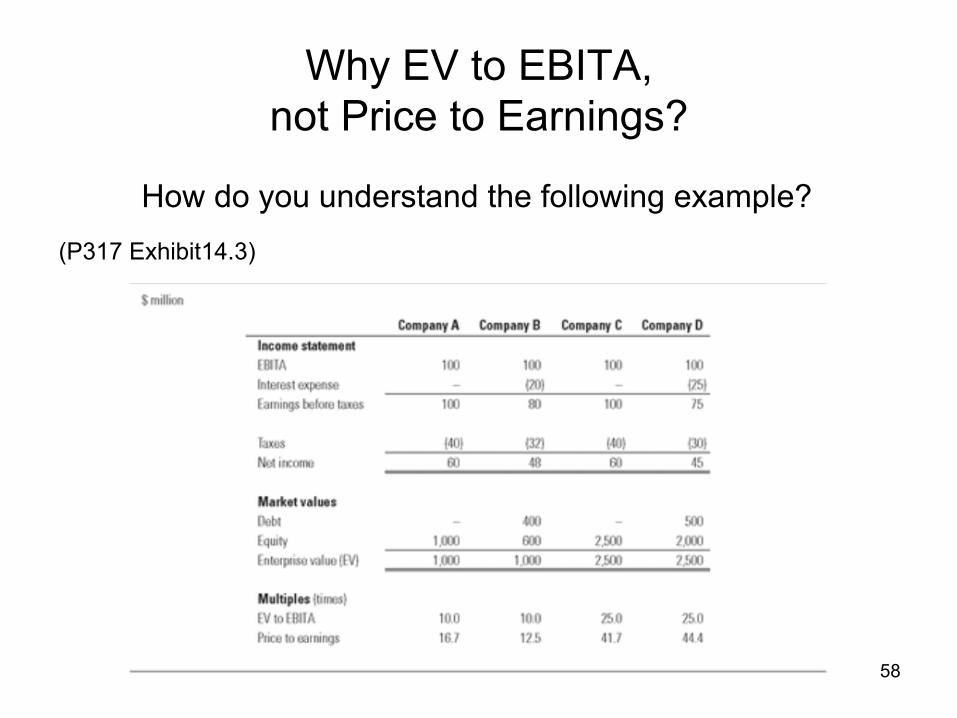
(P317 Exhibit14.3)
How do you understand the following example?
Why EV to EBITA, not Price to Earnings?
• The P/E is affected by a company’s capital structure, not just its operating performance.
• Earnings include many non operating items, such as restructuring charges and write-offs.
59

Why EV to EBITA, not EV to EBIT
60 P318 exhibit14.4
• Amortization is an accounting artifact that arises from past acquisitions.
• It is not tied to future cash flows, amortization will distort an enterprise value multiple.

Why EV to EBITA, not EV to EBITDA
• Many practitioners use EBITDA multiples because depreciation is, strictly speaking, a noncash expense, reflecting sunk costs, not future investment.
– This logic does not apply uniformly. • For many industries, depreciation of existing assets is the accounting equivalent of setting aside
the future capital expenditure that will be required to replace the assets. • In certain situations, EBITDA scales a company’s valuation better than EBITA.
– These occurs when current depreciation is not an accurate predictor of future capital expenditures.
61 P320 exhibit14.5

Use forward-Looking Multiples
• A company’s value equals the present value of future cash flow, not sunk costs.
• Empirical evidence shows that forward-looking multiples are indeed more accurate predictors of value than historical multiples are.
• To build a forward-looking multiple, choose a forecast year for EBITA that best represents the long term prospects of the business.
62

Pharmaceuticals: Backward and forward-looking multiples
63 P322 exhibit 14.6

Calculating the multiple in a consistent manner
• Enterprise value must include all investor capital but only the portion of value attributable to assets that generate EBITA. – As a general rule, any nonoperating asset that does not
contribute to EBITA should be removed from enterprise value.
• Since excess cash and nonconsolidated subsidiaries do not contribute to EBITA, they should not be included in the numerator of an EV-to-EBITA multiple.
• Since the minority stake’s value is supported by EBITA, it must be included in the enterprise value calculation.
64
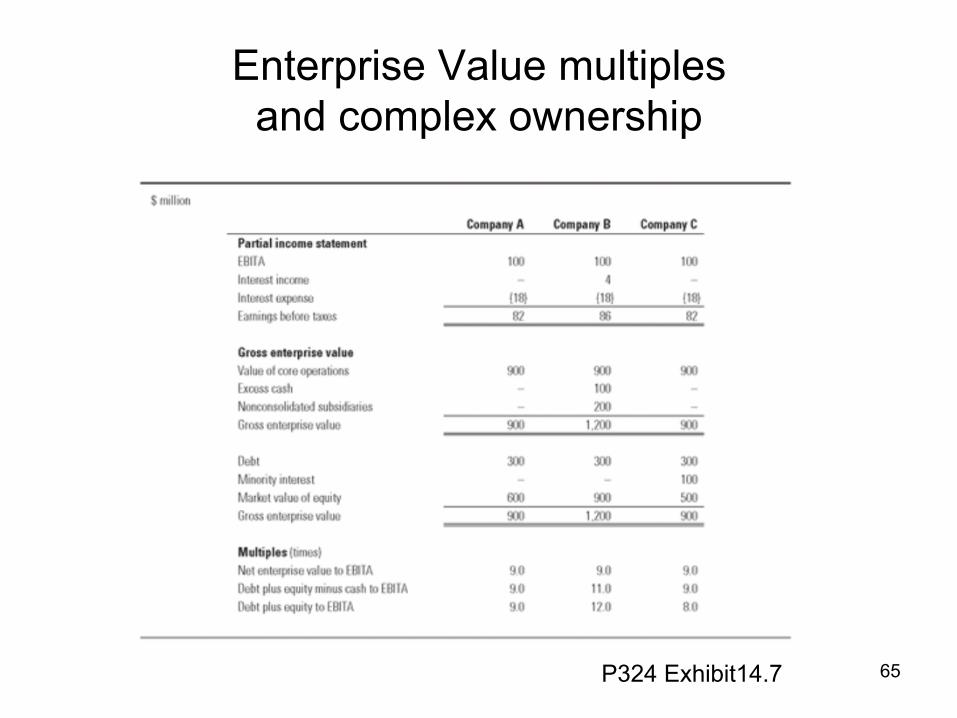
Enterprise Value multiples and complex ownership
65 P324 Exhibit14.7

Alternative Multiples
1. Enterprise value to revenues
2. PEG Ratios
3. Multiple based on nonfinancial(Operational) data
66

1. Enterprise value to Revenues
• An enterprise-value-to-sales multiple imposes similar growth rate, returns on incremental capital and operating margins on the company’s existing business.
• The EV-to-sales multiple is a function of ROIC and growth as well as EBITA margin.
67
ValueRevenue
= ValueEBITA
×EBITARevenue
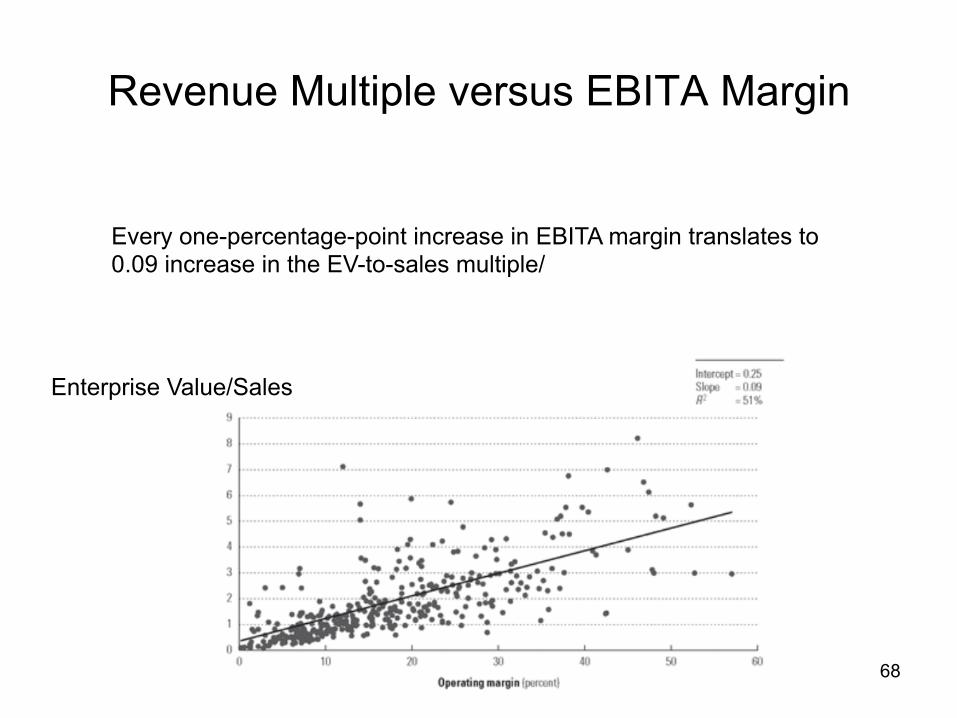
Revenue Multiple versus EBITA Margin
68
Enterprise Value/Sales
Every one-percentage-point increase in EBITA margin translates to 0.09 increase in the EV-to-sales multiple/
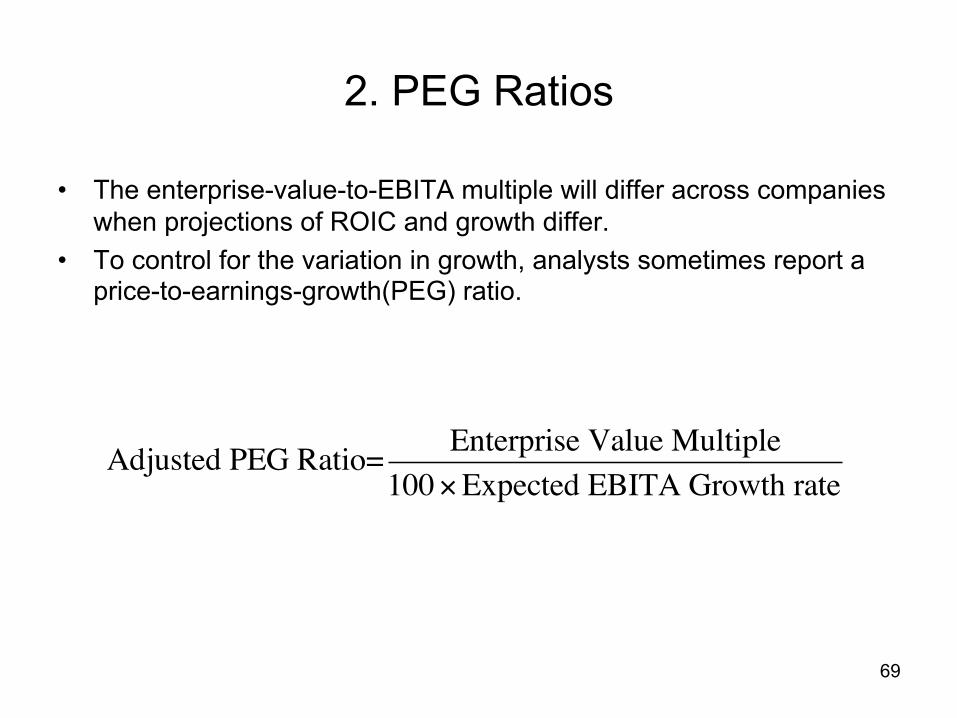
2. PEG Ratios
• The enterprise-value-to-EBITA multiple will differ across companies when projections of ROIC and growth differ.
• To control for the variation in growth, analysts sometimes report a price-to-earnings-growth(PEG) ratio.
69
Adjusted PEG Ratio= Enterprise Value Multiple100×Expected EBITA Growth rate
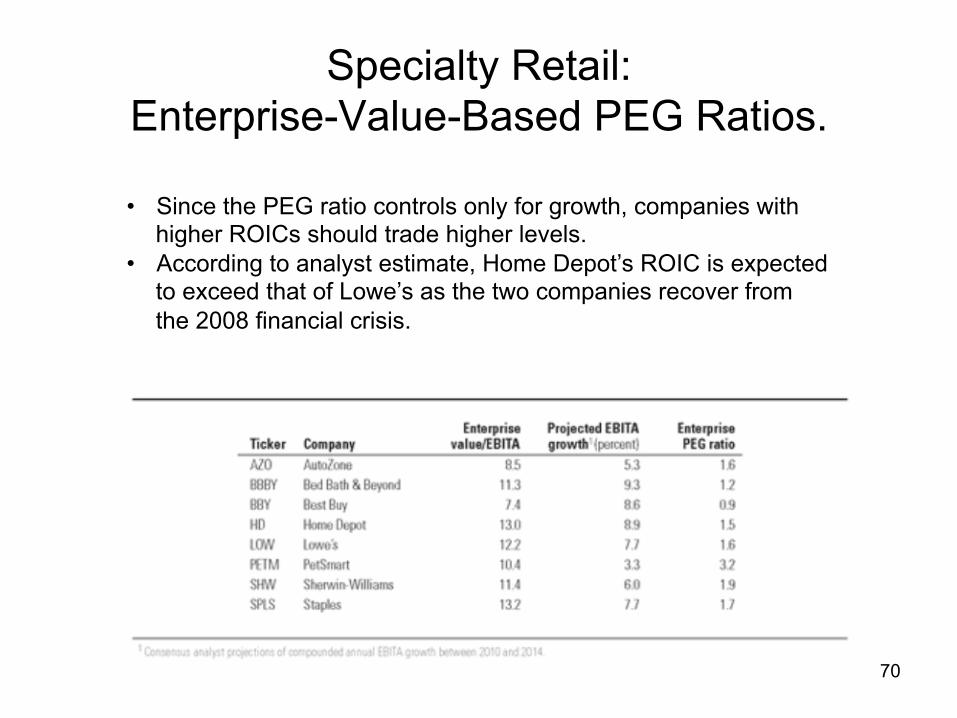
Specialty Retail: Enterprise-Value-Based PEG Ratios.
70
• Since the PEG ratio controls only for growth, companies with higher ROICs should trade higher levels.
• According to analyst estimate, Home Depot’s ROIC is expected to exceed that of Lowe’s as the two companies recover from the 2008 financial crisis.

PEG ratio estimation error
• The PEG ratio has its own drawbacks that can leas to valuation errors. – The PEG ration controls only for growth, not for ROIC. – There is no standard time frame for measuring expected growth. – PEG ration assume a liner relationship between multiples and
growth, such that no growth implies zero value.
71

3. Multiple Based on Nonfinancial(Operational) data
• In the late 1990s, numerous Internet companies went public with merger sales and negative profits.
• To overcome this shortcoming, academic and practitioners alike relied on nonfinancial multiples, which compare enterprise value with one or more non-operating financial statistics
– Such as web site hits, unique visitors, or number of subscriber.
• Two cautionary notes about using nonfinancial multiples – Nonfinancial multiple should be used only when they provide incremental
explanatory power above financial multiple. – Non financial multiples, like all multiples, are relative valuation tools.
72