2016 development effectiveness review · 2016. development effectiveness review. ... adb’s...
TRANSCRIPT
ASIAN DEVELOPMENT BANK
2016DEVELOPMENTEFFECTIVENESS REVIEWSCORECARD and RELATED INFORMATION


CONTENTS
RESULTS FRAMEWORK INDICATORSLevel 1: Development Progress in Asia and the Pacific ���������������������������������������������������������������������������������������� 2Level 2: ADB’s Contributions to Development Results ���������������������������������������������������������������������������������������� 6Level 3: ADB’s Operational Management ���������������������������������������������������������������������������������������������������������������14Level 4: ADB’s Organizational Management ����������������������������������������������������������������������������������������������������������20
SIGNALS AND SCORING METHODSLevel 1 Signals Explained ������������������������������������������������������������������������������������������������������������������������������������������������24Level 2–4 Signals Explained �������������������������������������������������������������������������������������������������������������������������������������������25Composite Signals �������������������������������������������������������������������������������������������������������������������������������������������������������������26Signals and Scoring Methods ����������������������������������������������������������������������������������������������������������������������������������������26
STANDARD EXPLANATORY DATA INDICATORSLevel 1: Development Progress in Asia and the Pacific ��������������������������������������������������������������������������������������30Level 2: ADB’s Contributions to Development Results �������������������������������������������������������������������������������������34Level 3: ADB’s Operational Management ���������������������������������������������������������������������������������������������������������������52Level 4: ADB’s Organizational Management ����������������������������������������������������������������������������������������������������������64

RESULTS FRAMEWORK INDICATORS
2
2016 Development Effectiveness Review
Indicator Baseline Year
Latest Year
Baseline Value
Latest Value
MDG Target Signal
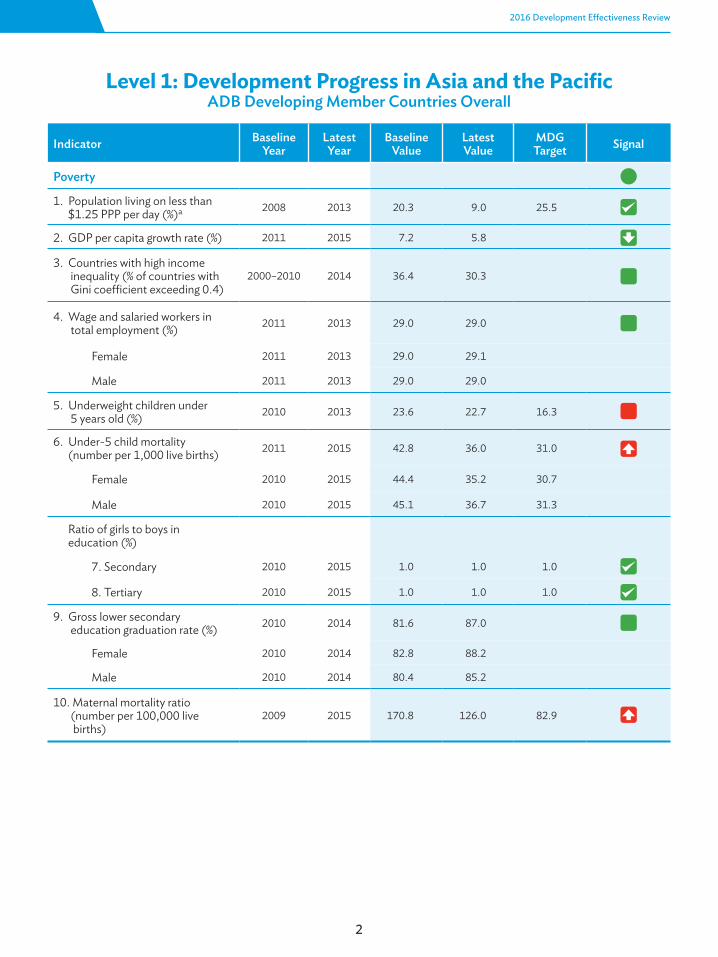
Poverty
1. Population living on less than $1.25 PPP per day (%)a 2008 2013 20.3 9.0 25.5
2. GDP per capita growth rate (%) 2011 2015 7.2 5.8
3. Countries with high income inequality (% of countries with Gini coefficient exceeding 0.4)
2000–2010 2014 36.4 30.3
4. Wage and salaried workers in total employment (%) 2011 2013 29.0 29.0
Female 2011 2013 29.0 29.1
Male 2011 2013 29.0 29.0
5. Underweight children under 5 years old (%) 2010 2013 23.6 22.7 16.3
6. Under-5 child mortality (number per 1,000 live births) 2011 2015 42.8 36.0 31.0
Female 2010 2015 44.4 35.2 30.7
Male 2010 2015 45.1 36.7 31.3
Ratio of girls to boys in education (%)
7. Secondary 2010 2015 1.0 1.0 1.0
8. Tertiary 2010 2015 1.0 1.0 1.0
9. Gross lower secondary education graduation rate (%) 2010 2014 81.6 87.0
Female 2010 2014 82.8 88.2
Male 2010 2014 80.4 85.2
10. Maternal mortality ratio (number per 100,000 live births)
2009 2015 170.8 126.0 82.9
Level 1: Development Progress in Asia and the PacificADB Developing Member Countries Overall
3
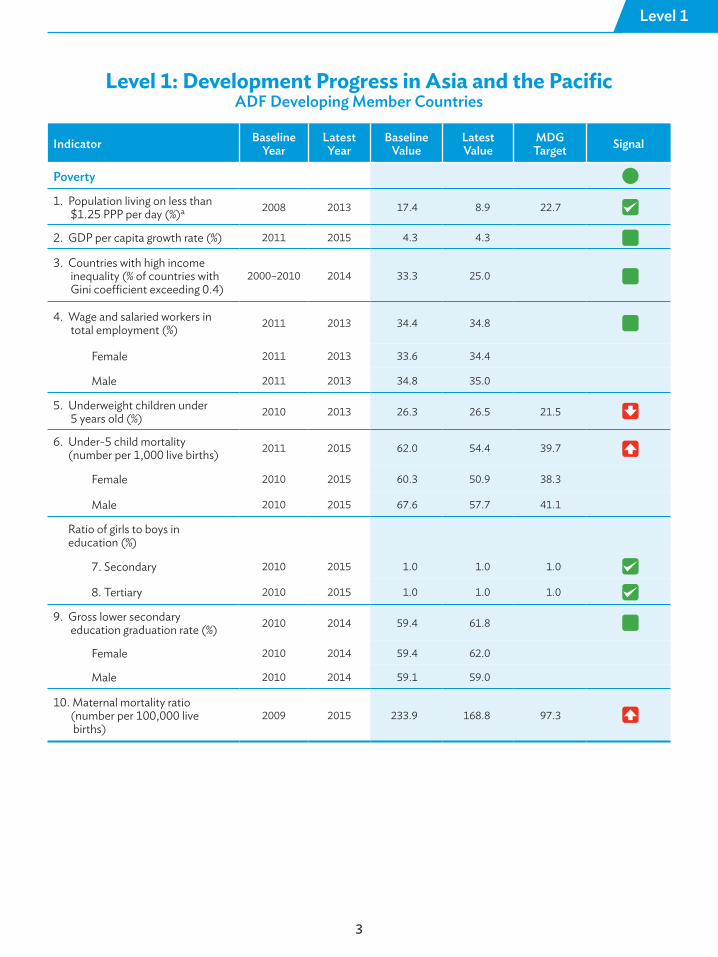
Level 1
Indicator Baseline Year
Latest Year
Baseline Value
Latest Value
MDG Target Signal
Poverty
1. Population living on less than $1.25 PPP per day (%)a 2008 2013 17.4 8.9 22.7
2. GDP per capita growth rate (%) 2011 2015 4.3 4.3
3. Countries with high income inequality (% of countries with Gini coefficient exceeding 0.4)
2000–2010 2014 33.3 25.0
4. Wage and salaried workers in total employment (%) 2011 2013 34.4 34.8
Female 2011 2013 33.6 34.4
Male 2011 2013 34.8 35.0
5. Underweight children under 5 years old (%) 2010 2013 26.3 26.5 21.5
6. Under-5 child mortality (number per 1,000 live births) 2011 2015 62.0 54.4 39.7
Female 2010 2015 60.3 50.9 38.3
Male 2010 2015 67.6 57.7 41.1
Ratio of girls to boys in education (%)
7. Secondary 2010 2015 1.0 1.0 1.0
8. Tertiary 2010 2015 1.0 1.0 1.0
9. Gross lower secondary education graduation rate (%) 2010 2014 59.4 61.8
Female 2010 2014 59.4 62.0
Male 2010 2014 59.1 59.0
10. Maternal mortality ratio (number per 100,000 live births)
2009 2015 233.9 168.8 97.3
Level 1: Development Progress in Asia and the PacificADF Developing Member Countries
4
2016 Development Effectiveness Review
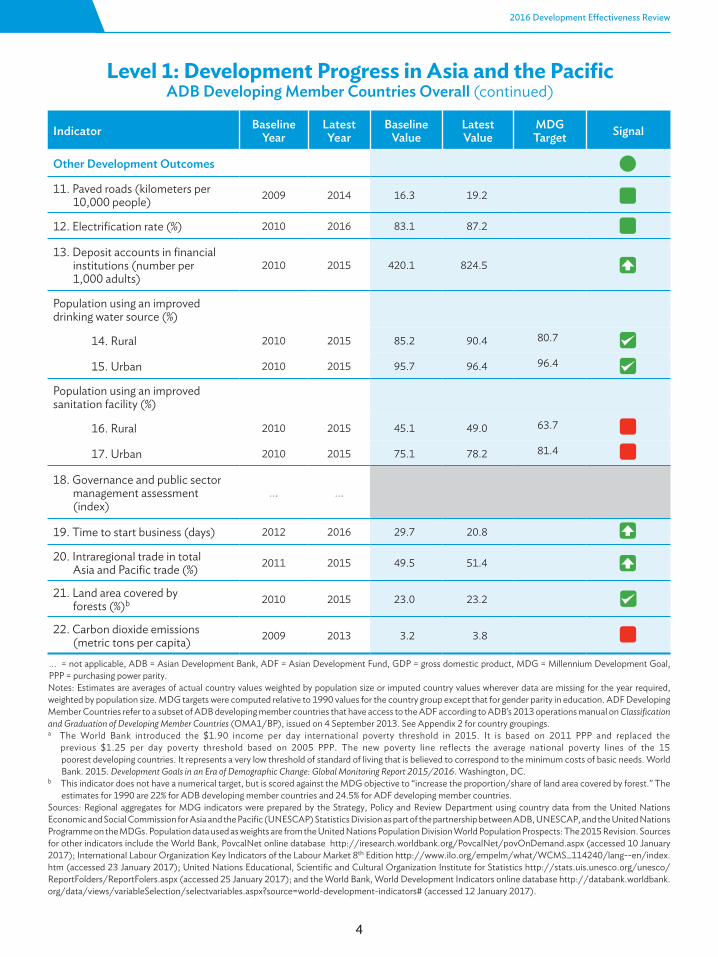
…. = not applicable, ADB = Asian Development Bank, ADF = Asian Development Fund, GDP = gross domestic product, MDG = Millennium Development Goal, PPP = purchasing power parity.Notes: Estimates are averages of actual country values weighted by population size or imputed country values wherever data are missing for the year required, weighted by population size. MDG targets were computed relative to 1990 values for the country group except that for gender parity in education. ADF Developing Member Countries refer to a subset of ADB developing member countries that have access to the ADF according to ADB’s 2013 operations manual on Classification and Graduation of Developing Member Countries (OMA1/BP), issued on 4 September 2013. See Appendix 2 for country groupings. a The World Bank introduced the $1.90 income per day international poverty threshold in 2015. It is based on 2011 PPP and replaced the previous $1.25 per day poverty threshold based on 2005 PPP. The new poverty line reflects the average national poverty lines of the 15 poorest developing countries. It represents a very low threshold of standard of living that is believed to correspond to the minimum costs of basic needs. World Bank. 2015. Development Goals in an Era of Demographic Change: Global Monitoring Report 2015/2016. Washington, DC.b This indicator does not have a numerical target, but is scored against the MDG objective to “increase the proportion/share of land area covered by forest.” The estimates for 1990 are 22% for ADB developing member countries and 24.5% for ADF developing member countries.Sources: Regional aggregates for MDG indicators were prepared by the Strategy, Policy and Review Department using country data from the United Nations Economic and Social Commission for Asia and the Pacific (UNESCAP) Statistics Division as part of the partnership between ADB, UNESCAP, and the United Nations Programme on the MDGs. Population data used as weights are from the United Nations Population Division World Population Prospects: The 2015 Revision. Sources for other indicators include the World Bank, PovcalNet online database http://iresearch.worldbank.org/PovcalNet/povOnDemand.aspx (accessed 10 January 2017); International Labour Organization Key Indicators of the Labour Market 8th Edition http://www.ilo.org/empelm/what/WCMS_114240/lang--en/index.htm (accessed 23 January 2017); United Nations Educational, Scientific and Cultural Organization Institute for Statistics http://stats.uis.unesco.org/unesco/ReportFolders/ReportFolers.aspx (accessed 25 January 2017); and the World Bank, World Development Indicators online database http://databank.worldbank.org/data/views/variableSelection/selectvariables.aspx?source=world-development-indicators# (accessed 12 January 2017).
Level 1: Development Progress in Asia and the PacificADB Developing Member Countries Overall (continued)
Indicator Baseline Year
Latest Year
Baseline Value
Latest Value
MDG Target Signal
Other Development Outcomes
11. Paved roads (kilometers per 10,000 people) 2009 2014 16.3 19.2
12. Electrification rate (%) 2010 2016 83.1 87.2
13. Deposit accounts in financial institutions (number per 1,000 adults)
2010 2015 420.1 824.5
Population using an improved drinking water source (%)
14. Rural 2010 2015 85.2 90.4 80.7
15. Urban 2010 2015 95.7 96.4 96.4
Population using an improved sanitation facility (%)
16. Rural 2010 2015 45.1 49.0 63.7
17. Urban 2010 2015 75.1 78.2 81.4
18. Governance and public sector management assessment (index)
…. ….
19. Time to start business (days) 2012 2016 29.7 20.8
20. Intraregional trade in total Asia and Pacific trade (%) 2011 2015 49.5 51.4
21. Land area covered by forests (%)b 2010 2015 23.0 23.2
22. Carbon dioxide emissions (metric tons per capita) 2009 2013 3.2 3.8
5
Level 1
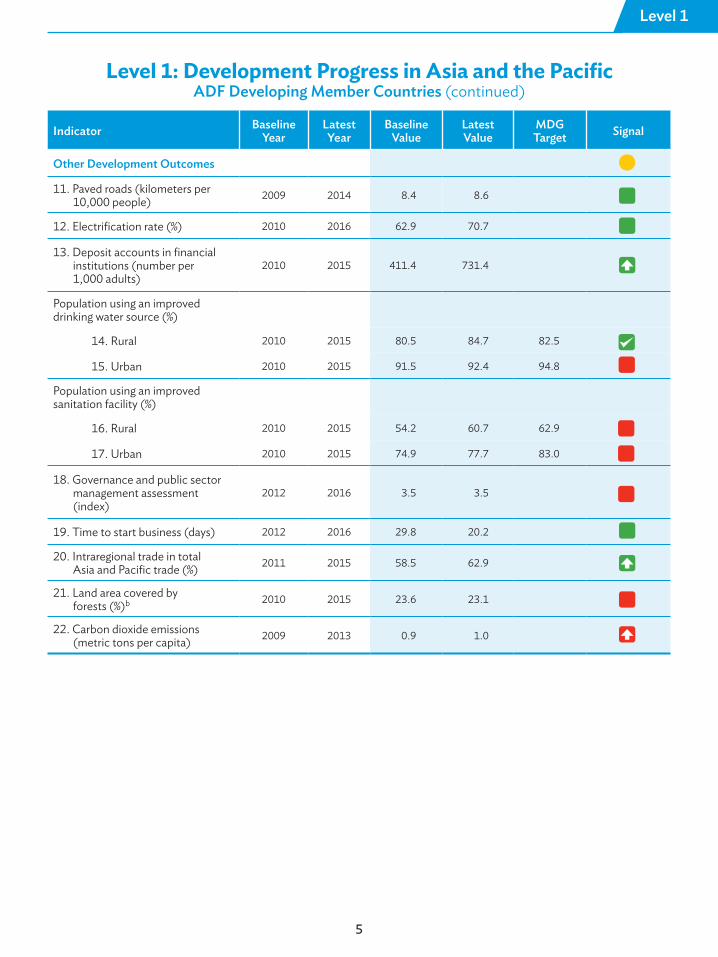
Level 1: Development Progress in Asia and the PacificADF Developing Member Countries (continued)
Indicator Baseline Year
Latest Year
Baseline Value
Latest Value
MDG Target Signal
Other Development Outcomes
11. Paved roads (kilometers per 10,000 people) 2009 2014 8.4 8.6
12. Electrification rate (%) 2010 2016 62.9 70.7
13. Deposit accounts in financial institutions (number per 1,000 adults)
2010 2015 411.4 731.4
Population using an improved drinking water source (%)
14. Rural 2010 2015 80.5 84.7 82.5
15. Urban 2010 2015 91.5 92.4 94.8
Population using an improved sanitation facility (%)
16. Rural 2010 2015 54.2 60.7 62.9
17. Urban 2010 2015 74.9 77.7 83.0
18. Governance and public sector management assessment (index)
2012 2016 3.5 3.5
19. Time to start business (days) 2012 2016 29.8 20.2
20. Intraregional trade in total Asia and Pacific trade (%) 2011 2015 58.5 62.9
21. Land area covered by forests (%)b 2010 2015 23.6 23.1
22. Carbon dioxide emissions (metric tons per capita) 2009 2013 0.9 1.0
2016 Development Effectiveness Review
6
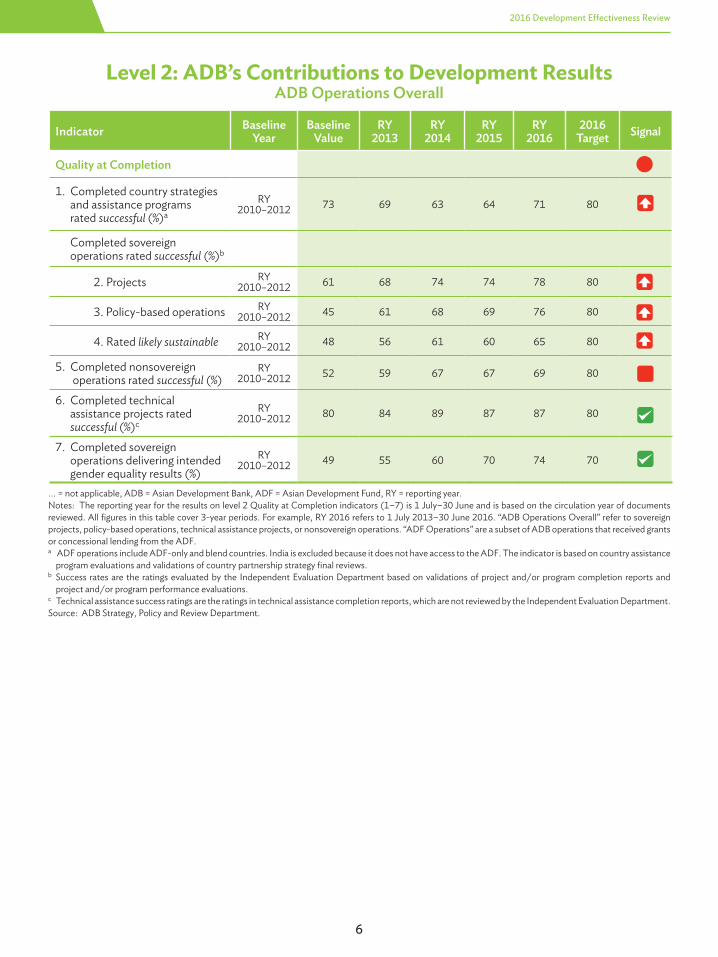
Level 2: ADB’s Contributions to Development ResultsADB Operations Overall
…. = not applicable, ADB = Asian Development Bank, ADF = Asian Development Fund, RY = reporting year. Notes: The reporting year for the results on level 2 Quality at Completion indicators (1–7) is 1 July–30 June and is based on the circulation year of documents reviewed. All figures in this table cover 3-year periods. For example, RY 2016 refers to 1 July 2013–30 June 2016. “ADB Operations Overall” refer to sovereign projects, policy-based operations, technical assistance projects, or nonsovereign operations. “ADF Operations” are a subset of ADB operations that received grants or concessional lending from the ADF. a ADF operations include ADF-only and blend countries. India is excluded because it does not have access to the ADF. The indicator is based on country assistance program evaluations and validations of country partnership strategy final reviews. b Success rates are the ratings evaluated by the Independent Evaluation Department based on validations of project and/or program completion reports and project and/or program performance evaluations. c Technical assistance success ratings are the ratings in technical assistance completion reports, which are not reviewed by the Independent Evaluation Department. Source: ADB Strategy, Policy and Review Department.
Indicator Baseline Year
Baseline Value
RY2013
RY2014
RY2015
RY2016
2016Target Signal
Quality at Completion
1. Completed country strategies and assistance programs rated successful (%)a
RY2010–2012 73 69 63 64 71 80
Completed sovereign operations rated successful (%)b
2. Projects RY2010–2012 61 68 74 74 78 80
3. Policy-based operations RY2010–2012 45 61 68 69 76 80
4. Rated likely sustainable RY2010–2012 48 56 61 60 65 80
5. Completed nonsovereign operations rated successful (%)
RY2010–2012 52 59 67 67 69 80
6. Completed technical assistance projects rated successful (%)c
RY2010–2012 80 84 89 87 87 80
7. Completed sovereign operations delivering intended gender equality results (%)
RY2010–2012 49 55 60 70 74 70
Level 2
7
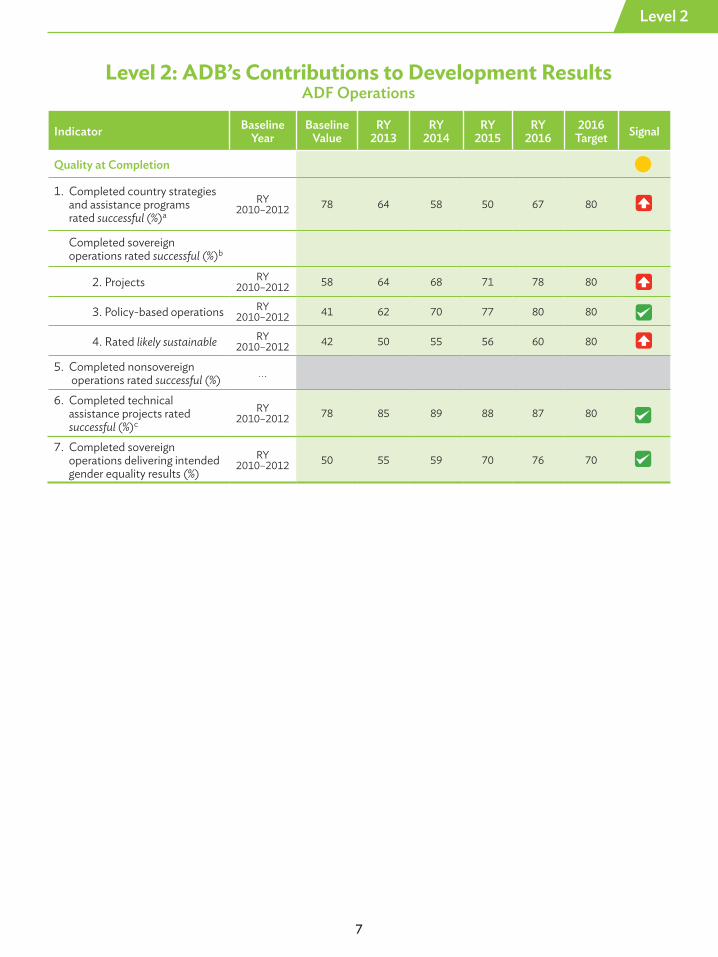
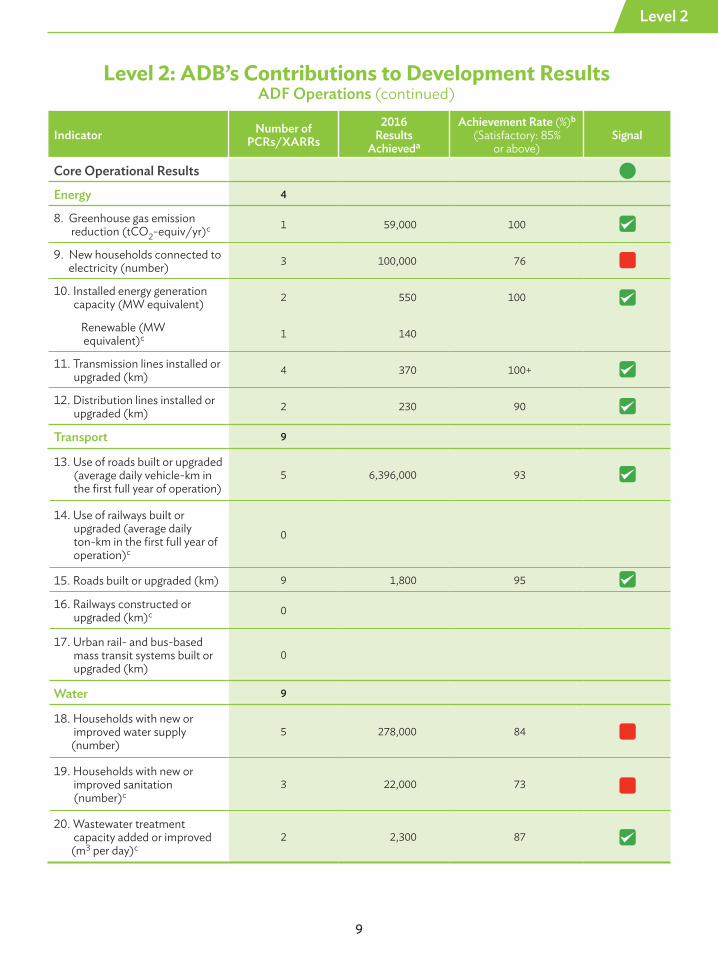
Level 2: ADB’s Contributions to Development ResultsADF Operations
Indicator Baseline Year
Baseline Value
RY2013
RY2014
RY2015
RY2016
2016Target Signal
Quality at Completion
1. Completed country strategies and assistance programs rated successful (%)a
RY2010–2012 78 64 58 50 67 80
Completed sovereign operations rated successful (%)b
2. Projects RY2010–2012 58 64 68 71 78 80
3. Policy-based operations RY2010–2012 41 62 70 77 80 80
4. Rated likely sustainable RY2010–2012 42 50 55 56 60 80
5. Completed nonsovereign operations rated successful (%) ….
6. Completed technical assistance projects rated successful (%)c
RY2010–2012 78 85 89 88 87 80
7. Completed sovereign operations delivering intended gender equality results (%)
RY2010–2012 50 55 59 70 76 70
2016 Development Effectiveness Review
8
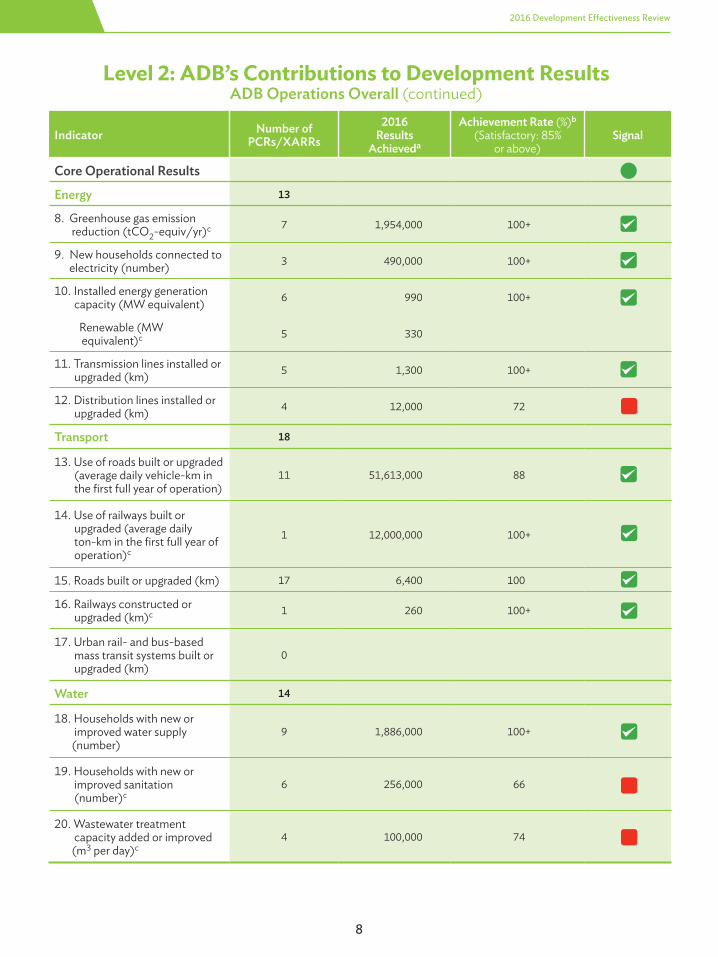
Level 2: ADB’s Contributions to Development ResultsADB Operations Overall (continued)
Indicator Number ofPCRs/XARRs
2016Results
Achieveda
Achievement Rate (%)b
(Satisfactory: 85%or above)
Signal
Core Operational Results
Energy 13
8. Greenhouse gas emission reduction (tCO2-equiv/yr)c 7 1,954,000 100+
9. New households connected to electricity (number) 3 490,000 100+
10. Installed energy generation capacity (MW equivalent) 6 990 100+
Renewable (MW equivalent)c 5 330
11. Transmission lines installed or upgraded (km) 5 1,300 100+
12. Distribution lines installed or upgraded (km) 4 12,000 72
Transport 18
13. Use of roads built or upgraded (average daily vehicle-km in the first full year of operation)
11 51,613,000 88
14. Use of railways built or upgraded (average daily ton-km in the first full year of operation)c
1 12,000,000 100+
15. Roads built or upgraded (km) 17 6,400 100
16. Railways constructed or upgraded (km)c 1 260 100+
17. Urban rail- and bus-based mass transit systems built or upgraded (km)
0
Water 14
18. Households with new or improved water supply (number)
9 1,886,000 100+
19. Households with new or improved sanitation (number)c
6 256,000 66
20. Wastewater treatment capacity added or improved (m3 per day)c
4 100,000 74
Level 2
9
Indicator Number ofPCRs/XARRs
2016Results
Achieveda
Achievement Rate (%)b
(Satisfactory: 85%or above)
Signal
Core Operational Results
Energy 4
8. Greenhouse gas emission reduction (tCO2-equiv/yr)c 1 59,000 100
9. New households connected to electricity (number) 3 100,000 76
10. Installed energy generation capacity (MW equivalent) 2 550 100
Renewable (MW equivalent)c 1 140
11. Transmission lines installed or upgraded (km) 4 370 100+
12. Distribution lines installed or upgraded (km) 2 230 90
Transport 9
13. Use of roads built or upgraded (average daily vehicle-km in the first full year of operation)
5 6,396,000 93
14. Use of railways built or upgraded (average daily ton-km in the first full year of operation)c
0
15. Roads built or upgraded (km) 9 1,800 95
16. Railways constructed or upgraded (km)c 0
17. Urban rail- and bus-based mass transit systems built or upgraded (km)
0
Water 9
18. Households with new or improved water supply (number)
5 278,000 84
19. Households with new or improved sanitation (number)c
3 22,000 73
20. Wastewater treatment capacity added or improved (m3 per day)c
2 2,300 87
Level 2: ADB’s Contributions to Development ResultsADF Operations (continued)
2016 Development Effectiveness Review
10
Indicator Number ofPCRs/XARRs
2016Results
Achieveda
Achievement Rate (%)b
(Satisfactory: 85%or above)
Signal
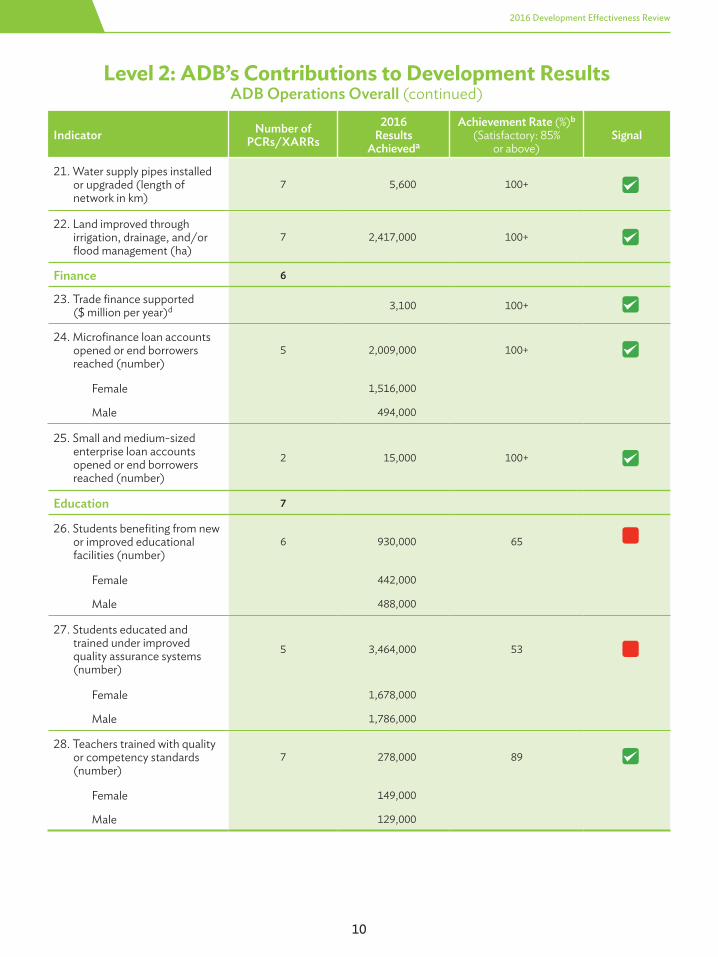
21. Water supply pipes installed or upgraded (length of network in km)
7 5,600 100+
22. Land improved through irrigation, drainage, and/or flood management (ha)
7 2,417,000 100+
Finance 6
23. Trade finance supported ($ million per year)d 3,100 100+
24. Microfinance loan accounts opened or end borrowers reached (number)
5 2,009,000 100+
Female 1,516,000
Male 494,000
25. Small and medium-sized enterprise loan accounts opened or end borrowers reached (number)
2 15,000 100+
Education 7
26. Students benefiting from new or improved educational facilities (number)
6 930,000 65
Female 442,000
Male 488,000
27. Students educated and trained under improved quality assurance systems (number)
5 3,464,000 53
Female 1,678,000
Male 1,786,000
28. Teachers trained with quality or competency standards (number)
7 278,000 89
Female 149,000
Male 129,000
Level 2: ADB’s Contributions to Development ResultsADB Operations Overall (continued)
Level 2
11
Indicator Number ofPCRs/XARRs
2016Results
Achieveda
Achievement Rate (%)b
(Satisfactory: 85%or above)
Signal
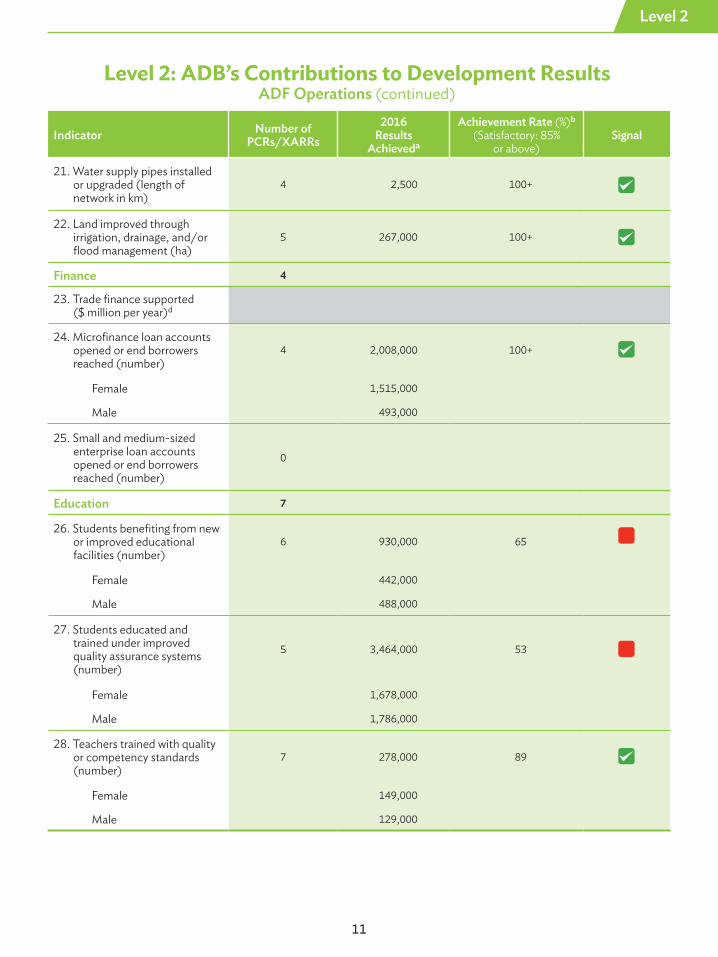
21. Water supply pipes installed or upgraded (length of network in km)
4 2,500 100+
22. Land improved through irrigation, drainage, and/or flood management (ha)
5 267,000 100+
Finance 4
23. Trade finance supported ($ million per year)d
24. Microfinance loan accounts opened or end borrowers reached (number)
4 2,008,000 100+
Female 1,515,000
Male 493,000
25. Small and medium-sized enterprise loan accounts opened or end borrowers reached (number)
0
Education 7
26. Students benefiting from new or improved educational facilities (number)
6 930,000 65
Female 442,000
Male 488,000
27. Students educated and trained under improved quality assurance systems (number)
5 3,464,000 53
Female 1,678,000
Male 1,786,000
28. Teachers trained with quality or competency standards (number)
7 278,000 89
Female 149,000
Male 129,000
Level 2: ADB’s Contributions to Development ResultsADF Operations (continued)

2016 Development Effectiveness Review
12
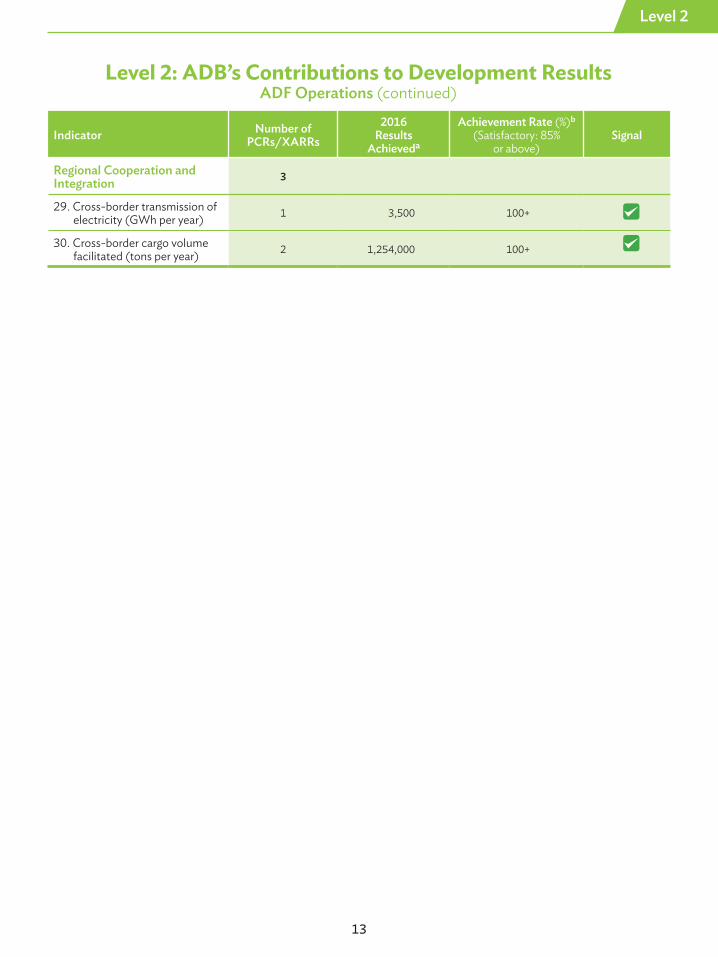
ADB = Asian Development Bank, ADF = Asian Development Fund, GWh = gigawatt-hour, ha = hectare, km = kilometer, m3 = cubic meter, MW = megawatt, PCR = project and/or program completion report, tCO2-equiv/year = tons of carbon dioxide equivalent per year, XARR = extended annual review report.Notes: 1. Signals do not have arrows because there is no comparison with past or baseline achievement percentages. The entry “100+” in the “Achievement Rate” column means that outputs achieved exceeded the planned outputs. 2. Results achieved are rounded to the nearest 1,000. Values smaller than 10,000 are rounded to the nearest 100. Values smaller than 1,000 are rounded to nearest 10. Values smaller than 99 are not rounded.3. Gray shading in cells indicates the column heading does not apply.a Results Achieved are aggregate amounts of outputs and outcomes reported in PCRs and XARRs circulated from 1 January to 31 December 2016 as achieved by ADB operations. Of the 61 operations with PCRs and XARRs, 49 operations (80%) reported outputs and outcomes covered by the indicators in level 2. The results presented include the contributions of ADB, cofinanciers, and the government. ADB financing accounts for at least 46% of the total project costs of these operations.b “Achievement Rate” is the percentage of “Results Achieved” to the total planned outputs and outcomes as reported in reports and recommendations of the President for the same operations and estimated by project teams.c These are identified as environment indicators.d This indicator is rated against the annual benchmark of $2.5 billion.Source: ADB Strategy, Policy and Review Department.
Level 2: ADB’s Contributions to Development ResultsADB Operations Overall (continued)
Indicator Number ofPCRs/XARRs
2016Results
Achieveda
Achievement Rate (%)b
(Satisfactory: 85%or above)
Signal
Regional Cooperation andIntegration 3
29. Cross-border transmission of electricity (GWh per year) 1 3,500 100+
30. Cross-border cargo volume facilitated (tons per year) 2 1,254,000 100+
Level 2
13
Level 2: ADB’s Contributions to Development ResultsADF Operations (continued)
Indicator Number ofPCRs/XARRs
2016Results
Achieveda
Achievement Rate (%)b
(Satisfactory: 85%or above)
Signal
Regional Cooperation andIntegration 3
29. Cross-border transmission of electricity (GWh per year) 1 3,500 100+
30. Cross-border cargo volume facilitated (tons per year) 2 1,254,000 100+

14
2016 Development Effectiveness Review
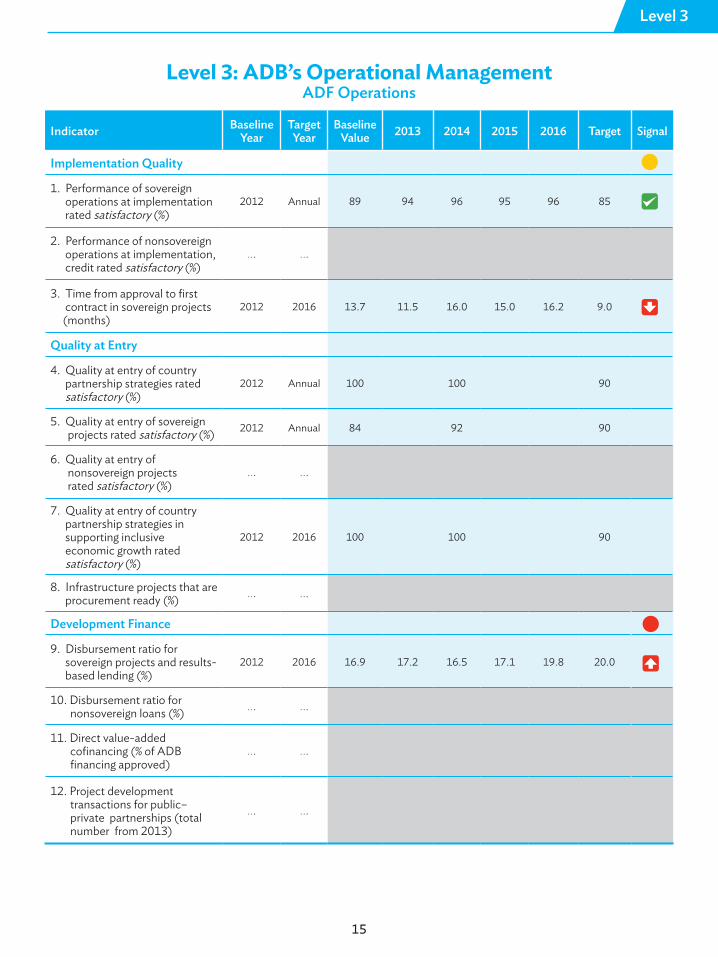
Level 3: ADB’s Operational ManagementADB Operations Overall
Indicator Baseline Year
Target Year
BaselineValue 2013 2014 2015 2016 Target Signal
Implementation Quality
1. Performance of sovereign operations at implementation rated satisfactory (%)
2012 Annual 89 93 95 93 95 85
2. Performance of nonsovereign operations at implementation, credit rated satisfactory (%)
2012 Annual 99 98 99 99 99 95
3. Time from approval to first contract in sovereign projects (months)
2012 2016 12.9 11.6 15.2 15.1 14.4 9.0
Quality at Entry
4. Quality at entry of country partnership strategies rated satisfactory (%)
2012 Annual 100 100 90
5. Quality at entry of sovereign projects rated satisfactory (%) 2012 Annual 85 95 90
6. Quality at entry of nonsovereign projects rated satisfactory (%)
2012 2016 84 94 90
7. Quality at entry of country partnership strategies in supporting inclusive economic growth rated satisfactory (%)
2012 2016 100 100 90
8. Infrastructure projects that are procurement ready (%) 2012 2016 14 28 31 28 44 40
Development Finance
9. Disbursement ratio for sovereign projects and results- based lending (%)
2012 2016 17.6 17.8 18.3 17.1 18.2 22.0
10. Disbursement ratio for nonsovereign loans (%) 2012 Annual 24.4 36.1 36.5 47.7 53.4 Maintain
11. Direct value-added cofinancing (% of ADB financing approved)
2010-2012 2016 51 53 58 59 71 70
12. Project development transactions for public– private partnerships (total number from 2013)
2012 2016 1 4 20 40 58 50
15
Level 3
Indicator Baseline Year
Target Year
BaselineValue 2013 2014 2015 2016 Target Signal
Implementation Quality
1. Performance of sovereign operations at implementation rated satisfactory (%)
2012 Annual 89 94 96 95 96 85
2. Performance of nonsovereign operations at implementation, credit rated satisfactory (%)
…. ….
3. Time from approval to first contract in sovereign projects (months)
2012 2016 13.7 11.5 16.0 15.0 16.2 9.0
Quality at Entry
4. Quality at entry of country partnership strategies rated satisfactory (%)
2012 Annual 100 100 90
5. Quality at entry of sovereign projects rated satisfactory (%) 2012 Annual 84 92 90
6. Quality at entry of nonsovereign projects rated satisfactory (%)
…. ….
7. Quality at entry of country partnership strategies in supporting inclusive economic growth rated satisfactory (%)
2012 2016 100 100 90
8. Infrastructure projects that are procurement ready (%) …. ….
Development Finance
9. Disbursement ratio for sovereign projects and results- based lending (%)
2012 2016 16.9 17.2 16.5 17.1 19.8 20.0
10. Disbursement ratio for nonsovereign loans (%) …. ….
11. Direct value-added cofinancing (% of ADB financing approved)
…. ….
12. Project development transactions for public– private partnerships (total number from 2013)
…. ….
Level 3: ADB’s Operational ManagementADF Operations
16
2016 Development Effectiveness Review
Indicator Baseline Year
Target Year
BaselineValue 2013 2014 2015 2016 Target Signal
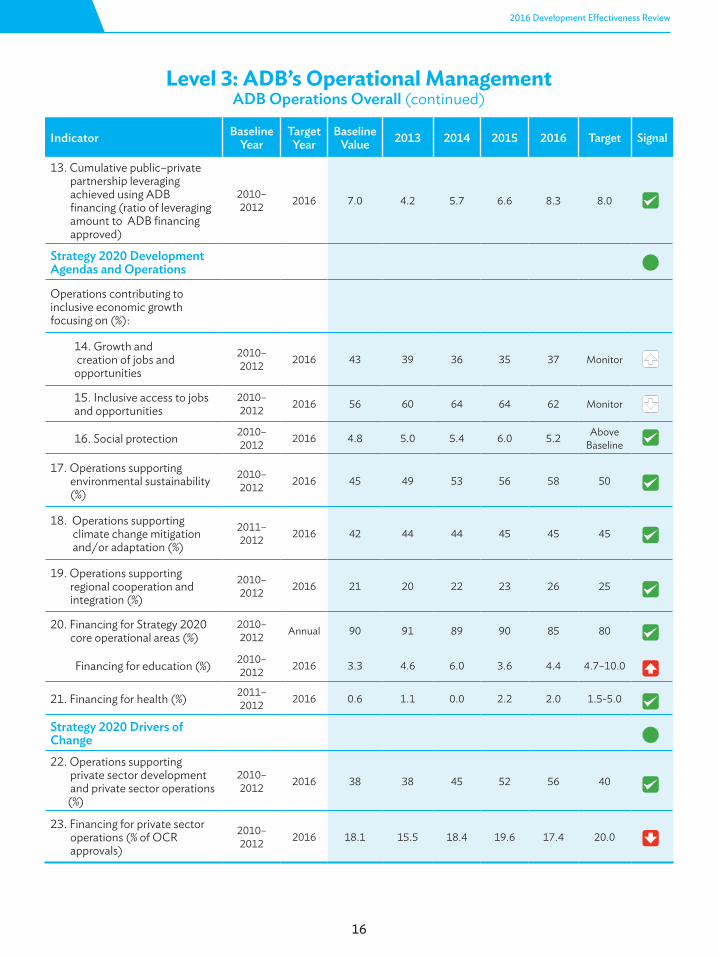
13. Cumulative public–private partnership leveraging achieved using ADB financing (ratio of leveraging amount to ADB financing approved)
2010–2012 2016 7.0 4.2 5.7 6.6 8.3 8.0
Strategy 2020 Development Agendas and Operations
Operations contributing to inclusive economic growth focusing on (%):
14. Growth and creation of jobs and opportunities
2010–2012 2016 43 39 36 35 37 Monitor
15. Inclusive access to jobs and opportunities
2010–2012 2016 56 60 64 64 62 Monitor
16. Social protection 2010–2012 2016 4.8 5.0 5.4 6.0 5.2 Above
Baseline
17. Operations supporting environmental sustainability (%)
2010–2012 2016 45 49 53 56 58 50
18. Operations supporting climate change mitigation and/or adaptation (%)
2011–2012 2016 42 44 44 45 45 45
19. Operations supporting regional cooperation and integration (%)
2010–2012 2016 21 20 22 23 26 25
20. Financing for Strategy 2020 core operational areas (%)
2010–2012 Annual 90 91 89 90 85 80
Financing for education (%) 2010–2012 2016 3.3 4.6 6.0 3.6 4.4 4.7–10.0
21. Financing for health (%) 2011–2012 2016 0.6 1.1 0.0 2.2 2.0 1.5-5.0
Strategy 2020 Drivers of Change22. Operations supporting private sector development and private sector operations (%)
2010–2012 2016 38 38 45 52 56 40
23. Financing for private sector operations (% of OCR approvals)
2010–2012 2016 18.1 15.5 18.4 19.6 17.4 20.0
Level 3: ADB’s Operational ManagementADB Operations Overall (continued)
17
Level 3
Indicator Baseline Year
Target Year
BaselineValue 2013 2014 2015 2016 Target Signal
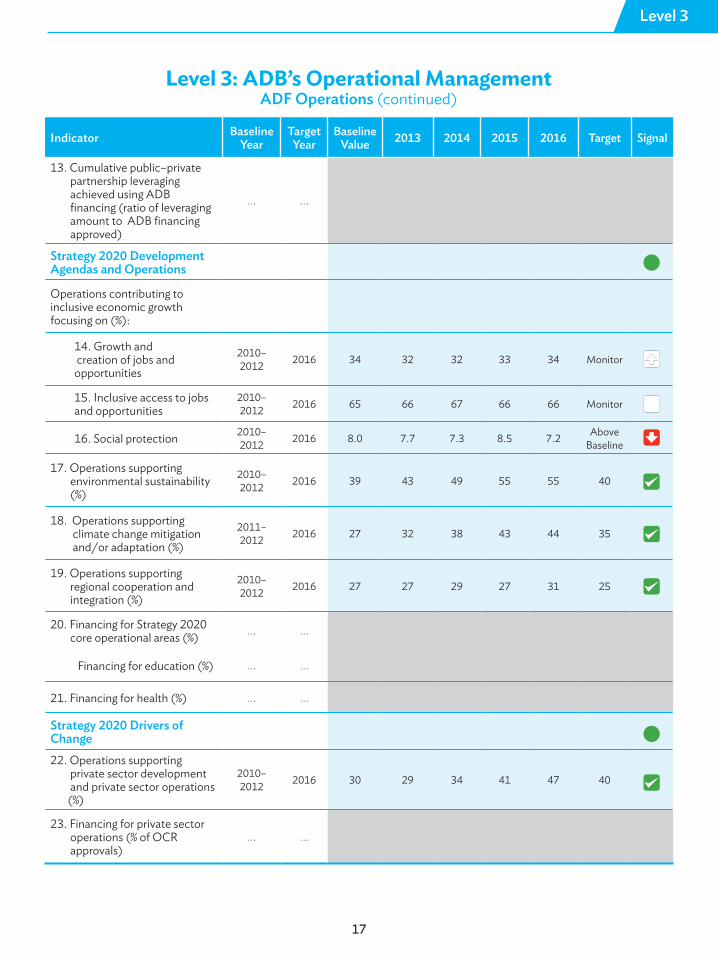
13. Cumulative public–private partnership leveraging achieved using ADB financing (ratio of leveraging amount to ADB financing approved)
…. ….
Strategy 2020 Development Agendas and Operations
Operations contributing to inclusive economic growth focusing on (%):
14. Growth and creation of jobs and opportunities
2010–2012 2016 34 32 32 33 34 Monitor
15. Inclusive access to jobs and opportunities
2010–2012 2016 65 66 67 66 66 Monitor
16. Social protection 2010–2012 2016 8.0 7.7 7.3 8.5 7.2 Above
Baseline
17. Operations supporting environmental sustainability (%)
2010–2012 2016 39 43 49 55 55 40
18. Operations supporting climate change mitigation and/or adaptation (%)
2011–2012 2016 27 32 38 43 44 35
19. Operations supporting regional cooperation and integration (%)
2010–2012 2016 27 27 29 27 31 25
20. Financing for Strategy 2020 core operational areas (%) …. ….
Financing for education (%) …. ….
21. Financing for health (%) …. ….
Strategy 2020 Drivers of Change22. Operations supporting private sector development and private sector operations (%)
2010–2012 2016 30 29 34 41 47 40
23. Financing for private sector operations (% of OCR approvals)
…. ….
Level 3: ADB’s Operational ManagementADF Operations (continued)
18
2016 Development Effectiveness Review
Indicator Baseline Year
Target Year
BaselineValue 2013 2014 2015 2016 Target Signal
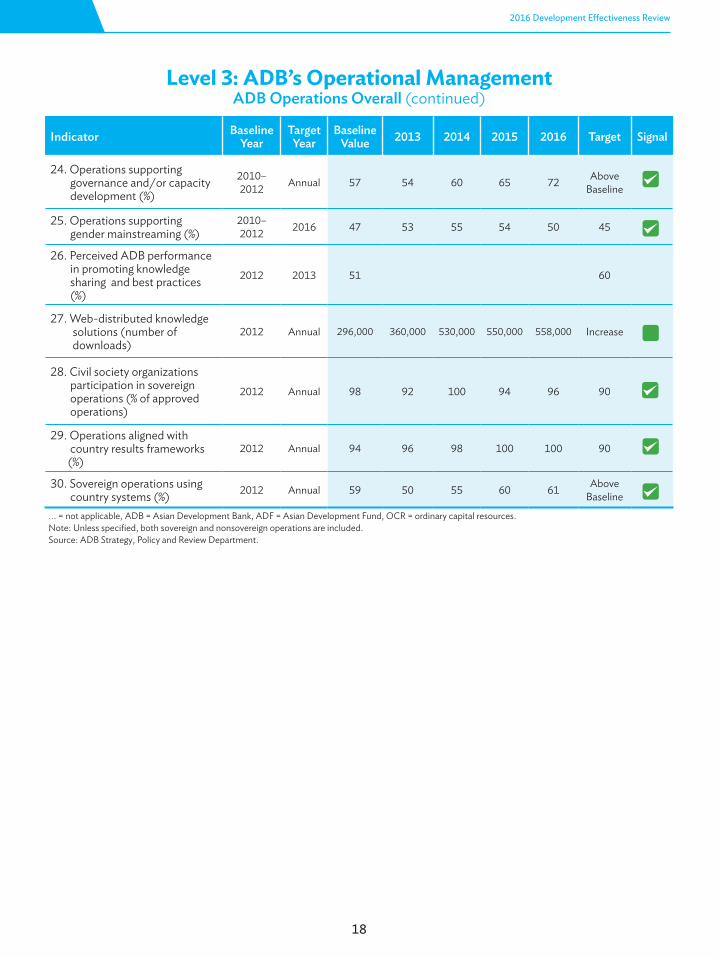
24. Operations supporting governance and/or capacity development (%)
2010–2012 Annual 57 54 60 65 72 Above
Baseline
25. Operations supporting gender mainstreaming (%)
2010–2012 2016 47 53 55 54 50 45
26. Perceived ADB performance in promoting knowledge sharing and best practices (%)
2012 2013 51 60
27. Web-distributed knowledge solutions (number of downloads)
2012 Annual 296,000 360,000 530,000 550,000 558,000 Increase
28. Civil society organizations participation in sovereign operations (% of approved operations)
2012 Annual 98 92 100 94 96 90
29. Operations aligned with country results frameworks (%)
2012 Annual 94 96 98 100 100 90
30. Sovereign operations using country systems (%) 2012 Annual 59 50 55 60 61 Above
Baseline
Level 3: ADB’s Operational ManagementADB Operations Overall (continued)
…. = not applicable, ADB = Asian Development Bank, ADF = Asian Development Fund, OCR = ordinary capital resources.Note: Unless specified, both sovereign and nonsovereign operations are included.Source: ADB Strategy, Policy and Review Department.
19
Level 3
Indicator Baseline Year
Target Year
BaselineValue 2013 2014 2015 2016 Target Signal
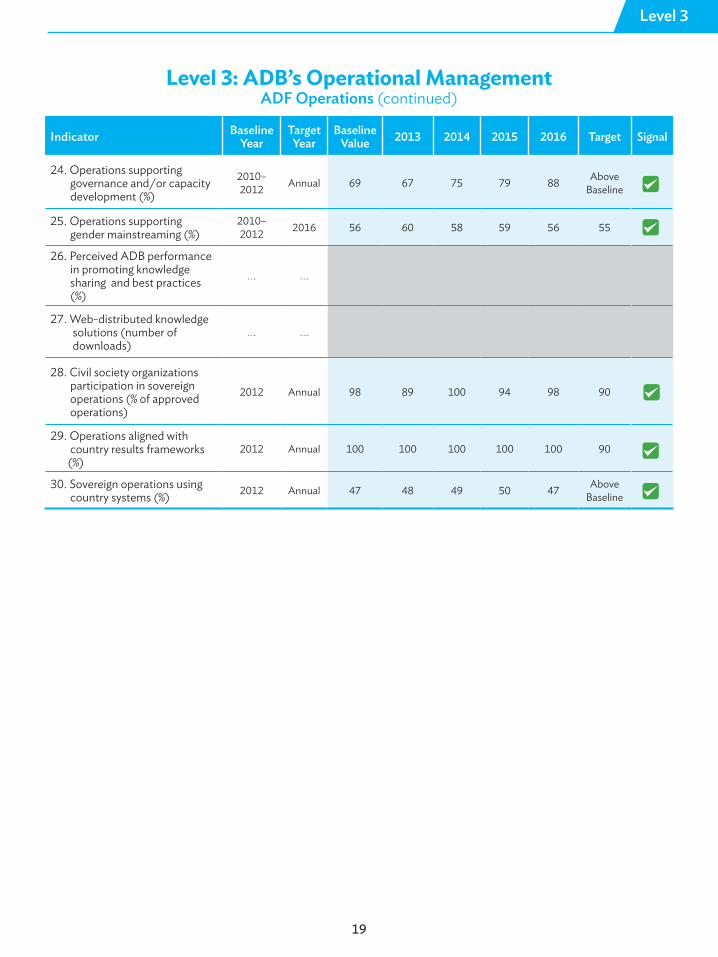
24. Operations supporting governance and/or capacity development (%)
2010–2012 Annual 69 67 75 79 88 Above
Baseline
25. Operations supporting gender mainstreaming (%)
2010–2012 2016 56 60 58 59 56 55
26. Perceived ADB performance in promoting knowledge sharing and best practices (%)
…. ….
27. Web-distributed knowledge solutions (number of downloads)
…. ….
28. Civil society organizations participation in sovereign operations (% of approved operations)
2012 Annual 98 89 100 94 98 90
29. Operations aligned with country results frameworks (%)
2012 Annual 100 100 100 100 100 90
30. Sovereign operations using country systems (%) 2012 Annual 47 48 49 50 47 Above
Baseline
Level 3: ADB’s Operational ManagementADF Operations (continued)
20
2016 Development Effectiveness Review
Level 4: ADB’s Organizational ManagementADB Operations Overall
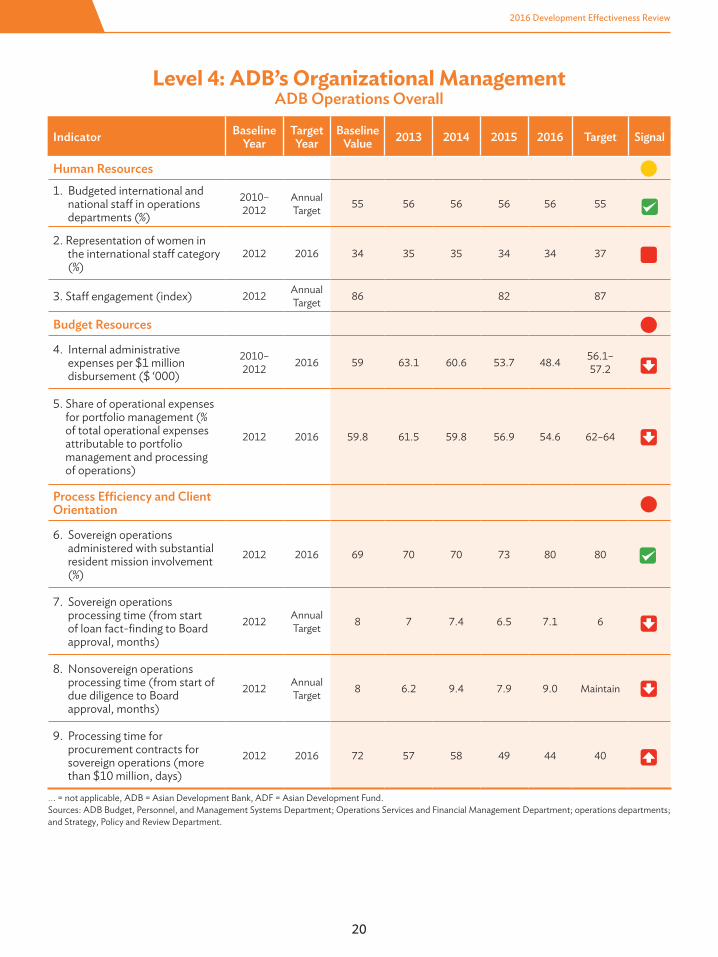
…. = not applicable, ADB = Asian Development Bank, ADF = Asian Development Fund.Sources: ADB Budget, Personnel, and Management Systems Department; Operations Services and Financial Management Department; operations departments; and Strategy, Policy and Review Department.
Indicator Baseline Year
Target Year
BaselineValue 2013 2014 2015 2016 Target Signal
Human Resources1. Budgeted international and national staff in operations departments (%)
2010–2012
AnnualTarget 55 56 56 56 56 55
2. Representation of women in the international staff category (%)
2012 2016 34 35 35 34 34 37
3. Staff engagement (index) 2012 AnnualTarget 86 82 87
Budget Resources
4. Internal administrative expenses per $1 million disbursement ($ ‘000)
2010–2012 2016 59 63.1 60.6 53.7 48.4 56.1–
57.2
5. Share of operational expenses for portfolio management (% of total operational expenses attributable to portfolio management and processing of operations)
2012 2016 59.8 61.5 59.8 56.9 54.6 62–64
Process Efficiency and Client Orientation
6. Sovereign operations administered with substantial resident mission involvement (%)
2012 2016 69 70 70 73 80 80
7. Sovereign operations processing time (from start of loan fact-finding to Board approval, months)
2012 AnnualTarget 8 7 7.4 6.5 7.1 6
8. Nonsovereign operations processing time (from start of due diligence to Board approval, months)
2012 Annual Target 8 6.2 9.4 7.9 9.0 Maintain
9. Processing time for procurement contracts for sovereign operations (more than $10 million, days)
2012 2016 72 57 58 49 44 40
21
Level 4
Indicator Baseline Year
Target Year
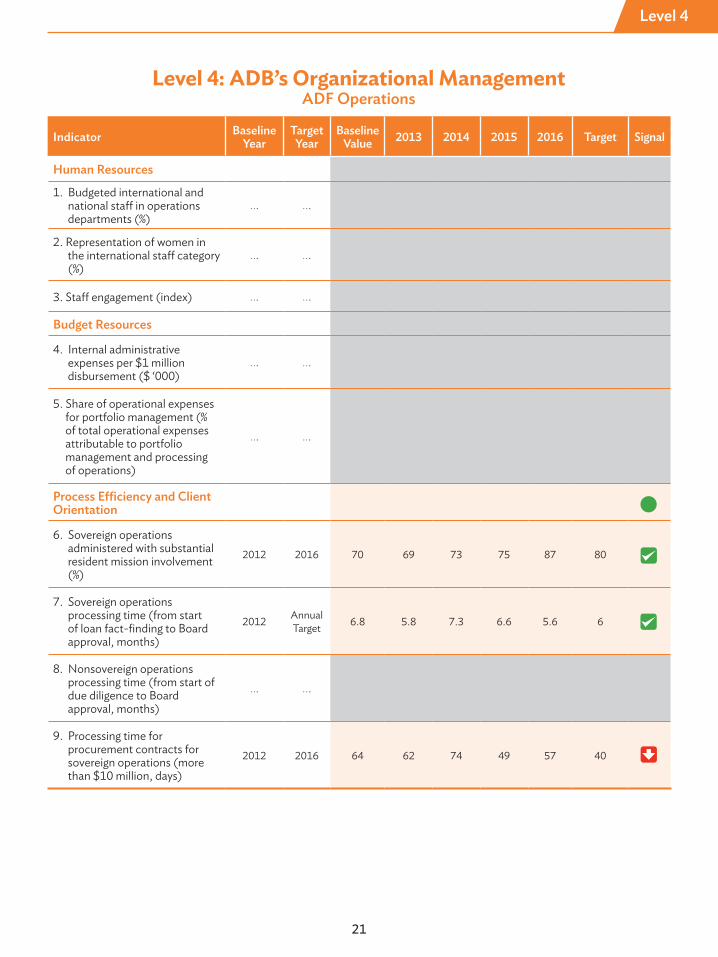
BaselineValue 2013 2014 2015 2016 Target Signal
Human Resources
1. Budgeted international and national staff in operations departments (%)
…. ….
2. Representation of women in the international staff category (%)
…. ….
3. Staff engagement (index) …. ….
Budget Resources
4. Internal administrative expenses per $1 million disbursement ($ ‘000)
…. ….
5. Share of operational expenses for portfolio management (% of total operational expenses attributable to portfolio management and processing of operations)
…. ….
Process Efficiency and Client Orientation
6. Sovereign operations administered with substantial resident mission involvement (%)
2012 2016 70 69 73 75 87 80
7. Sovereign operations processing time (from start of loan fact-finding to Board approval, months)
2012 AnnualTarget 6.8 5.8 7.3 6.6 5.6 6
8. Nonsovereign operations processing time (from start of due diligence to Board approval, months)
…. ….
9. Processing time for procurement contracts for sovereign operations (more than $10 million, days)
2012 2016 64 62 74 49 57 40
Level 4: ADB’s Organizational ManagementADF Operations

SIGNALS ANDSCORING METHODS
24
2016 Development Effectiveness Review
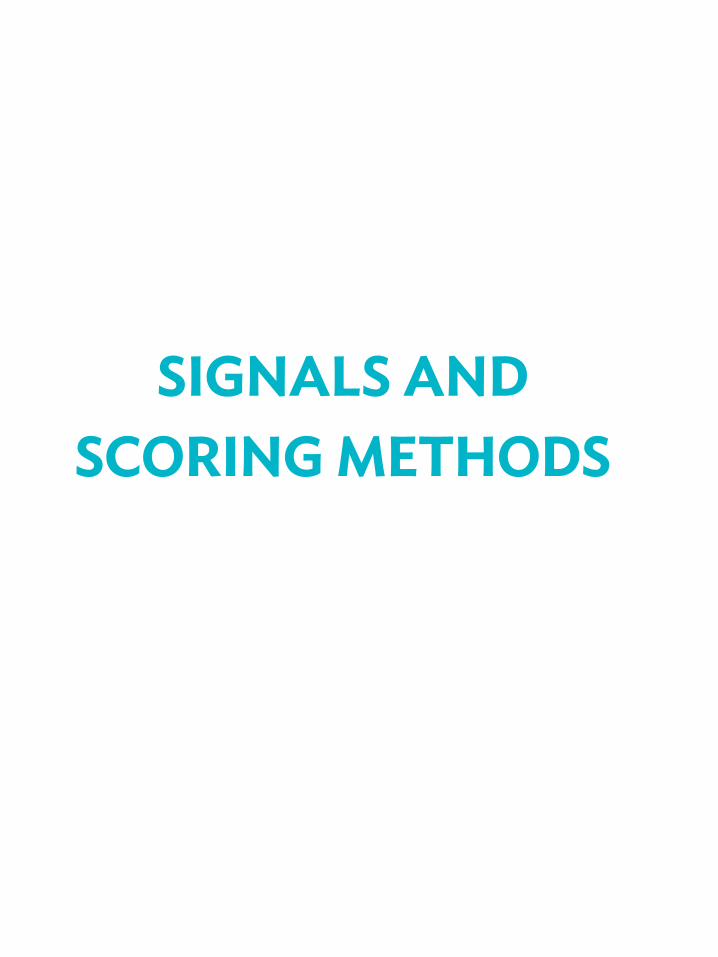
Level 1 Signals Explained
MDG = Millennium Development Goal.Notes: 2016 is the final year of the 2013–2016 corporate results framework. During the final year, an assessment is made whether the targets have been met or not. As such, no amber signal is used for individual indicators.a An arrow indicates a significant (≥ 3%) change from previous performance. An arrow pointing up indicates improvement; an arrow pointing down indicates deterioration. Source: Asian Development Bank Strategy, Policy and Review Department.
Progress Signala Annual Change
MDG IndicatorsAt or above target—region’s performance at or above
cutoff value for 2015
Below target—region’s performance fell short of desired progress to attain cutoff value for 2015
Improved
Remained stable
Deteriorated
Non-MDG IndicatorsAt or above target—region’s performance progressed
against baseline
Improved
Remained stable
Deteriorated
Below target—region’s performance at or below baseline for 3 or more consecutive years
Improved
Remained stable
Deteriorated
25
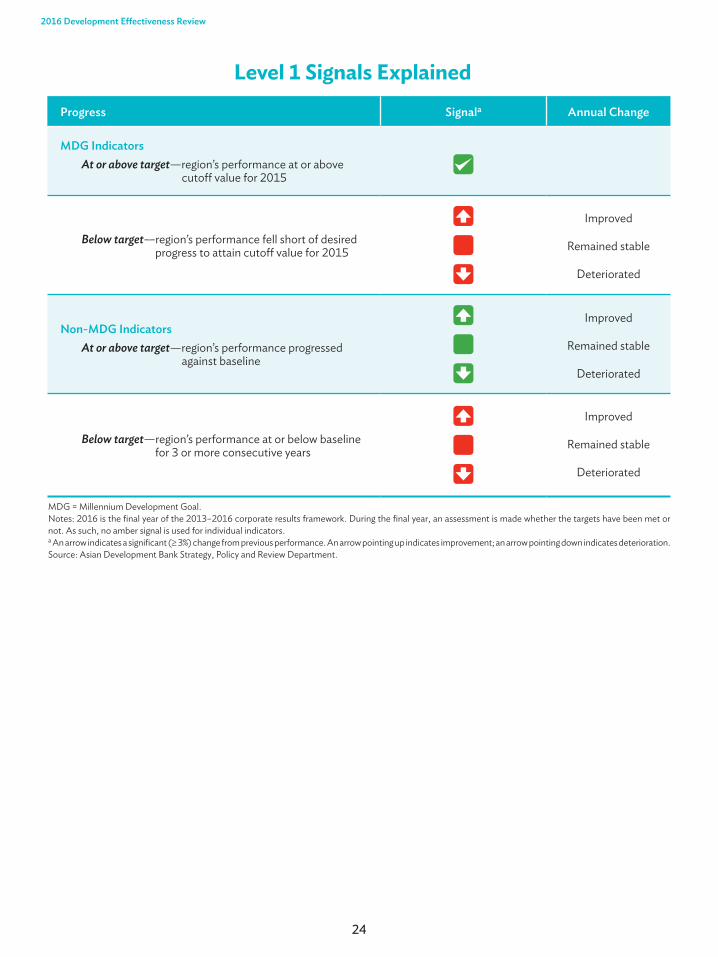
Level 2–4 Signals Explained
Notes: 2016 is the final year of the 2013–2016 corporate results framework. During the final year, an assessment is made whether the targets have been met or not. As such, no amber signal is used for individual indicators.a An arrow indicates a significant (≥ 3%) change from previous performance. An arrow pointing up indicates improvement; an arrow pointing down indicates deterioration. There are no arrows for Core Operational Results (level 2), as there is no comparison with past and/or baseline achievement percentages. For results indicators that are monitored, the arrow shows the direction of movement only.Source: Asian Development Bank Strategy, Policy and Review Department.
Progress Signala Annual Change
At or above target—performance at or above target
Below target—performance fell short of desired progress to attain target
Improved
Remained stable
Deteriorated
Monitor—no performance assessment
Improved
Remained stable
Deteriorated
26
2016 Development Effectiveness Review
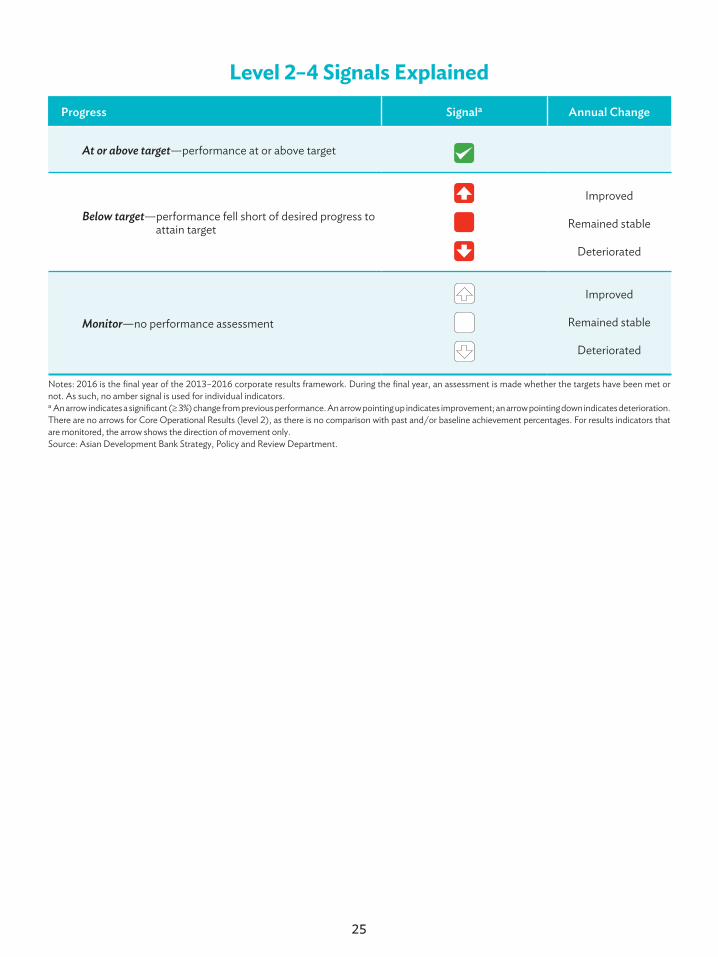
Type Target Notes Signal Applied toa
Growth Range
• 5.0% or above for ADB and 2.5% or above for ADF
• Below 5.0% for ADB and below 2.5% for ADF
MDG 2015
• At or above MDG target
• Below MDG target and stable
• Below MDG target and improved
• Below MDG target and deteriorated
Progress (non-MDG) Annual
• Above baseline
• Below baseline
Level 1: indicators 3–4, 9, 11–13,18–20
Achievement rate Annual
• At or above target
• Below targetLevel 2: Core Operational Results
Point target 2016• At or above target
• Below target
Level 2: Quality at CompletionLevel 3: indicators 3, 6–9, 11, 17–19, 20 (core operational areas), 22, 23, 25, 26Level 4: indicators 2, 6, 9
Composite Signals
Signals and Scoring Methods
Signal
Good Two-thirds or more of results indicators in the group achieved a green signal.
Mixed Half or more but less than two-thirds of results indicators in the group achieved a green signal.
Poor Less than half of results indicators in the group achieved a green signal.
27
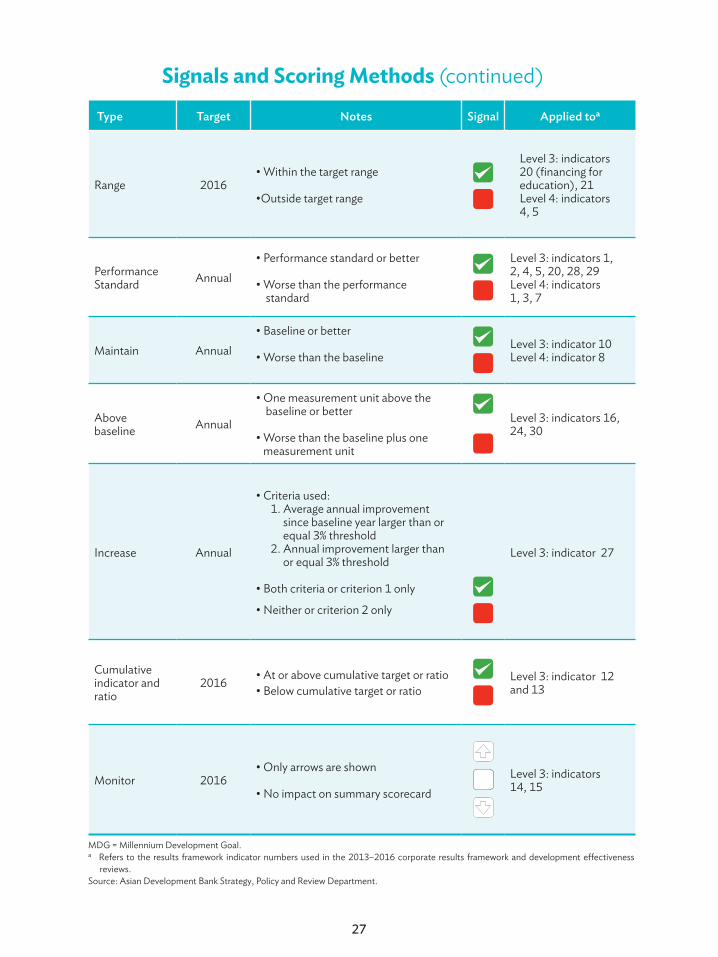
Type Target Notes Signal Applied toa
Range 2016• Within the target range
•Outside target range
Level 3: indicators 20 (financing for education), 21Level 4: indicators 4, 5
PerformanceStandard Annual
• Performance standard or better
• Worse than the performance standard
Level 3: indicators 1,2, 4, 5, 20, 28, 29Level 4: indicators 1, 3, 7
Maintain Annual• Baseline or better
• Worse than the baselineLevel 3: indicator 10Level 4: indicator 8
Abovebaseline Annual
• One measurement unit above the baseline or better
• Worse than the baseline plus one measurement unit
Level 3: indicators 16, 24, 30
Increase Annual
• Criteria used: 1. Average annual improvement since baseline year larger than or equal 3% threshold 2. Annual improvement larger than or equal 3% threshold
• Both criteria or criterion 1 only
• Neither or criterion 2 only
Level 3: indicator 27
Cumulativeindicator and ratio
2016 • At or above cumulative target or ratio• Below cumulative target or ratio
Level 3: indicator 12 and 13
Monitor 2016• Only arrows are shown
• No impact on summary scorecardLevel 3: indicators14, 15
Signals and Scoring Methods (continued)
MDG = Millennium Development Goal.a Refers to the results framework indicator numbers used in the 2013–2016 corporate results framework and development effectiveness reviews.Source: Asian Development Bank Strategy, Policy and Review Department.

28
2016 Development Effectiveness Review
STANDARD EXPLANATORY DATA
INDICATORS
30
2016 Development Effectiveness Review
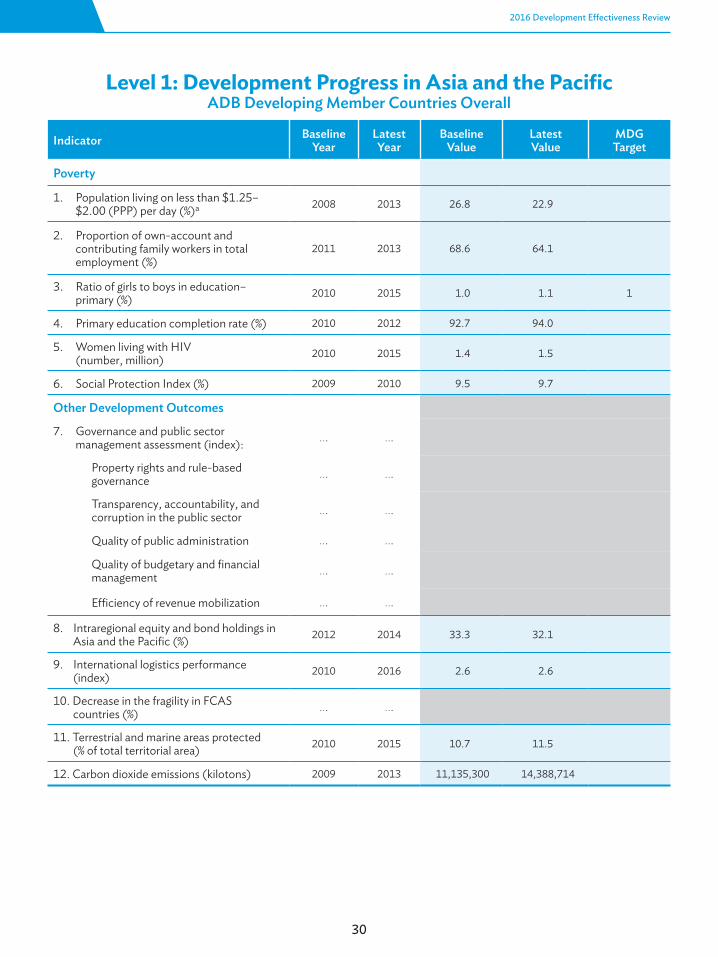
Level 1: Development Progress in Asia and the PacificADB Developing Member Countries Overall
Indicator Baseline Year
Latest Year
Baseline Value
Latest Value
MDG Target
Poverty
1. Population living on less than $1.25– $2.00 (PPP) per day (%)a 2008 2013 26.8 22.9
2. Proportion of own-account and contributing family workers in total employment (%)
2011 2013 68.6 64.1
3. Ratio of girls to boys in education– primary (%) 2010 2015 1.0 1.1 1
4. Primary education completion rate (%) 2010 2012 92.7 94.0
5. Women living with HIV (number, million) 2010 2015 1.4 1.5
6. Social Protection Index (%) 2009 2010 9.5 9.7
Other Development Outcomes
7. Governance and public sector management assessment (index): …. ….
Property rights and rule-based governance …. ….
Transparency, accountability, andcorruption in the public sector …. ….
Quality of public administration …. ….
Quality of budgetary and financialmanagement …. ….
Efficiency of revenue mobilization …. ….
8. Intraregional equity and bond holdings in Asia and the Pacific (%) 2012 2014 33.3 32.1
9. International logistics performance (index) 2010 2016 2.6 2.6
10. Decrease in the fragility in FCAS countries (%) …. ….
11. Terrestrial and marine areas protected (% of total territorial area) 2010 2015 10.7 11.5
12. Carbon dioxide emissions (kilotons) 2009 2013 11,135,300 14,388,714
31
Level 1
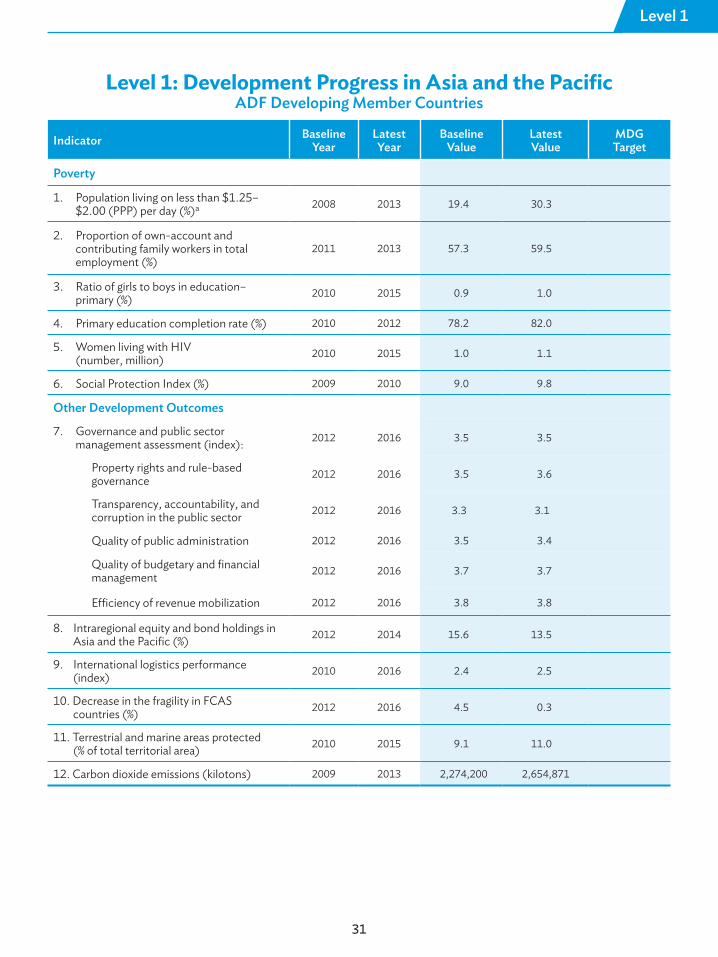
Level 1: Development Progress in Asia and the PacificADF Developing Member Countries
Indicator Baseline Year
Latest Year
Baseline Value
Latest Value
MDG Target
Poverty
1. Population living on less than $1.25– $2.00 (PPP) per day (%)a 2008 2013 19.4 30.3
2. Proportion of own-account and contributing family workers in total employment (%)
2011 2013 57.3 59.5
3. Ratio of girls to boys in education– primary (%) 2010 2015 0.9 1.0
4. Primary education completion rate (%) 2010 2012 78.2 82.0
5. Women living with HIV (number, million) 2010 2015 1.0 1.1
6. Social Protection Index (%) 2009 2010 9.0 9.8
Other Development Outcomes
7. Governance and public sector management assessment (index): 2012 2016 3.5 3.5
Property rights and rule-based governance 2012 2016 3.5 3.6
Transparency, accountability, andcorruption in the public sector 2012 2016 3.3 3.1
Quality of public administration 2012 2016 3.5 3.4
Quality of budgetary and financialmanagement 2012 2016 3.7 3.7
Efficiency of revenue mobilization 2012 2016 3.8 3.8
8. Intraregional equity and bond holdings in Asia and the Pacific (%) 2012 2014 15.6 13.5
9. International logistics performance (index) 2010 2016 2.4 2.5
10. Decrease in the fragility in FCAS countries (%) 2012 2016 4.5 0.3
11. Terrestrial and marine areas protected (% of total territorial area) 2010 2015 9.1 11.0
12. Carbon dioxide emissions (kilotons) 2009 2013 2,274,200 2,654,871
32
2016 Development Effectiveness Review
Level 1: Development Progress in Asia and the PacificADB Developing Member Countries Overall (continued)
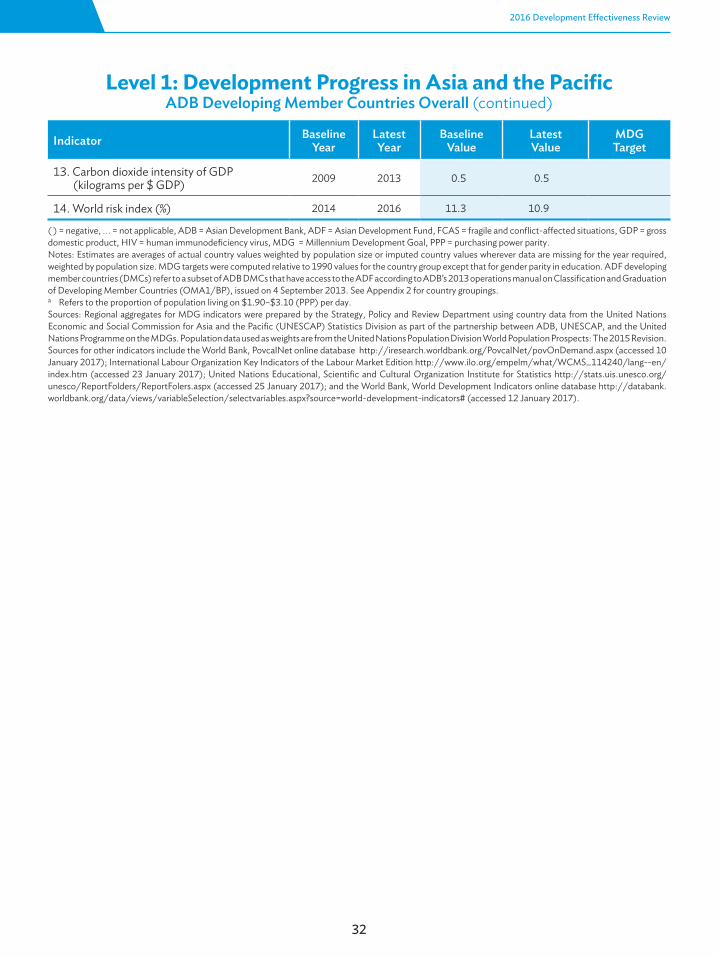
( ) = negative, …. = not applicable, ADB = Asian Development Bank, ADF = Asian Development Fund, FCAS = fragile and conflict-affected situations, GDP = gross domestic product, HIV = human immunodeficiency virus, MDG = Millennium Development Goal, PPP = purchasing power parity.Notes: Estimates are averages of actual country values weighted by population size or imputed country values wherever data are missing for the year required, weighted by population size. MDG targets were computed relative to 1990 values for the country group except that for gender parity in education. ADF developing member countries (DMCs) refer to a subset of ADB DMCs that have access to the ADF according to ADB’s 2013 operations manual on Classification and Graduation of Developing Member Countries (OMA1/BP), issued on 4 September 2013. See Appendix 2 for country groupings.a Refers to the proportion of population living on $1.90–$3.10 (PPP) per day.Sources: Regional aggregates for MDG indicators were prepared by the Strategy, Policy and Review Department using country data from the United Nations Economic and Social Commission for Asia and the Pacific (UNESCAP) Statistics Division as part of the partnership between ADB, UNESCAP, and the United Nations Programme on the MDGs. Population data used as weights are from the United Nations Population Division World Population Prospects: The 2015 Revision. Sources for other indicators include the World Bank, PovcalNet online database http://iresearch.worldbank.org/PovcalNet/povOnDemand.aspx (accessed 10 January 2017); International Labour Organization Key Indicators of the Labour Market Edition http://www.ilo.org/empelm/what/WCMS_114240/lang--en/index.htm (accessed 23 January 2017); United Nations Educational, Scientific and Cultural Organization Institute for Statistics http://stats.uis.unesco.org/unesco/ReportFolders/ReportFolers.aspx (accessed 25 January 2017); and the World Bank, World Development Indicators online database http://databank.worldbank.org/data/views/variableSelection/selectvariables.aspx?source=world-development-indicators# (accessed 12 January 2017).
Indicator Baseline Year
Latest Year
Baseline Value
Latest Value
MDG Target
13. Carbon dioxide intensity of GDP (kilograms per $ GDP) 2009 2013 0.5 0.5
14. World risk index (%) 2014 2016 11.3 10.9
33
Level 1
Level 1: Development Progress in Asia and the PacificADF Developing Member Countries (continued)
Indicator Baseline Year
Latest Year
Baseline Value
Latest Value
MDG Target
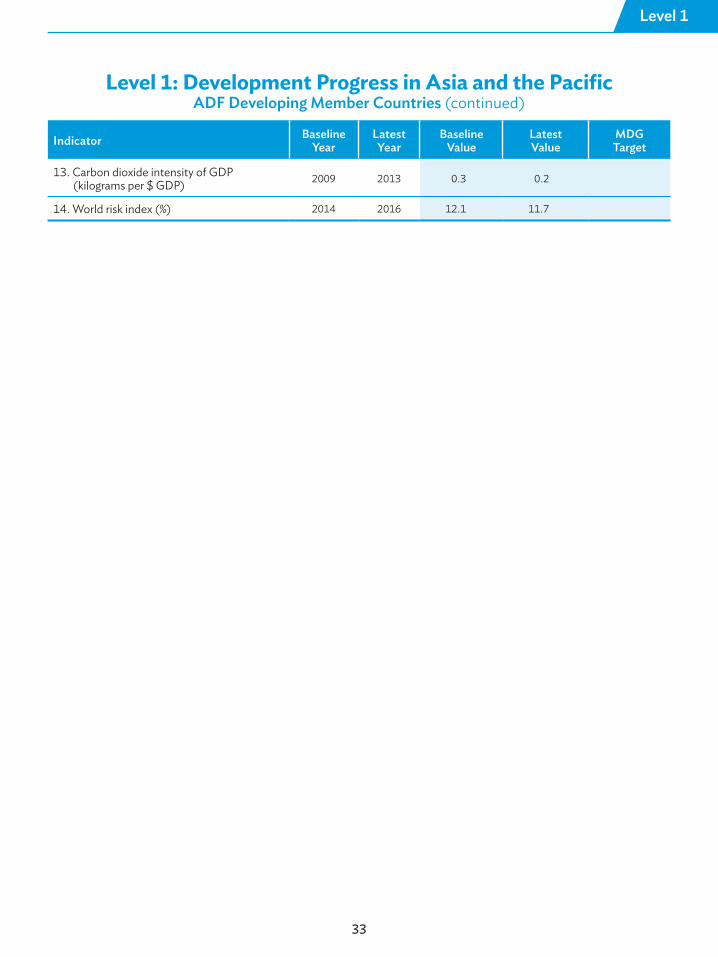
13. Carbon dioxide intensity of GDP (kilograms per $ GDP) 2009 2013 0.3 0.2
14. World risk index (%) 2014 2016 12.1 11.7
2016 Development Effectiveness Review
34
Level 2: ADB’s Contributions to Development ResultsADB Operations Overall
Standard Explanatory Data Indicator Period RY2012
RY2013
RY2014
RY2015
RY2016
Quality at Completion
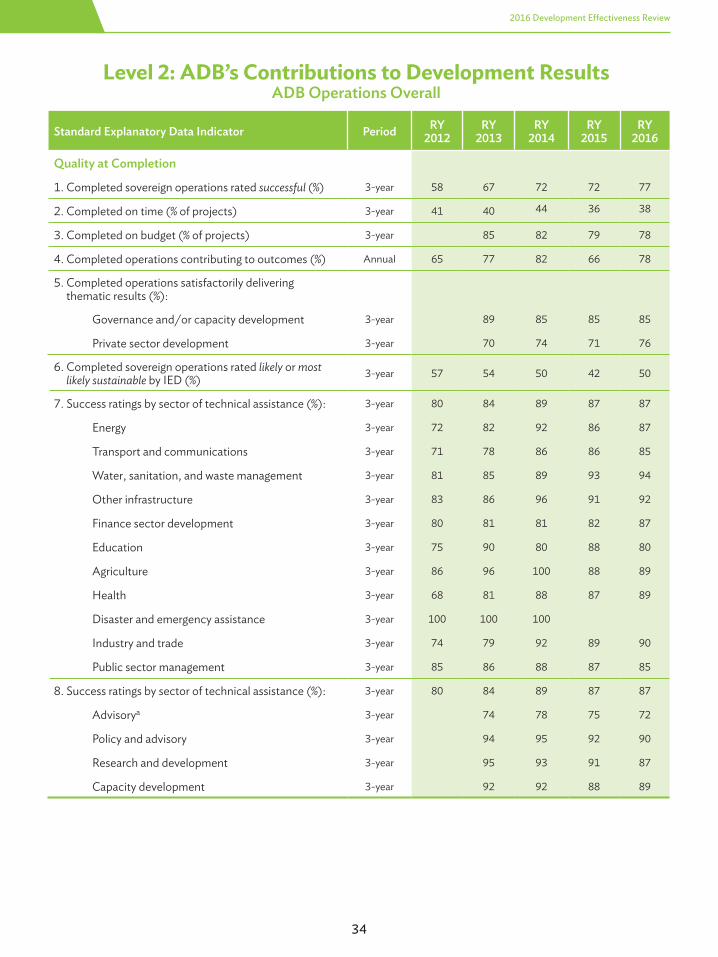
1. Completed sovereign operations rated successful (%) 3-year 58 67 72 72 77
2. Completed on time (% of projects) 3-year 41 40 44 36 38
3. Completed on budget (% of projects) 3-year 85 82 79 78
4. Completed operations contributing to outcomes (%) Annual 65 77 82 66 78
5. Completed operations satisfactorily delivering thematic results (%):
Governance and/or capacity development 3-year 89 85 85 85
Private sector development 3-year 70 74 71 76
6. Completed sovereign operations rated likely or most likely sustainable by IED (%) 3-year 57 54 50 42 50
7. Success ratings by sector of technical assistance (%): 3-year 80 84 89 87 87
Energy 3-year 72 82 92 86 87
Transport and communications 3-year 71 78 86 86 85
Water, sanitation, and waste management 3-year 81 85 89 93 94
Other infrastructure 3-year 83 86 96 91 92
Finance sector development 3-year 80 81 81 82 87
Education 3-year 75 90 80 88 80
Agriculture 3-year 86 96 100 88 89
Health 3-year 68 81 88 87 89
Disaster and emergency assistance 3-year 100 100 100
Industry and trade 3-year 74 79 92 89 90
Public sector management 3-year 85 86 88 87 85
8. Success ratings by sector of technical assistance (%): 3-year 80 84 89 87 87
Advisorya 3-year 74 78 75 72
Policy and advisory 3-year 94 95 92 90
Research and development 3-year 95 93 91 87
Capacity development 3-year 92 92 88 89
Level 2
35
Level 2: ADB’s Contributions to Development ResultsADF Operations
Standard Explanatory Data Indicator Period RY2012
RY2013
RY2014
RY2015
RY2016
Quality at Completion
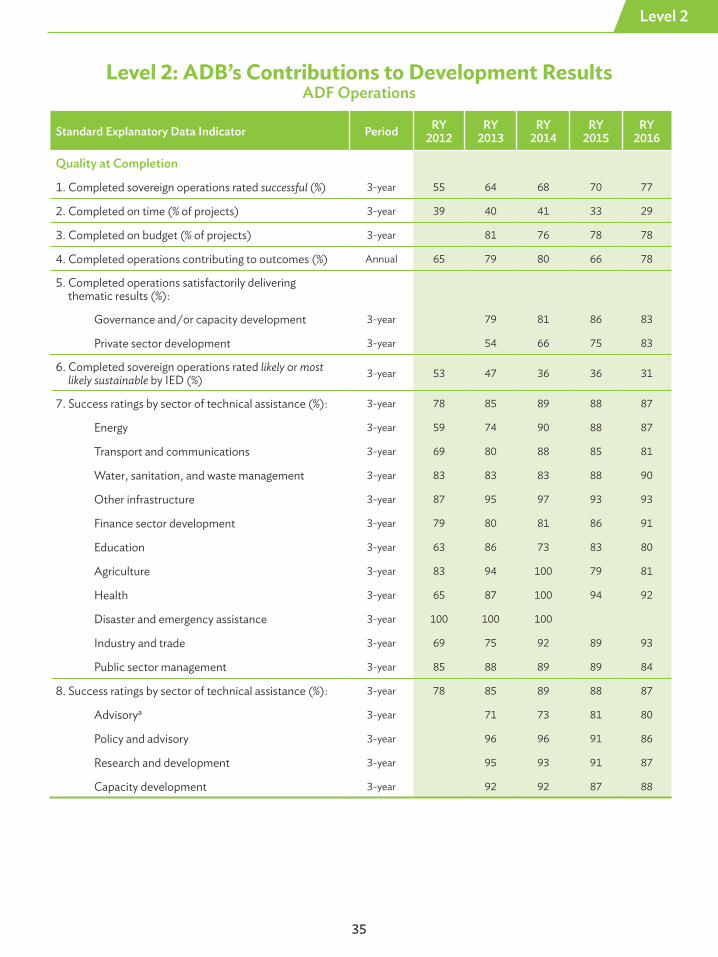
1. Completed sovereign operations rated successful (%) 3-year 55 64 68 70 77
2. Completed on time (% of projects) 3-year 39 40 41 33 29
3. Completed on budget (% of projects) 3-year 81 76 78 78
4. Completed operations contributing to outcomes (%) Annual 65 79 80 66 78
5. Completed operations satisfactorily delivering thematic results (%):
Governance and/or capacity development 3-year 79 81 86 83
Private sector development 3-year 54 66 75 83
6. Completed sovereign operations rated likely or most likely sustainable by IED (%) 3-year 53 47 36 36 31
7. Success ratings by sector of technical assistance (%): 3-year 78 85 89 88 87
Energy 3-year 59 74 90 88 87
Transport and communications 3-year 69 80 88 85 81
Water, sanitation, and waste management 3-year 83 83 83 88 90
Other infrastructure 3-year 87 95 97 93 93
Finance sector development 3-year 79 80 81 86 91
Education 3-year 63 86 73 83 80
Agriculture 3-year 83 94 100 79 81
Health 3-year 65 87 100 94 92
Disaster and emergency assistance 3-year 100 100 100
Industry and trade 3-year 69 75 92 89 93
Public sector management 3-year 85 88 89 89 84
8. Success ratings by sector of technical assistance (%): 3-year 78 85 89 88 87
Advisorya 3-year 71 73 81 80
Policy and advisory 3-year 96 96 91 86
Research and development 3-year 95 93 91 87
Capacity development 3-year 92 92 87 88
2016 Development Effectiveness Review
36
Level 2: ADB’s Contributions to Development ResultsADB Operations Overall (continued)
Standard Explanatory Data Indicator Period RY2012
RY2013
RY2014
RY2015
RY2016
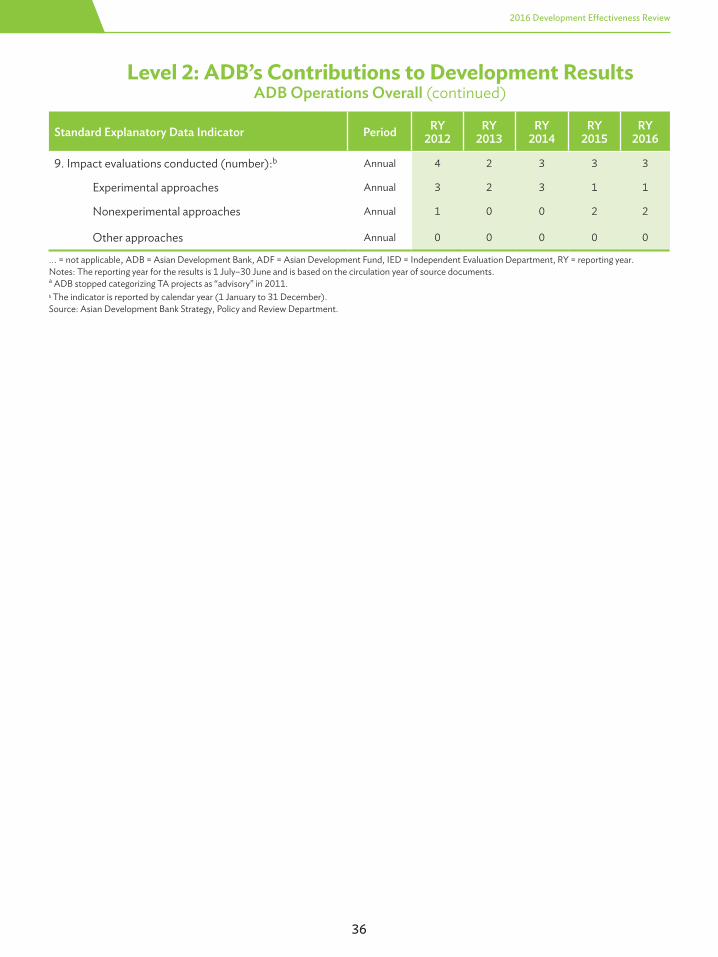
9. Impact evaluations conducted (number):b Annual 4 2 3 3 3
Experimental approaches Annual 3 2 3 1 1
Nonexperimental approaches Annual 1 0 0 2 2
Other approaches Annual 0 0 0 0 0
…. = not applicable, ADB = Asian Development Bank, ADF = Asian Development Fund, IED = Independent Evaluation Department, RY = reporting year.Notes: The reporting year for the results is 1 July–30 June and is based on the circulation year of source documents. a ADB stopped categorizing TA projects as “advisory” in 2011.b The indicator is reported by calendar year (1 January to 31 December).Source: Asian Development Bank Strategy, Policy and Review Department.
Level 2
37
Level 2: ADB’s Contributions to Development ResultsADF Operations (continued)
Standard Explanatory Data Indicator Period RY2012
RY2013
RY2014
RY2015
RY2016
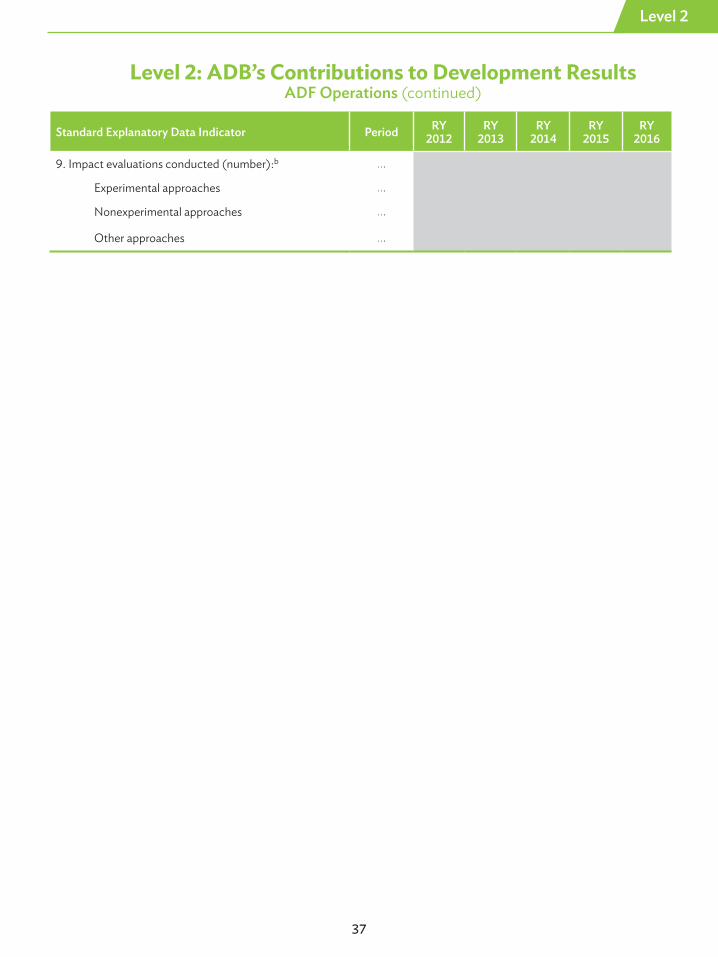
9. Impact evaluations conducted (number):b ….
Experimental approaches ….
Nonexperimental approaches ….
Other approaches ….
2016 Development Effectiveness Review
38
Level 2: ADB’s Contributions to Development ResultsADB Operations Overall (continued)
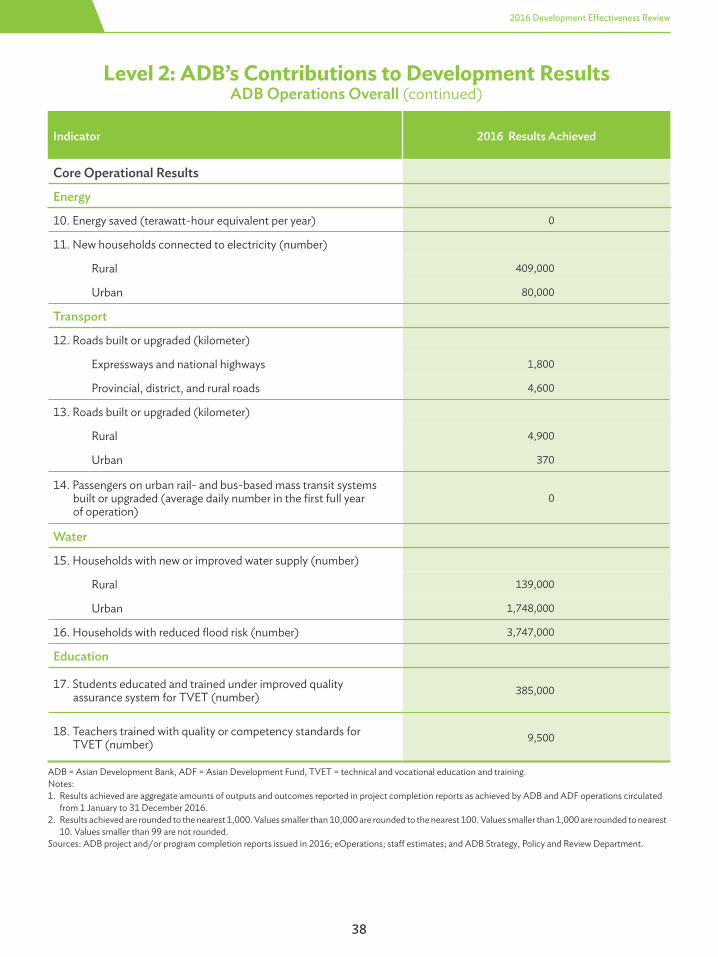
ADB = Asian Development Bank, ADF = Asian Development Fund, TVET = technical and vocational education and training.Notes:1. Results achieved are aggregate amounts of outputs and outcomes reported in project completion reports as achieved by ADB and ADF operations circulated from 1 January to 31 December 2016.2. Results achieved are rounded to the nearest 1,000. Values smaller than 10,000 are rounded to the nearest 100. Values smaller than 1,000 are rounded to nearest 10. Values smaller than 99 are not rounded.Sources: ADB project and/or program completion reports issued in 2016; eOperations; staff estimates; and ADB Strategy, Policy and Review Department.
Indicator 2016 Results Achieved
Core Operational Results
Energy
10. Energy saved (terawatt-hour equivalent per year) 0
11. New households connected to electricity (number)
Rural 409,000
Urban 80,000
Transport
12. Roads built or upgraded (kilometer)
Expressways and national highways 1,800
Provincial, district, and rural roads 4,600
13. Roads built or upgraded (kilometer)
Rural 4,900
Urban 370
14. Passengers on urban rail- and bus-based mass transit systems built or upgraded (average daily number in the first full year of operation)
0
Water
15. Households with new or improved water supply (number)
Rural 139,000
Urban 1,748,000
16. Households with reduced flood risk (number) 3,747,000
Education
17. Students educated and trained under improved quality assurance system for TVET (number) 385,000
18. Teachers trained with quality or competency standards for TVET (number) 9,500
Level 2
39
Level 2: ADB’s Contributions to Development ResultsADF Operations (continued)
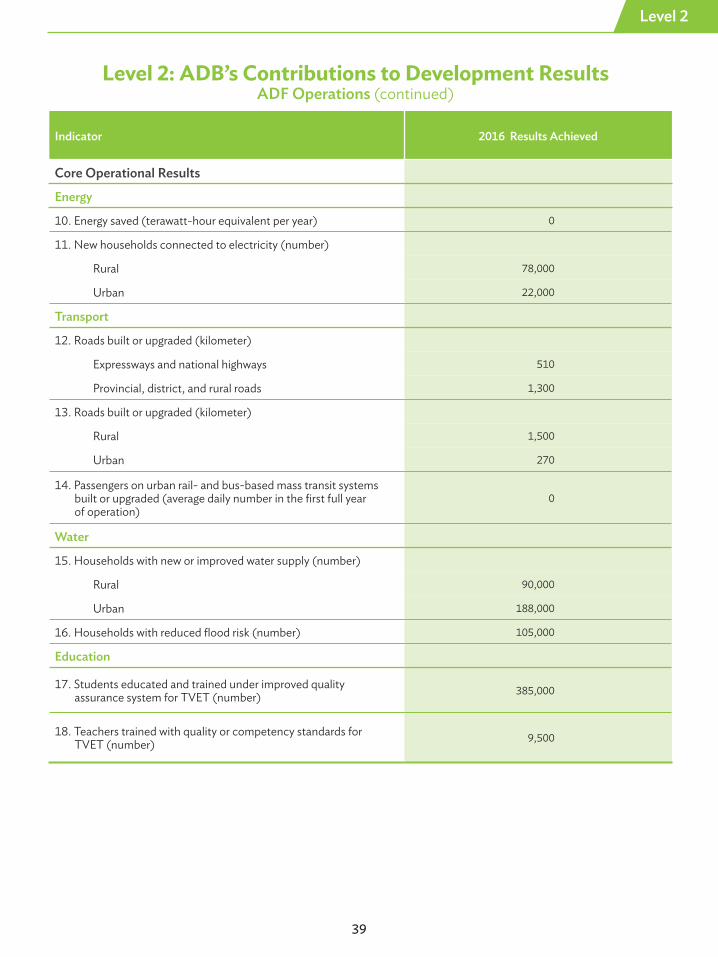
Indicator 2016 Results Achieved
Core Operational Results
Energy
10. Energy saved (terawatt-hour equivalent per year) 0
11. New households connected to electricity (number)
Rural 78,000
Urban 22,000
Transport
12. Roads built or upgraded (kilometer)
Expressways and national highways 510
Provincial, district, and rural roads 1,300
13. Roads built or upgraded (kilometer)
Rural 1,500
Urban 270
14. Passengers on urban rail- and bus-based mass transit systems built or upgraded (average daily number in the first full year of operation)
0
Water
15. Households with new or improved water supply (number)
Rural 90,000
Urban 188,000
16. Households with reduced flood risk (number) 105,000
Education
17. Students educated and trained under improved quality assurance system for TVET (number) 385,000
18. Teachers trained with quality or competency standards for TVET (number) 9,500
2016 Development Effectiveness Review
40
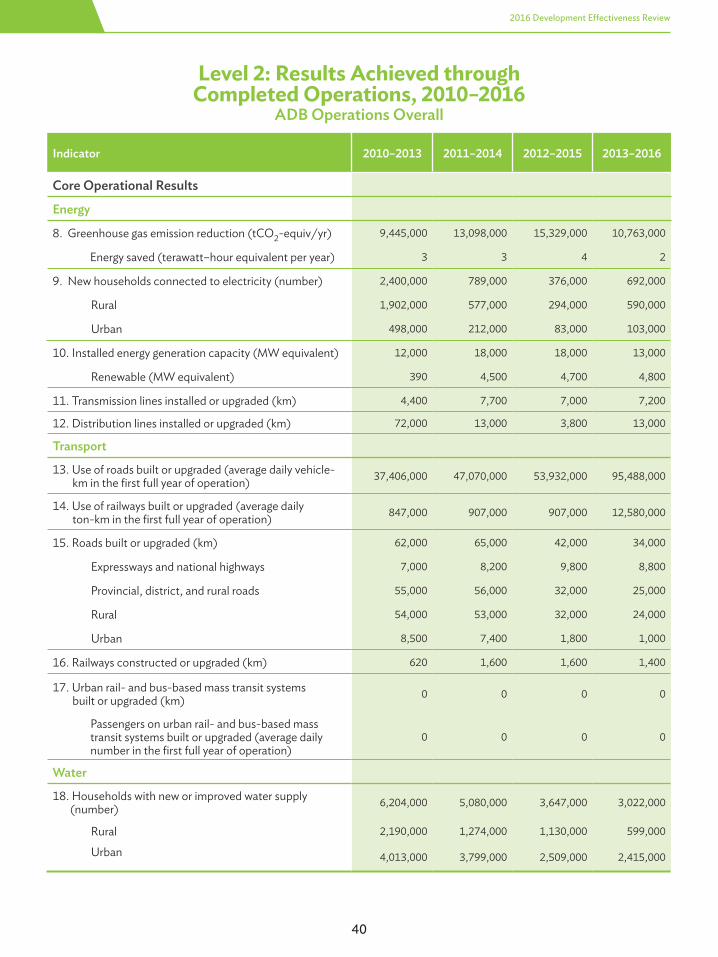
Level 2: Results Achieved throughCompleted Operations, 2010–2016
ADB Operations Overall
Indicator 2010–2013 2011–2014 2012–2015 2013–2016
Core Operational Results
Energy
8. Greenhouse gas emission reduction (tCO2-equiv/yr) 9,445,000 13,098,000 15,329,000 10,763,000
Energy saved (terawatt–hour equivalent per year) 3 3 4 2
9. New households connected to electricity (number) 2,400,000 789,000 376,000 692,000
Rural 1,902,000 577,000 294,000 590,000
Urban 498,000 212,000 83,000 103,000
10. Installed energy generation capacity (MW equivalent) 12,000 18,000 18,000 13,000
Renewable (MW equivalent) 390 4,500 4,700 4,800
11. Transmission lines installed or upgraded (km) 4,400 7,700 7,000 7,200
12. Distribution lines installed or upgraded (km) 72,000 13,000 3,800 13,000
Transport
13. Use of roads built or upgraded (average daily vehicle- km in the first full year of operation) 37,406,000 47,070,000 53,932,000 95,488,000
14. Use of railways built or upgraded (average daily ton-km in the first full year of operation) 847,000 907,000 907,000 12,580,000
15. Roads built or upgraded (km) 62,000 65,000 42,000 34,000
Expressways and national highways 7,000 8,200 9,800 8,800
Provincial, district, and rural roads 55,000 56,000 32,000 25,000
Rural 54,000 53,000 32,000 24,000
Urban 8,500 7,400 1,800 1,000
16. Railways constructed or upgraded (km) 620 1,600 1,600 1,400
17. Urban rail- and bus-based mass transit systems built or upgraded (km) 0 0 0 0
Passengers on urban rail- and bus-based mass transit systems built or upgraded (average daily number in the first full year of operation)
0 0 0 0
Water
18. Households with new or improved water supply (number) 6,204,000 5,080,000 3,647,000 3,022,000
Rural 2,190,000 1,274,000 1,130,000 599,000
Urban 4,013,000 3,799,000 2,509,000 2,415,000

Level 2
41
Level 2: Results Achieved throughCompleted Operations, 2010–2016
ADF Operations
Indicator 2010–2013 2011–2014 2012–2015 2013–2016
Core Operational Results
Energy
8. Greenhouse gas emission reduction (tCO2-equiv/yr) 600,000 600,000 600,000 659,000
Energy saved (terawatt–hour equivalent per year) 0 0 0 0
9. New households connected to electricity (number) 1,080,000 504,000 92,000 125,000
Rural 808,000 374,000 92,000 103,000
Urban 272,000 129,000 0 22,000
10. Installed energy generation capacity (MW equivalent) 230 230 220 550
Renewable (MW equivalent) 0 0.11 0.11 140
11. Transmission lines installed or upgraded (km) 1,300 1,600 420 650
12. Distribution lines installed or upgraded (km) 14,000 9,700 3 230
Transport
13. Use of roads built or upgraded (average daily vehicle- km in the first full year of operation) 11,275,000 10,514,000 15,876,000 20,352,000
14. Use of railways built or upgraded (average daily ton-km in the first full year of operation) 488,000 488,000 488,000 488,000
15. Roads built or upgraded (km) 31,000 25,000 11,000 8,600
Expressways and national highways 2,300 2,500 3,300 3,100
Provincial, district, and rural roads 29,000 22,000 7,800 5,500
Rural 28,000 21,000 7,700 5,700
Urban 3,100 2,600 1,300 690
16. Railways constructed or upgraded (km) 75 75 75 75
17. Urban rail- and bus-based mass transit systems built or upgraded (km) 0 0 0 0
Passengers on urban rail- and bus-based mass transit systems built or upgraded (average daily number in the first full year of operation)
0 0 0 0
Water
18. Households with new or improved water supply (number) 2,023,000 1,002,000 758,000 531,000
Rural 1,514,000 579,000 456,000 301,000
Urban 509,000 415,000 295,000 222,000

2016 Development Effectiveness Review
42
Level 2: Results Achieved throughCompleted Operations, 2010–2016
ADB Operations Overall (continued)
Indicator 2010–2013 2011–2014 2012–2015 2013–2016
19. Households with new or improved sanitation (number) 1,890,000 1,898,000 4,145,000 3,798,000
20. Wastewater treatment capacity added or improved (m3 per day) 2,668,000 3,142,000 3,370,000 1,656,000
21. Water supply pipes installed or upgraded (length of network in km) 28,000 27,000 23,000 19,000
22. Land improved through irrigation, drainage, and/or flood management (ha) 13,955,000 2,336,000 2,493,000 3,281,000
Households with reduced flood risk (number) 9,671,000 9,673,000 4,438,000 5,667,000
Finance
23. Trade finance supported ($ million per year) 14,000 15,000 14,000 14,000
24. Microfinance loan accounts opened or end borrowers reached (number) 2,702,000 2,661,000 4,415,000 5,720,000
Female 2,177,000 2,146,000 1,456,000 2,389,000
Male 525,000 515,000 160,000 531,000
25. Small and medium-sized enterprise loan accounts opened or end borrowers reached (number) 58,000 94,000 78,000 91,000
Education
26. Students benefiting from new or improved educational facilities (number) 17,599,000 17,277,000 23,781,000 20,215,000
Female 8,641,000 8,489,000 11,942,000 10,100,000
Male 8,958,000 8,787,000 11,837,000 10,114,000
27. Students educated and trained under improved quality assurance systems (number) 20,120,000 28,319,000 35,015,000 38,330,000
Female 10,117,000 14,445,000 18,068,000 19,670,000
Male 9,957,000 13,828,000 16,901,000 18,614,000
Technical and vocational education and training 6,000 21,000 20,000 399,000
28. Teachers trained with quality or competency standards (number) 719,000 1,666,000 2,099,000 2,351,000
Female 316,000 659,000 801,000 929,000
Male 403,000 1,007,000 1,298,000 1,421,000
Technical and vocational education and training 2,400 3,000 2,200 12,000
Level 2
43
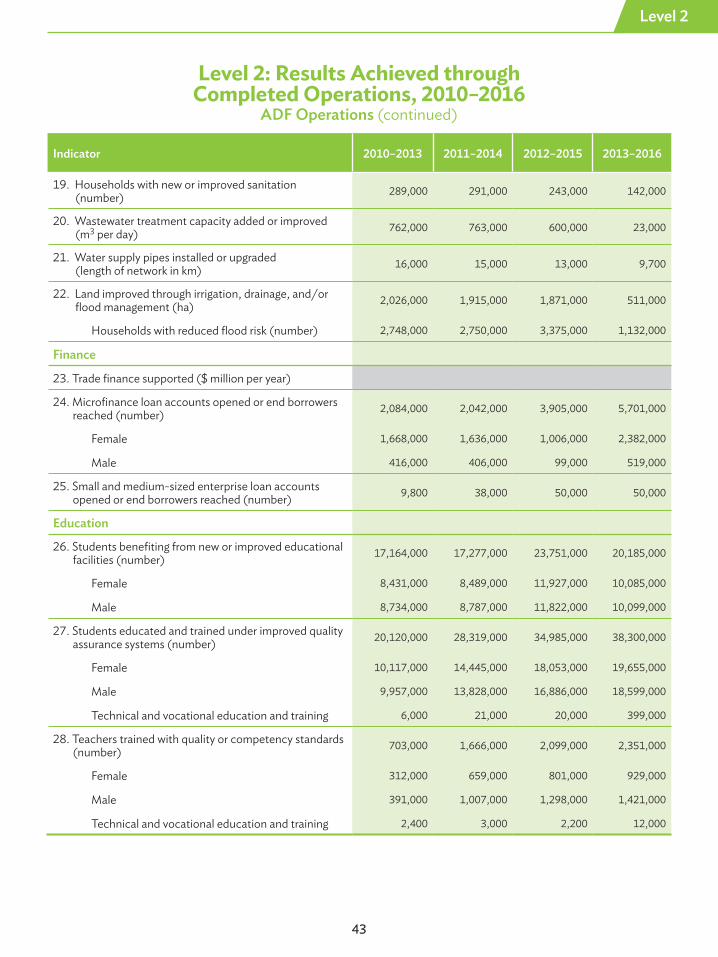
Level 2: Results Achieved throughCompleted Operations, 2010–2016
ADF Operations (continued)
Indicator 2010–2013 2011–2014 2012–2015 2013–2016
19. Households with new or improved sanitation (number) 289,000 291,000 243,000 142,000
20. Wastewater treatment capacity added or improved (m3 per day) 762,000 763,000 600,000 23,000
21. Water supply pipes installed or upgraded (length of network in km) 16,000 15,000 13,000 9,700
22. Land improved through irrigation, drainage, and/or flood management (ha) 2,026,000 1,915,000 1,871,000 511,000
Households with reduced flood risk (number) 2,748,000 2,750,000 3,375,000 1,132,000
Finance
23. Trade finance supported ($ million per year)
24. Microfinance loan accounts opened or end borrowers reached (number) 2,084,000 2,042,000 3,905,000 5,701,000
Female 1,668,000 1,636,000 1,006,000 2,382,000
Male 416,000 406,000 99,000 519,000
25. Small and medium-sized enterprise loan accounts opened or end borrowers reached (number) 9,800 38,000 50,000 50,000
Education
26. Students benefiting from new or improved educational facilities (number) 17,164,000 17,277,000 23,751,000 20,185,000
Female 8,431,000 8,489,000 11,927,000 10,085,000
Male 8,734,000 8,787,000 11,822,000 10,099,000
27. Students educated and trained under improved quality assurance systems (number) 20,120,000 28,319,000 34,985,000 38,300,000
Female 10,117,000 14,445,000 18,053,000 19,655,000
Male 9,957,000 13,828,000 16,886,000 18,599,000
Technical and vocational education and training 6,000 21,000 20,000 399,000
28. Teachers trained with quality or competency standards (number) 703,000 1,666,000 2,099,000 2,351,000
Female 312,000 659,000 801,000 929,000
Male 391,000 1,007,000 1,298,000 1,421,000
Technical and vocational education and training 2,400 3,000 2,200 12,000
2016 Development Effectiveness Review
44
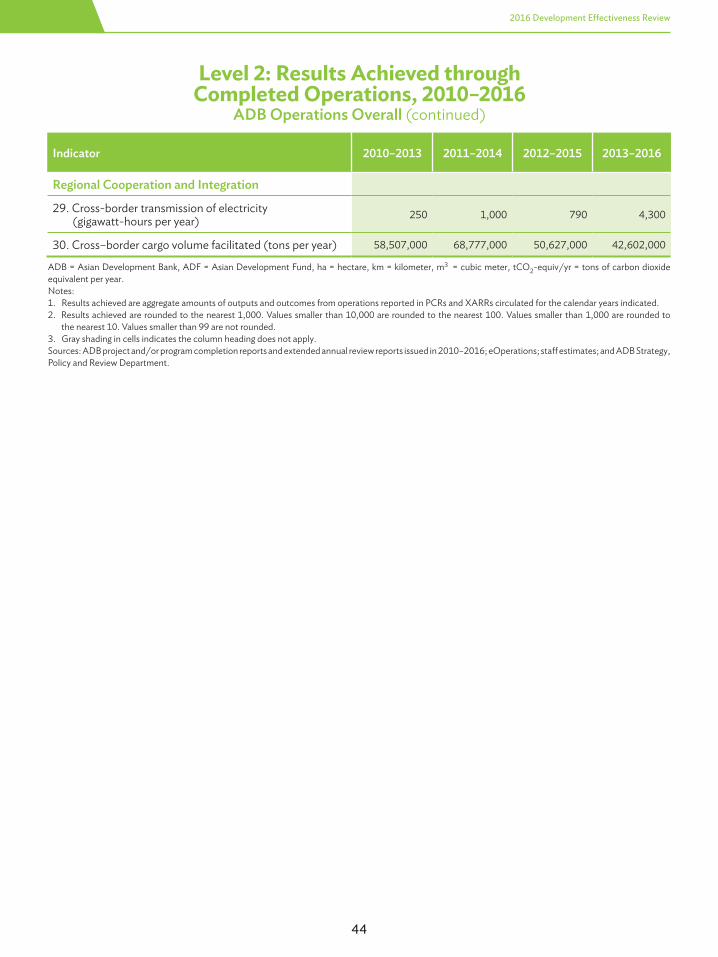
ADB = Asian Development Bank, ADF = Asian Development Fund, ha = hectare, km = kilometer, m3 = cubic meter, tCO2-equiv/yr = tons of carbon dioxide equivalent per year.Notes: 1. Results achieved are aggregate amounts of outputs and outcomes from operations reported in PCRs and XARRs circulated for the calendar years indicated. 2. Results achieved are rounded to the nearest 1,000. Values smaller than 10,000 are rounded to the nearest 100. Values smaller than 1,000 are rounded to the nearest 10. Values smaller than 99 are not rounded. 3. Gray shading in cells indicates the column heading does not apply.Sources: ADB project and/or program completion reports and extended annual review reports issued in 2010–2016; eOperations; staff estimates; and ADB Strategy, Policy and Review Department.
Indicator 2010–2013 2011–2014 2012–2015 2013–2016
Regional Cooperation and Integration
29. Cross-border transmission of electricity (gigawatt-hours per year) 250 1,000 790 4,300
30. Cross–border cargo volume facilitated (tons per year) 58,507,000 68,777,000 50,627,000 42,602,000
Level 2: Results Achieved throughCompleted Operations, 2010–2016
ADB Operations Overall (continued)
Level 2
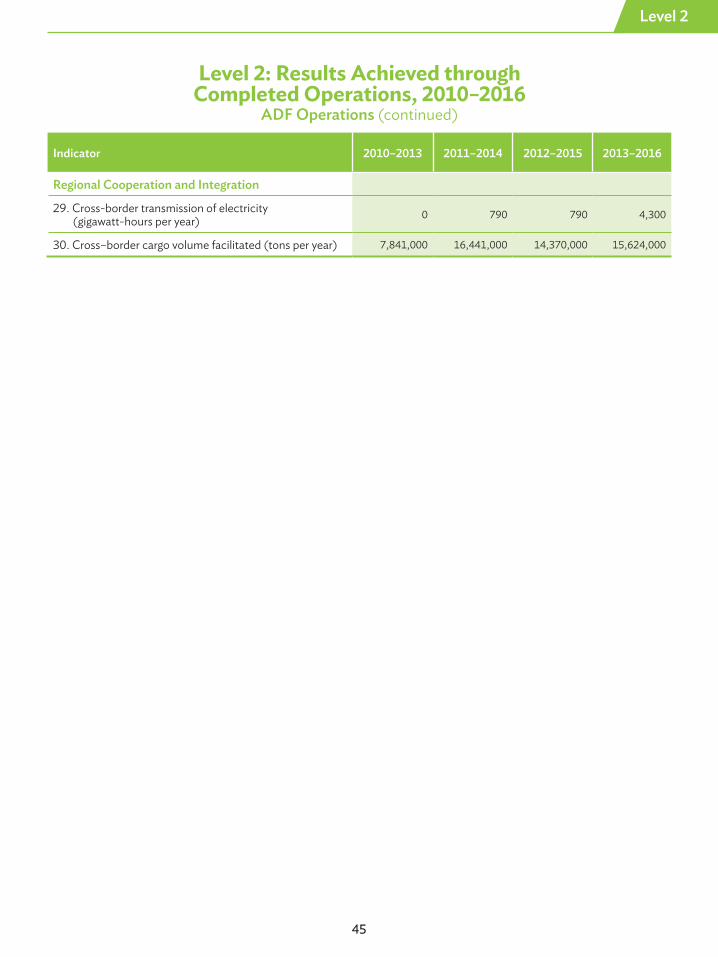
45
Indicator 2010–2013 2011–2014 2012–2015 2013–2016
Regional Cooperation and Integration
29. Cross-border transmission of electricity (gigawatt-hours per year) 0 790 790 4,300
30. Cross–border cargo volume facilitated (tons per year) 7,841,000 16,441,000 14,370,000 15,624,000
Level 2: Results Achieved throughCompleted Operations, 2010–2016
ADF Operations (continued)
2016 Development Effectiveness Review
46
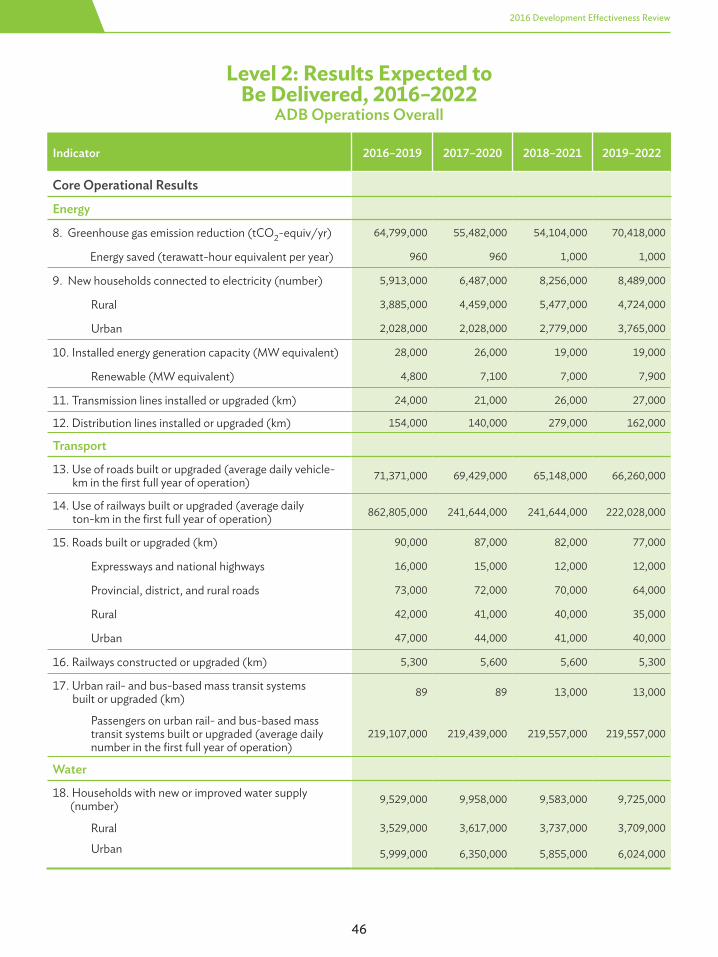
Level 2: Results Expected toBe Delivered, 2016–2022
ADB Operations Overall
Indicator 2016–2019 2017–2020 2018–2021 2019–2022
Core Operational Results
Energy
8. Greenhouse gas emission reduction (tCO2-equiv/yr) 64,799,000 55,482,000 54,104,000 70,418,000
Energy saved (terawatt-hour equivalent per year) 960 960 1,000 1,000
9. New households connected to electricity (number) 5,913,000 6,487,000 8,256,000 8,489,000
Rural 3,885,000 4,459,000 5,477,000 4,724,000
Urban 2,028,000 2,028,000 2,779,000 3,765,000
10. Installed energy generation capacity (MW equivalent) 28,000 26,000 19,000 19,000
Renewable (MW equivalent) 4,800 7,100 7,000 7,900
11. Transmission lines installed or upgraded (km) 24,000 21,000 26,000 27,000
12. Distribution lines installed or upgraded (km) 154,000 140,000 279,000 162,000
Transport
13. Use of roads built or upgraded (average daily vehicle- km in the first full year of operation) 71,371,000 69,429,000 65,148,000 66,260,000
14. Use of railways built or upgraded (average daily ton-km in the first full year of operation) 862,805,000 241,644,000 241,644,000 222,028,000
15. Roads built or upgraded (km) 90,000 87,000 82,000 77,000
Expressways and national highways 16,000 15,000 12,000 12,000
Provincial, district, and rural roads 73,000 72,000 70,000 64,000
Rural 42,000 41,000 40,000 35,000
Urban 47,000 44,000 41,000 40,000
16. Railways constructed or upgraded (km) 5,300 5,600 5,600 5,300
17. Urban rail- and bus-based mass transit systems built or upgraded (km) 89 89 13,000 13,000
Passengers on urban rail- and bus-based mass transit systems built or upgraded (average daily number in the first full year of operation)
219,107,000 219,439,000 219,557,000 219,557,000
Water
18. Households with new or improved water supply (number) 9,529,000 9,958,000 9,583,000 9,725,000
Rural 3,529,000 3,617,000 3,737,000 3,709,000
Urban 5,999,000 6,350,000 5,855,000 6,024,000
Level 2
47
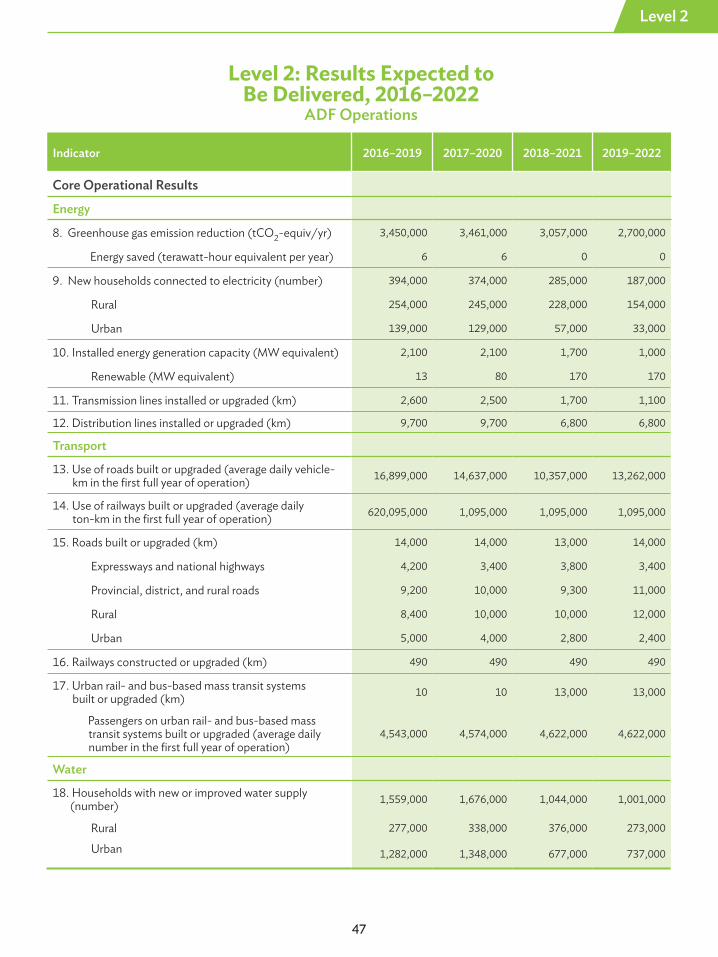
Level 2: Results Expected toBe Delivered, 2016–2022
ADF Operations
Indicator 2016–2019 2017–2020 2018–2021 2019–2022
Core Operational Results
Energy
8. Greenhouse gas emission reduction (tCO2-equiv/yr) 3,450,000 3,461,000 3,057,000 2,700,000
Energy saved (terawatt-hour equivalent per year) 6 6 0 0
9. New households connected to electricity (number) 394,000 374,000 285,000 187,000
Rural 254,000 245,000 228,000 154,000
Urban 139,000 129,000 57,000 33,000
10. Installed energy generation capacity (MW equivalent) 2,100 2,100 1,700 1,000
Renewable (MW equivalent) 13 80 170 170
11. Transmission lines installed or upgraded (km) 2,600 2,500 1,700 1,100
12. Distribution lines installed or upgraded (km) 9,700 9,700 6,800 6,800
Transport
13. Use of roads built or upgraded (average daily vehicle- km in the first full year of operation) 16,899,000 14,637,000 10,357,000 13,262,000
14. Use of railways built or upgraded (average daily ton-km in the first full year of operation) 620,095,000 1,095,000 1,095,000 1,095,000
15. Roads built or upgraded (km) 14,000 14,000 13,000 14,000
Expressways and national highways 4,200 3,400 3,800 3,400
Provincial, district, and rural roads 9,200 10,000 9,300 11,000
Rural 8,400 10,000 10,000 12,000
Urban 5,000 4,000 2,800 2,400
16. Railways constructed or upgraded (km) 490 490 490 490
17. Urban rail- and bus-based mass transit systems built or upgraded (km) 10 10 13,000 13,000
Passengers on urban rail- and bus-based mass transit systems built or upgraded (average daily number in the first full year of operation)
4,543,000 4,574,000 4,622,000 4,622,000
Water
18. Households with new or improved water supply (number) 1,559,000 1,676,000 1,044,000 1,001,000
Rural 277,000 338,000 376,000 273,000
Urban 1,282,000 1,348,000 677,000 737,000
2016 Development Effectiveness Review
48
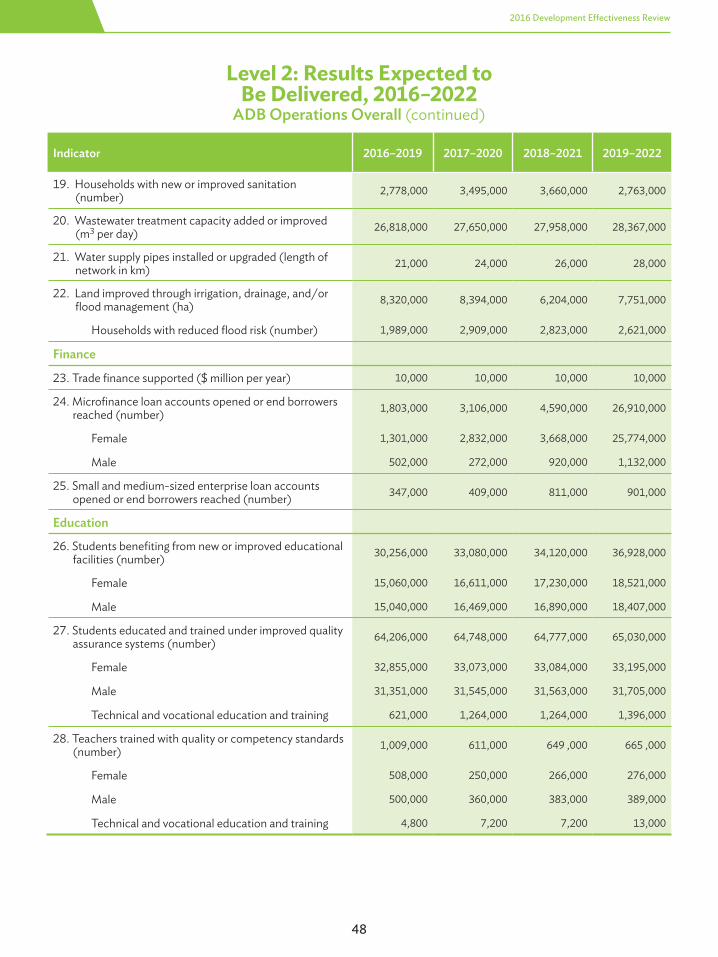
Level 2: Results Expected toBe Delivered, 2016–2022
ADB Operations Overall (continued)
Indicator 2016–2019 2017–2020 2018–2021 2019–2022
19. Households with new or improved sanitation (number) 2,778,000 3,495,000 3,660,000 2,763,000
20. Wastewater treatment capacity added or improved (m3 per day) 26,818,000 27,650,000 27,958,000 28,367,000
21. Water supply pipes installed or upgraded (length of network in km) 21,000 24,000 26,000 28,000
22. Land improved through irrigation, drainage, and/or flood management (ha) 8,320,000 8,394,000 6,204,000 7,751,000
Households with reduced flood risk (number) 1,989,000 2,909,000 2,823,000 2,621,000
Finance
23. Trade finance supported ($ million per year) 10,000 10,000 10,000 10,000
24. Microfinance loan accounts opened or end borrowers reached (number) 1,803,000 3,106,000 4,590,000 26,910,000
Female 1,301,000 2,832,000 3,668,000 25,774,000
Male 502,000 272,000 920,000 1,132,000
25. Small and medium-sized enterprise loan accounts opened or end borrowers reached (number) 347,000 409,000 811,000 901,000
Education
26. Students benefiting from new or improved educational facilities (number) 30,256,000 33,080,000 34,120,000 36,928,000
Female 15,060,000 16,611,000 17,230,000 18,521,000
Male 15,040,000 16,469,000 16,890,000 18,407,000
27. Students educated and trained under improved quality assurance systems (number) 64,206,000 64,748,000 64,777,000 65,030,000
Female 32,855,000 33,073,000 33,084,000 33,195,000
Male 31,351,000 31,545,000 31,563,000 31,705,000
Technical and vocational education and training 621,000 1,264,000 1,264,000 1,396,000
28. Teachers trained with quality or competency standards (number) 1,009,000 611,000 649 ,000 665 ,000
Female 508,000 250,000 266,000 276,000
Male 500,000 360,000 383,000 389,000
Technical and vocational education and training 4,800 7,200 7,200 13,000
Level 2
49
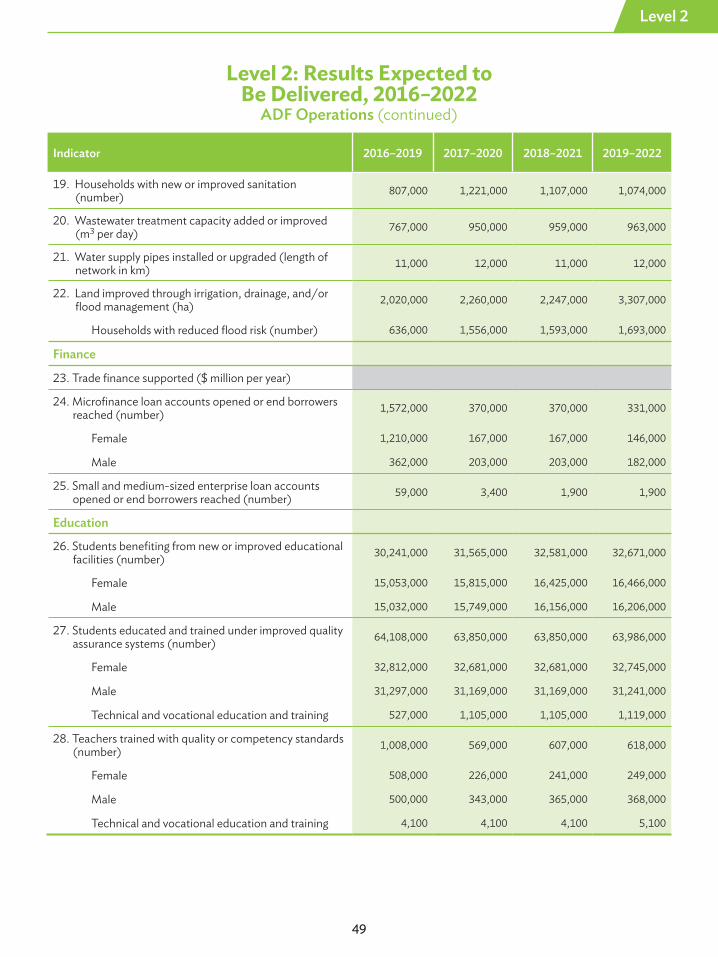
Level 2: Results Expected toBe Delivered, 2016–2022
ADF Operations (continued)
Indicator 2016–2019 2017–2020 2018–2021 2019–2022
19. Households with new or improved sanitation (number) 807,000 1,221,000 1,107,000 1,074,000
20. Wastewater treatment capacity added or improved (m3 per day) 767,000 950,000 959,000 963,000
21. Water supply pipes installed or upgraded (length of network in km) 11,000 12,000 11,000 12,000
22. Land improved through irrigation, drainage, and/or flood management (ha) 2,020,000 2,260,000 2,247,000 3,307,000
Households with reduced flood risk (number) 636,000 1,556,000 1,593,000 1,693,000
Finance
23. Trade finance supported ($ million per year)
24. Microfinance loan accounts opened or end borrowers reached (number) 1,572,000 370,000 370,000 331,000
Female 1,210,000 167,000 167,000 146,000
Male 362,000 203,000 203,000 182,000
25. Small and medium-sized enterprise loan accounts opened or end borrowers reached (number) 59,000 3,400 1,900 1,900
Education
26. Students benefiting from new or improved educational facilities (number) 30,241,000 31,565,000 32,581,000 32,671,000
Female 15,053,000 15,815,000 16,425,000 16,466,000
Male 15,032,000 15,749,000 16,156,000 16,206,000
27. Students educated and trained under improved quality assurance systems (number) 64,108,000 63,850,000 63,850,000 63,986,000
Female 32,812,000 32,681,000 32,681,000 32,745,000
Male 31,297,000 31,169,000 31,169,000 31,241,000
Technical and vocational education and training 527,000 1,105,000 1,105,000 1,119,000
28. Teachers trained with quality or competency standards (number) 1,008,000 569,000 607,000 618,000
Female 508,000 226,000 241,000 249,000
Male 500,000 343,000 365,000 368,000
Technical and vocational education and training 4,100 4,100 4,100 5,100
2016 Development Effectiveness Review
50
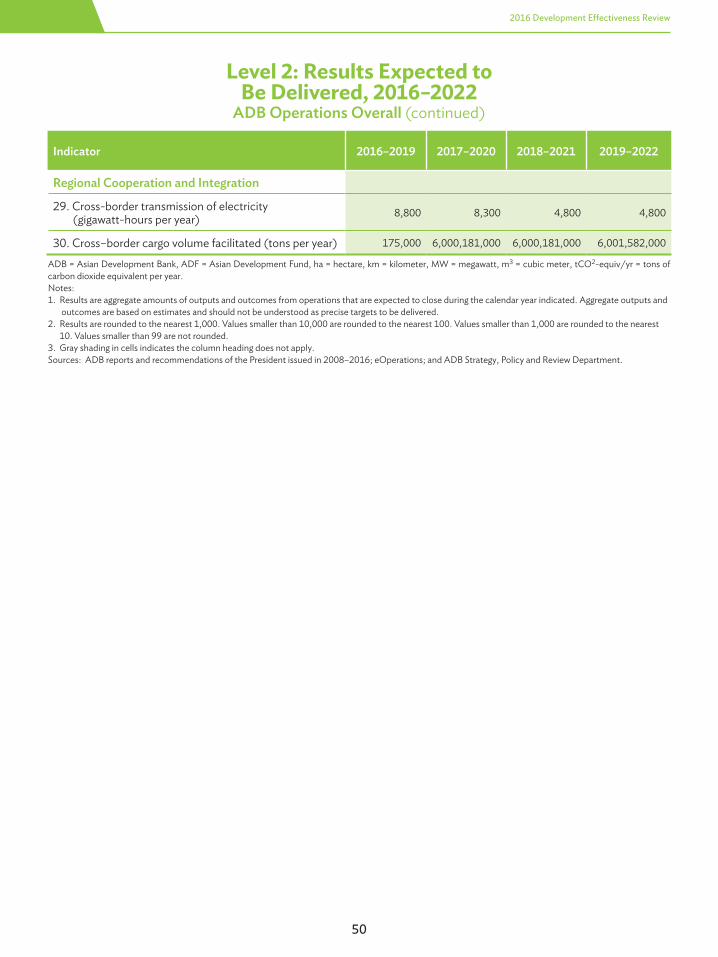
Level 2: Results Expected toBe Delivered, 2016–2022
ADB Operations Overall (continued)
Indicator 2016–2019 2017–2020 2018–2021 2019–2022
Regional Cooperation and Integration
29. Cross-border transmission of electricity (gigawatt-hours per year) 8,800 8,300 4,800 4,800
30. Cross–border cargo volume facilitated (tons per year) 175,000 6,000,181,000 6,000,181,000 6,001,582,000
ADB = Asian Development Bank, ADF = Asian Development Fund, ha = hectare, km = kilometer, MW = megawatt, m3 = cubic meter, tCO2-equiv/yr = tons of carbon dioxide equivalent per year. Notes: 1. Results are aggregate amounts of outputs and outcomes from operations that are expected to close during the calendar year indicated. Aggregate outputs and outcomes are based on estimates and should not be understood as precise targets to be delivered.2. Results are rounded to the nearest 1,000. Values smaller than 10,000 are rounded to the nearest 100. Values smaller than 1,000 are rounded to the nearest 10. Values smaller than 99 are not rounded.3. Gray shading in cells indicates the column heading does not apply.Sources: ADB reports and recommendations of the President issued in 2008–2016; eOperations; and ADB Strategy, Policy and Review Department.

Level 2
51
Indicator 2016–2019 2017–2020 2018–2021 2019–2022
Regional Cooperation and Integration
29. Cross-border transmission of electricity (gigawatt-hours per year) 7,900 5,600 2,100 2,100
30. Cross–border cargo volume facilitated (tons per year) 175,000 6,000,181,000 6,000,181,000 6,000,182,000
Level 2: Results Expected toBe Delivered, 2016–2022
ADF Operations (continued)
52
2016 Development Effectiveness Review
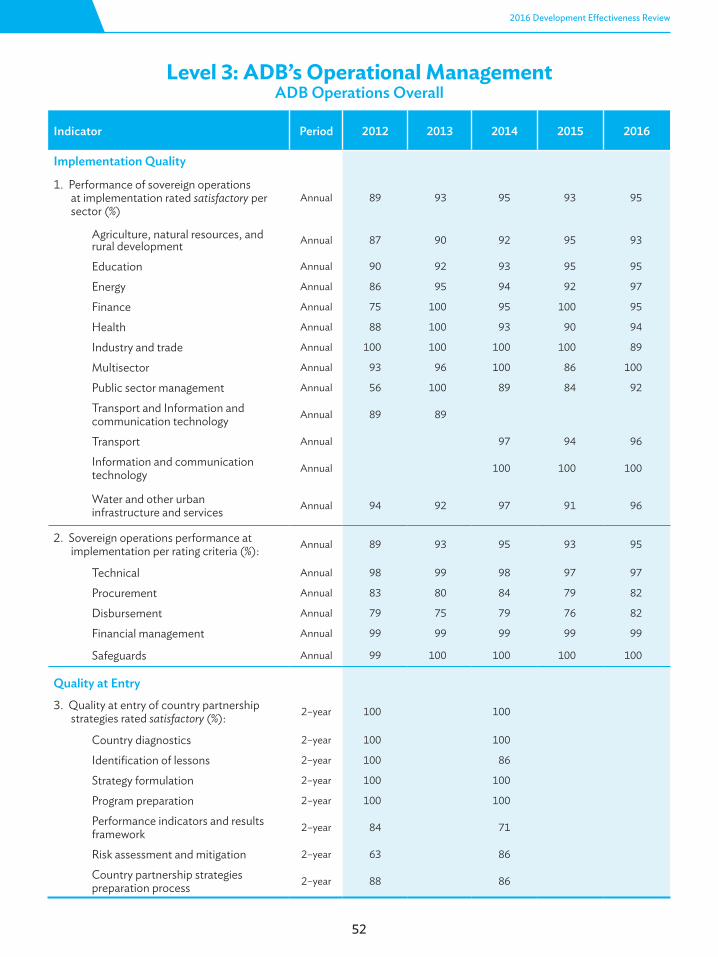
Level 3: ADB’s Operational ManagementADB Operations Overall
Indicator Period 2012 2013 2014 2015 2016
Implementation Quality
1. Performance of sovereign operations at implementation rated satisfactory per sector (%)
Annual 89 93 95 93 95
Agriculture, natural resources, and rural development Annual 87 90 92 95 93
Education Annual 90 92 93 95 95
Energy Annual 86 95 94 92 97
Finance Annual 75 100 95 100 95
Health Annual 88 100 93 90 94
Industry and trade Annual 100 100 100 100 89
Multisector Annual 93 96 100 86 100
Public sector management Annual 56 100 89 84 92
Transport and Information and communication technology Annual 89 89
Transport Annual 97 94 96
Information and communication technology Annual 100 100 100
Water and other urban infrastructure and services Annual 94 92 97 91 96
2. Sovereign operations performance at implementation per rating criteria (%): Annual 89 93 95 93 95
Technical Annual 98 99 98 97 97
Procurement Annual 83 80 84 79 82
Disbursement Annual 79 75 79 76 82
Financial management Annual 99 99 99 99 99
Safeguards Annual 99 100 100 100 100
Quality at Entry3. Quality at entry of country partnership strategies rated satisfactory (%): 2–year 100 100
Country diagnostics 2–year 100 100
Identification of lessons 2–year 100 86
Strategy formulation 2–year 100 100
Program preparation 2–year 100 100
Performance indicators and results framework 2–year 84 71
Risk assessment and mitigation 2–year 63 86
Country partnership strategies preparation process 2–year 88 86
53
Level 3
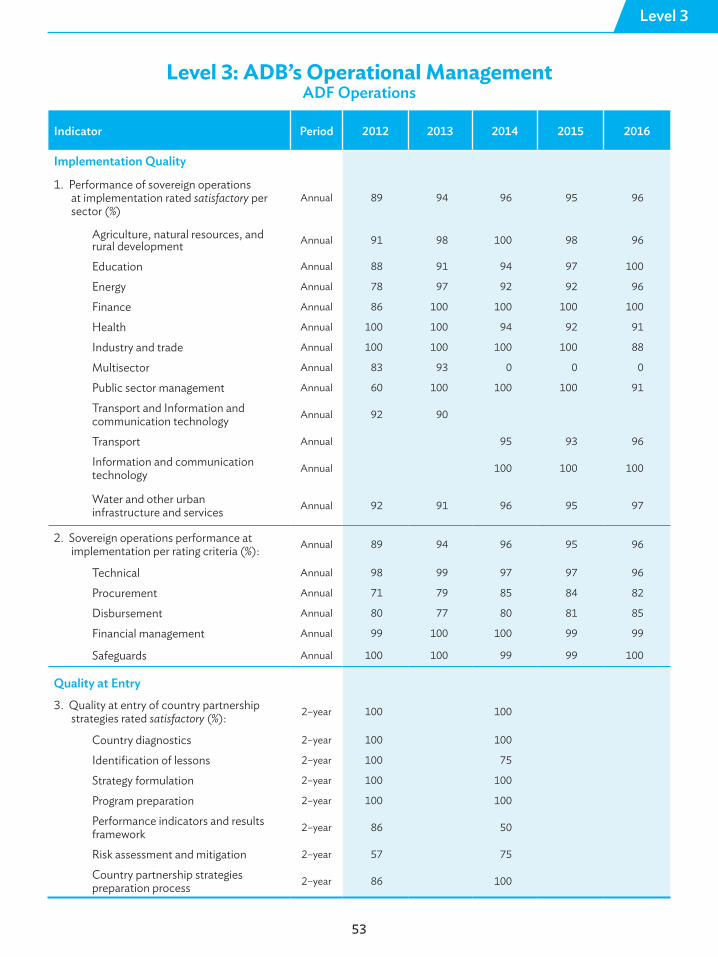
Level 3: ADB’s Operational ManagementADF Operations
Indicator Period 2012 2013 2014 2015 2016
Implementation Quality
1. Performance of sovereign operations at implementation rated satisfactory per sector (%)
Annual 89 94 96 95 96
Agriculture, natural resources, and rural development Annual 91 98 100 98 96
Education Annual 88 91 94 97 100
Energy Annual 78 97 92 92 96
Finance Annual 86 100 100 100 100
Health Annual 100 100 94 92 91
Industry and trade Annual 100 100 100 100 88
Multisector Annual 83 93 0 0 0
Public sector management Annual 60 100 100 100 91
Transport and Information and communication technology Annual 92 90
Transport Annual 95 93 96
Information and communication technology Annual 100 100 100
Water and other urban infrastructure and services Annual 92 91 96 95 97
2. Sovereign operations performance at implementation per rating criteria (%): Annual 89 94 96 95 96
Technical Annual 98 99 97 97 96
Procurement Annual 71 79 85 84 82
Disbursement Annual 80 77 80 81 85
Financial management Annual 99 100 100 99 99
Safeguards Annual 100 100 99 99 100
Quality at Entry3. Quality at entry of country partnership strategies rated satisfactory (%): 2–year 100 100
Country diagnostics 2–year 100 100
Identification of lessons 2–year 100 75
Strategy formulation 2–year 100 100
Program preparation 2–year 100 100
Performance indicators and results framework 2–year 86 50
Risk assessment and mitigation 2–year 57 75
Country partnership strategies preparation process 2–year 86 100

54
2016 Development Effectiveness Review
Level 3: ADB’s Operational ManagementADB Operations Overall (continued)
Indicator Period 2012 2013 2014 2015 2016
Quality at entry of country partnership strategies in integrating:
4. Climate change concerns (%) 2-year
5. Gender equality concerns (%) 2-year 54 55 63
6. Knowledge plans (%) 2-year
7. Quality at entry of sovereign projects rated satisfactory (%): 2-year 85 95
Development outcomes and impacts 2-year 55 49
Strategic relevance and approach 2-year 92 80
Design and monitoring frameworks 2-year 82 82 49
Technical and economic aspects 2-year 78 80
Poverty, social, and environmentalaspects 2-year 87 59
Fiduciary aspects 2-year 67 44
Policy and institutional aspects 2-year 70 73
Implementation arrangements 2-year 80 56
Risk assessment and management 2-year 68 41
Achievability and sustainability of development objectives 2-year 58 34
8. Quality at entry of nonsovereign projects rated satisfactory (%): 2-year 84 94
Development objectives, outcomes,and impacts 2-year 58 65
Enabling environment impact 2-year 68 71
Strategic alignment and projectdesign 2-year 74 82
Design monitoring frameworks 2-year 77 82 65
ADB additionality andcomplementarity 2-year 68 82
Market, financial, economic, and technical feasibility 2-year 42 82
Environmental and social responsibility 2-year 100 88
Implementation, monitoring, andevaluation arrangements 2-year 58 71
ADB profitability and investmentmanagement 2-year 74 71
Risk assessment and management 2-year 58 76
Achievability of development objectives 2-year 74 71
55
Level 3
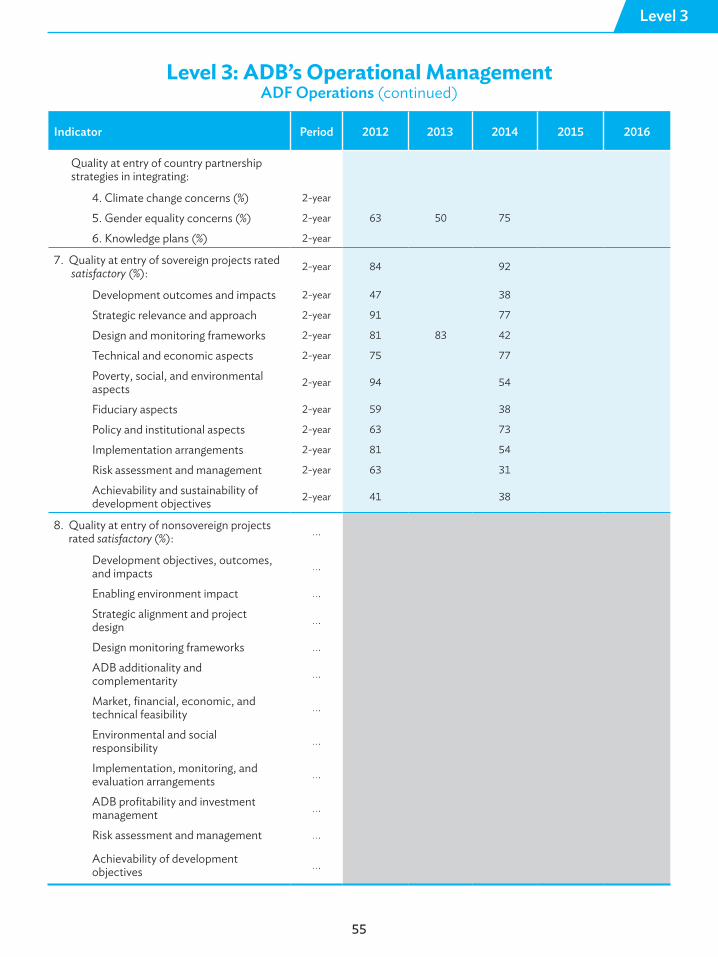
Level 3: ADB’s Operational ManagementADF Operations (continued)
Indicator Period 2012 2013 2014 2015 2016
Quality at entry of country partnership strategies in integrating:
4. Climate change concerns (%) 2-year
5. Gender equality concerns (%) 2-year 63 50 75
6. Knowledge plans (%) 2-year
7. Quality at entry of sovereign projects rated satisfactory (%): 2-year 84 92
Development outcomes and impacts 2-year 47 38
Strategic relevance and approach 2-year 91 77
Design and monitoring frameworks 2-year 81 83 42
Technical and economic aspects 2-year 75 77
Poverty, social, and environmentalaspects 2-year 94 54
Fiduciary aspects 2-year 59 38
Policy and institutional aspects 2-year 63 73
Implementation arrangements 2-year 81 54
Risk assessment and management 2-year 63 31
Achievability and sustainability of development objectives 2-year 41 38
8. Quality at entry of nonsovereign projects rated satisfactory (%): ….
Development objectives, outcomes,and impacts ….
Enabling environment impact ….
Strategic alignment and projectdesign ….
Design monitoring frameworks ….
ADB additionality andcomplementarity ….
Market, financial, economic, and technical feasibility ….
Environmental and social responsibility ….
Implementation, monitoring, andevaluation arrangements ….
ADB profitability and investmentmanagement ….
Risk assessment and management ….
Achievability of development objectives ….
56
2016 Development Effectiveness Review
Level 3: ADB’s Operational ManagementADB Operations Overall (continued)
Indicator Period 2012 2013 2014 2015 2016
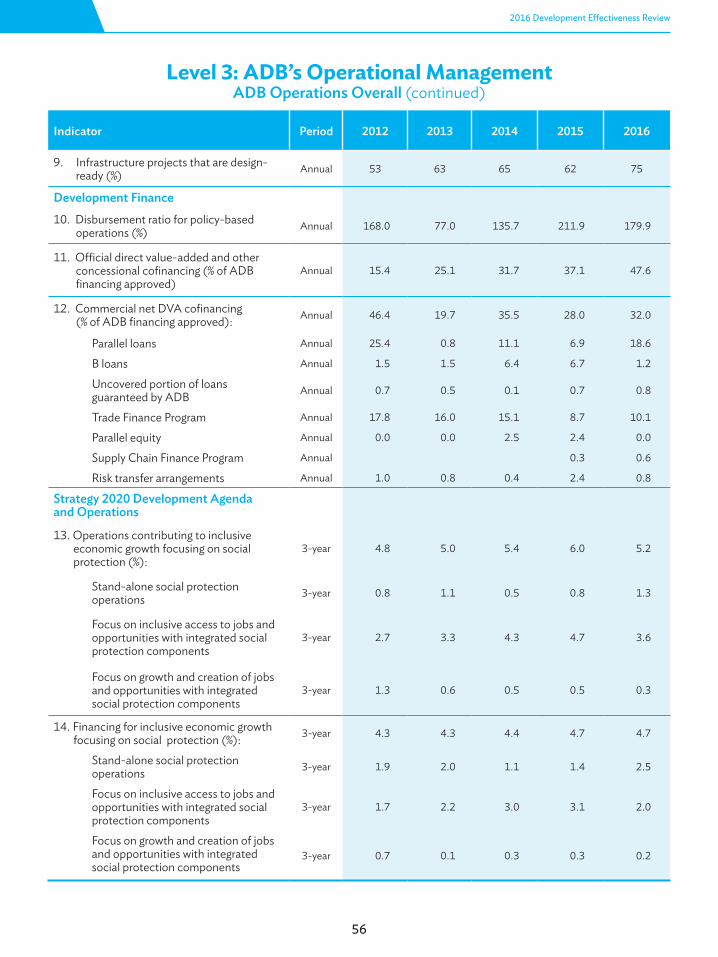
9. Infrastructure projects that are design- ready (%) Annual 53 63 65 62 75
Development Finance10. Disbursement ratio for policy-based operations (%) Annual 168.0 77.0 135.7 211.9 179.9
11. Official direct value-added and other concessional cofinancing (% of ADB financing approved)
Annual 15.4 25.1 31.7 37.1 47.6
12. Commercial net DVA cofinancing (% of ADB financing approved): Annual 46.4 19.7 35.5 28.0 32.0
Parallel loans Annual 25.4 0.8 11.1 6.9 18.6
B loans Annual 1.5 1.5 6.4 6.7 1.2
Uncovered portion of loansguaranteed by ADB Annual 0.7 0.5 0.1 0.7 0.8
Trade Finance Program Annual 17.8 16.0 15.1 8.7 10.1
Parallel equity Annual 0.0 0.0 2.5 2.4 0.0
Supply Chain Finance Program Annual 0.3 0.6
Risk transfer arrangements Annual 1.0 0.8 0.4 2.4 0.8
Strategy 2020 Development Agendaand Operations
13. Operations contributing to inclusive economic growth focusing on social protection (%):
3-year 4.8 5.0 5.4 6.0 5.2
Stand-alone social protectionoperations 3-year 0.8 1.1 0.5 0.8 1.3
Focus on inclusive access to jobs andopportunities with integrated socialprotection components
3-year 2.7 3.3 4.3 4.7 3.6
Focus on growth and creation of jobsand opportunities with integrated social protection components
3-year 1.3 0.6 0.5 0.5 0.3
14. Financing for inclusive economic growth focusing on social protection (%): 3-year 4.3 4.3 4.4 4.7 4.7
Stand-alone social protectionoperations 3-year 1.9 2.0 1.1 1.4 2.5
Focus on inclusive access to jobs andopportunities with integrated socialprotection components
3-year 1.7 2.2 3.0 3.1 2.0
Focus on growth and creation of jobs and opportunities with integrated social protection components
3-year 0.7 0.1 0.3 0.3 0.2
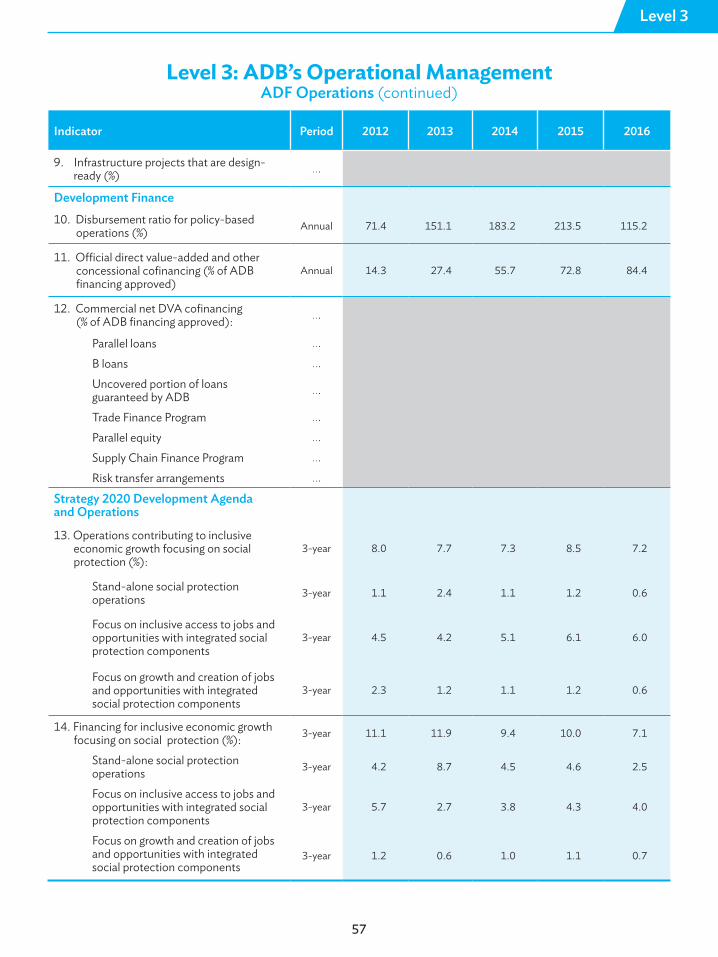
57
Level 3
Level 3: ADB’s Operational ManagementADF Operations (continued)
Indicator Period 2012 2013 2014 2015 2016
9. Infrastructure projects that are design- ready (%) ….
Development Finance10. Disbursement ratio for policy-based operations (%) Annual 71.4 151.1 183.2 213.5 115.2
11. Official direct value-added and other concessional cofinancing (% of ADB financing approved)
Annual 14.3 27.4 55.7 72.8 84.4
12. Commercial net DVA cofinancing (% of ADB financing approved): ….
Parallel loans ….
B loans ….
Uncovered portion of loansguaranteed by ADB ….
Trade Finance Program ….
Parallel equity ….
Supply Chain Finance Program ….
Risk transfer arrangements ….
Strategy 2020 Development Agendaand Operations
13. Operations contributing to inclusive economic growth focusing on social protection (%):
3-year 8.0 7.7 7.3 8.5 7.2
Stand-alone social protectionoperations 3-year 1.1 2.4 1.1 1.2 0.6
Focus on inclusive access to jobs andopportunities with integrated socialprotection components
3-year 4.5 4.2 5.1 6.1 6.0
Focus on growth and creation of jobsand opportunities with integrated social protection components
3-year 2.3 1.2 1.1 1.2 0.6
14. Financing for inclusive economic growth focusing on social protection (%): 3-year 11.1 11.9 9.4 10.0 7.1
Stand-alone social protectionoperations 3-year 4.2 8.7 4.5 4.6 2.5
Focus on inclusive access to jobs andopportunities with integrated socialprotection components
3-year 5.7 2.7 3.8 4.3 4.0
Focus on growth and creation of jobs and opportunities with integrated social protection components
3-year 1.2 0.6 1.0 1.1 0.7

58
2016 Development Effectiveness Review
Level 3: ADB’s Operational ManagementADB Operations Overall (continued)
Indicator Period 2012 2013 2014 2015 2016
15. Operations or transactions supporting inclusive business (number) Annual 6 7 8
16. Infrastructure operations benefiting lagging areas (%) 3-year 63 62 55 50 46
17. Financing for environmental sustainability (%) 3-year 46 52 52 50 54
18. Financing for climate change mitigation and/or adaptation (%) 3-year 21 21 21 19 19
19. Operations supporting climate change (%): 3-year 42 44 44 45 45
Mitigation 3-year 29 30 26 26 20
Adaptation 3-year 12 12 16 18 23
Mitigation and adaptation 3-year 1 2 1 2 3
20. Financing for climate change from global and regional funds ($ million) Annual 364 390 572 224 642
21. Financing for clean energy including energy efficiency ($ billion) Annual 2.4 2.6 2.4 2.5 2.5
22. Financing for urban transport (% of transport financing) Annual 28 21 10 14 9
23. Financing for railways (% of transport financing) Annual 0 7 18 7 9
24. Financing disaster risk management ($ billion) 3-year 1.5 2.6 3.7 4.7 5.0
25. Financing for regional cooperation and integration (%) 3-year 22 20 21 22 27
26. Operations supporting second generation regional cooperation and integration (number)
3-year 28 30 45
27. Technical assisstance supporting second generation regional cooperation and integration (number)
3-year 177 157 139
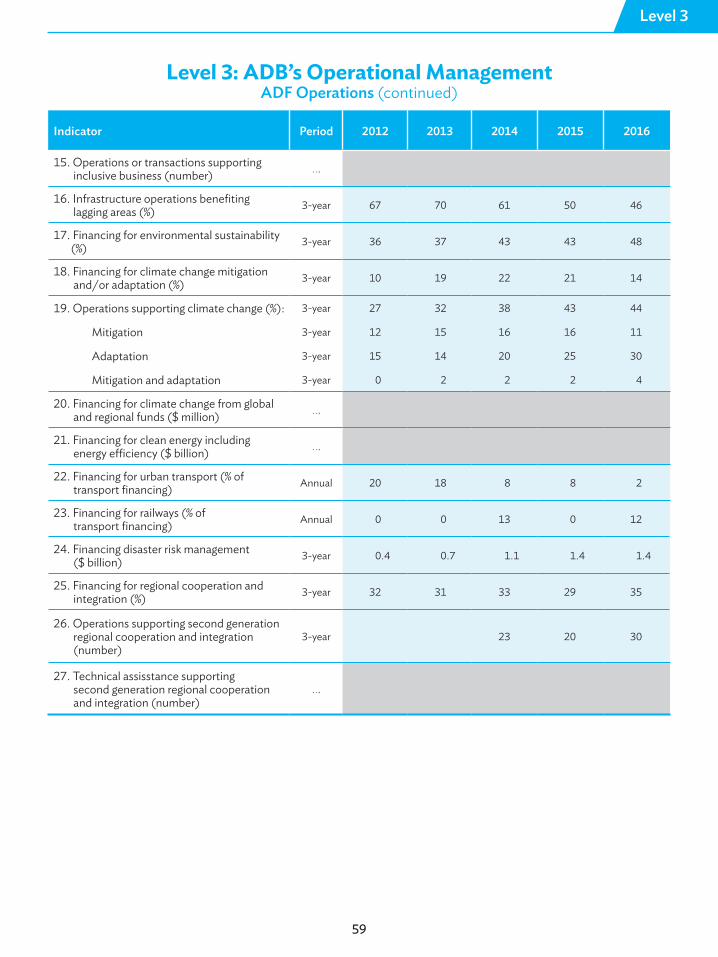
59
Level 3
Level 3: ADB’s Operational ManagementADF Operations (continued)
Indicator Period 2012 2013 2014 2015 2016
15. Operations or transactions supporting inclusive business (number) ….
16. Infrastructure operations benefiting lagging areas (%) 3-year 67 70 61 50 46
17. Financing for environmental sustainability (%) 3-year 36 37 43 43 48
18. Financing for climate change mitigation and/or adaptation (%) 3-year 10 19 22 21 14
19. Operations supporting climate change (%): 3-year 27 32 38 43 44
Mitigation 3-year 12 15 16 16 11
Adaptation 3-year 15 14 20 25 30
Mitigation and adaptation 3-year 0 2 2 2 4
20. Financing for climate change from global and regional funds ($ million) ….
21. Financing for clean energy including energy efficiency ($ billion) ….
22. Financing for urban transport (% of transport financing) Annual 20 18 8 8 2
23. Financing for railways (% of transport financing) Annual 0 0 13 0 12
24. Financing disaster risk management ($ billion) 3-year 0.4 0.7 1.1 1.4 1.4
25. Financing for regional cooperation and integration (%) 3-year 32 31 33 29 35
26. Operations supporting second generation regional cooperation and integration (number)
3-year 23 20 30
27. Technical assisstance supporting second generation regional cooperation and integration (number)
….
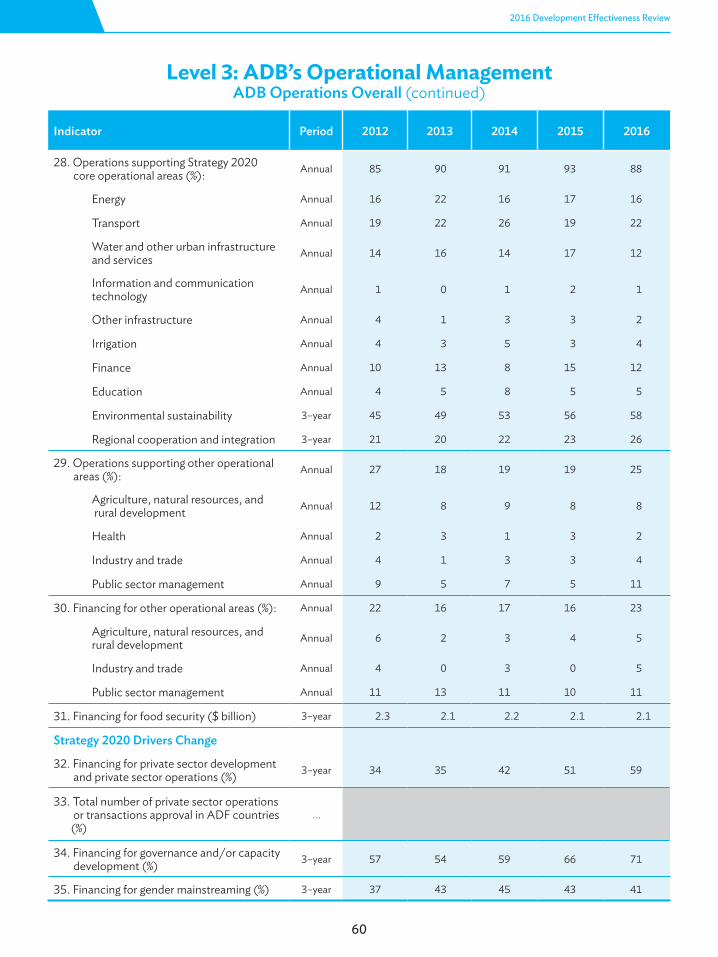
60
2016 Development Effectiveness Review
Level 3: ADB’s Operational ManagementADB Operations Overall (continued)
Indicator Period 2012 2013 2014 2015 2016
28. Operations supporting Strategy 2020 core operational areas (%): Annual 85 90 91 93 88
Energy Annual 16 22 16 17 16
Transport Annual 19 22 26 19 22
Water and other urban infrastructure and services Annual 14 16 14 17 12
Information and communication technology Annual 1 0 1 2 1
Other infrastructure Annual 4 1 3 3 2
Irrigation Annual 4 3 5 3 4
Finance Annual 10 13 8 15 12
Education Annual 4 5 8 5 5
Environmental sustainability 3–year 45 49 53 56 58
Regional cooperation and integration 3–year 21 20 22 23 26
29. Operations supporting other operational areas (%): Annual 27 18 19 19 25
Agriculture, natural resources, and rural development Annual 12 8 9 8 8
Health Annual 2 3 1 3 2
Industry and trade Annual 4 1 3 3 4
Public sector management Annual 9 5 7 5 11
30. Financing for other operational areas (%): Annual 22 16 17 16 23
Agriculture, natural resources, and rural development Annual 6 2 3 4 5
Industry and trade Annual 4 0 3 0 5
Public sector management Annual 11 13 11 10 11
31. Financing for food security ($ billion) 3–year 2.3 2.1 2.2 2.1 2.1
Strategy 2020 Drivers Change
32. Financing for private sector development and private sector operations (%) 3–year 34 35 42 51 59
33. Total number of private sector operations or transactions approval in ADF countries (%)
….
34. Financing for governance and/or capacity development (%) 3–year 57 54 59 66 71
35. Financing for gender mainstreaming (%) 3–year 37 43 45 43 41
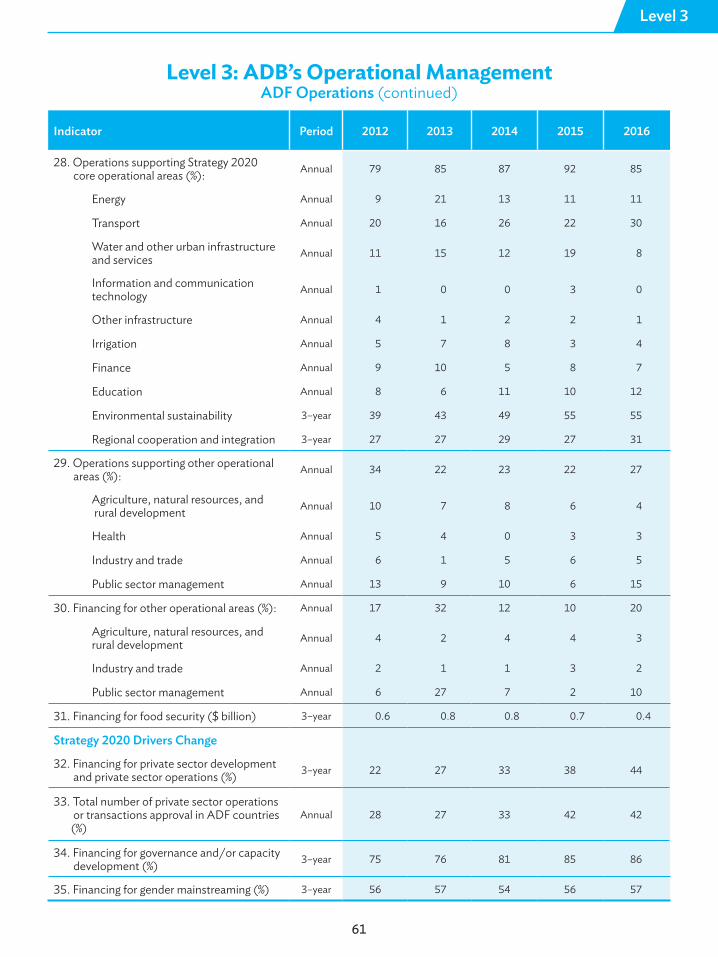
61
Level 3
Level 3: ADB’s Operational ManagementADF Operations (continued)
Indicator Period 2012 2013 2014 2015 2016
28. Operations supporting Strategy 2020 core operational areas (%): Annual 79 85 87 92 85
Energy Annual 9 21 13 11 11
Transport Annual 20 16 26 22 30
Water and other urban infrastructure and services Annual 11 15 12 19 8
Information and communication technology Annual 1 0 0 3 0
Other infrastructure Annual 4 1 2 2 1
Irrigation Annual 5 7 8 3 4
Finance Annual 9 10 5 8 7
Education Annual 8 6 11 10 12
Environmental sustainability 3–year 39 43 49 55 55
Regional cooperation and integration 3–year 27 27 29 27 31
29. Operations supporting other operational areas (%): Annual 34 22 23 22 27
Agriculture, natural resources, and rural development Annual 10 7 8 6 4
Health Annual 5 4 0 3 3
Industry and trade Annual 6 1 5 6 5
Public sector management Annual 13 9 10 6 15
30. Financing for other operational areas (%): Annual 17 32 12 10 20
Agriculture, natural resources, and rural development Annual 4 2 4 4 3
Industry and trade Annual 2 1 1 3 2
Public sector management Annual 6 27 7 2 10
31. Financing for food security ($ billion) 3–year 0.6 0.8 0.8 0.7 0.4
Strategy 2020 Drivers Change
32. Financing for private sector development and private sector operations (%) 3–year 22 27 33 38 44
33. Total number of private sector operations or transactions approval in ADF countries (%)
Annual 28 27 33 42 42
34. Financing for governance and/or capacity development (%) 3–year 75 76 81 85 86
35. Financing for gender mainstreaming (%) 3–year 56 57 54 56 57
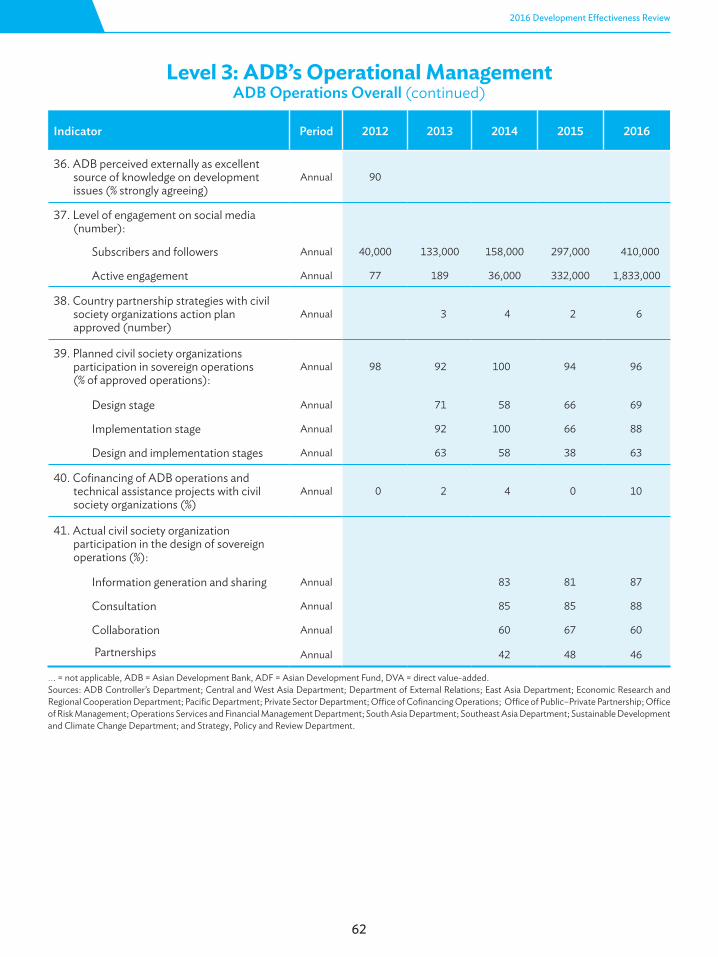
62
2016 Development Effectiveness Review
Level 3: ADB’s Operational ManagementADB Operations Overall (continued)
…. = not applicable, ADB = Asian Development Bank, ADF = Asian Development Fund, DVA = direct value-added.Sources: ADB Controller’s Department; Central and West Asia Department; Department of External Relations; East Asia Department; Economic Research and Regional Cooperation Department; Pacific Department; Private Sector Department; Office of Cofinancing Operations; Office of Public–Private Partnership; Office of Risk Management; Operations Services and Financial Management Department; South Asia Department; Southeast Asia Department; Sustainable Development and Climate Change Department; and Strategy, Policy and Review Department.
Indicator Period 2012 2013 2014 2015 2016
36. ADB perceived externally as excellent source of knowledge on development issues (% strongly agreeing)
Annual 90
37. Level of engagement on social media (number):
Subscribers and followers Annual 40,000 133,000 158,000 297,000 410,000
Active engagement Annual 77 189 36,000 332,000 1,833,000
38. Country partnership strategies with civil society organizations action plan approved (number)
Annual 3 4 2 6
39. Planned civil society organizations participation in sovereign operations (% of approved operations):
Annual 98 92 100 94 96
Design stage Annual 71 58 66 69
Implementation stage Annual 92 100 66 88
Design and implementation stages Annual 63 58 38 63
40. Cofinancing of ADB operations and technical assistance projects with civil society organizations (%)
Annual 0 2 4 0 10
41. Actual civil society organization participation in the design of sovereign operations (%):
Information generation and sharing Annual 83 81 87
Consultation Annual 85 85 88
Collaboration Annual 60 67 60
Partnerships Annual 42 48 46
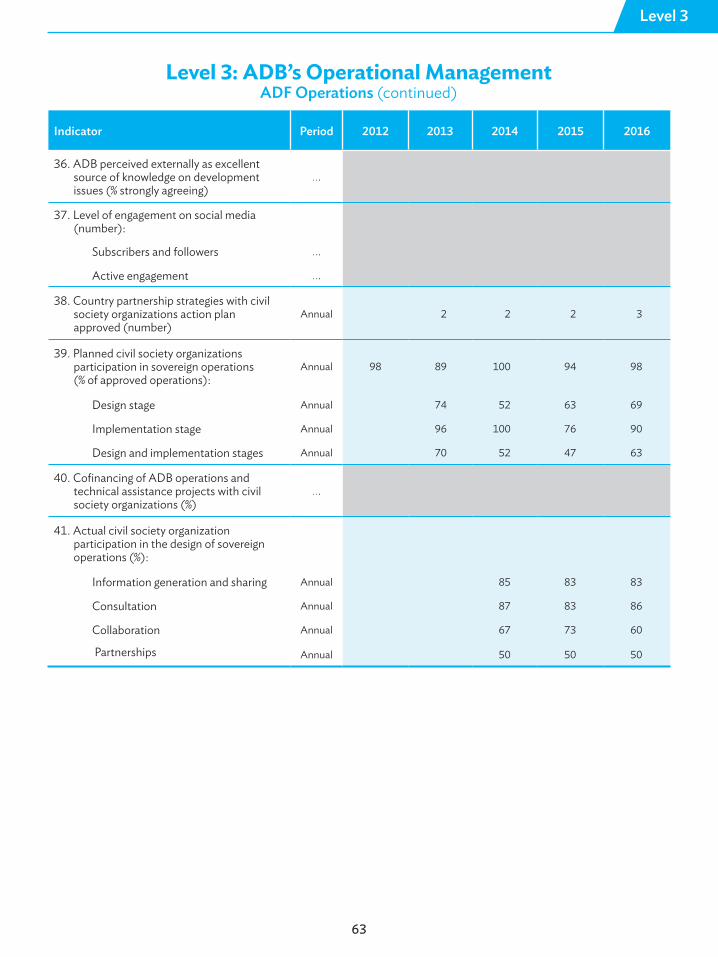
63
Level 3
Level 3: ADB’s Operational ManagementADF Operations (continued)
Indicator Period 2012 2013 2014 2015 2016
36. ADB perceived externally as excellent source of knowledge on development issues (% strongly agreeing)
….
37. Level of engagement on social media (number):
Subscribers and followers ….
Active engagement ….
38. Country partnership strategies with civil society organizations action plan approved (number)
Annual 2 2 2 3
39. Planned civil society organizations participation in sovereign operations (% of approved operations):
Annual 98 89 100 94 98
Design stage Annual 74 52 63 69
Implementation stage Annual 96 100 76 90
Design and implementation stages Annual 70 52 47 63
40. Cofinancing of ADB operations and technical assistance projects with civil society organizations (%)
….
41. Actual civil society organization participation in the design of sovereign operations (%):
Information generation and sharing Annual 85 83 83
Consultation Annual 87 83 86
Collaboration Annual 67 73 60
Partnerships Annual 50 50 50
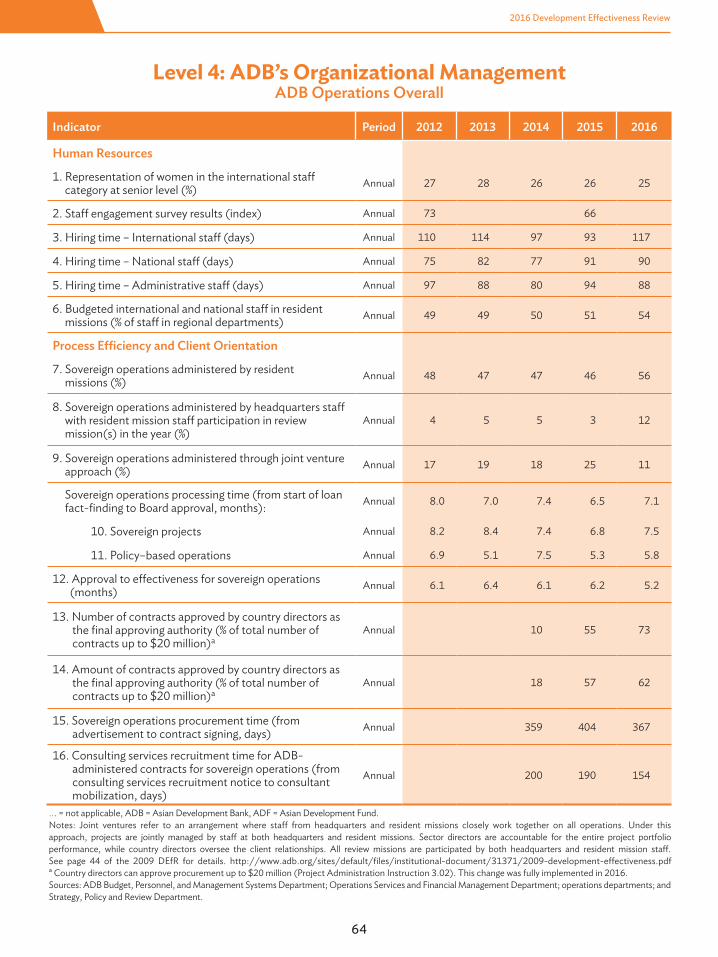
64
2016 Development Effectiveness Review
Level 4: ADB’s Organizational ManagementADB Operations Overall
…. = not applicable, ADB = Asian Development Bank, ADF = Asian Development Fund.Notes: Joint ventures refer to an arrangement where staff from headquarters and resident missions closely work together on all operations. Under this approach, projects are jointly managed by staff at both headquarters and resident missions. Sector directors are accountable for the entire project portfolio performance, while country directors oversee the client relationships. All review missions are participated by both headquarters and resident mission staff. See page 44 of the 2009 DEfR for details. http://www.adb.org/sites/default/files/institutional-document/31371/2009-development-effectiveness.pdfa Country directors can approve procurement up to $20 million (Project Administration Instruction 3.02). This change was fully implemented in 2016.Sources: ADB Budget, Personnel, and Management Systems Department; Operations Services and Financial Management Department; operations departments; and Strategy, Policy and Review Department.
Indicator Period 2012 2013 2014 2015 2016
Human Resources
1. Representation of women in the international staff category at senior level (%) Annual 27 28 26 26 25
2. Staff engagement survey results (index) Annual 73 66
3. Hiring time – International staff (days) Annual 110 114 97 93 117
4. Hiring time – National staff (days) Annual 75 82 77 91 90
5. Hiring time – Administrative staff (days) Annual 97 88 80 94 88
6. Budgeted international and national staff in resident missions (% of staff in regional departments) Annual 49 49 50 51 54
Process Efficiency and Client Orientation
7. Sovereign operations administered by resident missions (%) Annual 48 47 47 46 56
8. Sovereign operations administered by headquarters staff with resident mission staff participation in review mission(s) in the year (%)
Annual 4 5 5 3 12
9. Sovereign operations administered through joint venture approach (%) Annual 17 19 18 25 11
Sovereign operations processing time (from start of loan fact-finding to Board approval, months): Annual 8.0 7.0 7.4 6.5 7.1
10. Sovereign projects Annual 8.2 8.4 7.4 6.8 7.5
11. Policy–based operations Annual 6.9 5.1 7.5 5.3 5.8
12. Approval to effectiveness for sovereign operations (months) Annual 6.1 6.4 6.1 6.2 5.2
13. Number of contracts approved by country directors as the final approving authority (% of total number of contracts up to $20 million)a
Annual 10 55 73
14. Amount of contracts approved by country directors as the final approving authority (% of total number of contracts up to $20 million)a
Annual 18 57 62
15. Sovereign operations procurement time (from advertisement to contract signing, days) Annual 359 404 367
16. Consulting services recruitment time for ADB- administered contracts for sovereign operations (from consulting services recruitment notice to consultant mobilization, days)
Annual 200 190 154
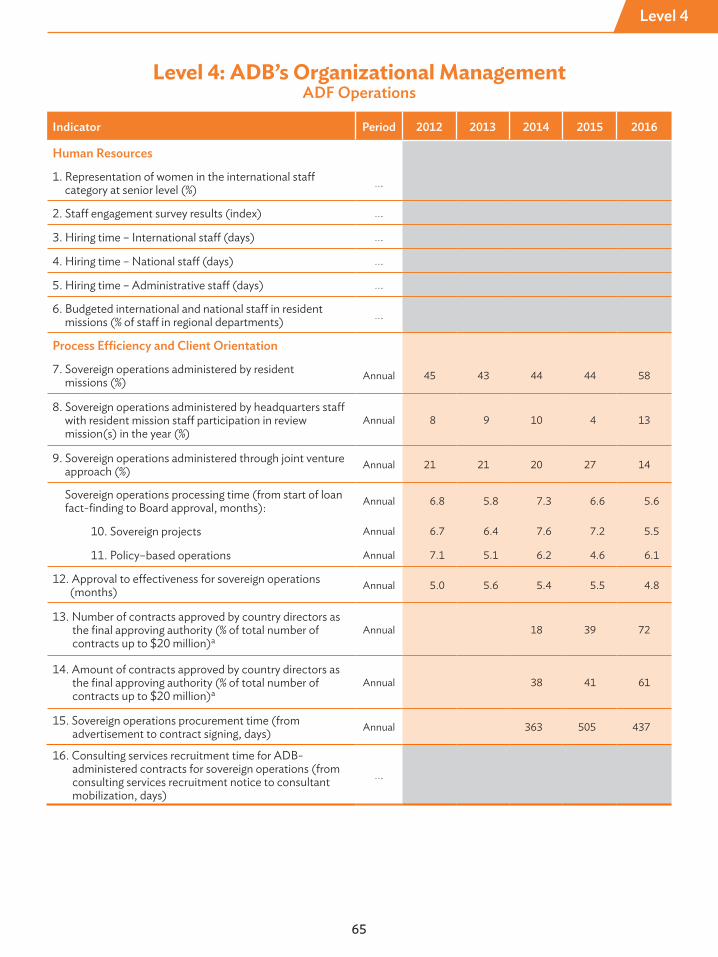
65
Level 4
Level 4: ADB’s Organizational ManagementADF Operations
Indicator Period 2012 2013 2014 2015 2016
Human Resources
1. Representation of women in the international staff category at senior level (%) ….
2. Staff engagement survey results (index) ….
3. Hiring time – International staff (days) ….
4. Hiring time – National staff (days) ….
5. Hiring time – Administrative staff (days) ….
6. Budgeted international and national staff in resident missions (% of staff in regional departments) ….
Process Efficiency and Client Orientation
7. Sovereign operations administered by resident missions (%) Annual 45 43 44 44 58
8. Sovereign operations administered by headquarters staff with resident mission staff participation in review mission(s) in the year (%)
Annual 8 9 10 4 13
9. Sovereign operations administered through joint venture approach (%) Annual 21 21 20 27 14
Sovereign operations processing time (from start of loan fact-finding to Board approval, months): Annual 6.8 5.8 7.3 6.6 5.6
10. Sovereign projects Annual 6.7 6.4 7.6 7.2 5.5
11. Policy–based operations Annual 7.1 5.1 6.2 4.6 6.1
12. Approval to effectiveness for sovereign operations (months) Annual 5.0 5.6 5.4 5.5 4.8
13. Number of contracts approved by country directors as the final approving authority (% of total number of contracts up to $20 million)a
Annual 18 39 72
14. Amount of contracts approved by country directors as the final approving authority (% of total number of contracts up to $20 million)a
Annual 38 41 61
15. Sovereign operations procurement time (from advertisement to contract signing, days) Annual 363 505 437
16. Consulting services recruitment time for ADB- administered contracts for sovereign operations (from consulting services recruitment notice to consultant mobilization, days)
….