4 q and fy 2015 final
TRANSCRIPT
Fourth Quarter and Full Year 2015 Earnings February 25, 2016
Disclaimer
This presentation and any related statements contain certain “forward-looking statements” about MPG’s financial results and estimates and business prospects within the meaning of the Private Securities Litigation Reform Act of 1995. Forward-looking statements may be identified by words such as “expects,” “intends,” “anticipates,” “plans,” “projects,” “believes,” “seeks,” “targets,” “forecasts,” “estimates,” “will” or other words of similar meaning and include, but are not limited to, statements regarding the outlook for the Company’s future business, prospects and financial performance; the industry outlook, our backlog and our 2016 financial guidance. Forward-looking statements are based on management’s current expectations and assumptions, which are subject to inherent uncertainties, risks and changes in circumstances that are difficult to predict. Actual outcomes and results may differ materially due to global political, economic, business, competitive, market, regulatory, and other factors and risks, among them being: volatility in the global economy impacting demand for new vehicles and our products; a decline in vehicle production levels, particularly with respect to platforms for which we are a significant supplier, or the financial distress of any of our major customers; cyclicality and seasonality in the light vehicle, industrial and commercial vehicle markets; our significant competition; our dependence on large-volume customers for current and future sales; a reduction in outsourcing by our customers, the loss or discontinuation of material production or programs, or a failure to secure sufficient alternative programs; our failure to offset continuing pressure from our customers to reduce our prices; our inability to realize all of the sales expected from awarded business or fully recover pre-production costs; our failure to increase production capacity or over-expanding our production in times of overcapacity; our reliance on key machinery and tooling to manufacture components for powertrain and safety-critical systems that cannot be easily replicated; program launch difficulties; a disruption in our supply or delivery chain which causes one or more of our customers to halt production; the damage to or termination of our relationships with key third-party suppliers; work stoppages or production limitations at one or more of our customer’s facilities; a catastrophic loss of one of our key manufacturing facilities; failure to protect our know-how and intellectual property; the disruption or harm to our business as a result of any acquisitions or joint ventures we make; a significant increase in the prices of raw materials and commodities we use; our failure to maintain our cost structure; the incurrence of significant costs if we close any of our manufacturing facilities; potential significant costs at our facility in Sandusky, Ohio; the incurrence of significant costs, liabilities, and obligations as a result of environmental requirements and other regulatory risks; extensive and growing governmental regulations; the incurrence of material costs related to legal proceedings; our inability to recruit and retain key personnel; any failure to maintain satisfactory labor relations; pension and other postretirement benefit obligations; risks related to our global operations; competitive threats posed by global operations and entering new markets; foreign exchange rate fluctuations; our substantial indebtedness; our inability, or the inability of our customers or our suppliers, to obtain and maintain sufficient debt financing, including working capital lines; our exposure to a number of different tax uncertainties; the mix of profits and losses in various jurisdictions adversely affecting our tax rate. For the reasons described above, we caution you against relying on any forward-looking statements, which should also be read in conjunction with the other cautionary statements that are included elsewhere in this press release and in our public filings, including under the heading “Risk Factors” in our filings that we make from time to time with the Securities and Exchange Commission. You should not consider any list of such factors to be an exhaustive statement of all the risks, uncertainties, or potentially inaccurate assumptions that could cause our current expectations or beliefs to change. Further, any forward-looking statement speaks only as of the date on which it is made, and we undertake no obligation to update or revise any forward-looking statement to reflect events or circumstances after the date on which the statement is made or to reflect the occurrence of unanticipated events, except as otherwise may be required by law. Non-GAAP Financial Measures
Combined Net Sales We define Combined Net Sales as the Net Sales of MPG plus the Net Sales of Grede prior to our acquisition of Grede. We present Combined Net Sales because our management considers it to be a useful, supplemental indicator of our performance when comparing periods before and after our acquisition of Grede. For a reconciliation of Combined Net Sales to Net Sales, the most directly comparable U.S. generally accepted accounting principles “GAAP” measure, see Appendix to this presentation.
Adjusted EBITDA and Combined Adjusted EBITDA We define Adjusted EBITDA as net income (loss) before interest expense, provision for (benefit from) income taxes and depreciation and amortization, with further adjustments to reflect the additions and eliminations of certain income statement items, including (i) gains and losses on foreign currency and fixed assets and debt transaction expenses, (ii) stock-based compensation and other non-cash charges, (iii) sponsor management fees and other income and expense items that we consider to be not indicative of our ongoing operations, (iv) specified non-recurring items and (v) other adjustments. We define Combined Adjusted EBITDA as Adjusted EBITDA plus the Adjusted EBITDA of Grede prior to our acquisition of Grede. We believe Adjusted EBITDA is used by investors as a supplemental measure to evaluate the overall operating performance of companies in our industry. Management uses Adjusted EBITDA (i) as a measurement used in comparing our operating performance on a consistent basis, (ii) to calculate incentive compensation for our employees, (iii) for planning purposes, including the preparation of our internal annual operating budget, (iv) to evaluate the performance and effectiveness of our operational strategies and (v) to assess compliance with various metrics associated with our agreements governing our indebtedness. Accordingly, we believe that Adjusted EBITDA provides useful information to investors and others in understanding and evaluating our operating performance in the same manner as our management. We present Combined Adjusted EBITDA because our management considers it to be a useful, supplemental indicator of our performance when comparing periods before and after our acquisition of Grede. For a reconciliation of Adjusted EBITDA and Combined Adjusted EBITDA to income before tax, the most directly comparable measure determined under GAAP, see Appendix to this presentation.
Adjusted Free Cash Flow and Combined Adjusted Free Cash Flow We define Adjusted Free Cash Flow as Adjusted EBITDA less capital expenditures. Capital expenditures are on an accrual basis of accounting and can be calculated by taking the capital expenditures found in the investing section of our consolidated statements of cash flows and adjusting for the change in the period of the capital expenditure in accounts payables found in the supplemental cash flow information on our consolidated statements of cash flows. We present Adjusted Free Cash Flow because our management considers it to be a useful, supplemental indicator of our performance. When measured over time, Adjusted Free Cash Flow provides supplemental information to investors concerning our results of operations and our ability to generate cash flows to satisfy mandatory debt service requirements and make other non-discretionary expenditures. For a reconciliation of Adjusted Free Cash Flow to income before tax, the most directly comparable GAAP measure, see Appendix to this presentation.
Net new business backlog Net new business backlog, which we measure as anticipated net product sales from incremental business for the next four years, net of Programs being phased out and any contractual pricing changes. We are typically awarded Programs one to three years prior to the start of production on new and replacement business. Due to the timing of the OEM sourcing cycle, our anticipated net product sales were measured based on contracts to be fulfilled during 2016 through 2019. Our estimate of anticipated net product sales includes formally awarded new Programs, Programs which we believe are highly probable of being awarded to us, and expected volume and pricing contractual changes on existing Programs. Our estimate may be impacted by various assumptions including vehicle production levels on new and replacement Programs, non-contractual customer price reductions, scrap prices, material price indices, currency exchange rates and the timing of Program launches. Therefore, this anticipated net product sales information could differ significantly from actual firm orders or firm commitments, and awards of business do not represent guarantees of production volumes or revenues.
2
Agenda
Introduction Paul Suber Vice President of Investor Relations
Q4 2015 and Full Year 2015 Highlights and Market Outlook
George Thanopoulos Chief Executive Officer
2015 Financial Results and 2016 Guidance
Mark Blaufuss Chief Financial Officer
Q & A Session George Thanopoulos Mark Blaufuss
Paul Suber
3

Q4 AND FULL YEAR 2015 HIGHLIGHTS AND MARKET OUTLOOK
Multiple Factors Driving MPG Value Creation
5
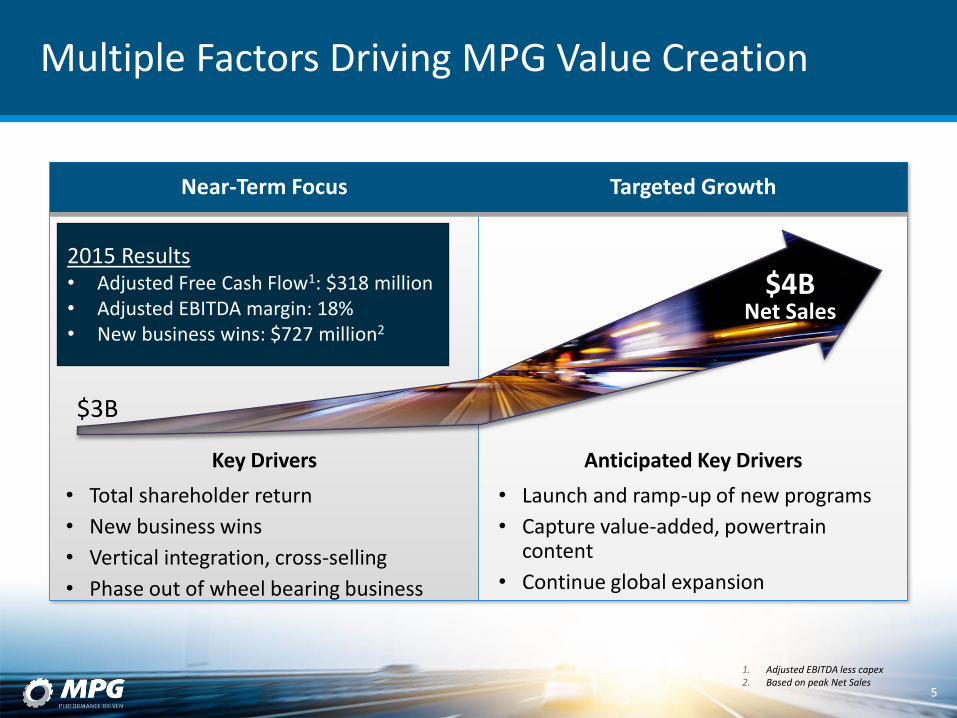
Near-Term Focus Targeted Growth
$4B Net Sales
$3B
• Total shareholder return
• New business wins
• Vertical integration, cross-selling
• Phase out of wheel bearing business
• Launch and ramp-up of new programs
• Capture value-added, powertrain content
• Continue global expansion
Key Drivers Anticipated Key Drivers
2015 Results • Adjusted Free Cash Flow1: $318 million • Adjusted EBITDA margin: 18% • New business wins: $727 million2
1. Adjusted EBITDA less capex 2. Based on peak Net Sales
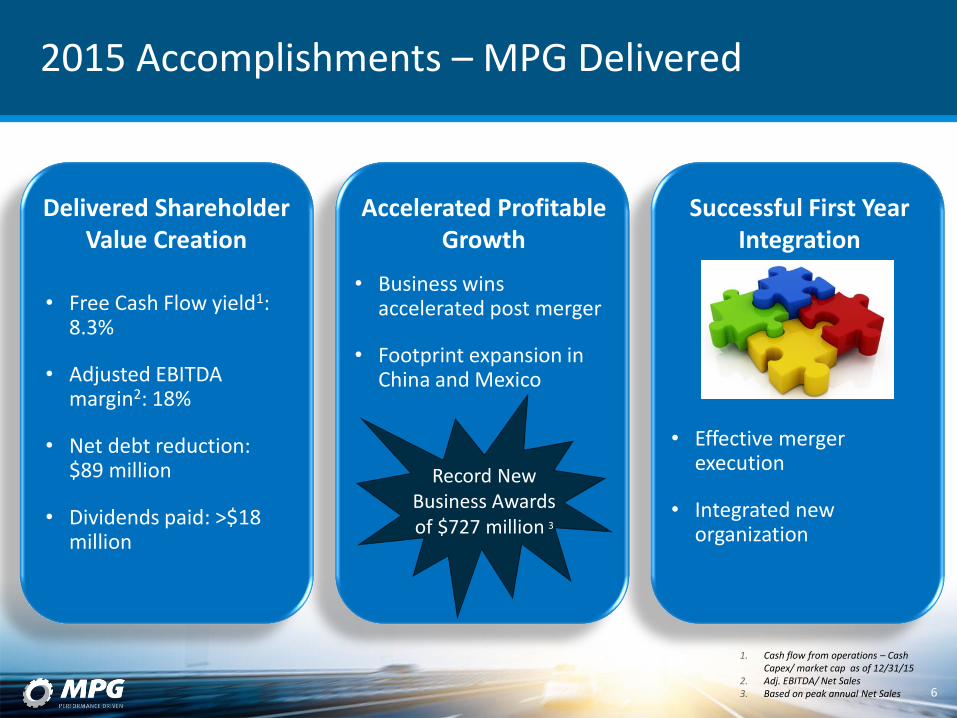
2015 Accomplishments – MPG Delivered
Accelerated Profitable Growth
Record New Business Awards of $727 million 3
1. Cash flow from operations – Cash Capex/ market cap as of 12/31/15
2. Adj. EBITDA/ Net Sales 3. Based on peak annual Net Sales
• Business wins accelerated post merger
• Footprint expansion in China and Mexico
Successful First Year Integration
• Effective merger execution
• Integrated new organization
Delivered Shareholder Value Creation
• Free Cash Flow yield1: 8.3%
• Adjusted EBITDA margin2: 18%
• Net debt reduction: $89 million
• Dividends paid: >$18 million
6
1. Combined Adjusted EBITDA / Combined Net Sales (Non-GAAP) 2. Adjusted EBITDA less Capex 3. New business is peak annual Net Sales. Programs are expected to
launch and ramp up over the next several years.
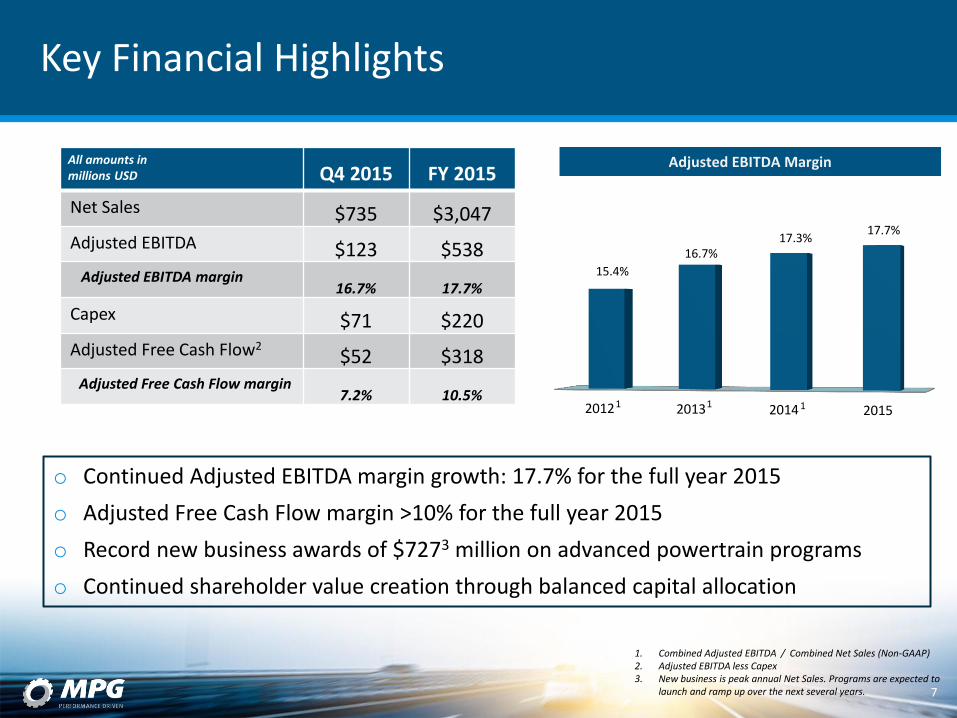
Adjusted EBITDA Margin
2012 2013 2014 2015
15.4%
16.7% 17.3%
17.7%
Q4 2015 FY 2015
Net Sales $735 $3,047
Adjusted EBITDA $123 $538 Adjusted EBITDA margin
16.7% 17.7%
Capex $71 $220
Adjusted Free Cash Flow2 $52 $318
Adjusted Free Cash Flow margin 7.2% 10.5%
All amounts in millions USD
o Continued Adjusted EBITDA margin growth: 17.7% for the full year 2015
o Adjusted Free Cash Flow margin >10% for the full year 2015
o Record new business awards of $7273 million on advanced powertrain programs
o Continued shareholder value creation through balanced capital allocation
7
Key Financial Highlights
1 1 1
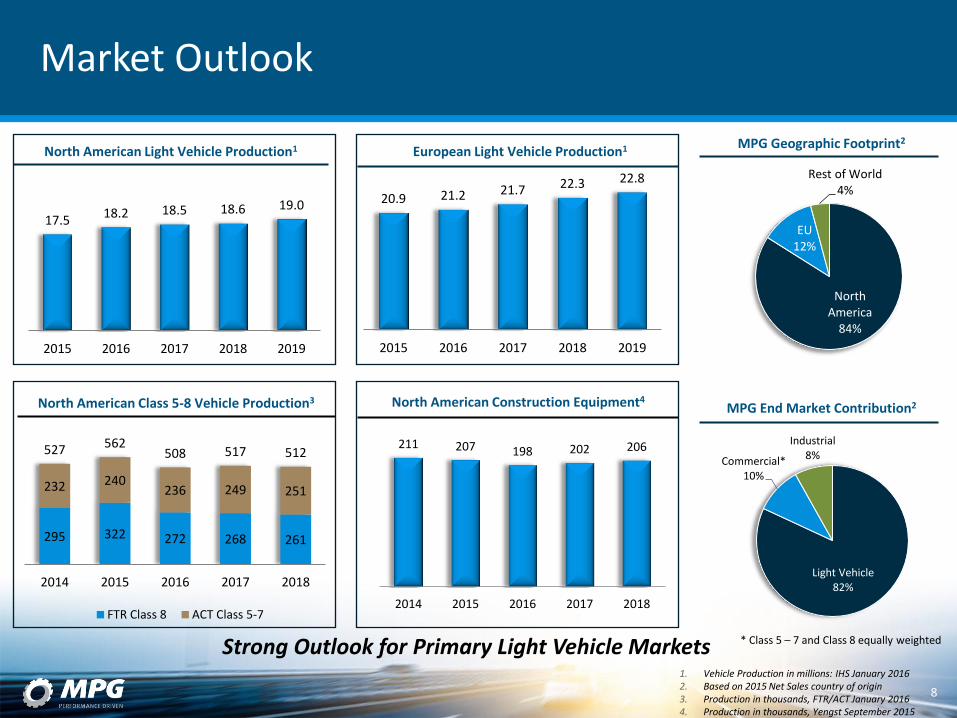
211 207 198 202 206
2014 2015 2016 2017 2018
295 322 272 268 261
232 240 236 249 251
527 562 508 517 512
2014 2015 2016 2017 2018
FTR Class 8 ACT Class 5-7
17.5 18.2 18.5 18.6 19.0
2015 2016 2017 2018 2019
20.9 21.2 21.7 22.3 22.8
2015 2016 2017 2018 2019
Strong Outlook for Primary Light Vehicle Markets 1. Vehicle Production in millions: IHS January 2016 2. Based on 2015 Net Sales country of origin 3. Production in thousands, FTR/ACT January 2016 4. Production in thousands, Yengst September 2015
MPG Geographic Footprint2
North American Light Vehicle Production1 European Light Vehicle Production1
Market Outlook
North America
84%
EU 12%
Rest of World 4%
North American Construction Equipment4 North American Class 5-8 Vehicle Production3
Light Vehicle 82%
Commercial* 10%
Industrial 8%
MPG End Market Contribution2
8
* Class 5 – 7 and Class 8 equally weighted
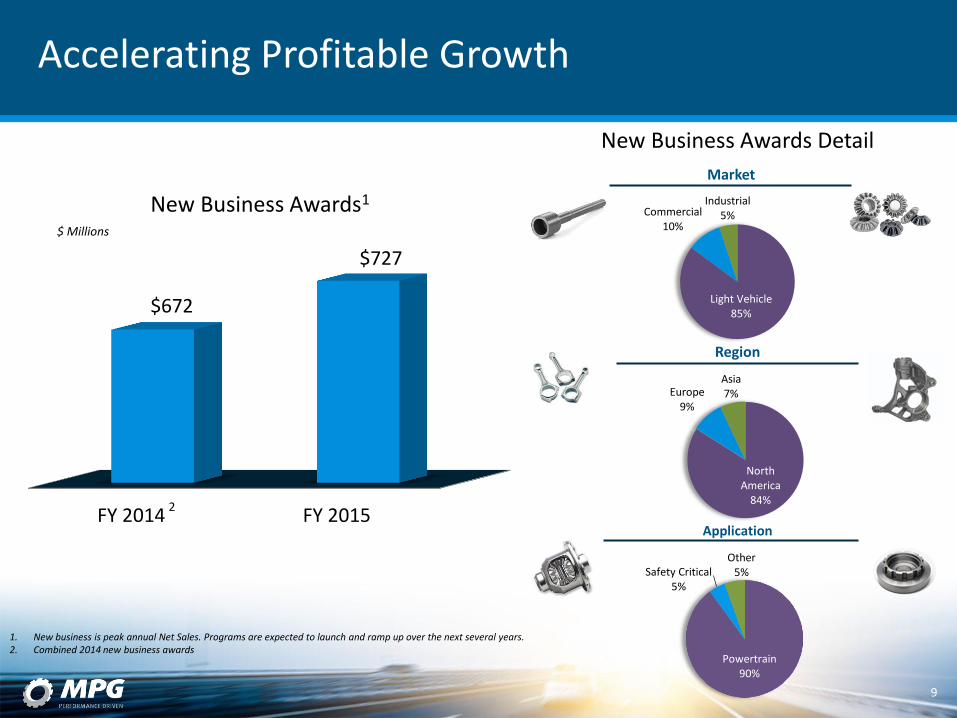
Light Vehicle 85%
Commercial 10%
Industrial 5%
North America
84%
Europe 9%
Asia 7%
Powertrain 90%
Safety Critical 5%
Other 5%
FY 2014 FY 2015
$672
$727
Accelerating Profitable Growth
1. New business is peak annual Net Sales. Programs are expected to launch and ramp up over the next several years. 2. Combined 2014 new business awards
Application
Region
Market
$ Millions
New Business Awards1
2
9
New Business Awards Detail
2015 2016 2017 2018 2019
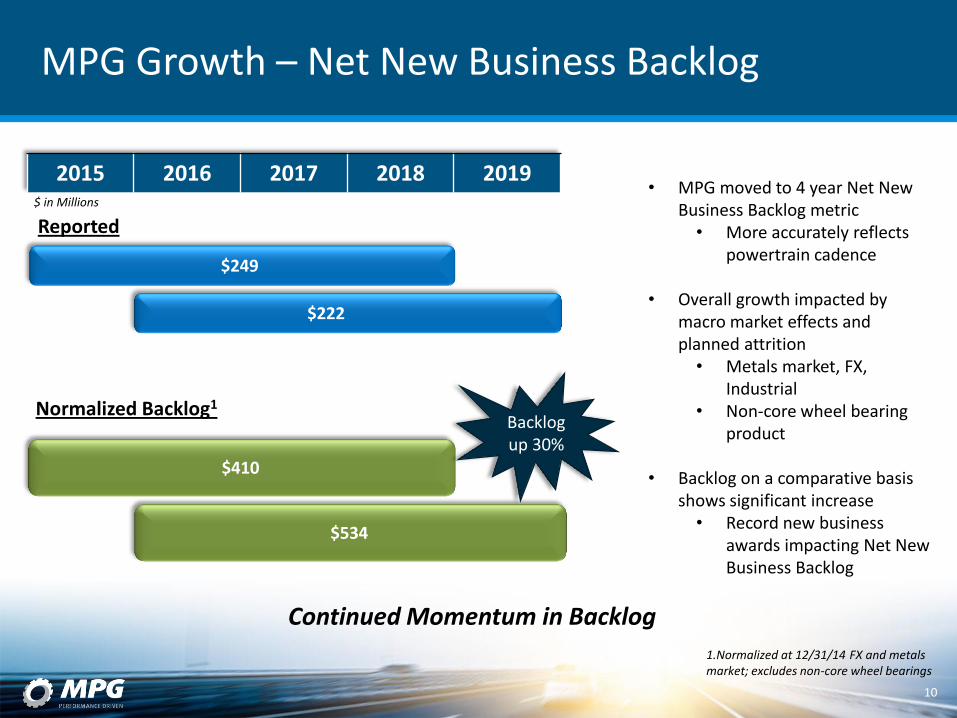
MPG Growth – Net New Business Backlog
Reported
Normalized Backlog1
$249
$222
$534
1.Normalized at 12/31/14 FX and metals market; excludes non-core wheel bearings
Continued Momentum in Backlog
• MPG moved to 4 year Net New Business Backlog metric • More accurately reflects
powertrain cadence
• Overall growth impacted by macro market effects and planned attrition • Metals market, FX,
Industrial • Non-core wheel bearing
product
• Backlog on a comparative basis shows significant increase • Record new business
awards impacting Net New Business Backlog
$ in Millions
$410
Backlog up 30%
10
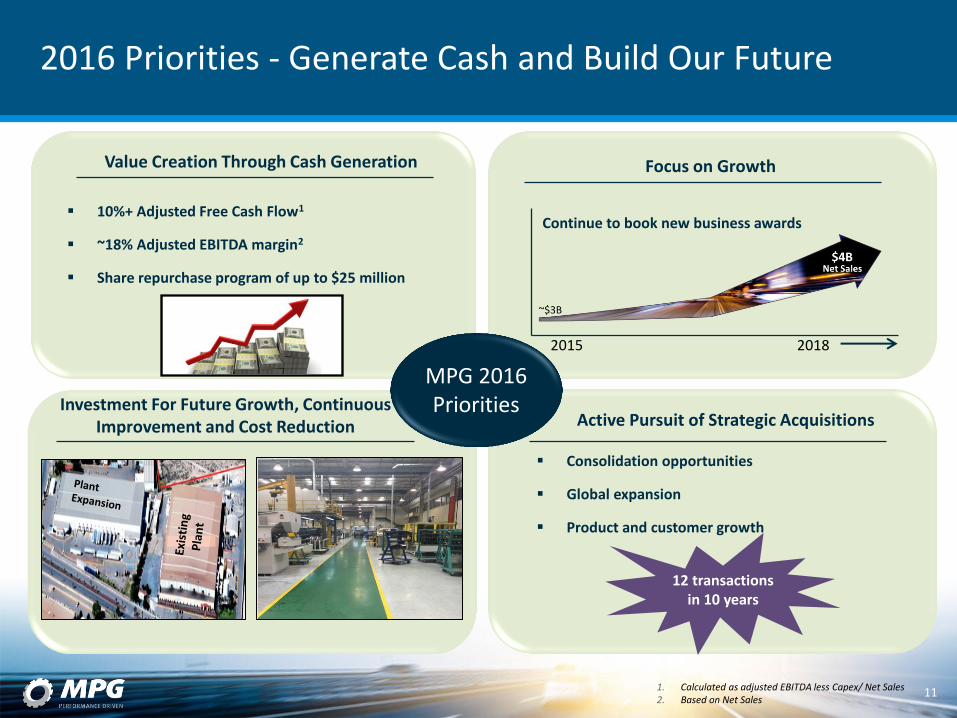
2016 Priorities - Generate Cash and Build Our Future
Investment For Future Growth, Continuous Improvement and Cost Reduction Active Pursuit of Strategic Acquisitions
Value Creation Through Cash Generation
10%+ Adjusted Free Cash Flow1
~18% Adjusted EBITDA margin2
Share repurchase program of up to $25 million
MPG 2016 Priorities
Consolidation opportunities
Global expansion
Product and customer growth
1. Calculated as adjusted EBITDA less Capex/ Net Sales 2. Based on Net Sales
11
12 transactions in 10 years
Focus on Growth
2015 2018
Continue to book new business awards
2015 FINANCIAL RESULTS AND 2016 GUIDANCE
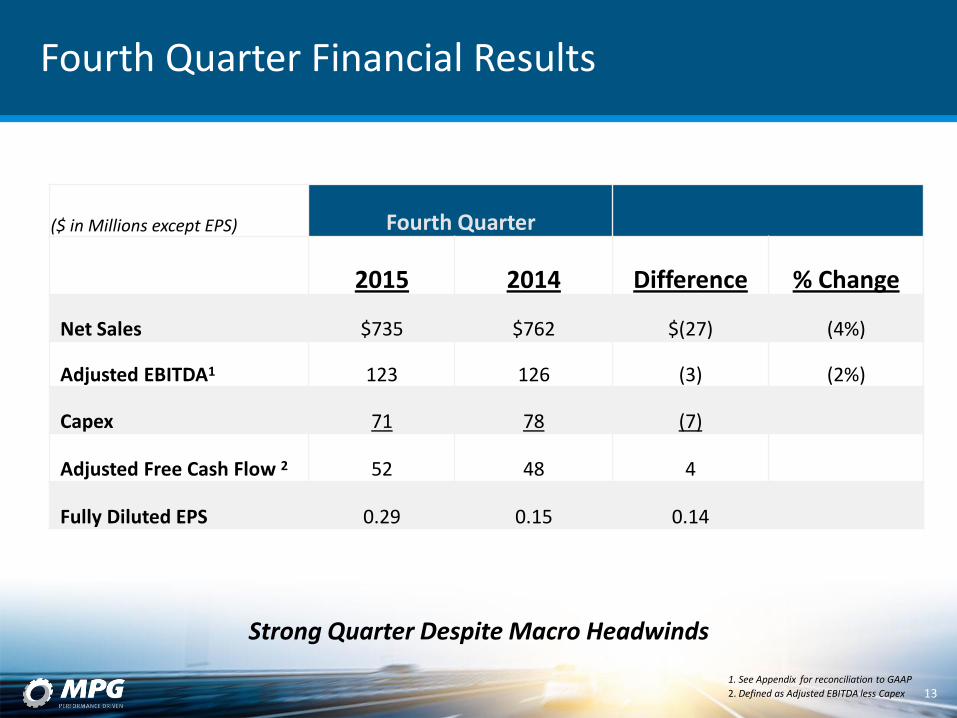
Fourth Quarter Financial Results
($ in Millions except EPS) Fourth Quarter
2015 2014 Difference % Change
Net Sales $735 $762 $(27) (4%)
Adjusted EBITDA1 123 126 (3) (2%)
Capex 71 78 (7)
Adjusted Free Cash Flow 2 52 48 4
Fully Diluted EPS 0.29 0.15 0.14
1. See Appendix for reconciliation to GAAP
2. Defined as Adjusted EBITDA less Capex
13
Strong Quarter Despite Macro Headwinds

$762.2 $713.6 735.3
(13.5) (35.1) 29.8 (8.1)
Q4 2014 ForeignCurrency
MetalsSurcharge
Q4 2014 Adj. forMacro Effects
Volume/Mix Price Q4 2015
Fourth Quarter Bridge 2014 – 2015
($ in Millions) Macro Effects
Net
Sal
es
Ad
just
ed
EB
ITD
A1
14
$125.7 $121.6 $123.2
(0.6) 0.1 (3.6) 7.2 (8.1) 3.6 (1.1)
Q4 2014 ForeignCurrency
MetalsSurcharge
Scrap Sales Q4 2014 Adj.for Macro
Effects
Volume/Mix Price Perf./Econ./Cost Reductions
SG&A/ Other Q4 2015
1. See Appendix for reconciliation to GAAP
4.2% growth

Full Year Financial Results
($ in Millions except EPS) Full Year
2015 2014 Difference % Change
Net Sales $3,047 $2,717 $330 12%
Adjusted EBITDA1 538 479 59 12%
Capex 220 177 43
Adjusted Free Cash Flow 2 318 302 16
Fully Diluted EPS 1.80 1.06 0.74
1. See Appendix for reconciliation to GAAP
2. Defined as Adjusted EBITDA less Capex
15
Record Full Year Results

$2,717.0 $2,565.6 $3,047.3
(70.0) (81.4) 408.5
90.8 (17.6)
FY 2014 ForeignCurrency
MetalsSurcharge
FY 2014 Adj. forMacro Effects
GredeAcquisition(Jan - May)
Volume/Mix Price FY 2015
$478.6 $462.5 $538.2
(4.2) (0.9) (11.0) 65.0 28.0 (17.6) 8.0 (7.7)
FY 2014 ForeignCurrency
MetalsSurcharge
Scrap Sales FY 2014 Adj. forMacro Effects
GredeAcquisition(Jan - May)
Volume/Mix Price Perf./Econ./Cost Reductions
SG&A/ Other FY 2015
Full Year 2014 – 2015
($ in Millions)
Net
Sal
es
Ad
just
ed
EB
ITD
A1
16
Macro Effects
1. See Appendix for reconciliation to GAAP
3.5% growth
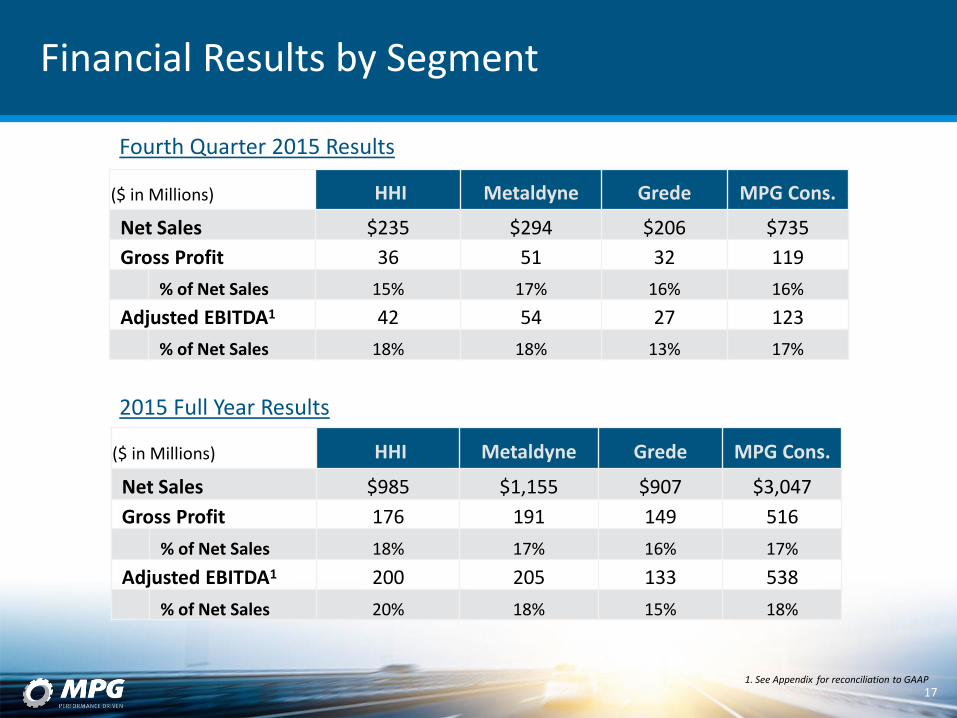
Financial Results by Segment
($ in Millions) HHI Metaldyne Grede MPG Cons.
Net Sales $235 $294 $206 $735
Gross Profit 36 51 32 119
% of Net Sales 15% 17% 16% 16%
Adjusted EBITDA1 42 54 27 123
% of Net Sales 18% 18% 13% 17%
1. See Appendix for reconciliation to GAAP
17
($ in Millions) HHI Metaldyne Grede MPG Cons.
Net Sales $985 $1,155 $907 $3,047
Gross Profit 176 191 149 516
% of Net Sales 18% 17% 16% 17%
Adjusted EBITDA1 200 205 133 538
% of Net Sales 20% 18% 15% 18%
Fourth Quarter 2015 Results
2015 Full Year Results
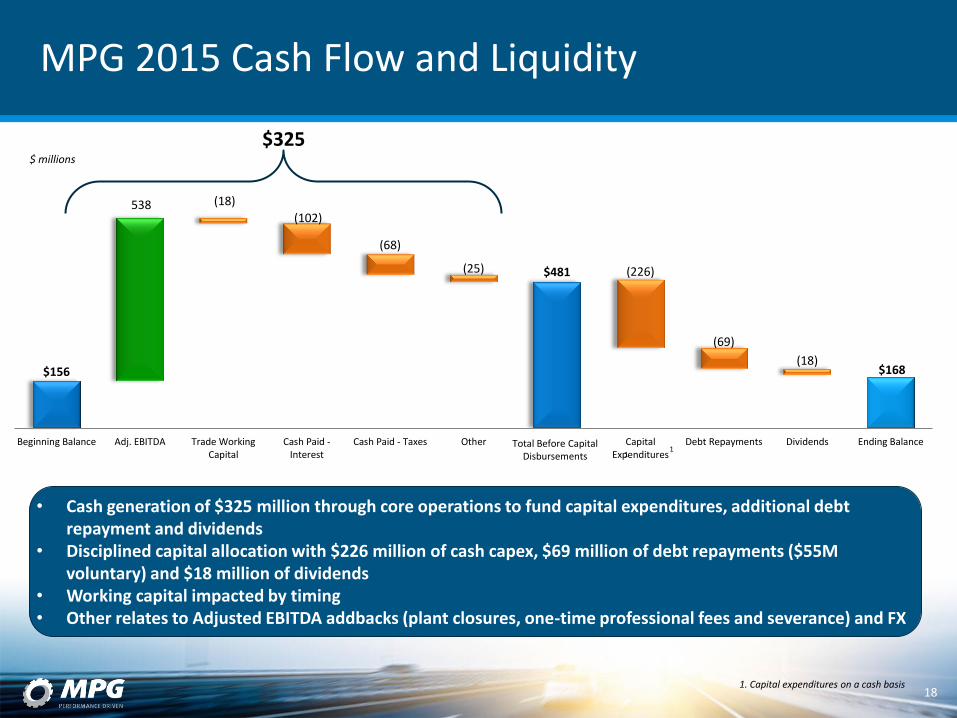
$156
$481
$168
538 (18)
(102)
(68)
(25) (226)
(69)
(18)
Beginning Balance Adj. EBITDA Trade WorkingCapital
Cash Paid -Interest
Cash Paid - Taxes Other CapitalExpenditures
Debt Repayments Dividends Ending Balance
• Cash generation of $325 million through core operations to fund capital expenditures, additional debt repayment and dividends
• Disciplined capital allocation with $226 million of cash capex, $69 million of debt repayments ($55M voluntary) and $18 million of dividends
• Working capital impacted by timing • Other relates to Adjusted EBITDA addbacks (plant closures, one-time professional fees and severance) and FX
MPG 2015 Cash Flow and Liquidity
18
$ millions
$325
1
1. Capital expenditures on a cash basis
Total Before Capital Disbursements
1
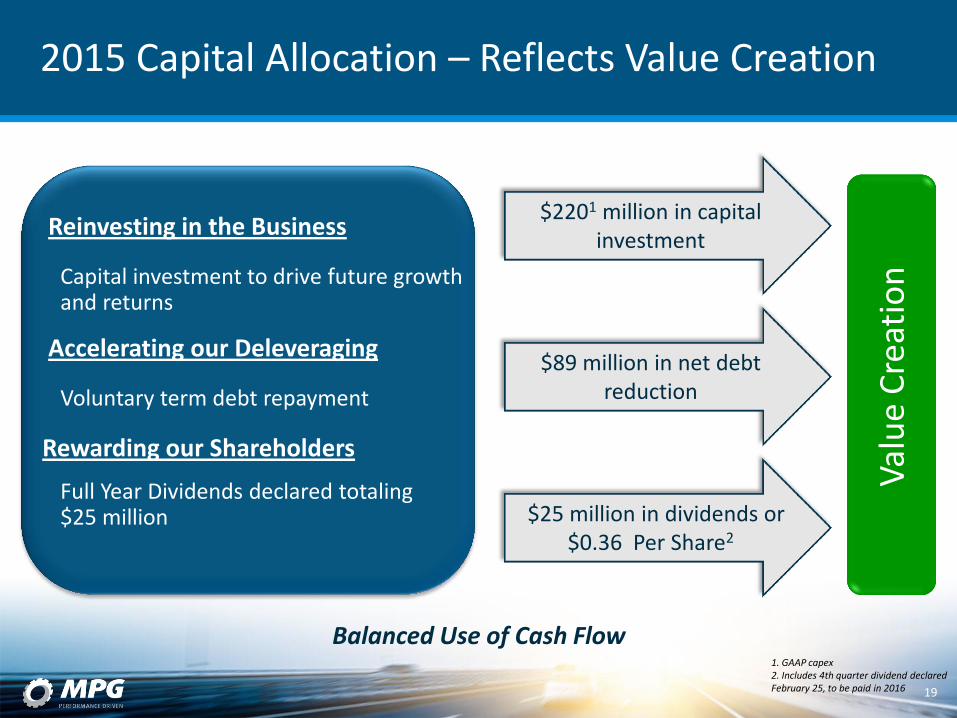
Reinvesting in the Business
Capital investment to drive future growth and returns
Accelerating our Deleveraging
Voluntary term debt repayment
Rewarding our Shareholders
Full Year Dividends declared totaling $25 million
$89 million in net debt reduction
$2201 million in capital investment
$25 million in dividends or $0.36 Per Share2
Balanced Use of Cash Flow
19
2015 Capital Allocation – Reflects Value Creation
Val
ue
Cre
atio
n
1. GAAP capex 2. Includes 4th quarter dividend declared February 25, to be paid in 2016
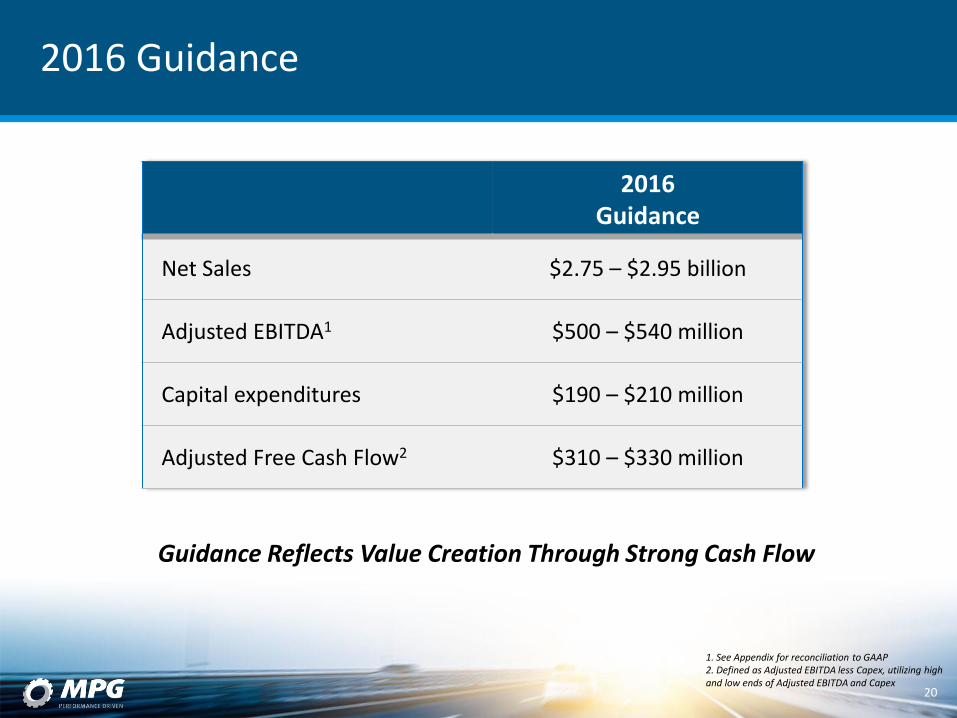
2016 Guidance
2016 Guidance
Net Sales $2.75 – $2.95 billion
Adjusted EBITDA1 $500 – $540 million
Capital expenditures $190 – $210 million
Adjusted Free Cash Flow2 $310 – $330 million
1. See Appendix for reconciliation to GAAP 2. Defined as Adjusted EBITDA less Capex, utilizing high and low ends of Adjusted EBITDA and Capex 20
Guidance Reflects Value Creation Through Strong Cash Flow

Reinvesting in the Business
Capital investment to drive future growth and returns
Continue Deleveraging
Cash flow to reduce net debt
Rewarding our Shareholders
Maintain dividends
Share Repurchase
Board authorized up to $25 million share repurchase given market valuation
Net debt reduction through cash flow
$190 - $210 million in capital investment
Shareholder returns through dividends
Balanced Use of Cash Flow
21
2016 Planned Capital Allocation
Val
ue
Cre
atio
n
Share repurchase

Why Invest in MPG – Continued Shareholder Value Creation and Long-Term Growth
~$3B
2016 Guidance
• Adj. Free Cash Flow: $310 – $330 million
• Adj. EBITDA margin: ~18%
• Base business growth
22
2015 Results
• Adj. Free Cash Flow1: $318 million
• Adj. EBITDA margin: 17.7%
• New business wins: $727 million2
Near-Term Focus
1. Adjusted EBITDA less Capex 2. Based on peak Net Sales
Targeted Growth
$4B Net Sales
• Launch and ramp-up of new programs
• Capture value-added, powertrain content
• Continue global expansion
Anticipated Key Drivers

Q&A

APPENDIX
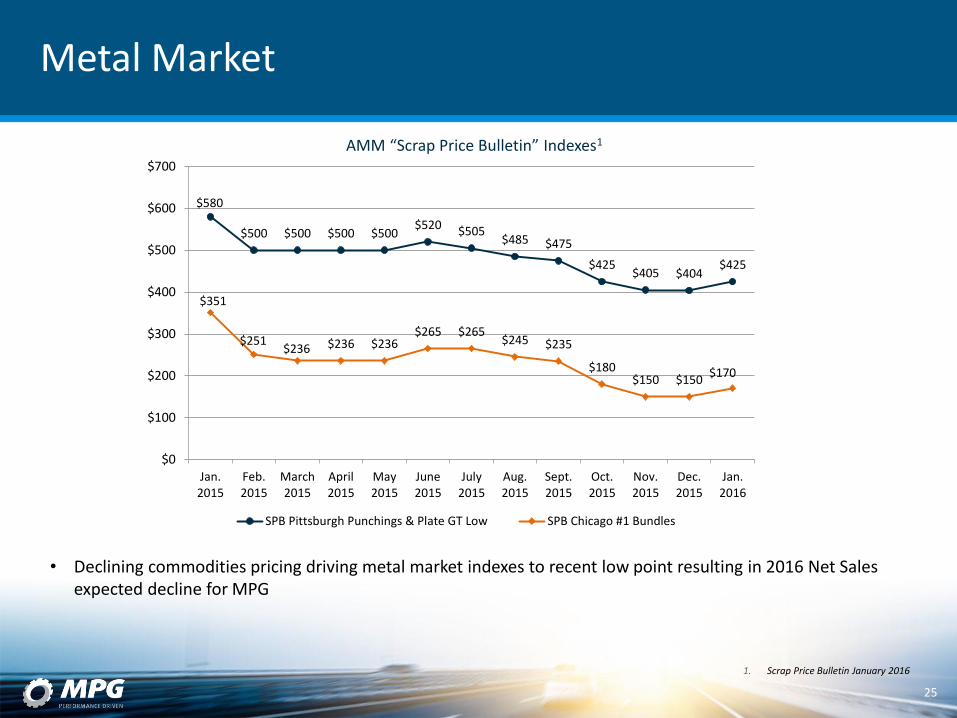
$580
$500 $500 $500 $500 $520 $505
$485 $475
$425 $405 $404
$425
$351
$251 $236 $236 $236
$265 $265 $245 $235
$180 $150 $150
$170
$0
$100
$200
$300
$400
$500
$600
$700
Jan.2015
Feb.2015
March2015
April2015
May2015
June2015
July2015
Aug.2015
Sept.2015
Oct.2015
Nov.2015
Dec.2015
Jan.2016
SPB Pittsburgh Punchings & Plate GT Low SPB Chicago #1 Bundles
1. Scrap Price Bulletin January 2016
Metal Market
• Declining commodities pricing driving metal market indexes to recent low point resulting in 2016 Net Sales expected decline for MPG
AMM “Scrap Price Bulletin” Indexes1
25
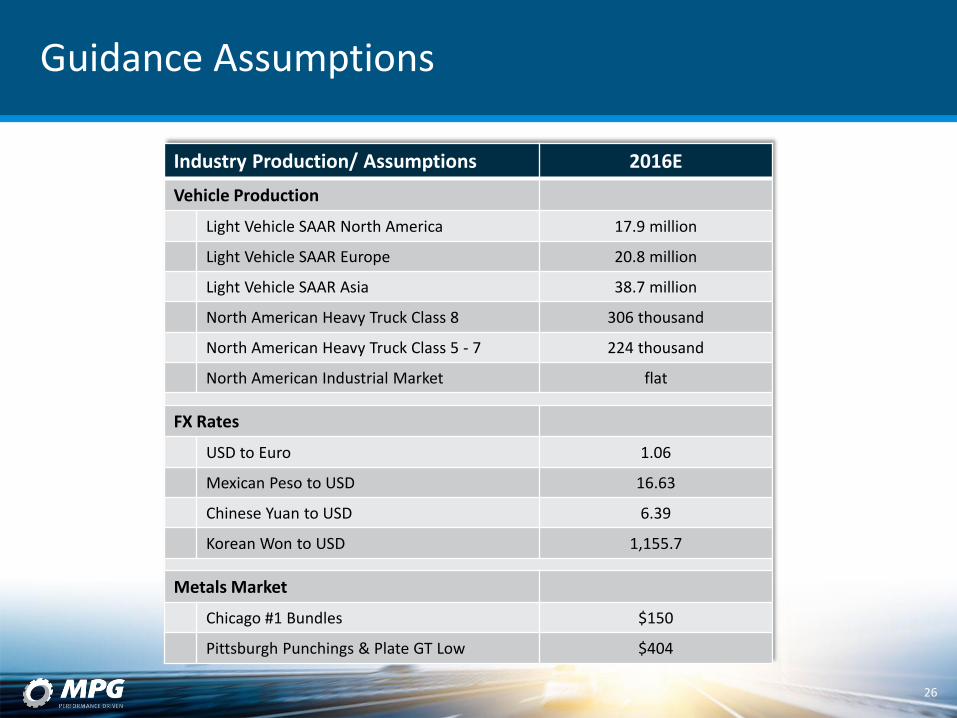
Guidance Assumptions
Industry Production/ Assumptions 2016E
Vehicle Production
Light Vehicle SAAR North America 17.9 million
Light Vehicle SAAR Europe 20.8 million
Light Vehicle SAAR Asia 38.7 million
North American Heavy Truck Class 8 306 thousand
North American Heavy Truck Class 5 - 7 224 thousand
North American Industrial Market flat
FX Rates
USD to Euro 1.06
Mexican Peso to USD 16.63
Chinese Yuan to USD 6.39
Korean Won to USD 1,155.7
Metals Market
Chicago #1 Bundles $150
Pittsburgh Punchings & Plate GT Low $404
26
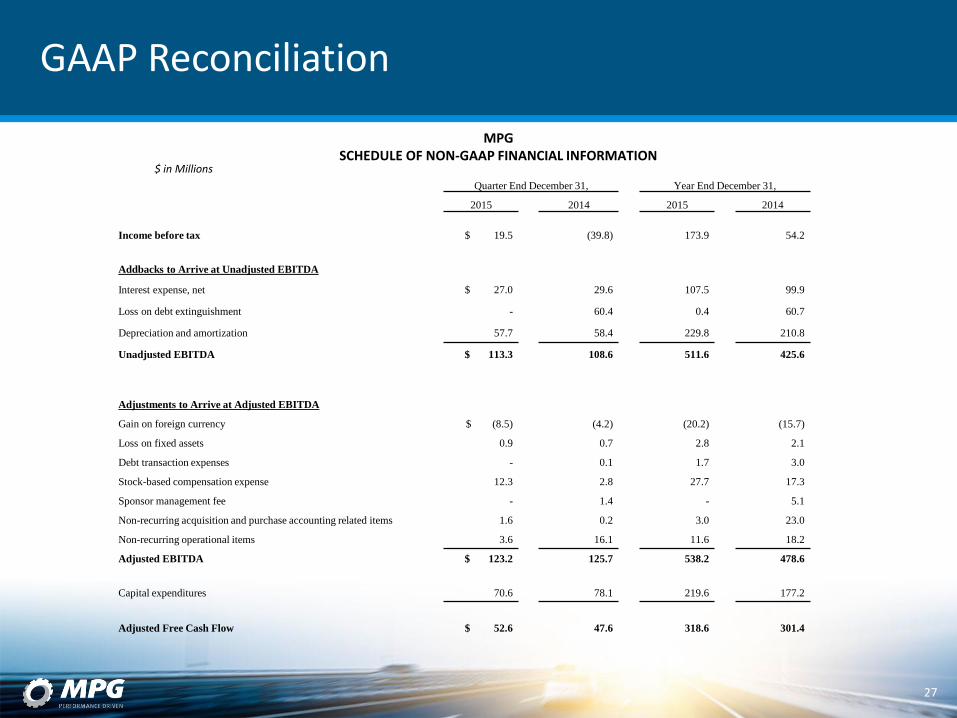
GAAP Reconciliation
MPG SCHEDULE OF NON-GAAP FINANCIAL INFORMATION
27
$ in Millions
Quarter End December 31, Year End December 31,
2015 2014 2015 2014
Income before tax $ 19.5 (39.8) 173.9 54.2
Addbacks to Arrive at Unadjusted EBITDA
Interest expense, net $ 27.0 29.6 107.5 99.9
Loss on debt extinguishment - 60.4 0.4 60.7
Depreciation and amortization 57.7 58.4 229.8 210.8
Unadjusted EBITDA $ 113.3 108.6 511.6 425.6
Adjustments to Arrive at Adjusted EBITDA $ (8.5)
(4.2)
(20.2)
(15.7) Gain on foreign currency
Loss on fixed assets 0.9 0.7 2.8 2.1
Debt transaction expenses - 0.1 1.7 3.0
Stock-based compensation expense 12.3 2.8 27.7 17.3
Sponsor management fee - 1.4 - 5.1
Non-recurring acquisition and purchase accounting related items 1.6 0.2 3.0 23.0
Non-recurring operational items 3.6 16.1 11.6 18.2
Adjusted EBITDA $ 123.2 125.7 538.2 478.6
Capital expenditures 70.6 78.1 219.6 177.2
Adjusted Free Cash Flow $ 52.6 47.6 318.6 301.4
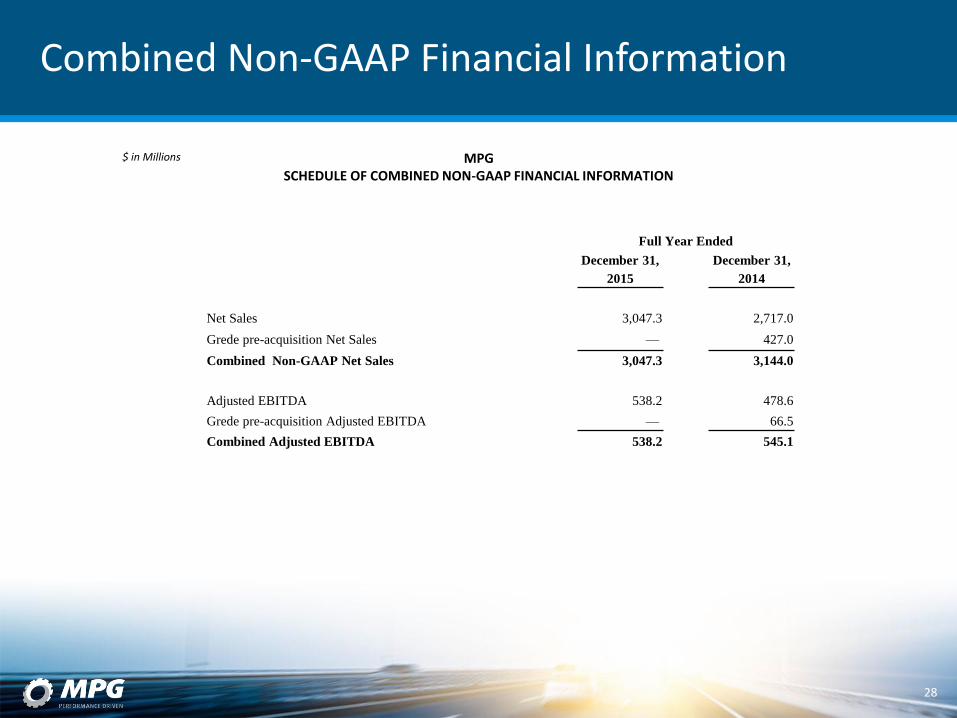
Combined Non-GAAP Financial Information
MPG SCHEDULE OF COMBINED NON-GAAP FINANCIAL INFORMATION
28
Full Year Ended
December 31,
2015
December 31,
2014
Net Sales 3,047.3 2,717.0
Grede pre-acquisition Net Sales — 427.0
Combined Non-GAAP Net Sales 3,047.3 3,144.0
Adjusted EBITDA 538.2 478.6
Grede pre-acquisition Adjusted EBITDA — 66.5
Combined Adjusted EBITDA 538.2 545.1
$ in Millions
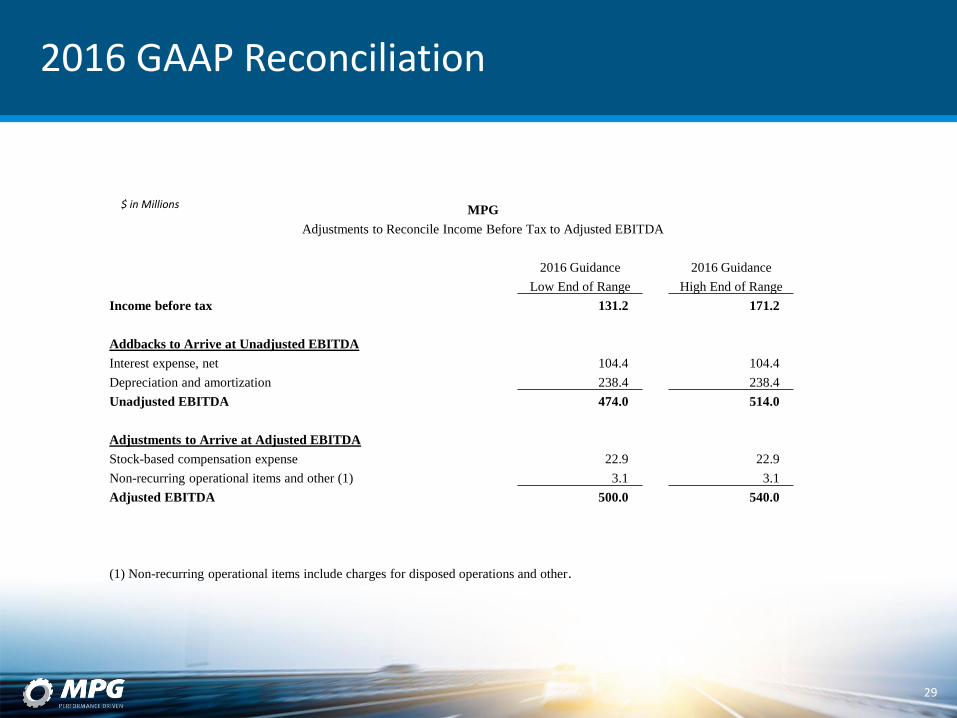
MPG
Adjustments to Reconcile Income Before Tax to Adjusted EBITDA
2016 Guidance 2016 Guidance
Low End of Range High End of Range
Income before tax 131.2 171.2
Addbacks to Arrive at Unadjusted EBITDA
Interest expense, net 104.4 104.4
Depreciation and amortization 238.4 238.4
Unadjusted EBITDA 474.0 514.0
Adjustments to Arrive at Adjusted EBITDA
Stock-based compensation expense 22.9 22.9
Non-recurring operational items and other (1) 3.1 3.1
Adjusted EBITDA 500.0 540.0
(1) Non-recurring operational items include charges for disposed operations and other.
2016 GAAP Reconciliation
$ in Millions
29