a fluorescent variant of a protein from the stony coral montipora facilitates dual-color...
TRANSCRIPT
A fluorescent variant of a protein from the stony coralMontipora facilitates dual-color single-laser fluorescencecross-correlation spectroscopyTakako Kogure1, Satoshi Karasawa1–3, Toshio Araki1–3, Kenta Saito4, Masataka Kinjo4 & Atsushi Miyawaki1
Dual-color fluorescence cross-correlation spectroscopy (FCCS)
is a promising technique for quantifying protein-protein
interactions1–5. In this technique, two different fluorescent
labels are excited and detected simultaneously within a
common measurement volume. Difficulties in aligning
two laser lines and emission crossover between the two
fluorophores, however, make this technique complex. To
overcome these limitations, we developed a fluorescent
protein with a large Stokes shift. This protein, named Keima,
absorbs and emits light maximally at 440 nm and 620 nm,
respectively. Combining a monomeric version of Keima with
cyan fluorescent protein allowed dual-color FCCS with a single
458-nm laser line and complete separation of the fluorescent
protein emissions. This FCCS approach enabled sensitive
detection of proteolysis by caspase-3 and the association of
calmodulin with calmodulin-dependent enzymes. In addition,
Keima and a spectral variant that emits maximally at 570 nm
might facilitate simultaneous multicolor imaging with single-
wavelength excitation.
Dual-color FCCS has several advantages over standard fluorescencecorrelation spectroscopy (FCS). Whereas FCS detects molecular con-centrations and mobility3, FCCS enables the tracing of two spectrallydistinguishable fluorophores, thus extracting essential informationabout the kinetics of molecular interactions1–5. FCCS requires twofluorophores of different colors. For simultaneous excitation of thetwo fluorophores, two lasers are aligned to the same confocal spot.Bringing two laser beams to a perfect and stable overlap, however, isoften difficult. Although FCCS can be performed using a single laserline (SL-FCCS) for single-photon excitation6, complex mathematicalcomputations are required to compensate for cross-excitation, cross-talk and fluorescence resonance energy transfer (FRET) when com-mon fluorophores that have broad excitation and emission spectraand modest Stokes shifts are used. Thus, simple SL-FCCS has beenachieved only with special fluorophores, such as ‘MegaStokes’ dyes(http://www.dyomics.com/), although some innovative techniques forspecific labeling of recombinant proteins with organic dyes7 might
render the MegaStokes dyes more applicable. One solution for efficientsimultaneous excitation may come from two-photon excitation (TPE)microscopy8; two differently colored fluorophores can be excitedsimultaneously by a single infrared, ultra-short pulse laser line becauseof the blue-shift effect. Although TPE-SL-FCCS performs well9–12, itrequires expensive equipment and specialized expertise. Also, in TPE,the rate of bleaching per unit excitation increases supralinearly withpulse intensity13,14. This increase may add another decay component,thereby complicating analyses.
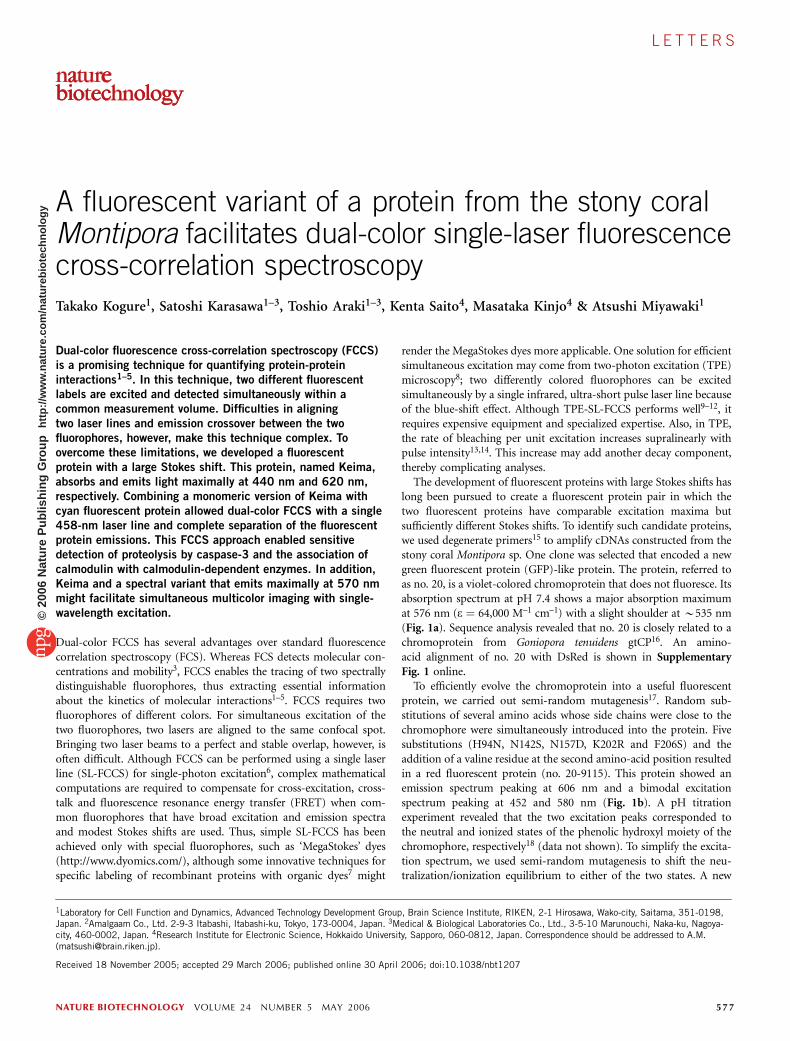
The development of fluorescent proteins with large Stokes shifts haslong been pursued to create a fluorescent protein pair in which thetwo fluorescent proteins have comparable excitation maxima butsufficiently different Stokes shifts. To identify such candidate proteins,we used degenerate primers15 to amplify cDNAs constructed from thestony coral Montipora sp. One clone was selected that encoded a newgreen fluorescent protein (GFP)-like protein. The protein, referred toas no. 20, is a violet-colored chromoprotein that does not fluoresce. Itsabsorption spectrum at pH 7.4 shows a major absorption maximumat 576 nm (e ¼ 64,000 M–1 cm–1) with a slight shoulder at B535 nm(Fig. 1a). Sequence analysis revealed that no. 20 is closely related to achromoprotein from Goniopora tenuidens gtCP16. An amino-acid alignment of no. 20 with DsRed is shown in SupplementaryFig. 1 online.
To efficiently evolve the chromoprotein into a useful fluorescentprotein, we carried out semi-random mutagenesis17. Random sub-stitutions of several amino acids whose side chains were close to thechromophore were simultaneously introduced into the protein. Fivesubstitutions (H94N, N142S, N157D, K202R and F206S) and theaddition of a valine residue at the second amino-acid position resultedin a red fluorescent protein (no. 20-9115). This protein showed anemission spectrum peaking at 606 nm and a bimodal excitationspectrum peaking at 452 and 580 nm (Fig. 1b). A pH titrationexperiment revealed that the two excitation peaks corresponded tothe neutral and ionized states of the phenolic hydroxyl moiety of thechromophore, respectively18 (data not shown). To simplify the excita-tion spectrum, we used semi-random mutagenesis to shift the neu-tralization/ionization equilibrium to either of the two states. A new
Received 18 November 2005; accepted 29 March 2006; published online 30 April 2006; doi:10.1038/nbt1207
1Laboratory for Cell Function and Dynamics, Advanced Technology Development Group, Brain Science Institute, RIKEN, 2-1 Hirosawa, Wako-city, Saitama, 351-0198,Japan. 2Amalgaam Co., Ltd. 2-9-3 Itabashi, Itabashi-ku, Tokyo, 173-0004, Japan. 3Medical & Biological Laboratories Co., Ltd., 3-5-10 Marunouchi, Naka-ku, Nagoya-city, 460-0002, Japan. 4Research Institute for Electronic Science, Hokkaido University, Sapporo, 060-0812, Japan. Correspondence should be addressed to A.M.([email protected]).
NATURE BIOTECHNOLOGY VOLUME 24 NUMBER 5 MAY 2006 577
L E T T E R S©
2006
Nat
ure
Pub
lishi
ng G
roup
ht
tp://
ww
w.n
atur
e.co
m/n
atur
ebio
tech
nolo
gy
fluorescent protein with four mutations (S61F, I92T, F158Y andS213A) seemed to exist principally in the neutral state; the 580-nmpeak was substantially reduced. Additionally, compared with those ofno. 20-9115, the excitation peak of the neutral state and the emissionpeak were slightly blue-shifted and red-shifted, respectively. As aresult, the protein absorbs light maximally at 440 nm and emits afar-red fluorescence maximally at 616 nm (Fig. 1c). Owing to the largeStokes shift, we named the protein ‘Keima,’ a shogi (Japanese chess)piece that hops in the manner of the knight in chess.
The absolute molecular mass of Keima was determined to be106 kDa by analytical equilibrium ultracentrifugation analysis(Supplementary Fig. 2a online). This value was four times largerthan the 25-kDa value deduced from the primary structure of theprotein, suggesting that Keima forms a homotetrameric complex(referred to hereafter as ‘tKeima’). At pH 7.4, the molar extinctioncoefficient (e) at 440 nm and fluorescence quantum yield (F) oftKeima were 14,500 M–1 cm–1 and 0.22, respectively. The monomericversion of DsRed was previously generated by altering 33 amino-acidresidues19. Assuming that the structure of tKeima is similar to that ofthe DsRed tetramer, we introduced V123T into the AB interface.Another mutation (V191I) was introduced to increase the foldingefficiency of the mutant. The absolute molecular mass of 52.2 kDa(Supplementary Fig. 2b) was almost twice the predicted size of themonomer. This dimeric protein was named ‘dKeima.’ Compared totKeima, dKeima showed the same absorption spectrum peaking at440 nm (e ¼ 24,600 M–1 cm–1), the same excitation/emission spectra(Fig. 1c) and a F of 0.31. After numerous cycles of semi-randommutagenesis, we successfully inhibited the formation of the AC dimerby introducing seven additional mutations (L60Q, F61L, V79F, T92S,T123E, Y188R and Y190E) to produce ‘mKeima,’ a monomericprotein. The absolute molecular mass of mKeima was 31 kDa
(Supplementary Fig. 2c). mKeima showed the same spectra as tKeimaand dKeima except that the emission maximum was 620 nm (Fig. 1d).The e at 440 nm and F of mKeima were 14,400 M–1 cm–1 and 0.24,respectively. The mutations introduced into no. 20 to form mKeimaare summarized in Supplementary Fig. 1. Additionally, the spectralcharacteristics of tKeima, dKeima and mKeima are summarized inSupplementary Table 1 online.
1.0
0.5
0.0700600500400
Abs
.
Nor
. F. I
.
1.0
0.5
0.0700600500400
1.0
0.5
0.0700600500400
a b c d
e
Wavelength (nm)
Wavelength (nm)Wavelength (nm)Wavelength (nm)Wavelength (nm)
Nor
. F. I
.
Nor
. F. I
.
440 1.0
0.5
0.0700600500400
440 620616578 606576
Nor
. F. I
. or
%T
1.0
0.5
0.0700600500400
LP610BP475–525
Figure 1 In vitro evolution of a chromoprotein from the stony coral Montipora sp. into a fluorescent protein
with a large Stokes shift. Peaks of the excitation and emission spectra are indicated. Nor. F. I., normalized
fluorescence intensity. Excitation and emission spectra are represented by broken and solid lines, respectively.
(a) The absorption spectrum of no. 20. (b) Excitation and emission spectra of no. 20-9115. (c) Excitation and
emission spectra of tKeima and dKeima. (d) Excitation and emission spectra of mKeima. (e) Excitation and
emission spectra of cyan fluorescent protein (CFP) and mKeima (red), and the transmittance (%T) curves (black)
of the filters used for detection of the emitted signals: BP475-525 (for CFP) and LP610 (for mKeima).
0.01
0.00
Gc(
τ)
Anti-Fas Ab (–)
Anti-Fas Ab (+)
100 101 102 103 104 105 106
100 101 102 103 104 105 106
τ (µs)
b
CFPmKeima DEVDa
0
C.R
.
350
05 10
mKeima
CFP
Anti-Fas Ab (–)
Time (s)0
C.R
.
350
05 10
Anti-Fas Ab (+)
mKeima
CFP
c
100
0
C.R
.
151050
mKeima
CFP
0 s
100
0
C.R
.
151050
mKeima
CFP
420 s
420 s
60 s
0 s
0.00
0.05
τ (µs)
Gc(
τ)
Time (s)
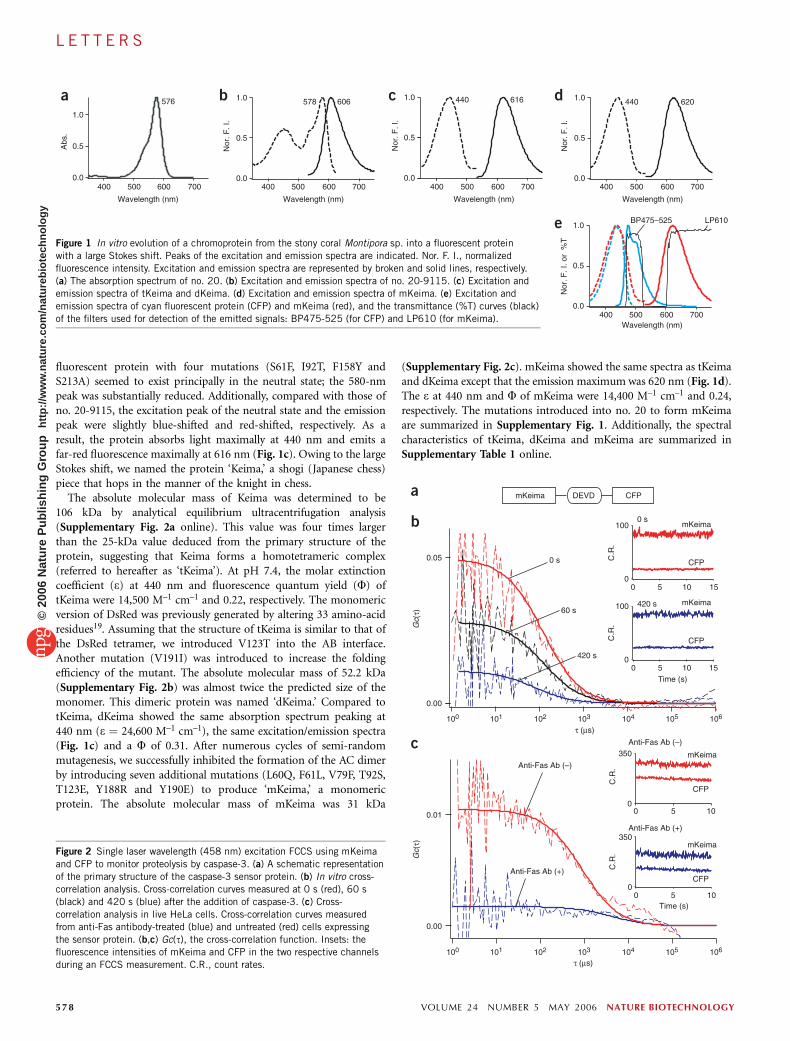
Figure 2 Single laser wavelength (458 nm) excitation FCCS using mKeima
and CFP to monitor proteolysis by caspase-3. (a) A schematic representation
of the primary structure of the caspase-3 sensor protein. (b) In vitro cross-
correlation analysis. Cross-correlation curves measured at 0 s (red), 60 s
(black) and 420 s (blue) after the addition of caspase-3. (c) Cross-
correlation analysis in live HeLa cells. Cross-correlation curves measuredfrom anti-Fas antibody-treated (blue) and untreated (red) cells expressing
the sensor protein. (b,c) Gc(t), the cross-correlation function. Insets: the
fluorescence intensities of mKeima and CFP in the two respective channels
during an FCCS measurement. C.R., count rates.
578 VOLUME 24 NUMBER 5 MAY 2006 NATURE BIOTECHNOLOGY
L E T T E R S©
2006
Nat
ure
Pub
lishi
ng G
roup
ht
tp://
ww
w.n
atur
e.co
m/n
atur
ebio
tech
nolo
gy
We tried to establish an SL-FCCS system solely based on fluorescentproteins. Combined use of a cyan-emitting variant of Aequoreavictoria GFP (CFP)18 and mKeima permitted simple but efficientSL-FCCS, because the two fluorescent proteins possess nearly identicalexcitation spectra and completely separable emission spectra (Fig. 1e).Also, there is no FRET between CFP and Keima.
The C terminus of mKeima and the N terminus of CFP (ECFP)were linked using a peptide containing the caspase-3 cleavage sequenceDEVD (Fig. 2a). The recombinant protein (mKeima-DEVD-CFP) wasexamined in a chamber using an excitation wavelength of 458 nm.Substantial cross-correlation was observed between the fluctuations inthe two detection channels (Fig. 2b, 0 s). Incubation of the samesample with activated recombinant caspase-3 (0.2 U/ml) at 25 1C for7 min almost completely abolished the cross-correlation signal(Fig. 2b, 420 s). The linear relationship between the relative cross-correlation and the percentage of intact substrate was verified in a
separate experiment in which several mixtures containing variousratios of intact caspase-3 substrates (mKeima-DEVD-CFP) to purifiedmKeima and CFP were used to measure cross-correlation signals(Supplementary Fig. 3a online). The proteolysis was then examinedin apoptotic cells. The same FCCS experiments were conducted withHeLa cells transfected with cDNA coding for mKeima-DEVD-CFP.The degree of cross-correlation was substantially different betweenanti-Fas antibody-treated and untreated cells (Fig. 2c). It is importantto note that in an mKeima-DEVD-CFP-expressing HeLa cell, mKeimaand CFP were photobleached with similar kinetics during strongirradiation at 440 nm (Supplementary Fig. 3b).
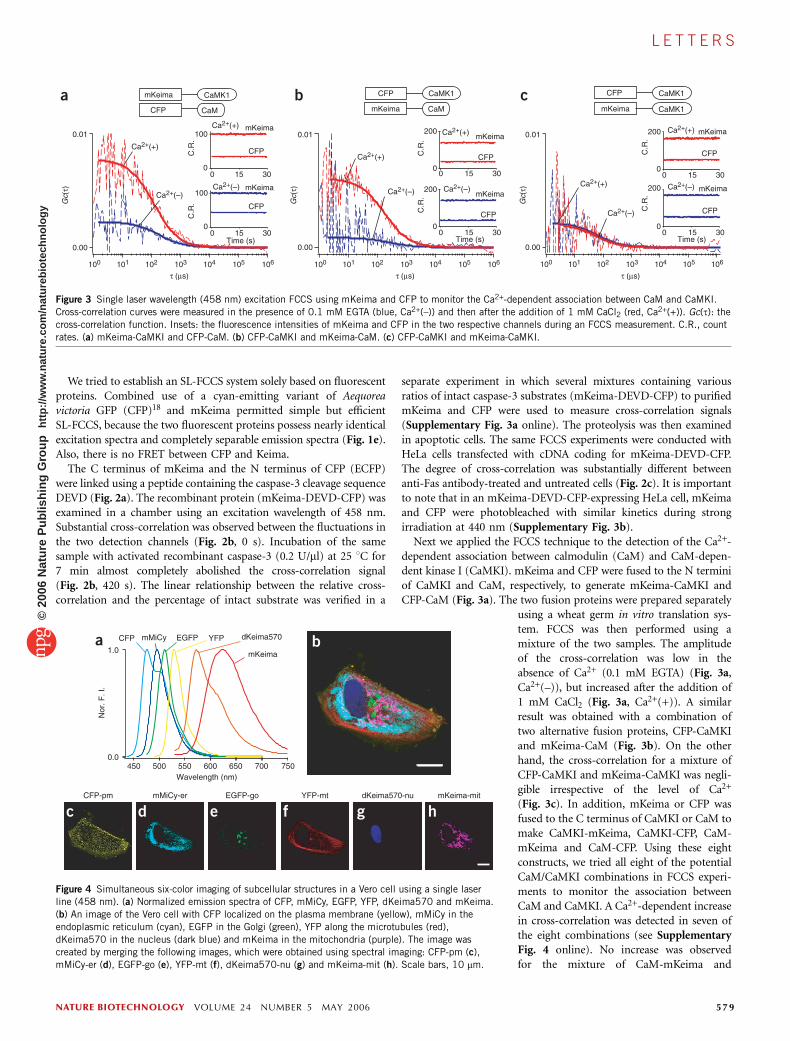
Next we applied the FCCS technique to the detection of the Ca2+-dependent association between calmodulin (CaM) and CaM-depen-dent kinase I (CaMKI). mKeima and CFP were fused to the N terminiof CaMKI and CaM, respectively, to generate mKeima-CaMKI andCFP-CaM (Fig. 3a). The two fusion proteins were prepared separately
using a wheat germ in vitro translation sys-tem. FCCS was then performed using amixture of the two samples. The amplitudeof the cross-correlation was low in theabsence of Ca2+ (0.1 mM EGTA) (Fig. 3a,Ca2+(–)), but increased after the addition of1 mM CaCl2 (Fig. 3a, Ca2+(+)). A similarresult was obtained with a combination oftwo alternative fusion proteins, CFP-CaMKIand mKeima-CaM (Fig. 3b). On the otherhand, the cross-correlation for a mixture ofCFP-CaMKI and mKeima-CaMKI was negli-gible irrespective of the level of Ca2+
(Fig. 3c). In addition, mKeima or CFP wasfused to the C terminus of CaMKI or CaM tomake CaMKI-mKeima, CaMKI-CFP, CaM-mKeima and CaM-CFP. Using these eightconstructs, we tried all eight of the potentialCaM/CaMKI combinations in FCCS experi-ments to monitor the association betweenCaM and CaMKI. A Ca2+-dependent increasein cross-correlation was detected in seven ofthe eight combinations (see SupplementaryFig. 4 online). No increase was observedfor the mixture of CaM-mKeima and
CFP
CaMK1mKeima
CaM
a CFP CaMK1
mKeima CaM
b CFP CaMK1
mKeima CaMK1
c
0.01
0.00
Gc(
τ)
Gc(
τ)
Gc(
τ)
100
τ (µs)
101 102 103 104 105 106 100
τ (µs)
101 102 103 104 105 106 100
τ (µs)
101 102 103 104 105 106
30150
mKeima
CFP
100
0
C.R
.
30150
200
0
mKeima
CFP
30150
mKeima
CFP
200
0
30150
mKeima
CFP
200
0
0.01
0.00
0.01
0.00
Ca2+(+)
Ca2+(+)Ca2+(+)
Ca2+(+)
Ca2+(+)
Ca2+(+)
Ca2+(–)Ca2+(–) Ca2+(–)
Ca2+(–)
Ca2+(–)Ca2+(–)
C.R
.
Time (s)
C.R
.C
.R.
30150
mKeima
CFP
Time (s)
C.R
.100
030150
mKeima
CFP
200
0
Time (s)
C.R
.
Figure 3 Single laser wavelength (458 nm) excitation FCCS using mKeima and CFP to monitor the Ca2+-dependent association between CaM and CaMKI.
Cross-correlation curves were measured in the presence of 0.1 mM EGTA (blue, Ca2+(–)) and then after the addition of 1 mM CaCl2 (red, Ca2+(+)). Gc(t): the
cross-correlation function. Insets: the fluorescence intensities of mKeima and CFP in the two respective channels during an FCCS measurement. C.R., count
rates. (a) mKeima-CaMKI and CFP-CaM. (b) CFP-CaMKI and mKeima-CaM. (c) CFP-CaMKI and mKeima-CaMKI.
bA
Nor
. F. I
.
Wavelength (nm)
1.0
0.0750700650600550500450
mMiCy EGFP YFP dKeima570
mKeima
CFPa
CFP-pm
cmMiCy-er
dEGFP-go
eYFP-mt
fdKeima570-nu mKeima-mit
hg
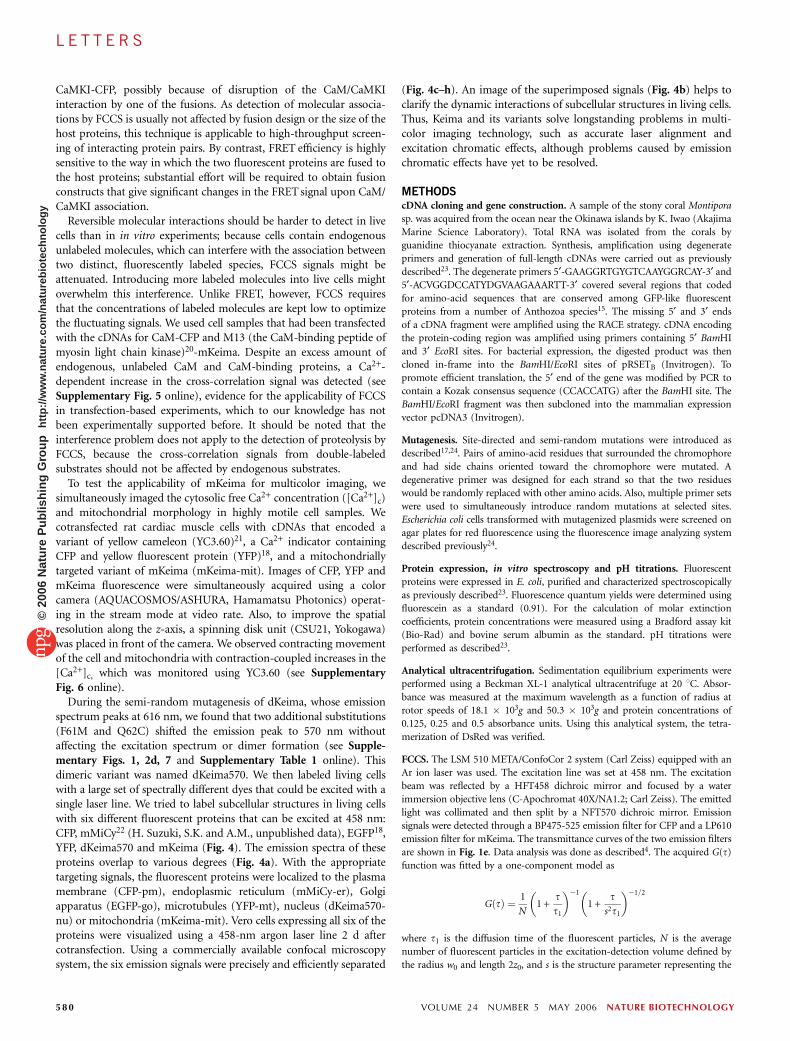
Figure 4 Simultaneous six-color imaging of subcellular structures in a Vero cell using a single laserline (458 nm). (a) Normalized emission spectra of CFP, mMiCy, EGFP, YFP, dKeima570 and mKeima.
(b) An image of the Vero cell with CFP localized on the plasma membrane (yellow), mMiCy in the
endoplasmic reticulum (cyan), EGFP in the Golgi (green), YFP along the microtubules (red),
dKeima570 in the nucleus (dark blue) and mKeima in the mitochondria (purple). The image was
created by merging the following images, which were obtained using spectral imaging: CFP-pm (c),
mMiCy-er (d), EGFP-go (e), YFP-mt (f), dKeima570-nu (g) and mKeima-mit (h). Scale bars, 10 mm.
NATURE BIOTECHNOLOGY VOLUME 24 NUMBER 5 MAY 2006 579
L E T T E R S©
2006
Nat
ure
Pub
lishi
ng G
roup
ht
tp://
ww
w.n
atur
e.co
m/n
atur
ebio
tech
nolo
gy
CaMKI-CFP, possibly because of disruption of the CaM/CaMKIinteraction by one of the fusions. As detection of molecular associa-tions by FCCS is usually not affected by fusion design or the size of thehost proteins, this technique is applicable to high-throughput screen-ing of interacting protein pairs. By contrast, FRET efficiency is highlysensitive to the way in which the two fluorescent proteins are fused tothe host proteins; substantial effort will be required to obtain fusionconstructs that give significant changes in the FRET signal upon CaM/CaMKI association.
Reversible molecular interactions should be harder to detect in livecells than in in vitro experiments; because cells contain endogenousunlabeled molecules, which can interfere with the association betweentwo distinct, fluorescently labeled species, FCCS signals might beattenuated. Introducing more labeled molecules into live cells mightoverwhelm this interference. Unlike FRET, however, FCCS requiresthat the concentrations of labeled molecules are kept low to optimizethe fluctuating signals. We used cell samples that had been transfectedwith the cDNAs for CaM-CFP and M13 (the CaM-binding peptide ofmyosin light chain kinase)20-mKeima. Despite an excess amount ofendogenous, unlabeled CaM and CaM-binding proteins, a Ca2+-dependent increase in the cross-correlation signal was detected (seeSupplementary Fig. 5 online), evidence for the applicability of FCCSin transfection-based experiments, which to our knowledge has notbeen experimentally supported before. It should be noted that theinterference problem does not apply to the detection of proteolysis byFCCS, because the cross-correlation signals from double-labeledsubstrates should not be affected by endogenous substrates.
To test the applicability of mKeima for multicolor imaging, wesimultaneously imaged the cytosolic free Ca2+ concentration ([Ca2+]c)and mitochondrial morphology in highly motile cell samples. Wecotransfected rat cardiac muscle cells with cDNAs that encoded avariant of yellow cameleon (YC3.60)21, a Ca2+ indicator containingCFP and yellow fluorescent protein (YFP)18, and a mitochondriallytargeted variant of mKeima (mKeima-mit). Images of CFP, YFP andmKeima fluorescence were simultaneously acquired using a colorcamera (AQUACOSMOS/ASHURA, Hamamatsu Photonics) operat-ing in the stream mode at video rate. Also, to improve the spatialresolution along the z-axis, a spinning disk unit (CSU21, Yokogawa)was placed in front of the camera. We observed contracting movementof the cell and mitochondria with contraction-coupled increases in the[Ca2+]c, which was monitored using YC3.60 (see SupplementaryFig. 6 online).
During the semi-random mutagenesis of dKeima, whose emissionspectrum peaks at 616 nm, we found that two additional substitutions(F61M and Q62C) shifted the emission peak to 570 nm withoutaffecting the excitation spectrum or dimer formation (see Supple-mentary Figs. 1, 2d, 7 and Supplementary Table 1 online). Thisdimeric variant was named dKeima570. We then labeled living cellswith a large set of spectrally different dyes that could be excited with asingle laser line. We tried to label subcellular structures in living cellswith six different fluorescent proteins that can be excited at 458 nm:CFP, mMiCy22 (H. Suzuki, S.K. and A.M., unpublished data), EGFP18,YFP, dKeima570 and mKeima (Fig. 4). The emission spectra of theseproteins overlap to various degrees (Fig. 4a). With the appropriatetargeting signals, the fluorescent proteins were localized to the plasmamembrane (CFP-pm), endoplasmic reticulum (mMiCy-er), Golgiapparatus (EGFP-go), microtubules (YFP-mt), nucleus (dKeima570-nu) or mitochondria (mKeima-mit). Vero cells expressing all six of theproteins were visualized using a 458-nm argon laser line 2 d aftercotransfection. Using a commercially available confocal microscopysystem, the six emission signals were precisely and efficiently separated
(Fig. 4c–h). An image of the superimposed signals (Fig. 4b) helps toclarify the dynamic interactions of subcellular structures in living cells.Thus, Keima and its variants solve longstanding problems in multi-color imaging technology, such as accurate laser alignment andexcitation chromatic effects, although problems caused by emissionchromatic effects have yet to be resolved.
METHODScDNA cloning and gene construction. A sample of the stony coral Montipora
sp. was acquired from the ocean near the Okinawa islands by K. Iwao (Akajima
Marine Science Laboratory). Total RNA was isolated from the corals by
guanidine thiocyanate extraction. Synthesis, amplification using degenerate
primers and generation of full-length cDNAs were carried out as previously
described23. The degenerate primers 5¢-GAAGGRTGYGTCAAYGGRCAY-3¢ and
5¢-ACVGGDCCATYDGVAAGAAARTT-3¢ covered several regions that coded
for amino-acid sequences that are conserved among GFP-like fluorescent
proteins from a number of Anthozoa species15. The missing 5¢ and 3¢ ends
of a cDNA fragment were amplified using the RACE strategy. cDNA encoding
the protein-coding region was amplified using primers containing 5¢ BamHI
and 3¢ EcoRI sites. For bacterial expression, the digested product was then
cloned in-frame into the BamHI/EcoRI sites of pRSETB (Invitrogen). To
promote efficient translation, the 5¢ end of the gene was modified by PCR to
contain a Kozak consensus sequence (CCACCATG) after the BamHI site. The
BamHI/EcoRI fragment was then subcloned into the mammalian expression
vector pcDNA3 (Invitrogen).
Mutagenesis. Site-directed and semi-random mutations were introduced as
described17,24. Pairs of amino-acid residues that surrounded the chromophore
and had side chains oriented toward the chromophore were mutated. A
degenerative primer was designed for each strand so that the two residues
would be randomly replaced with other amino acids. Also, multiple primer sets
were used to simultaneously introduce random mutations at selected sites.
Escherichia coli cells transformed with mutagenized plasmids were screened on
agar plates for red fluorescence using the fluorescence image analyzing system
described previously24.
Protein expression, in vitro spectroscopy and pH titrations. Fluorescent
proteins were expressed in E. coli, purified and characterized spectroscopically
as previously described23. Fluorescence quantum yields were determined using
fluorescein as a standard (0.91). For the calculation of molar extinction
coefficients, protein concentrations were measured using a Bradford assay kit
(Bio-Rad) and bovine serum albumin as the standard. pH titrations were
performed as described23.
Analytical ultracentrifugation. Sedimentation equilibrium experiments were
performed using a Beckman XL-1 analytical ultracentrifuge at 20 1C. Absor-
bance was measured at the maximum wavelength as a function of radius at
rotor speeds of 18.1 � 103g and 50.3 � 103g and protein concentrations of
0.125, 0.25 and 0.5 absorbance units. Using this analytical system, the tetra-
merization of DsRed was verified.
FCCS. The LSM 510 META/ConfoCor 2 system (Carl Zeiss) equipped with an
Ar ion laser was used. The excitation line was set at 458 nm. The excitation
beam was reflected by a HFT458 dichroic mirror and focused by a water
immersion objective lens (C-Apochromat 40X/NA1.2; Carl Zeiss). The emitted
light was collimated and then split by a NFT570 dichroic mirror. Emission
signals were detected through a BP475-525 emission filter for CFP and a LP610
emission filter for mKeima. The transmittance curves of the two emission filters
are shown in Fig. 1e. Data analysis was done as described4. The acquired G(t)
function was fitted by a one-component model as
GðtÞ ¼ 1
N1 +
tt1
� ��1
1 +t
s2t1
� ��1=2
where t1 is the diffusion time of the fluorescent particles, N is the average
number of fluorescent particles in the excitation-detection volume defined by
the radius w0 and length 2z0, and s is the structure parameter representing the
580 VOLUME 24 NUMBER 5 MAY 2006 NATURE BIOTECHNOLOGY
L E T T E R S©
2006
Nat
ure
Pub
lishi
ng G
roup
ht
tp://
ww
w.n
atur
e.co
m/n
atur
ebio
tech
nolo
gy
ratio s ¼ z0/w0. For quantitative evaluation, Gc(0) (the amplitude of the cross-
correlation function) is divided by Gk(0) (the amplitude of the autocorrelation
function of mKeima) to calculate the relative cross-correlation (Gc(0)/Gk(0)).
Monitoring the association between CaM and CaMKI. Recombinant proteins
containing CaM/CaMKI and mKeima/CFP were generated using PROTEIOS, a
wheat germ cell-free protein synthesis core kit (TOYOBO). The products were
concentrated using VIVASPIN (VIVASCIENCE). Mixtures of two samples were
analyzed by FCCS. The association between CaM and CaMKI was blocked by
adding 0.1 mM EGTA and then achieved by adding 1 mM CaCl2.
Proteolysis analysis. mKeima-DEVD-CFP was expressed in E. coli and purified
as previously described23. The protein (10 nM) was incubated at 25 1C with
activated caspase-3 (MBL) (0.2 U/ml) in buffer containing 20 mM HEPES-
KOH (pH 7.5), 10 mM KCl, 1.5 mM MgCl2, 1 mM EDTA, 1 mM EGTA and
1 mM dithiothreitol. Two days after transfection with the cDNA coding for
mKeima-DEVD-CFP, HeLa cells in HBSS (Invitrogen) were treated with
100 ng/ml anti-Fas antibodies (CH-11; MBL) and cyclohexamide (10 mg/ml)25.
Multicolor imaging. EGFP-go, YFP-mt, dKeima570-nu and mKeima-mit were
constructed by fusing the 81 N-terminal amino acids of the type II membrane-
anchored protein galactosyltransferase26, the human wild-type tau four-
repeat27, the nuclear localization signal from poly(ADP-ribose) polymerase
(S.K., T.A. and A.M., unpublished results) and the 29 N-terminal amino acids
of the cytochrome c oxidase subunit VIII presequence28 to the N termini of
EGFP (Clontech), YFP, dKeima570 and mKeima, respectively. CFP-pm was
generated by fusing the 20 C-terminal amino acids of K-Ras29 to the
C terminus of ECFP (Clontech). mMiCy-er was generated by extending
mMiCy at the N terminus with the signal peptide from calreticulin and at
the C terminus with an ER retention signal30. cDNAs coding for the chimeric
proteins were transfected into Vero cells using Lipofectamine 2000 (Invitrogen).
Spectra imaging with a single laser line at 458 nm (Ar ion laser) was performed
using the 32 channels of the LSM 510 META system (Carl Zeiss).
Accession codes. DNA Data Bank of Japan: the sequences reported in this
paper have been deposited with accession nos. AB209967, AB209968 and
AB209969.
Note: Supplementary information is available on the Nature Biotechnology website.
ACKNOWLEDGMENTSThe authors would like to thank K. Iwao and S. Hosaka at the Akajima MarineScience Laboratory for acquiring the stony coral animals, Y. Isogai for assistancewith analytical centrifugation, F. Ishidate, K. Weisshart, B. Zimmerman,Y. Hasegawa for assistance with FCCS measurements and spectral imaging, andK. Ishihara, H. Watanabe, T. Fukano, and M. Hirano for assistance with multi-color imaging and fluorescence lifetime measurements. This work was partlysupported by grants from Japan MEXT Grant-in-Aid for Scientific Research onpriority areas, NEDO (the New Energy and Industrial Technology DevelopmentOrganization), HFSP (the Human Frontier Science Program), and RIKENStrategic Research Program.
COMPETING INTERESTS STATEMENTThe authors declare competing financial interests (see the Nature Biotechnologywebsite for details).
Published online at http://www.nature.com/naturebiotechnology/
Reprints and permissions information is available online at http://npg.nature.com/
reprintsandpermissions/
1. Kettling, U., Koltermann, A., Schwille, P. & Eigen, M. Real-time enzyme kineticsmonitored by dual-color fluorescence cross-correlation spectroscopy. Proc. Natl. Acad.Sci. USA 95, 1416–1420 (1998).
2. Weidemann, T., Wachsmuth, M., Tewes, M., Rippe, K. & Langowski, J. Analysis ofligand binding by two-colour fluorescence cross-correlation spectroscopy. Single Mol. 3,49–61 (2002).
3. Kim, S.A. & Schwille, P. Intracellular applications of fluorescence correlationspectroscopy: prospects for neuroscience. Curr. Opin. Neurobiol. 13, 583–590(2003).
4. Saito, K., Wada, I., Tamura, M. & Kinjo, M. Direct detection of caspase-3 activation insingle live cells by cross-correlation analysis. Biochem. Biophys. Res. Commun. 324,849–854 (2004).
5. Kohl, T., Haustein, E. & Schwille, P. Determining protease activity in vivo by fluores-cence cross-correlation analysis. Biophys. J. 89, 2770–2782 (2005).
6. Hwang, L.C. & Wohland, T. Single wavelength excitation fluorescence cross-correlationspectroscopy with spectrally similar fluorophores: Resolution for binding studies.J. Chem. Phys. 122, 114708 (1–11) (2005).
7. Martin, B.R., Giepmans, B.N., Adams, S.R. & Tsien, R.Y. Mammalian cell-basedoptimization of the biarsenical-binding tetracysteine motif for improved fluorescenceand affinity. Nat. Biotechnol. 23, 1308–1314 (2005).
8. Helmchen, F. & Denk, W. New developments in multiphoton microscopy. Curr. Opin.Neurobiol. 12, 593–601 (2002).
9. Heinze, K.G., Koltermann, A. & Schwille, P. Simultaneous two-photon excitation ofdistinct labels for dual-color fluorescence crosscorrelation analysis. Proc. Natl. Acad.Sci. USA 97, 10377–10382 (2000).
10. Kohl, T., Heinze, K.G., Kuhlemann, R., Koltermann, A. & Schwille, P. A protease assayfor two-photon crosscorrelation and FRET analysis based solely on fluorescent proteins.Proc. Natl. Acad. Sci. USA 99, 12161–12166 (2002).
11. Heinze, K.G., Rarbach, M., Jahnz, M. & Schwille, P. Two-photon fluorescence coin-cidence analysis: rapid measurements of enzyme kinetics. Biophys. J. 83, 1671–1681(2002).
12. Kim, S.A., Heinze, K.G., Waxham, M.N. & Schwille, P. Intracellular calmodulinavailability accessed with two-photon cross-correlation. Proc. Natl. Acad. Sci. USA101, 105–110 (2004).
13. Patterson, G.H. & Piston, D.W. Photobleaching in two-photon excitation microscopy.Biophys. J. 78, 2159–2162 (2000).
14. Chen, T.S., Zeng, S.Q., Luo, Q.M., Zhang, Z.H. & Zhou, W. High-order photobleachingof green fluorescent protein inside live cells in two-photon excitation microscopy.Biophys. Biochem. Res. Commun. 291, 1272–1275 (2002).
15. Matz, M.V., Lukyanov, K.A. & Lukyanov, S.A. Family of the green fluorescent protein:journey to the end of the rainbow. Bioessays 24, 953–959 (2002).
16. Labas, Y.A. et al. Diversity and evolution of the green fluorescent protein family. Proc.Natl. Acad. Sci. USA 99, 4256–4261 (2002).
17. Tsutsui, H., Karasawa, S., Shimizu, H., Nukina, N. & Miyawaki, A. Semi-rationalengineering of a coral fluorescent protein into an efficient highlighter. EMBO Rep. 6,233–238 (2005).
18. Tsien, R.Y. The green fluorescent protein. Annu. Rev. Biochem. 67, 509–544 (1998).19. Campbell, R.E. et al. A monomeric red fluorescent protein. Proc. Natl. Acad. Sci. USA
99, 7877–7882 (2002).20. Crivici, A. & Ikura, M. Molecular and structural basis of target recognition by
calmodulin. Annu. Rev. Biophys. Biomol. Struct. 24, 85–116 (1995).21. Nagai, T., Yamada, S., Tominaga, T., Ichikawa, M. & Miyawaki, A. Expanded dynamic
range of fluorescent indicators for Ca2+ by circularly permuted yellow fluorescentproteins. Proc. Natl. Acad. Sci. USA 101, 10554–10559 (2004).
22. Karasawa, S., Araki, T., Nagai, T., Mizuno, H. & Miyawaki, A. Cyan-emitting and orange-emitting fluorescent proteins as a donor/acceptor pair for fluorescence resonanceenergy transfer. Biochem. J. 381, 307–312 (2004).
23. Karasawa, S., Araki, T., Yamamoto-Hino, M. & Miyawaki, A. A green-emitting fluor-escent protein from Galaxeidae coral and its monomeric version for use in fluorescentlabeling. J. Biol. Chem. 278, 34167–34171 (2003).
24. Sawano, A. & Miyawaki, A. Directed evolution of green fluorescent protein by a newversatile PCR strategy for site-directed and semi-random mutagenesis. Nucleic AcidsRes. 28, E78 (2000).
25. Arscott, P.L. et al. Fas (CD95) expression is up-regulated on papillary thyroidcarcinoma. J. Clin. Endocrinol. Metab. 84, 4246–4252 (1999).
26. Llopis, J., McCaffery, J.M., Miyawaki, A., Farquhar, M.G. & Tsien, R.Y. Measurement ofcytosolic, mitochondrial, and Golgi pH in single living cells with green fluorescentproteins. Proc. Natl. Acad. Sci. USA 95, 6803–6808 (1998).
27. Sato, S. et al. Aberrant tau phosphorylation by glycogen synthase kinase-3b and JNK3induces oligomeric tau fibrils in COS-7 cells. J. Biol. Chem. 277, 2060–2065 (2002).
28. Sawano, A., Hama, H., Saito, N. & Miyawaki, A. Multicolor imaging of Ca2+ and proteinkinase C signals using novel epifluorescence microscopy. Biophys. J. 82, 1076–1085(2002).
29. Mochizuki, N. et al. Spatio-temporal images of growth-factor-induced activation of Rasand Rap1. Nature 411, 1065–1068 (2001).
30. Miyawaki, A. et al. Fluorescent indicator for Ca2+ based on green fluorescent proteinsand calmodulin. Nature 388, 882–887 (1997).
NATURE BIOTECHNOLOGY VOLUME 24 NUMBER 5 MAY 2006 581
L E T T E R S©
2006
Nat
ure
Pub
lishi
ng G
roup
ht
tp://
ww
w.n
atur
e.co
m/n
atur
ebio
tech
nolo
gy