a numerical simulation comparing the efficiencies of ... · pdf filea numerical simulation...
TRANSCRIPT
A Numerical Simulation Comparing the Efficiencies of Tubercle Versus Straight
LeadingEdge Airfoils for a Darrieus VerticalAxis Wind
Turbine
By: Ross Neal
Abstract:
The efficiencies of sinusoidal and straight leadingedge airfoils (NACA 0015) in a threestraightwing Darrieus vertical axis wind turbine (VAWT) were compared using a fluid numerical solver (CFX). The airfoils and surrounding air modeled were meshed with body sizing and inflation layer methods and a cylinder mesh containing the surfaces of the airfoils was meshed separately as the mesh would be rotated during numerical solve. To save computing time, only a portion of the height of the VAWT was modeled as the streamlines should be repeating along the vertical leadingedge of the airfoils. The numerical solver computed the torque applied to the rotated cylinder containing the airfoil surfaces at speeds from 15 to 35 rad/s for both designs at 10 m/s inlet wind speed of air with 1.185 kg/m3 density for 4 complete rotations. The resulting torques from the timeseries data were averaged and converted to units of power (W) and coefficient of power and were graphed over rotation speed and tip speed ratio respectively to compare both airfoil designs. Introduction:
Now that gasoline prices have greatly decreased, it is becoming harder for green energy,
such as wind energy, to compete for investments over cheap,
traditional, and polluting power sources such as coal.
Therefore, it is more important now more than ever to make
green energy more attractive by making them more efficient
at producing power. One such solution came from a
company called Whale Power based in Toronto. The
company used biomimetics to design more efficient
airplane wings, vacuum pumps, hydroelectric turbines
and horizontal wind turbines.
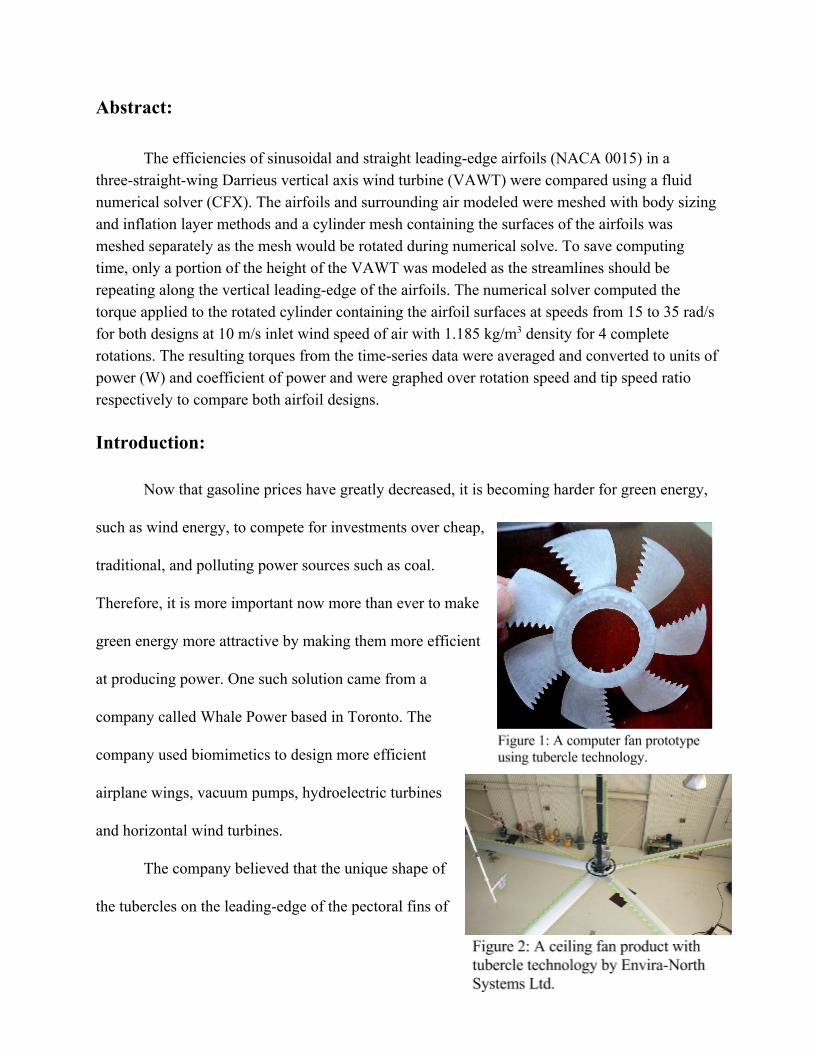
The company believed that the unique shape of
the tubercles on the leadingedge of the pectoral fins of

humpback whales allowed the whales to swim more efficiently than having smooth on fins
allowing the animal to swim with much less effort. In fact, there have been several papers,
experiments, prototypes (shown in Figure 1), and even products (shown in Figure 2)
demonstrating that the tubercle leadingedge airfoils consistently outperform their leadingedge
smooth counterparts . The tubercles on 1 2 3
the leadingedge of the airfoils combine
the best of swept forward and backward
wing designs to redirect streamlines into
bands (shown on Figure 3) which reduces
the turbulent vortices/cavitations and
laminar flow separation that would
normally cause stalls on traditional wings
by increasing the angle of attack (the relative angle between the airspeed vector and the chord of
the airfoil blade) shown in Figure 4. The stalling robustness of the tubercle airfoil allows for
1 Saadat, HajHariri, and Fish, “Explanation of the Effects of LeadingEdge Tubercles on the Aerodynamics of Airfoils and Finite Wings,” The American Physical Society Division of Fluid Dynamics 21 Nov. 2010, <http://meetings.aps.org/Meeting/DFD10/Event/132841>. 2 Murray, Gruber, and Fredriksson, “Effect of Leading Edge Tubercles on Marine Tidal Turbine Blades,” The American Physical Society Division of Fluid Dynamics 22 Nov. 2010, <http://meetings.aps.org/Meeting/DFD10/Event/133206>. 3 Custodio, Henoch, and Johari, “Separation Control on a Hydrofoil Using Leading Edge Protuberances,” The American Physical Society Division of Fluid Dynamics 19 Nov. 2006, <http://meetings.aps.org/Meeting/DFD06/Event/53973>.

higher angles of attack of the airfoil without stalls or as much drag and therefore more lift is
created due to increased fluid pressure under the airfoil (more crosssectional area of the airfoil is
directly exposed to the fluid). This technology could be applied to airplane wings that could save
on fuel due to less drag caused by the wings and to blades of wind/hydroelectric turbines that
would generate more torque at lower fluid speeds leading to more power and electricity
generated.
However, most research involving this technology has been put into fan blades and
airplane wings, but not in vertical axis wind turbines (VAWT) like the Darrieus design shown in
Figure 5. Theoretically, if the modified tubercle airfoil increases the efficiency of lift for wings
on airplanes and on fan blades, the same idea could be applied to vertical axis wind turbines. The
tubercle technology would be especially advantageous for Darrieus VAWTs over more popular
horizontal axis wind turbines (HAWT) because it can accentuate the advantages VAWTs have
over HAWTs; VAWTs can operate at especially low wind speeds and therefore at lower
elevations and this technology would theoretically increase the power generated at those speeds
significantly. Also, since not as much power is needed to rotate the tubercle VAWT, less starting
electricity would be needed/wasted to start rotation of the VAWT (VAWTs are not self starting
from standstill unlike HAWTs). Plus, since the wind speed is the same along the entire length of
the airfoil on VAWTs unlike HAWTs, the tubercles size/shapes can be more easily optimized for
the average wind speed experienced at a particular location leading to a relatively simpler shape
to manufacture compared to HAWTs where the crosssectional airfoil shape has to be constantly
optimized at different radial speeds experienced along the blade in addition to the tubercles.
To validate the claims of increased efficiencies of the tubercle leadingedge airfoils over
traditional straightedge designs and to test if the technology would equally apply Darrieus
VAWTs, I decided to numerically model and compute the power generated by tubercle and
straight leadingedge Darrieus VAWTs.
Modeling:
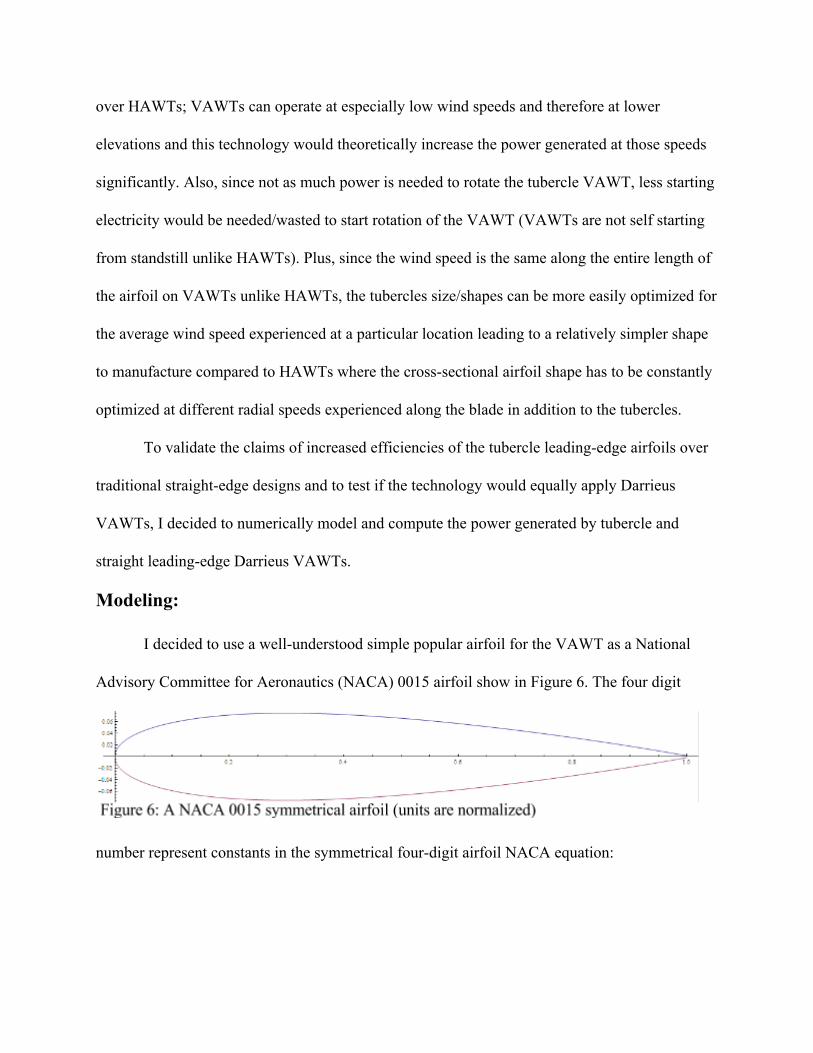
I decided to use a wellunderstood simple popular airfoil for the VAWT as a National
Advisory Committee for Aeronautics (NACA) 0015 airfoil show in Figure 6. The four digit
number represent constants in the symmetrical fourdigit airfoil NACA equation:
where c is the chord length, x and yt are the normalized horizontal and vertical coordinates of the
edge of the airfoil respectively, and t is the maximum thickness normalized to the fraction size of
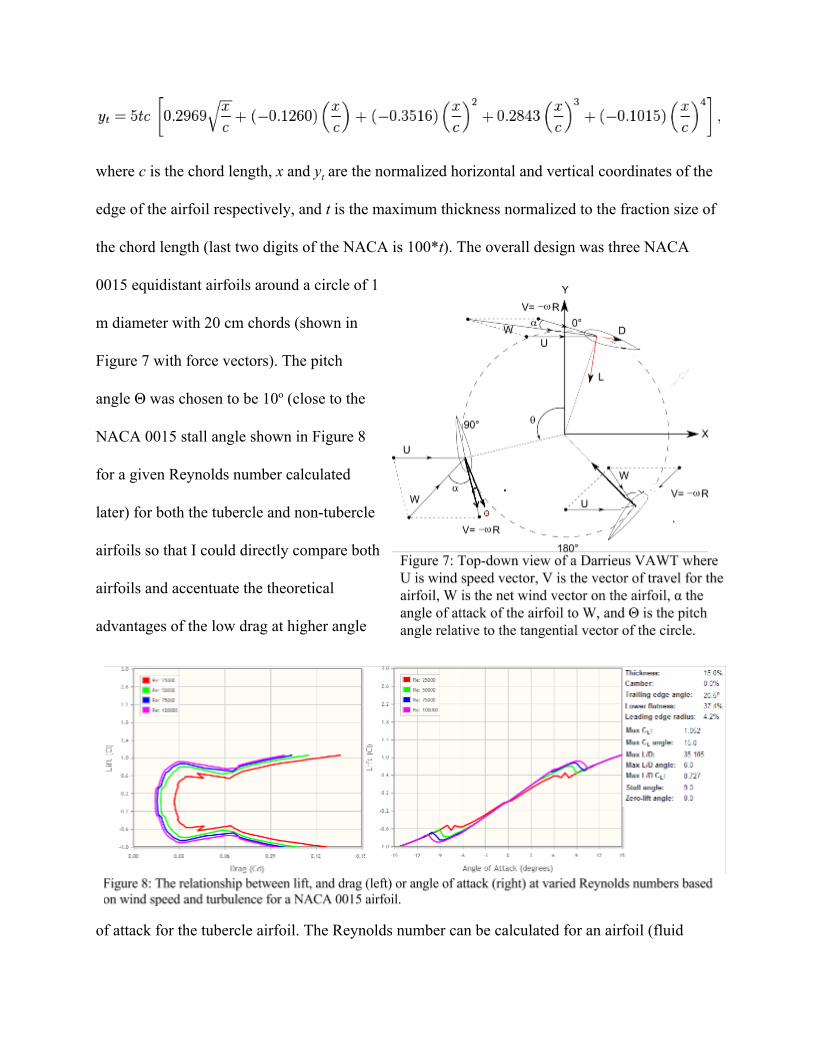
the chord length (last two digits of the NACA is 100*t). The overall design was three NACA
0015 equidistant airfoils around a circle of 1
m diameter with 20 cm chords (shown in
Figure 7 with force vectors). The pitch
angle Θ was chosen to be 10o (close to the
NACA 0015 stall angle shown in Figure 8
for a given Reynolds number calculated
later) for both the tubercle and nontubercle
airfoils so that I could directly compare both
airfoils and accentuate the theoretical
advantages of the low drag at higher angle
of attack for the tubercle airfoil. The Reynolds number can be calculated for an airfoil (fluid

dynamics) as: Re=V*c/v where Re is the Reynolds number, V is the flight/wind speed, c is the
chord length, and v is the kinematic viscosity of the fluid (air in this case). For a chosen 10 m/s
wind speed, the Reynolds number ranges
from around 120,000 to 140,000 for
elevations between 1700 m and sea level
respectively which means the magenta line
in Figure 8 most closely matches the
simulation.
To model the tubercles on the
leadingedge of the airfoil, the following
sinusoidal equation was used in Figure
9. To get a 3D model of a tubercle
airfoil, the base NACA 0015 shape was
vertically extruded with the sine wave as
a leading edge guideline. Then, a second
NACA 0015 shape was extruded
normally (straight up vertically) and
both 3D objects were intersected and
joined to get a straight tailingedge and a
sinusoidal leadingedge shown in Figure
10. Then, three copies of the airfoil were arranged as previously shown in Figure 7 with the
center of rotation inside a 8x3x0.3 m rectangular prism located 2 m from one end and centered
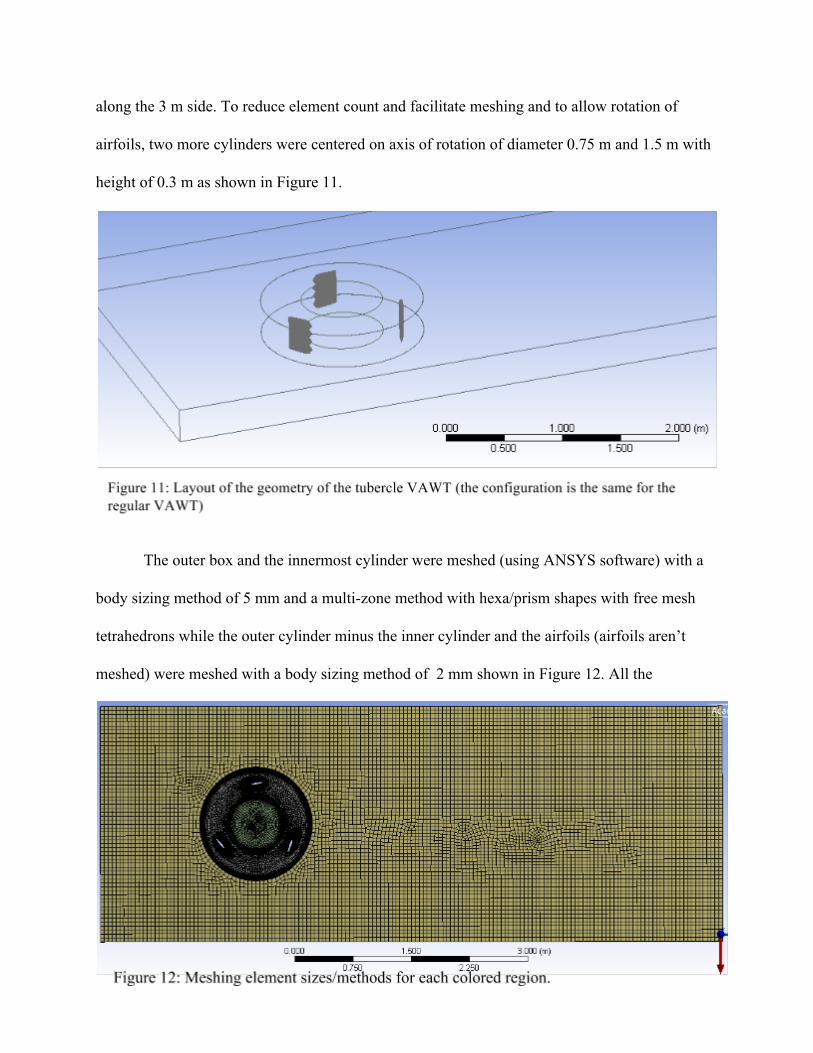
along the 3 m side. To reduce element count and facilitate meshing and to allow rotation of
airfoils, two more cylinders were centered on axis of rotation of diameter 0.75 m and 1.5 m with
height of 0.3 m as shown in Figure 11.
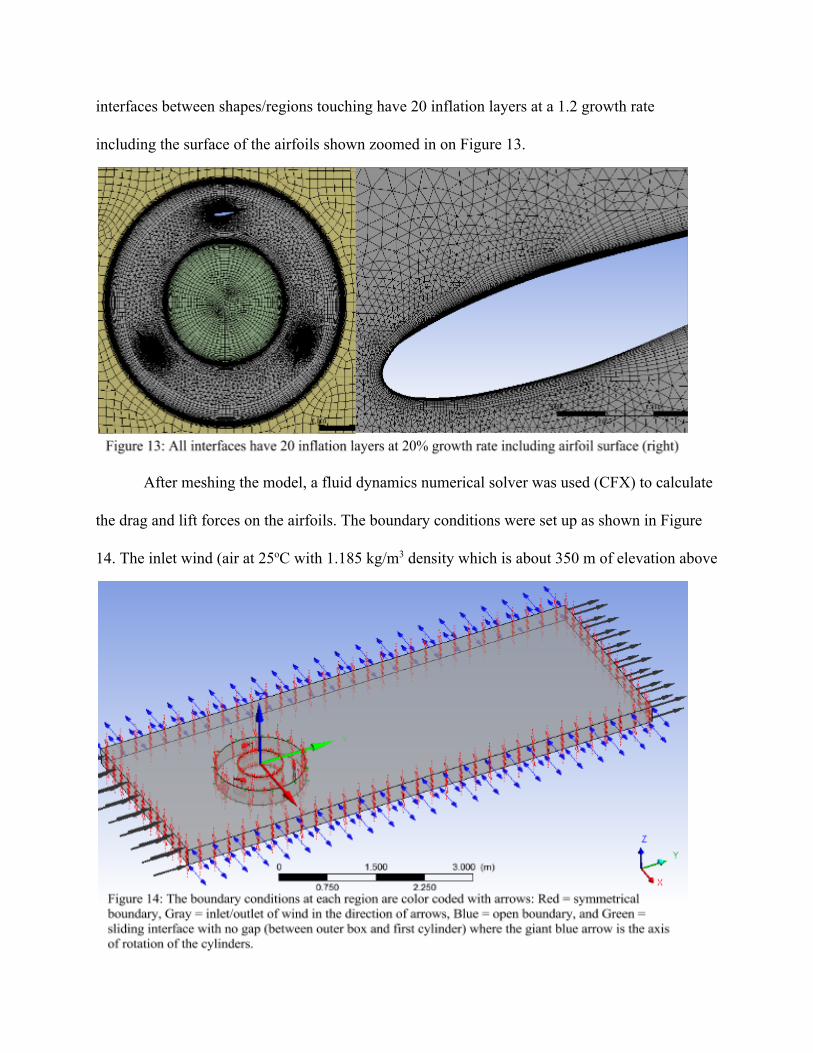
The outer box and the innermost cylinder were meshed (using ANSYS software) with a
body sizing method of 5 mm and a multizone method with hexa/prism shapes with free mesh
tetrahedrons while the outer cylinder minus the inner cylinder and the airfoils (airfoils aren’t
meshed) were meshed with a body sizing method of 2 mm shown in Figure 12. All the
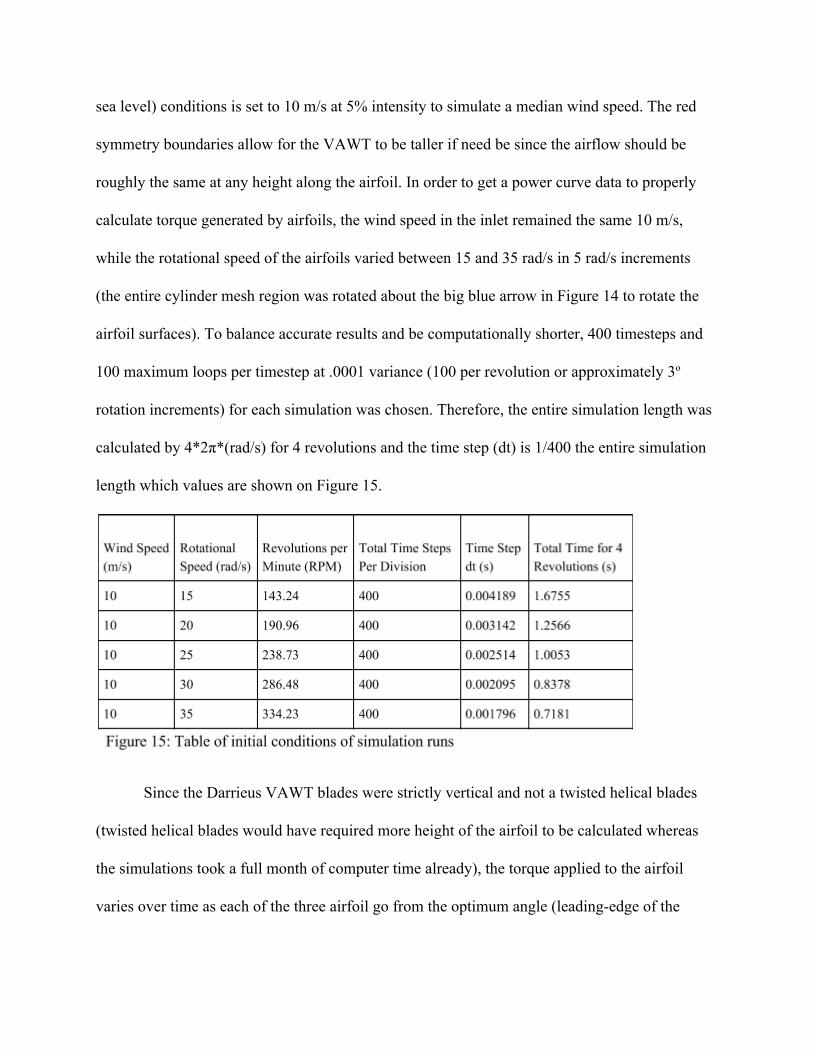
interfaces between shapes/regions touching have 20 inflation layers at a 1.2 growth rate
including the surface of the airfoils shown zoomed in on Figure 13.
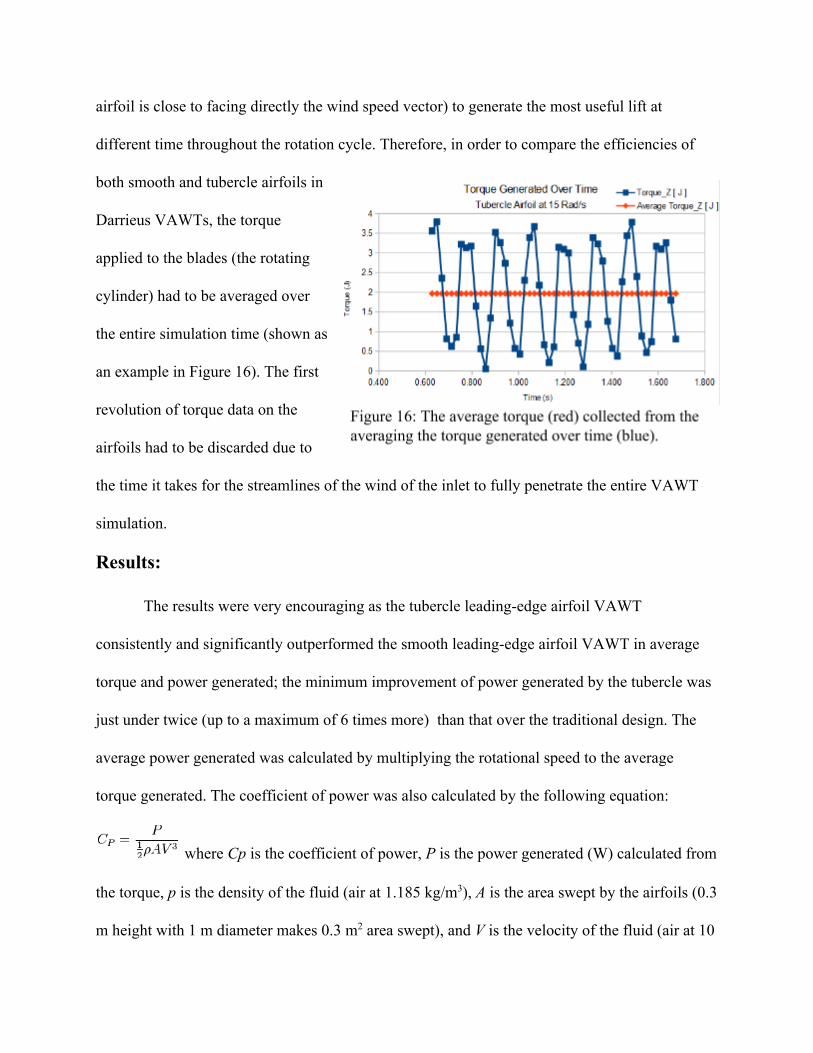
After meshing the model, a fluid dynamics numerical solver was used (CFX) to calculate
the drag and lift forces on the airfoils. The boundary conditions were set up as shown in Figure
14. The inlet wind (air at 25oC with 1.185 kg/m3 density which is about 350 m of elevation above
sea level) conditions is set to 10 m/s at 5% intensity to simulate a median wind speed. The red
symmetry boundaries allow for the VAWT to be taller if need be since the airflow should be
roughly the same at any height along the airfoil. In order to get a power curve data to properly
calculate torque generated by airfoils, the wind speed in the inlet remained the same 10 m/s,
while the rotational speed of the airfoils varied between 15 and 35 rad/s in 5 rad/s increments
(the entire cylinder mesh region was rotated about the big blue arrow in Figure 14 to rotate the
airfoil surfaces). To balance accurate results and be computationally shorter, 400 timesteps and
100 maximum loops per timestep at .0001 variance (100 per revolution or approximately 3o
rotation increments) for each simulation was chosen. Therefore, the entire simulation length was
calculated by 4*2π*(rad/s) for 4 revolutions and the time step (dt) is 1/400 the entire simulation
length which values are shown on Figure 15.
Since the Darrieus VAWT blades were strictly vertical and not a twisted helical blades
(twisted helical blades would have required more height of the airfoil to be calculated whereas
the simulations took a full month of computer time already), the torque applied to the airfoil
varies over time as each of the three airfoil go from the optimum angle (leadingedge of the
airfoil is close to facing directly the wind speed vector) to generate the most useful lift at
different time throughout the rotation cycle. Therefore, in order to compare the efficiencies of
both smooth and tubercle airfoils in
Darrieus VAWTs, the torque
applied to the blades (the rotating
cylinder) had to be averaged over
the entire simulation time (shown as
an example in Figure 16). The first
revolution of torque data on the
airfoils had to be discarded due to
the time it takes for the streamlines of the wind of the inlet to fully penetrate the entire VAWT
simulation.
Results:
The results were very encouraging as the tubercle leadingedge airfoil VAWT
consistently and significantly outperformed the smooth leadingedge airfoil VAWT in average
torque and power generated; the minimum improvement of power generated by the tubercle was
just under twice (up to a maximum of 6 times more) than that over the traditional design. The
average power generated was calculated by multiplying the rotational speed to the average
torque generated. The coefficient of power was also calculated by the following equation:
where Cp is the coefficient of power, P is the power generated (W) calculated from
the torque, p is the density of the fluid (air at 1.185 kg/m3), A is the area swept by the airfoils (0.3
m height with 1 m diameter makes 0.3 m2 area swept), and V is the velocity of the fluid (air at 10
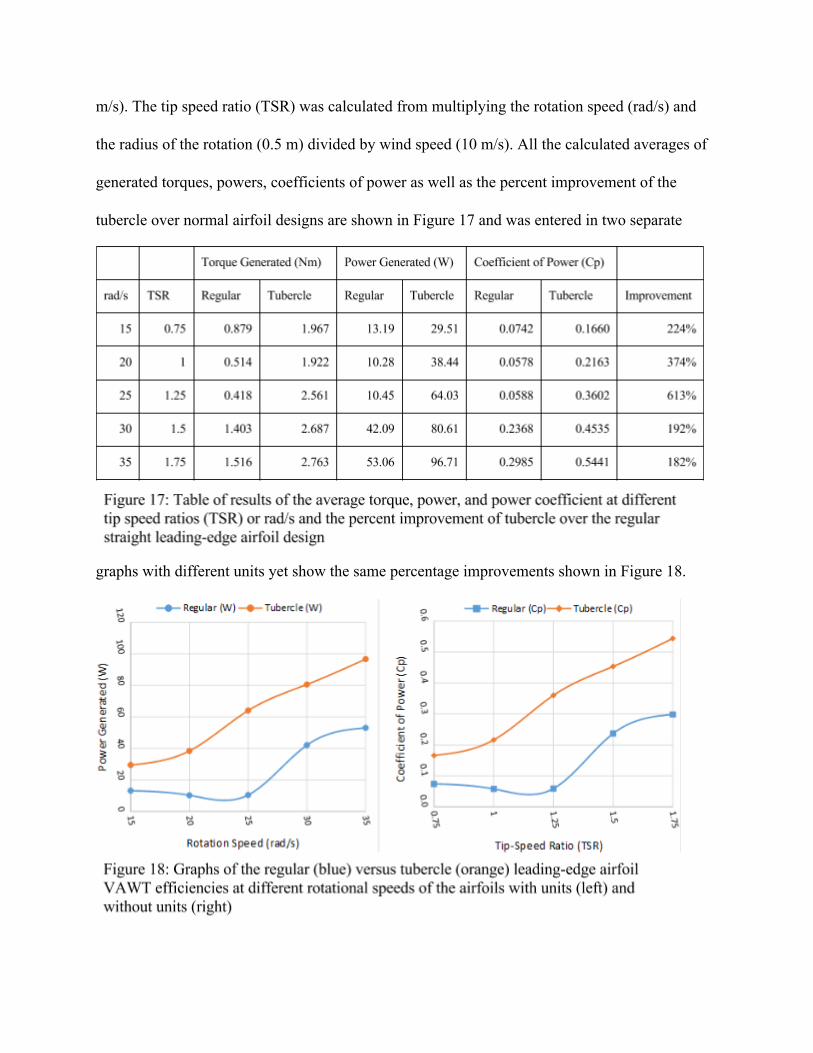
m/s). The tip speed ratio (TSR) was calculated from multiplying the rotation speed (rad/s) and
the radius of the rotation (0.5 m) divided by wind speed (10 m/s). All the calculated averages of
generated torques, powers, coefficients of power as well as the percent improvement of the
tubercle over normal airfoil designs are shown in Figure 17 and was entered in two separate
graphs with different units yet show the same percentage improvements shown in Figure 18.

The Tubercle airfoil generates some incredible efficiencies approaching a coefficient of power
greater than 0.6 or maybe 0.7 for higher TSRs whereas the normal airfoil has a localized stall at
25 rad/s (TSR of 1.25) and the coefficient of power may be plateauing between 0.3 and 0.4 for
TSRs higher than 1.75.
Conclusion:
Given more computational power and resources, a more complete coefficient of power
versus TSR graph could be made to show optimum TSR for coefficient of power. In addition, a
more complex helical airfoils could be introduced to mitigate varying torques generate over each
cycle of rotation which could also reduce mechanical stresses and failures due to reduced
vibrations. Plus, a scaleddown experiment could be made in a wind tunnel to see how well the
numerical simulation matches experimentation. Also, a separate study could be completed on
just the on the equation for the leadingedge tubercle airfoil (NACA shape airfoil and pitch could
be also be optimized for tubercle technology) to see if varying the amplitude and frequency
could be optimized for certain wind speeds since there hasn’t been much research on that
particular subject matter.
The added efficiencies of adding a simple sinusoidal leadingedge airfoil were found to
be between 26 times for efficient compared to the traditional straightedged airfoils in a
Darrieus VAWT. The relative stalling robustness of the tubercle airfoil over the traditional
straightedged airfoil allowed for greater percentage of the rotation cycle to have useable lift and
increase overall efficiency. The sheer efficiency improvement should be more than enough to
justify any additional manufacturing costs of the propellers especially with the relatively smaller
blades Darrieus VAWTs typically have compare to modern giant HAWTs.