a typology framework for virtual project teams … · a typology framework for virtual project...
TRANSCRIPT

A Typology Framework for Virtual Project Teams
Padhraic Ludden & Dr Ann Ledwith

• Introduction
• Research methodology
• Research background
• Survey development
• Results
Agenda

• Do you frequently work on virtual teams - A virtual team is
defined as a team where all the team members are not located at
the same physical location.
Yes No
Polling Question 1

• .Introduction
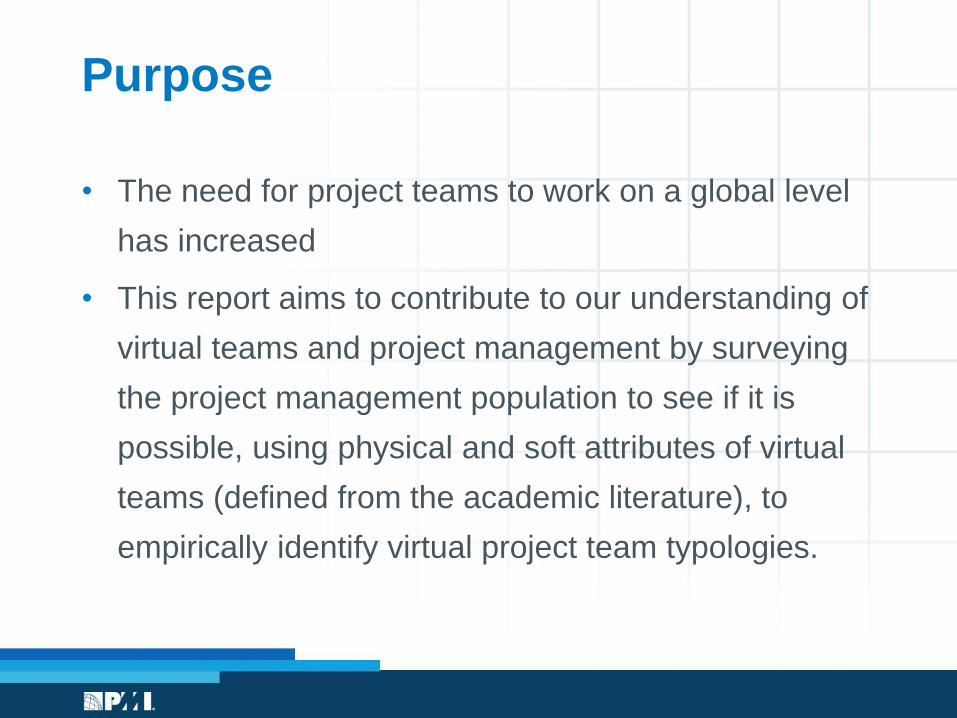
• The need for project teams to work on a global level
has increased
• This report aims to contribute to our understanding of
virtual teams and project management by surveying
the project management population to see if it is
possible, using physical and soft attributes of virtual
teams (defined from the academic literature), to
empirically identify virtual project team typologies.
Purpose

• Identifying virtual project team typologies and their
relationships with one another, which will assist in the
management of virtual project teams.
• Providing information on the impact of a virtual
project team typology on overall project success,
which will aid in the development of virtual project
teams that can support project success.
Aim

• Research Question 1: Using a set of virtual project team attributes
based on published research, can virtual team typologies be identified
by empirical investigation of data gathered from a large-scale sample of
the project work environment?
• Research Question 2: Is there empirical evidence that relationships
exist between team demographics and team typologies identified from
Research Question 1?
• Research Question 3: Do the identified team typologies from Research
Question 1 have specific impacts on the performance of virtual project
teams?
Research questions
• .Research Methodology
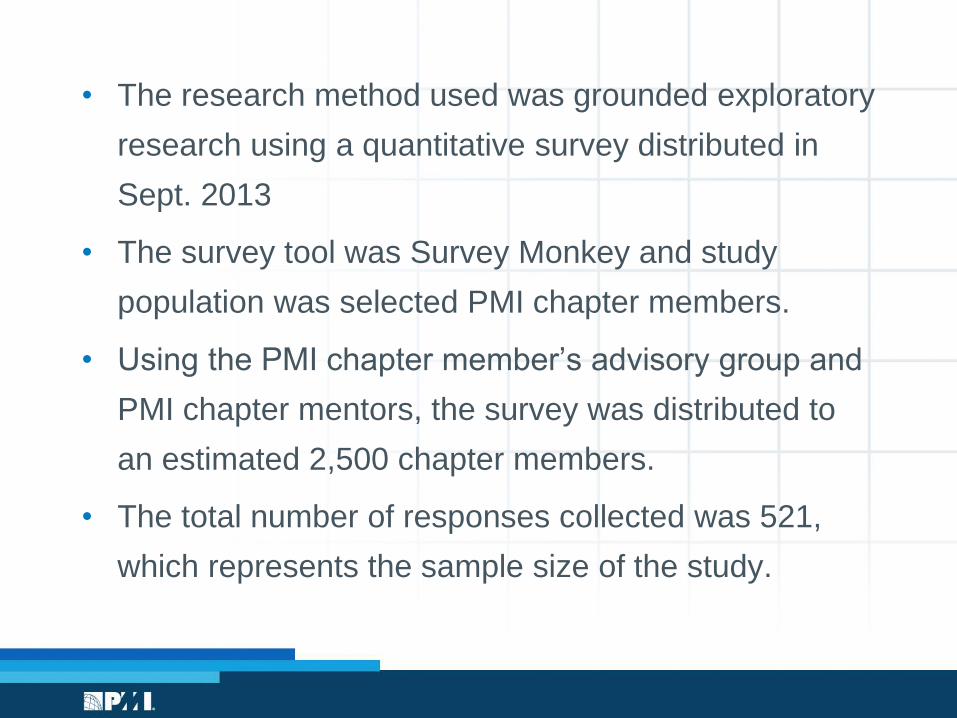
• The research method used was grounded exploratory
research using a quantitative survey distributed in
Sept. 2013
• The survey tool was Survey Monkey and study
population was selected PMI chapter members.
• Using the PMI chapter member’s advisory group and
PMI chapter mentors, the survey was distributed to
an estimated 2,500 chapter members.
• The total number of responses collected was 521,
which represents the sample size of the study.
• .Research Background
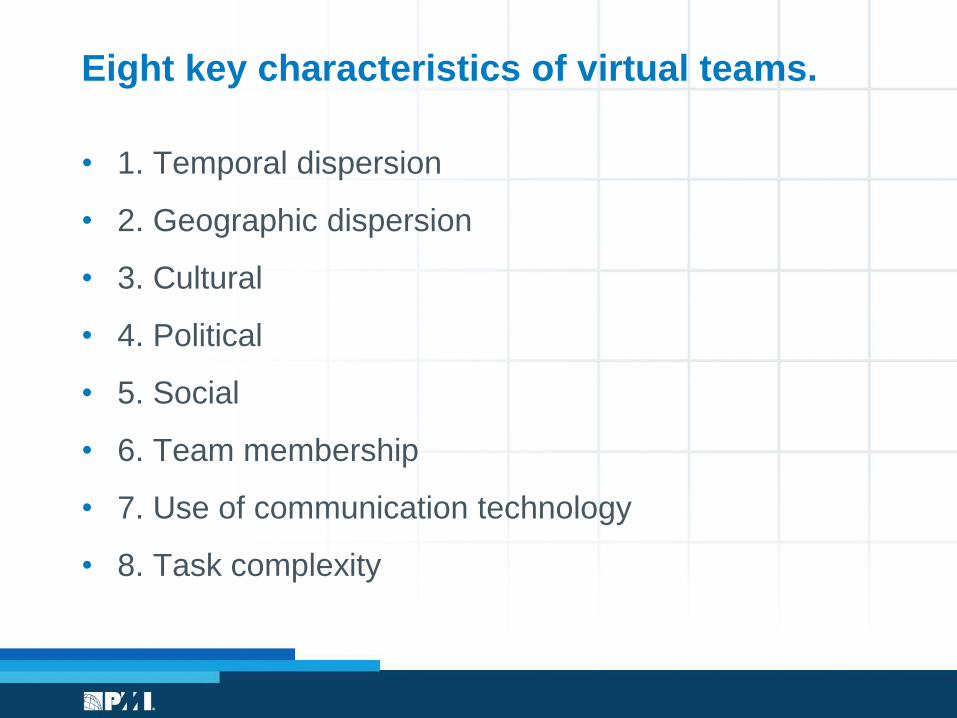
• 1. Temporal dispersion
• 2. Geographic dispersion
• 3. Cultural
• 4. Political
• 5. Social
• 6. Team membership
• 7. Use of communication technology
• 8. Task complexity
Eight key characteristics of virtual teams.

Key Characteristic Hard Attribute Soft Attribute
1. Temporal dispersion Team members in
different time zones
Time difference
between time zones
Extra hours worked
Difficulty of task execution
Impact on functional or workshop
relationship between team members
Lack of understanding of different
physiological and social habits or
norms
Time delays cause confusion
2 Geographic dispersion Number of locations
Key location
Geographical distribution of locations
Team structures at locations
Key Characteristic Hard Attribute Soft Attribute
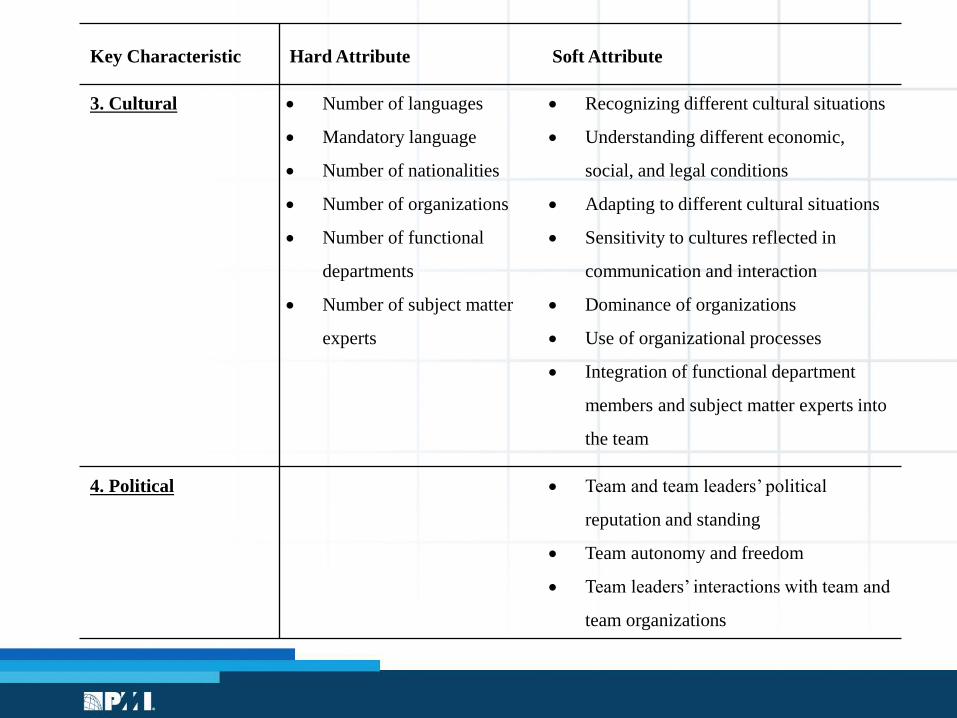
3. Cultural Number of languages
Mandatory language
Number of nationalities
Number of organizations
Number of functional
departments
Number of subject matter
experts
Recognizing different cultural situations
Understanding different economic,
social, and legal conditions
Adapting to different cultural situations
Sensitivity to cultures reflected in
communication and interaction
Dominance of organizations
Use of organizational processes
Integration of functional department
members and subject matter experts into
the team
4. Political Team and team leaders’ political
reputation and standing
Team autonomy and freedom
Team leaders’ interactions with team and
team organizations
Key Characteristic Hard Attribute Soft Attribute
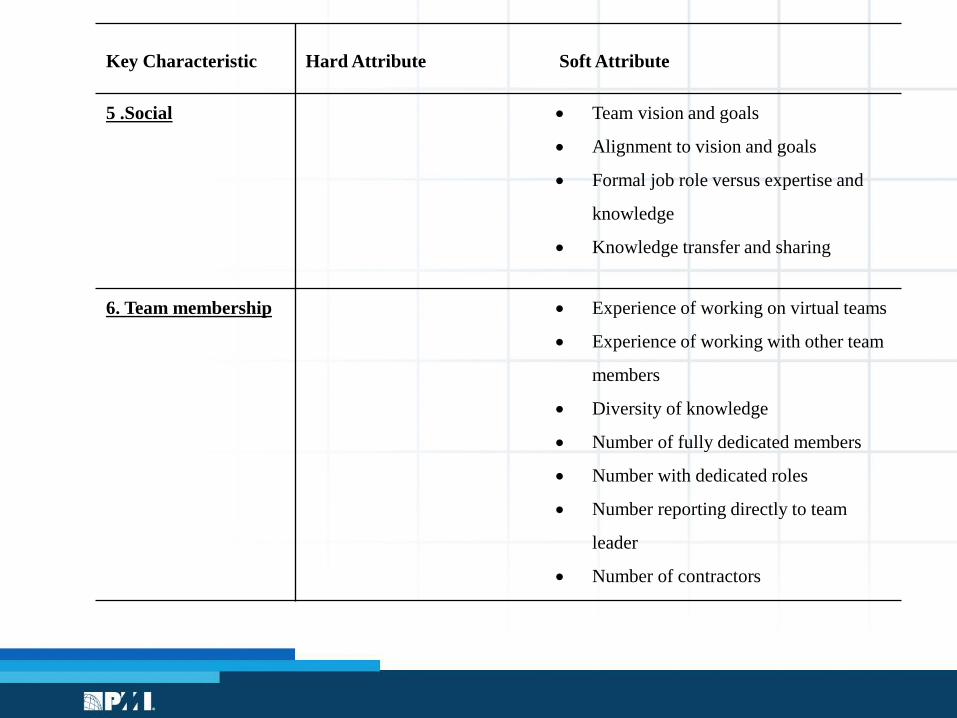
5 .Social Team vision and goals
Alignment to vision and goals
Formal job role versus expertise and
knowledge
Knowledge transfer and sharing
6. Team membership Experience of working on virtual teams
Experience of working with other team
members
Diversity of knowledge
Number of fully dedicated members
Number with dedicated roles
Number reporting directly to team
leader
Number of contractors

Key Characteristic Hard Attribute Soft Attribute
7. Use of
Communication
technology
Experience of using communication
technology
Usage of communication technologies
8. Task complexity Team skills
New group required
Dependency on individuals
Uncertainty
Time pressure

• .Survey development

• Numerous measures, but focused on practioner input
• In addition to the main survey, a further small-scale study of 50
practitioners with experience working on virtual teams was used
in order to establish a working measure of virtuality.
• This research found that from the hard attributes gathered from
the literature review , two are deemed to have the most impact
on the level of virtuality of a team:
1) the number of hours’ difference in time zones between the two
locations of the virtual team; and
2) the number of team locations existing for the virtual team.
• Based on the survey a ‘physical’ or ‘hard’ typology is developed
Virtuality measure

Component factor analysis was conducted on the virtual team
characteristic data variables of
• Team membership
• Political
• Social
• Culture
Component factor analysis
Principal component analysis (PCA) is a mathematical procedure that
transforms a number of (possibly) correlated variables into a (smaller)
number of uncorrelated variables called principal components.

Cluster analysis was then preformed using the principle components
defined from the factor analysis
Based on the Cluster analysis a ‘soft’ typology is developed
Cluster analysis
Cluster analysis or clustering is the task of grouping a set of objects in
such a way that objects in the same group (called a cluster) are more
similar (in some sense or another) to each other than to those in other
groups (clusters).

• .Results - Demographic

CountryNumber of
Responses
Ireland 106 (20%)
United States 77 (15%)
India 35 (7%)
England 31 (6%)
France 17 (3%)
Belgium 15 (3%)
Others: Canada, Sweden, Portugal Germany, Poland, Croatia, Italy,
Philippines, Brazil, Australia, Ghana, Mexico, South Africa,
Colombia, Netherlands, Switzerland, Greece, Indonesia, New
Zealand, Sri Lanka, Thailand, Austria, Costa Rica, Malaysia, Nigeria,
Pakistan, Argentina, Bulgaria, Chile, China, and Czech Republic.
239 (46%)
Nationality of respondents

Industry sector and organisation size
Industry SectorNumber of
Responses
Information Technology 125 (24%)
Telecommunications 53 (10%)
Financial Services 34 (7%)
Manufacturing 33 (7%)
Consulting 32 (6%)
Engineering 32 (6%)
Others: Resources, Government, Insurance, Pharmaceuticals,
Healthcare, Utility, Construction, Aerospace, Business Services, and
Food and Beverage
202 (39%)
Organization Size Distribution (People) Number of Responses
<= 1000 147 (31%)
>1000 <= 20,000 140 (29%)
>20,000 <= 50,000 45 (9%)
>50,000 <= 100,000 47 (10%)
>100,000 84 (18%)
Unknown 16 (3%)

Cost and duration of projects
Cost of Project
(US$)
Number of
Responses
Duration of Project Number of
Responses
>10 million 82 (17%) <= 3 months 42 (9%)
>5 million <= 10
million
33 (7%)>3months <=6months
88 (18%)
>1 million <= 5
million
94 (20%)>6months <= 1 year
125 (26%)
>300,000 <=
1million
90 (19%)>1 year <= 2 years
130 (27%)
<= 300,000 119 (25%) >2 years 94 (20%)
unknown 61 (13%)

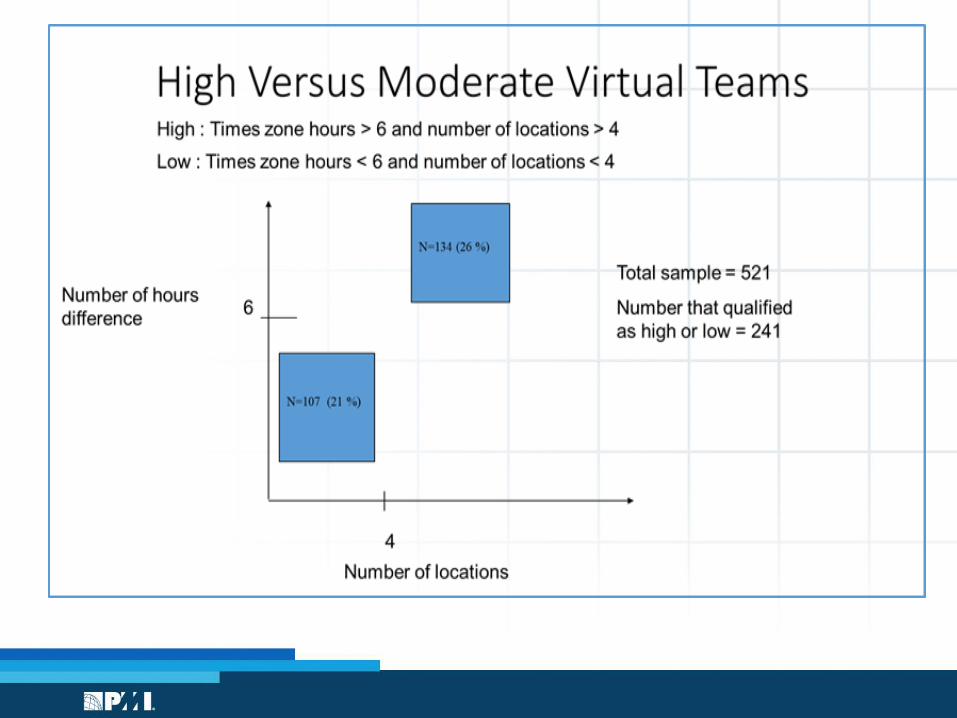
• .Results - Hard Typology
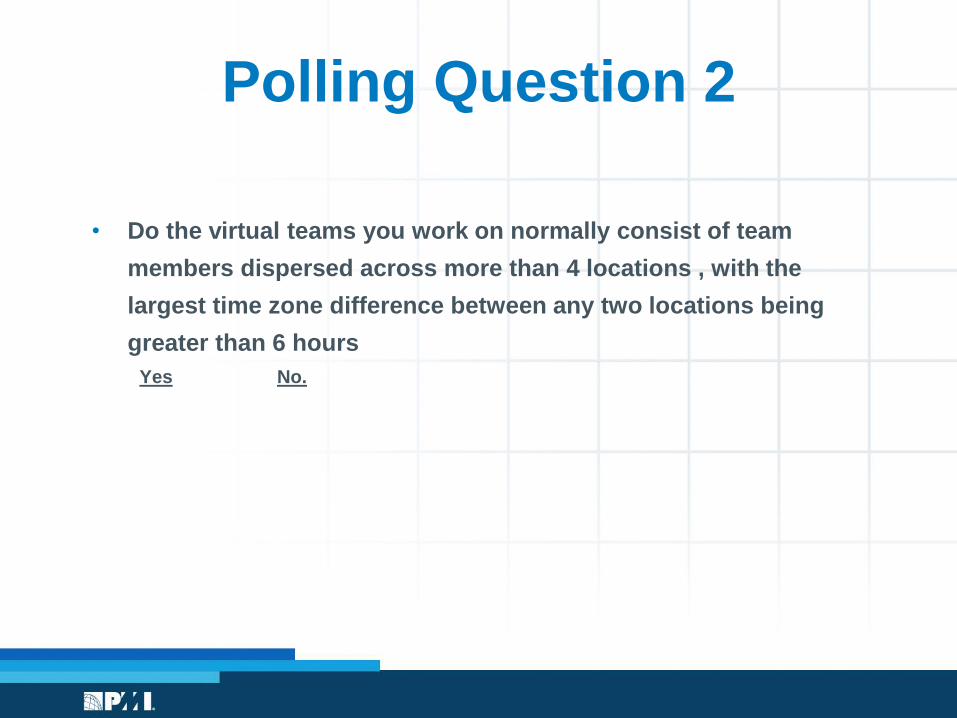
• Do the virtual teams you work on normally consist of team
members dispersed across more than 4 locations , with the
largest time zone difference between any two locations being
greater than 6 hours
Yes No.
Polling Question 2

Moderately virtual: The difference in time zones between two
locations is fewer than six hours, and the number of team locations
is less than four.
Highly virtual: The difference in time zones between two locations
is greater than six hours, and the number of team locations is
greater than four.
Moderately virtual and highly virtual

• .Results - Soft Typology

• Dedicated team members
• Virtual team experience
• Team leader status
• Team status
• Vision and goals
• Expertise and knowledge
• Common processes
• Cultural awareness
• Cultural adaptiveness
Component factor analysis resulted in nine factors
Key
Characteristic
No.
of Qs Factors Meaning
Team
Membership
5 • Dedicated
team
members
The level of dedication of team members: Dedication-
measuring factors are: dedicated to the project, dedicated
roles, and reporting directly to the project manager.
• Virtual team
experienceThe team members were experienced with working on
virtual teams and also had previous experiences working
with other team members.
Political 5 • Team
leader
status
The team leader or leaders were well-known, had achieved
recognition, and had a high degree of interaction within the
team and within the organization or organizations to which
the team belonged.
• Team
statusThe team had a strong reputation for having the political
power to get things done and was allowed the freedom to
run the project as it wished.

Key
Characteristic
No.
of
Q’s Factors Meaning
Social 7 • Vision and goals The team had a clearly defined vision, goals, and
objectives and team members were aligned to them.
• Expertise and
knowledgeTeam members’ expertise was considered more
important than job title or position, and team members
were encouraged to share their knowledge with the
rest of the team.
Organizational
Culture4 • Common
processesThe team had one set of organizational policies,
methodologies, and processes.

Key Characteristic
No. of
Q’s Factors Meaning
National Culture 7 • Cultural
awarenessThe team members were good at recognizing the
different cultural situations that arose within the
team and understood the different economic,
social, and legal conditions of the various
countries in which the other team members lived.
• Cultural
adaptivenessTeam members worked hard to adapt to the
different cultural situations that occurred within
the team and were sensitive to other team
members’ cultural behavior. This was reflected in
the way team members communicated and
interacted within the team.
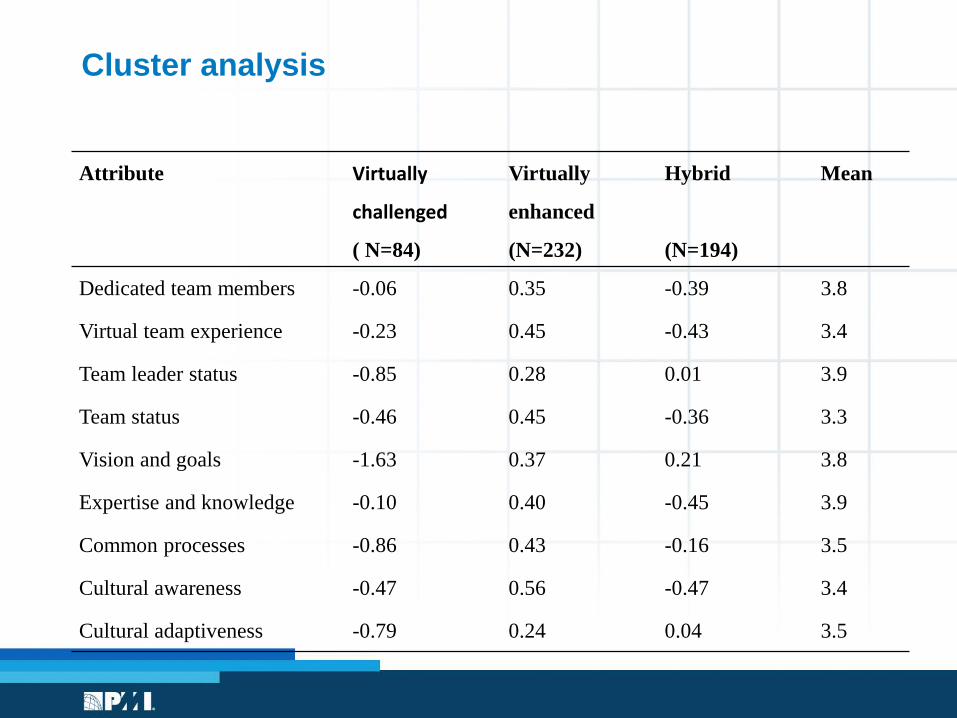
Cluster analysis
Attribute Virtually
challenged
( N=84)
Virtually
enhanced
(N=232)
Hybrid
(N=194)
Mean
Dedicated team members -0.06 0.35 -0.39 3.8
Virtual team experience -0.23 0.45 -0.43 3.4
Team leader status -0.85 0.28 0.01 3.9
Team status -0.46 0.45 -0.36 3.3
Vision and goals -1.63 0.37 0.21 3.8
Expertise and knowledge -0.10 0.40 -0.45 3.9
Common processes -0.86 0.43 -0.16 3.5
Cultural awareness -0.47 0.56 -0.47 3.4
Cultural adaptiveness -0.79 0.24 0.04 3.5

• .Results - Typology comparisons
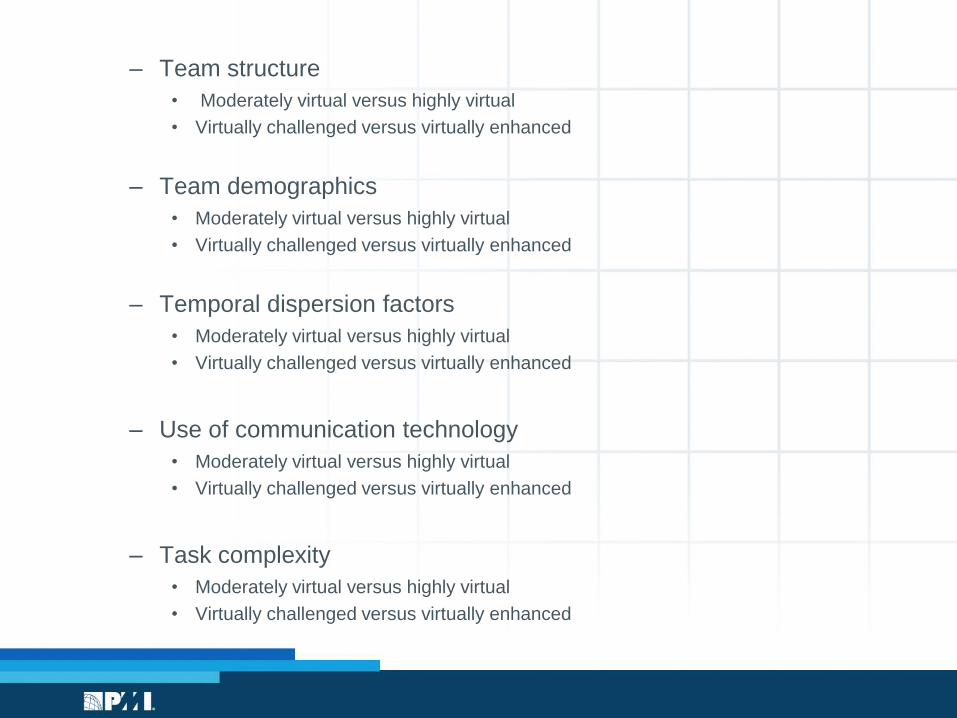
– Team structure
• Moderately virtual versus highly virtual
• Virtually challenged versus virtually enhanced
– Team demographics
• Moderately virtual versus highly virtual
• Virtually challenged versus virtually enhanced
– Temporal dispersion factors
• Moderately virtual versus highly virtual
• Virtually challenged versus virtually enhanced
– Use of communication technology
• Moderately virtual versus highly virtual
• Virtually challenged versus virtually enhanced
– Task complexity
• Moderately virtual versus highly virtual
• Virtually challenged versus virtually enhanced
Comparison Analysis
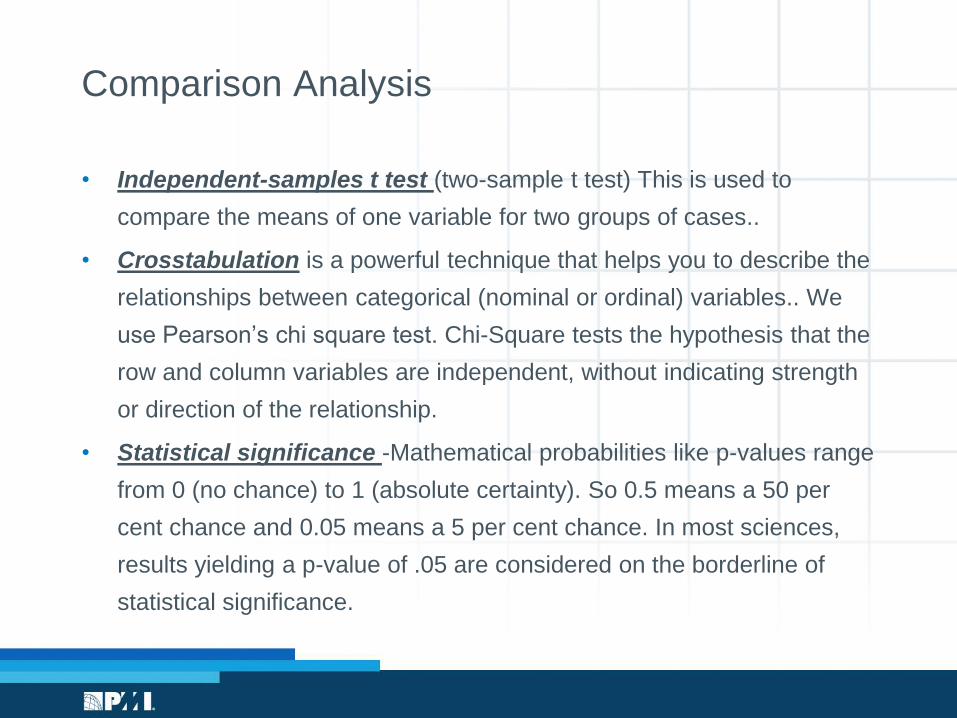
• Independent-samples t test (two-sample t test) This is used to
compare the means of one variable for two groups of cases..
• Crosstabulation is a powerful technique that helps you to describe the
relationships between categorical (nominal or ordinal) variables.. We
use Pearson’s chi square test. Chi-Square tests the hypothesis that the
row and column variables are independent, without indicating strength
or direction of the relationship.
• Statistical significance -Mathematical probabilities like p-values range
from 0 (no chance) to 1 (absolute certainty). So 0.5 means a 50 per
cent chance and 0.05 means a 5 per cent chance. In most sciences,
results yielding a p-value of .05 are considered on the borderline of
statistical significance.

Team structure - physical
Team Structure Moderately Virtual Highly Virtual Test for Equality
Significance (two-tailed)
Mean Mean
Team structure
Number of people on team 29.45 56.84 0.034**
Number of team languages 1.50 1.60 0.448
Impact on work hours (extra
hours worked)
3.78 4.51 0.002**
Number of nationalities 3.93 7.80 0.008**
Number of organizations 3.03 5.47 0.012**
Number of functional
departments
3.66 5.30 0.000**
Number of subject matter
experts
4.25 8.72 0.000**

Team structure – physical
Team Structure Virtually Challenged Virtually Enhanced T-Test for Equality
Significance (two-tailed)
Mean Mean
Team Structure
Number of people on team 49.80 28.04 0.024**
Number of locations 7.11 7.09 0.994
Number of team languages 1.62 2.26 0.401
Largest time zone 7.41 8.04 0.342
Impact on work hours (extra
hours worked)
5.90 5.62 0.795
Number of nationalities 6.80 5.26 0.225
Number of organizations 1.41 1.42 0.848
Number of functional
departments
5.16 4.36 0.132
Number of subject matter
experts
5.57 6.21 0.288

Team demographicsDemographic Pearson Chi-Squared Test
for Difference
Moderately/Highly
Team Structure
All members are the same nationality 0.000**
All members in the same time zone N/A
All members in the same organization 1.000
Knowledge diversity of the team members 0.151
The makeup of the team members at locations 0.000**
Team Operation Processes
A face-to-face meeting that involved all of the team members took place 0.020**
A main location exists for the team 0.001**
There was an official or mandatory team language used 0.004**
The leadership structure on the team 0.055
Project Type
The duration of the project 0.104
The cost of the project 0.023**
Project Organization
The number of people employed by the organization executing the project 0.000**
Classification of organization 0.000**
Industry focus 0.079

Team demographicsDemographic Pearson Chi-Squared Test
for Difference
Challenged/Enhanced
Team Structure
All members are the same nationality 0.471
All members in the same time zone 0.385
All members in the same organization 0.917
Knowledge diversity of the team members 0.003**
The makeup of the team members at locations 0.133
Team Operation Processes
A face-to-face meeting that involved all of the team members took place 0.008**
A main location exists for the team 0.109
There was an official or mandatory team language used 0.936
The leadership structure on the team 0.096
Project Type
The duration of the project 0.256
The cost of the project 0.010**
Project Organization
The number of people employed by the organization executing the project 0.718
Classification of organization 0.698
Industry focus 0.761
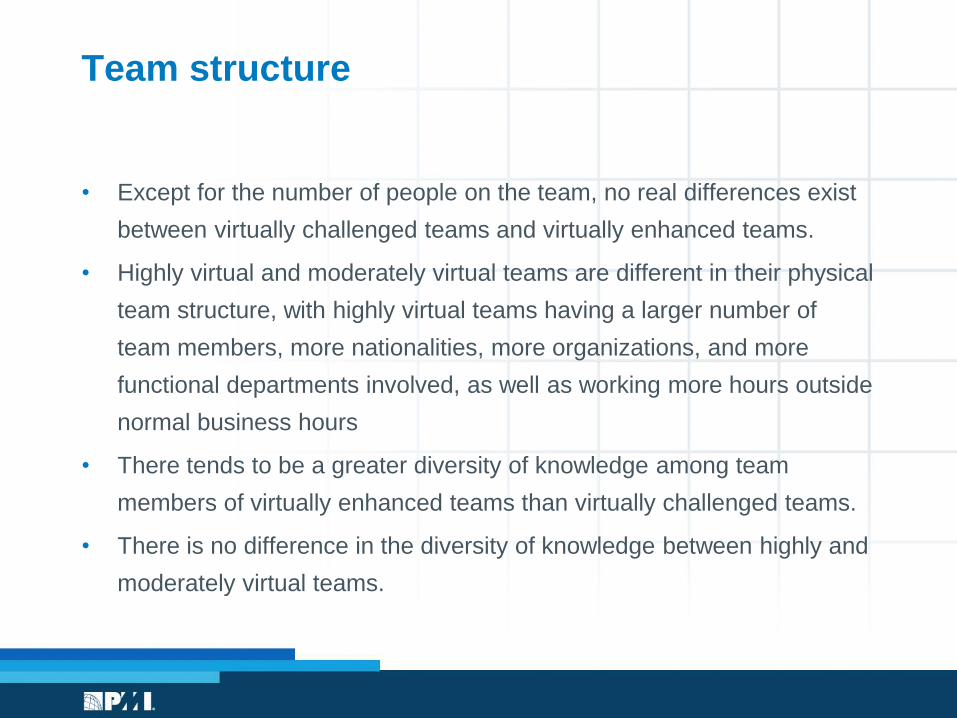
• Except for the number of people on the team, no real differences exist
between virtually challenged teams and virtually enhanced teams.
• Highly virtual and moderately virtual teams are different in their physical
team structure, with highly virtual teams having a larger number of
team members, more nationalities, more organizations, and more
functional departments involved, as well as working more hours outside
normal business hours
• There tends to be a greater diversity of knowledge among team
members of virtually enhanced teams than virtually challenged teams.
• There is no difference in the diversity of knowledge between highly and
moderately virtual teams.
Team structure

• Virtually enhanced teams are more likely to host a face-to-face meeting
for the whole team than virtually challenged teams. Also, enhanced
teams hold a greater number of face-to-face meetings than challenged
teams.
• Moderately virtual teams are more likely to hold face-to-face meetings
for the entire team than highly virtual teams.
• There is no difference between virtually challenged and virtually
enhanced teams in the use of mandatory language.
• Highly virtual teams tend to use a mandatory language more so than
moderately virtual teams.
Team operation processes

• Moderately virtual team project costs tended to be less than US$5
million, while highly virtual projects costs are more evenly spread
across the ranges, over 40% cost more than US$5 million, compared to
approximately 20% of moderately virtual projects.
• There was no difference between virtually enhanced and virtually
challenged teams with regard to organization size and industry
classification
• More highly virtual teams existed in large organizations, whereas more
moderately virtual teams existed in smaller organizations
Project type and project organisation

Temporal dispersion
Temporal Dispersion Factors for Moderate/High
Moderately
Virtual
Mean
Highly-Virtual
Mean
Pearson Chi-Squared
Test for Difference
Executing tasks in parallel is difficult 2.59 3.26 0.004**
Delays in communication 2.96 3.41 0.101
Negatively impacted the working relationship2.39 2.69 0.256
Lack of understanding of the different physiological and
social norms 2.80 2.65 0.129
Lack of understanding of the different physiological and
social norms caused conflict 2.69 2.37 0.358
Confusion over clock times caused missed scheduled
meetings 1.86 2.10 0.109
Confusion over clock times caused missed task deadlines
1.78 2 0.315
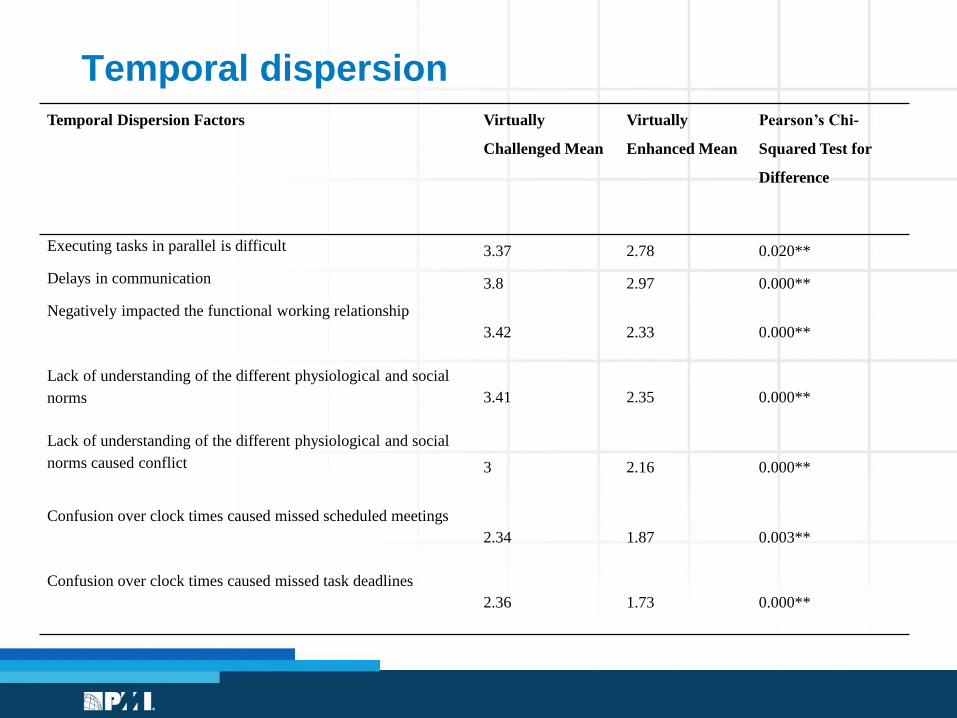
Temporal dispersion
Temporal Dispersion Factors Virtually
Challenged Mean
Virtually
Enhanced Mean
Pearson’s Chi-
Squared Test for
Difference
Executing tasks in parallel is difficult 3.37 2.78 0.020**
Delays in communication 3.8 2.97 0.000**
Negatively impacted the functional working relationship
3.42 2.33 0.000**
Lack of understanding of the different physiological and social
norms 3.41 2.35 0.000**
Lack of understanding of the different physiological and social
norms caused conflict 3 2.16 0.000**
Confusion over clock times caused missed scheduled meetings
2.34 1.87 0.003**
Confusion over clock times caused missed task deadlines
2.36 1.73 0.000**

• The impact of temporal dispersion is significantly different between
virtually enhanced and virtually challenged teams.
• Time zone dispersion has a greater negative impact on challenged
teams than on enhanced teams.
• For highly and moderately virtual teams, there is no difference between
the two groups for the impact of temporal dispersion.
Temporal dispersion

Use of communication technologyUsage of communication technology Moderately-
Virtual
Highly-Virtual Pearson chi squared test
for difference
Mean Mean
Experience of using communication technology
4.20 4.40 0.058
Standalone video conferencing 2.00 1.94 0.054
Web conferencing 3.13 3.95 0.003**
Instant messaging 3.89 4.60 0.044**
Remote access & control tool 3.01 2.80 0.464
Email 5.49 5.63 0.314
Fixed telephone 4.49 4.47 0.54
Mobile phone 4.11 4.02 0.127
Letter /Fax 1.58 1.35 0.211
Social networks 1.42 1.36 0.881
Data sharing repositories 3.45 4.35 0.002**
Team and organisation web portals3.18 3.46 0.601

Use of communication technology
Usage of Communication Technology Virtually Challenged Virtually Enhanced Pearson’s Chi-
Squared Test
Mean Mean
Experience of using communication technology
3.92 4.40.000**
Stand-alone video conferencing 1.92 2.05 0.776
Web conferencing 3.24 3.76 0.217
Instant messaging3.64 4.32
0.152
Remote access and control tool 2.38 2.88 0.250
Email 5.51 5.57 0.656
Fixed telephone 4.5 4.45 0.682
Mobile phone 4.08 4.27 0.351
Letter/Fax 1.51 1.53 0.825
Social networks 1.15 1.54 0.106
Data-sharing repositories 3.7 3.92 0.484
Team and organization web portals 2.59 3.62 0.001**
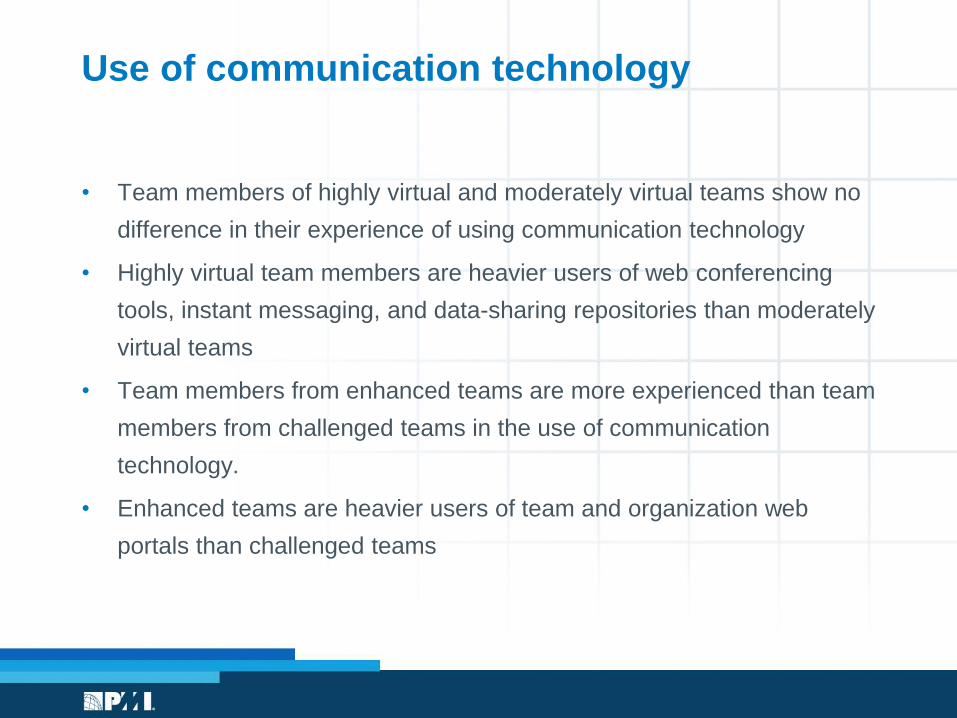
• Team members of highly virtual and moderately virtual teams show no
difference in their experience of using communication technology
• Highly virtual team members are heavier users of web conferencing
tools, instant messaging, and data-sharing repositories than moderately
virtual teams
• Team members from enhanced teams are more experienced than team
members from challenged teams in the use of communication
technology.
• Enhanced teams are heavier users of team and organization web
portals than challenged teams
Use of communication technology

Task complexityTask complexity statements
Moderately-virtual Highly-VirtualPearson chi- squared test
for difference
True True
The task was unlikely to be accomplished
successfully using only the skills within the team52% 57.95 0.370
The task was addressed by a new group formed
specifically for the purpose 41% 36.8% 0.519
The task required collective input and agreement
from more than 20 people 59% 40.6% 0.005**
The success of the task was dependent on
understanding preferences or needs of individuals
outside the group34% 28.6% 0.375
The outcome of the task was influenced by events
that were highly uncertain and difficult to predict47% 40.6% 0.329
The task was completed under extreme time
pressure 46% 37.6% 0.197

Task complexityTask Complexity Virtually
Challenged
Virtually Enhanced Pearson’s Chi-
Squared Test
Statement True True
The task was unlikely to be accomplished successfully
using only the skills within the team
52.7% 58.7% 0.445
The task was addressed by a new group formed specifically
for the purpose
39.2% 36% 0.723
The task required collective input and agreement from more
than 20 people
50% 49.3% 1.000
The success of the task was dependent on understanding
preferences or needs of individuals outside the group
33.8% 27.6% 0.381
The outcome of the task was influenced by events that were
highly uncertain and difficult to predict
40.5% 42.2% 0.906
The task was completed under extreme time pressure 37.8% 40.9% 0.743

• .Impact of Virtual Team Typologies
on Project Success

Which of the following options do you think has the greatest impact
on the success of the project being performed by a virtual project
team ( please select one option)
• Option 1 : The level of physical dispersion of the team members
across locations and time zones
• Option 2: The cultural , political , social and team membership
makeup of the virtual team
Polling Question 3
Virtually
Challenged
Virtually
Enhanced
Pearson Chi-
Squared Test
for Difference
Moderat
ely
Virtual
Highly
Virtual
Pearson Chi-
Squared Test
for Difference
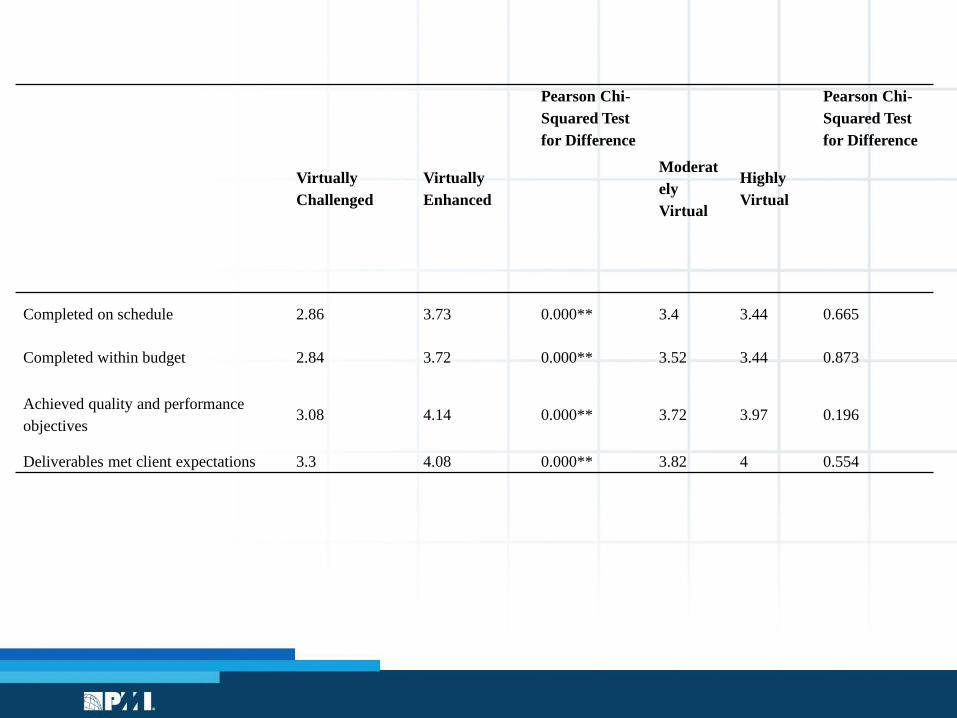
Completed on schedule 2.86 3.73 0.000** 3.4 3.44 0.665
Completed within budget 2.84 3.72 0.000** 3.52 3.44 0.873
Achieved quality and performance
objectives3.08 4.14 0.000** 3.72 3.97 0.196
Deliverables met client expectations 3.3 4.08 0.000** 3.82 4 0.554

There is a significant difference in the performance of virtually
enhanced teams compared to virtually challenged teams
There is no significant difference between the performance of highly
virtual teams and moderately virtual teams.
Virtually enhanced teams have the best project success rate and
virtually challenged teams have the worst project success rate. The
project success rates of both moderately virtual and highly virtual teams
lies between challenged and enhanced teams, but there is no
difference between the project success rates of highly and moderately
virtual teams.
• .The best Typology – virtually
enhanced

Attribute Virtually Enhanced
Dedicated team members The team members are dedicated to the project, have a dedicated role, or report directly to the
project leader.
Virtual team experience The team members have previous experience working on virtual teams and have previously worked
together.
Team leader status The team leader or leaders were very well known, have achieved recognition, and have a very high
degree of interaction within the team and within the organization or organizations to which the team
belonged.
Team status The team has a strong reputation for having the political power to get things done and is likely to
be allowed the freedom to run the project as it wishes.
Vision and goals The team has a strong and clearly defined vision, goals, and objectives, and team members are
strongly aligned to them.
Expertise and knowledge Team members’ expertise and knowledge is considered much more important than job title or
position, and team members are strongly encouraged to, and actively share their knowledge with the
rest of the team.
Common processes The team has one set of organizational policies, methodologies, and processes.
Cultural awareness The team members are good at recognizing the different cultural situations that arise within the
team and understand the different economic, social, and legal conditions of the various countries in
which the other team members lived.
Cultural adaptiveness Team members work hard to adapt to the different cultural situations that occur within the team, and
are sensitive to other team members’ cultural behaviors. This is reflected in the way team members
communicate and interact within the team.

Dr. Ann Ledwith & Padhraic Ludden
This research was carried out with the support from PMI under their
research grant program.
Thanks to Carla Messikomer, Kristin Dunn, Juan C Nogueira, Kim
Shinners and Kimberly Whitby for all there support and assistance in
developing the research report and webinar.
Thank You

PMI | Collaborative Project Procurement Arrangements
How to Obtain PDU Credit
• By attending this one hour webinar you will earn one (1) PDU. Participants
accounting for their Category A programs may search by program activity
number, “MAR 2016 Webinar,” or by title, “A Typology Framework for Virtual
Teams.” The PMI Code of Ethics would be the guide for individuals reporting
their PDUs.
– See PMI’s website for more information for reporting PDUs:
https://ccrs.pmi.org/search/
• If you have linked your PMI credentials to your ProjectManagement.com, we
will batch report your PDU for you. If you have not linked your accounts, you
will need to manually report the PDU on PMI’s website.

• First, it provides a clear, practitioner-based definition of virtuality. Virtual
teams that have more than four team locations and a time difference of
more than six hours between locations are classified as highly virtual,
while those with fewer than four team locations and a time difference of
less than six hours are moderately virtual.
• While earlier researchers have used various definitions of team
virtuality (Bell & Kozlowski, 2002; Fiol & O’Connor, 2005; Griffith &
Neal, 2001), none have produced a simple, easy-to-operationalize
measure. An additional advantage of this approach is that it is
consistent with more recent research (Schweitzer & Duxbury, 2010).
Research Contribution 1

• The second contribution is the identification (based on a set of team
characteristics) of virtually challenged and virtually enhanced teams..
These characteristics have a sound theoretical basis, having been
developed from a detailed review of existing literature on virtual teams.
But more importantly, they have been validated against a large sample
of international firms from a range of sectors and disciplines.
• What is particularly interesting about this list of characteristics is that,
with the exception of an increased emphasis on culture and possibly on
aligned processes, they could be describing success characteristics of
any team. In other words, the traits and characteristics of a successful
team apply whether the team is virtual or not.
Results – Contribution 2

• Physical virtuality does not have a significant impact on team
performance. This is at odds with earlier research (Griffith & Neale,
2001; Chudoba et al., 2003), but may be a reflection of today’s working
practices, in which the use of communication technology is now the
norm for all teams, whether co-located or virtual; thus, the impact of
virtuality is reduced.
• While physical virtuality does not have an impact on success, the
characteristics of the virtually enhanced teams are significantly linked
with project success across all four measures.
• This provides a very clear template for how virtual teams need to be set
up if they are to deliver successful projects. It is also interesting that the
“softer” characteristics (e.g., status, vision, and experience), have a
much greater impact on project success than the “harder” physical
characteristics of geographic and temporal dispersion.
Results – Contribution 3
Moderately virtual with highly virtual
Virtually challenged with virtually enhanced
– Team structure – Physical
– Team demographics
– Temporal dispersion factors
– Use of communication technology
– Task complexity