acg european capital tour: investing pitfalls / lessons learned and big success stories
TRANSCRIPT
ACG EUROPEAN CAPITAL TOUR KEY NOTE PRESENTATION
TOPICS
1
I. Alvarez & Marsal Perspectives on the Current State of European Market [Sovereign / PE / Distress]
II. Middle Market Opportunities III. Pitfalls [Do’s and Don’ts]
ALVAREZ & MARSAL ROUTES TO MARKET & VERTICALS
2
Ø Restructuring
Ø Private Equity
Ø Corporate
Ø Financial Institutions
Ø Real Estate
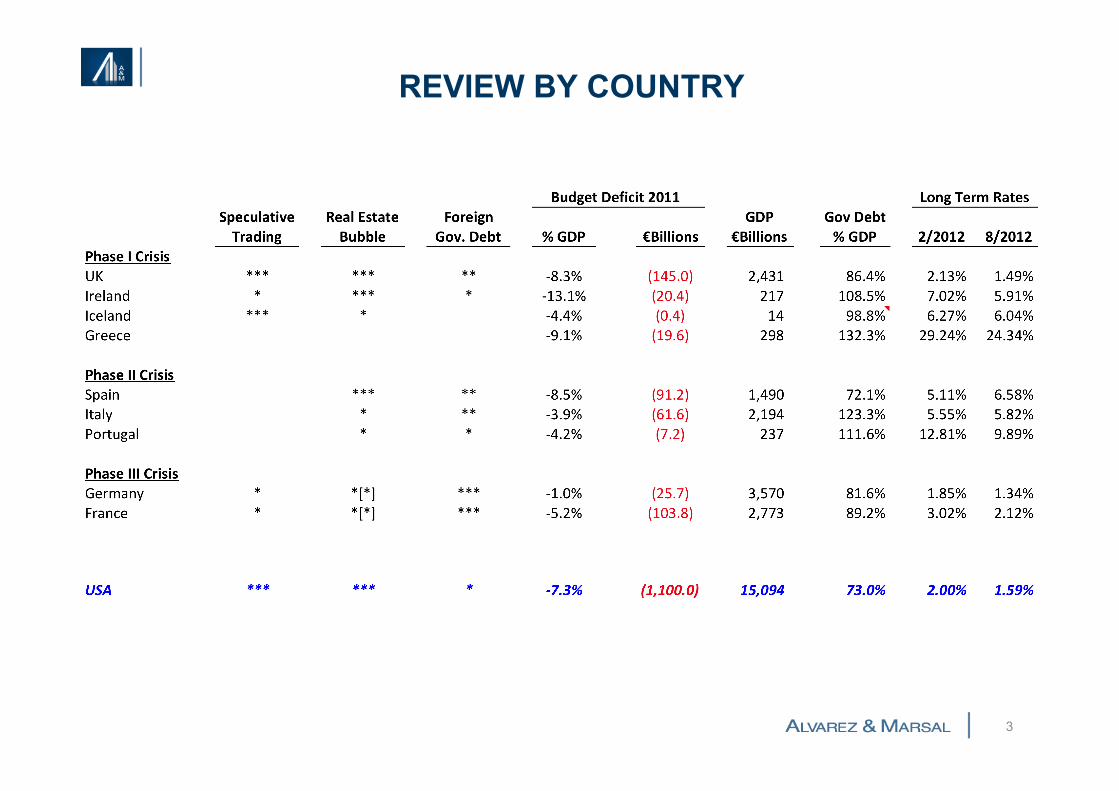
REVIEW BY COUNTRY
3
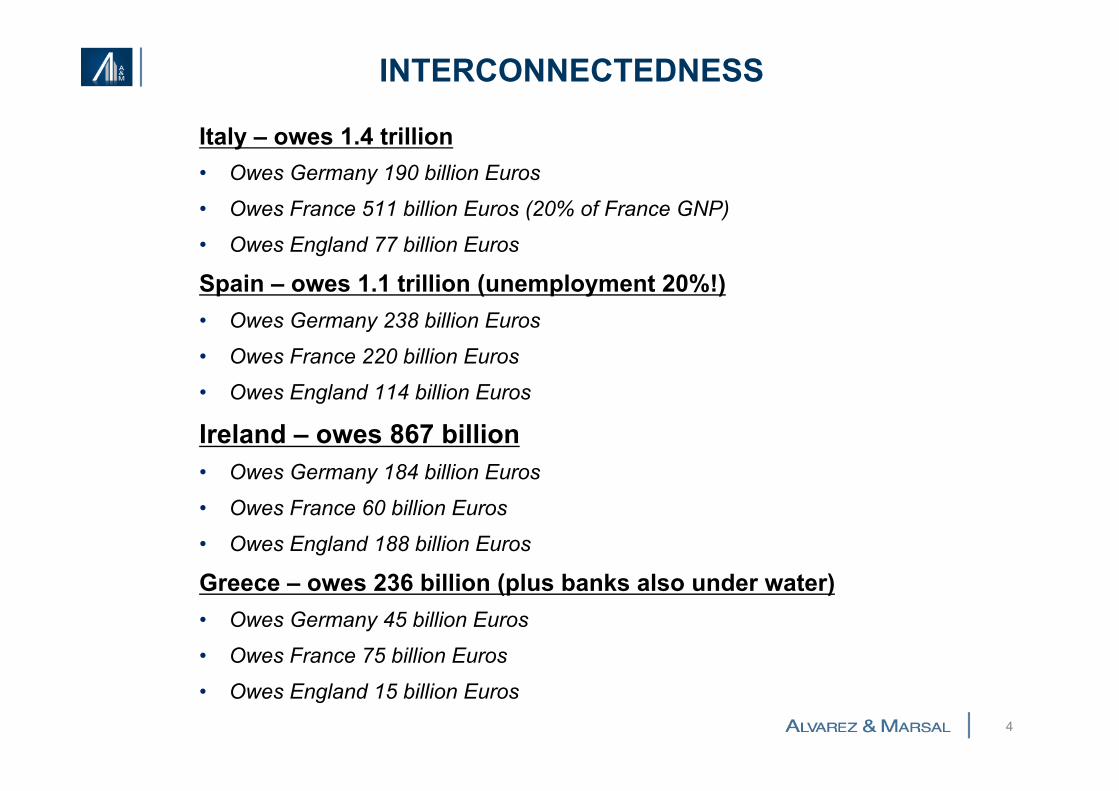
INTERCONNECTEDNESS
4
Italy – owes 1.4 trillion • Owes Germany 190 billion Euros
• Owes France 511 billion Euros (20% of France GNP)
• Owes England 77 billion Euros
Spain – owes 1.1 trillion (unemployment 20%!) • Owes Germany 238 billion Euros
• Owes France 220 billion Euros
• Owes England 114 billion Euros
Ireland – owes 867 billion • Owes Germany 184 billion Euros
• Owes France 60 billion Euros
• Owes England 188 billion Euros
Greece – owes 236 billion (plus banks also under water) • Owes Germany 45 billion Euros
• Owes France 75 billion Euros
• Owes England 15 billion Euros
TOPICS
5
I. Alvarez & Marsal Perspectives on the Current State of European Market [Sovereign / PE / Distress]
II. Middle Market Opportunities III. Pitfalls [Do’s and Don’ts]
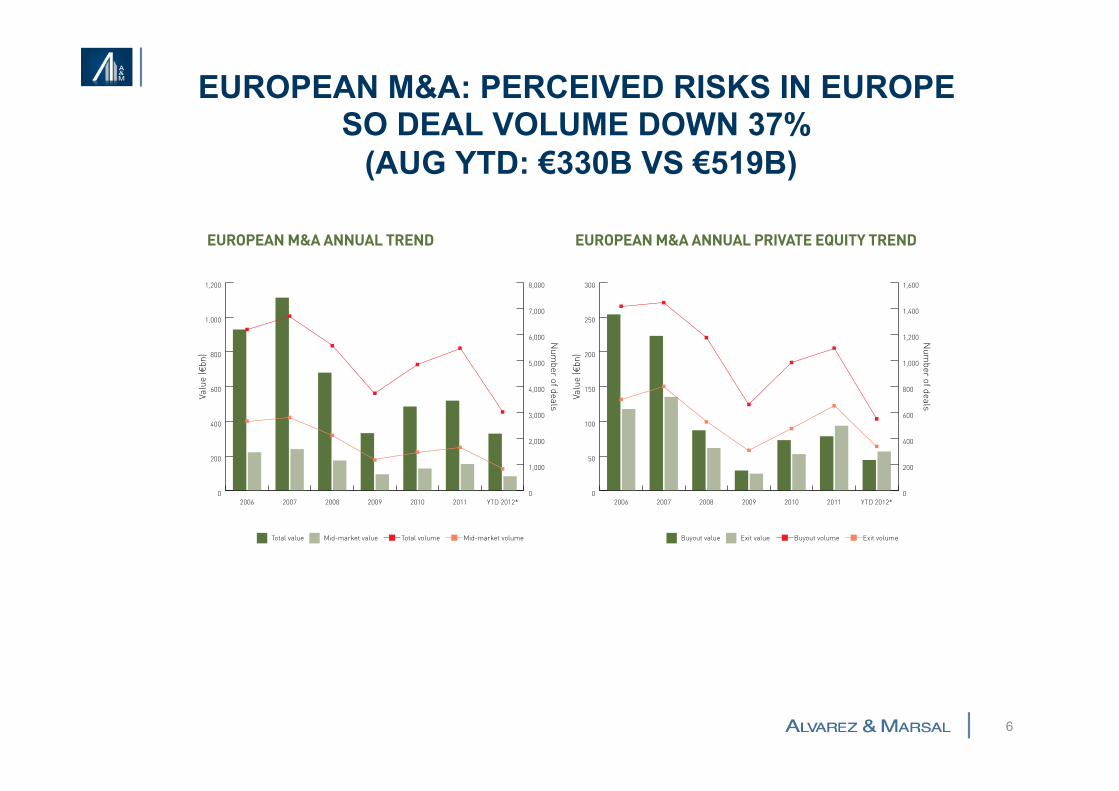
EUROPEAN M&A: PERCEIVED RISKS IN EUROPE SO DEAL VOLUME DOWN 37%
(AUG YTD: €330B VS €519B)
6
EUROPE
Monthly M&A Insider 22
TREND GRAPHS
EUROPEAN M&A QUARTERLY TREND
0
100
200
300
400
500
Q312*
Q212
Q112
Q411
Q311
Q211
Q111
Q410
Q310
Q210
Q110
Q409
Q309
Q209
Q109
Q408
Q308
Q208
Q108
Q407
Q307
Q207
Q107
Q406
Q306
Q206
Q106
Valu
e (!
bn)
Total value Mid-market value
Num
ber of deals
0
200
400
600
800
1,000
1,200
1,400
1,600
1,800
2,000
Total volume Mid-market volume
0
10
20
30
40
50
60
70
80
90
100
110
120
130
140
Q312*
Q212
Q112
Q411
Q311
Q211
Q111
Q410
Q310
Q210
Q110
Q409
Q309
Q209
Q109
Q408
Q308
Q208
Q108
Q407
Q307
Q207
Q107
Q406
Q306
Q206
Q106
Buyout value Exit value Buyout volume Exit volume
Valu
e (!
bn)
Num
ber of deals
0
50
100
150
200
250
300
350
400
450
EUROPEAN M&A ANNUAL TREND EUROPEAN M&A ANNUAL PRIVATE EQUITY TREND
0
200
400
600
800
1,000
1,200
YTD 2012*201120102009200820072006
Total value Mid-market value
Num
ber of deals
Valu
e (!
bn)
0
1,000
2,000
3,000
4,000
5,000
6,000
7,000
8,000
Total volume Mid-market volume
0
50
100
150
200
250
300
YTD 2012*201120102009200820072006
Valu
e (!
bn)
Buyout value Exit value
Num
ber of deals
Buyout volume Exit volume
0
200
400
600
800
1,000
1,200
1,400
1,600
EUROPEAN M&A QUARTERLY PRIVATE EQUITY TREND
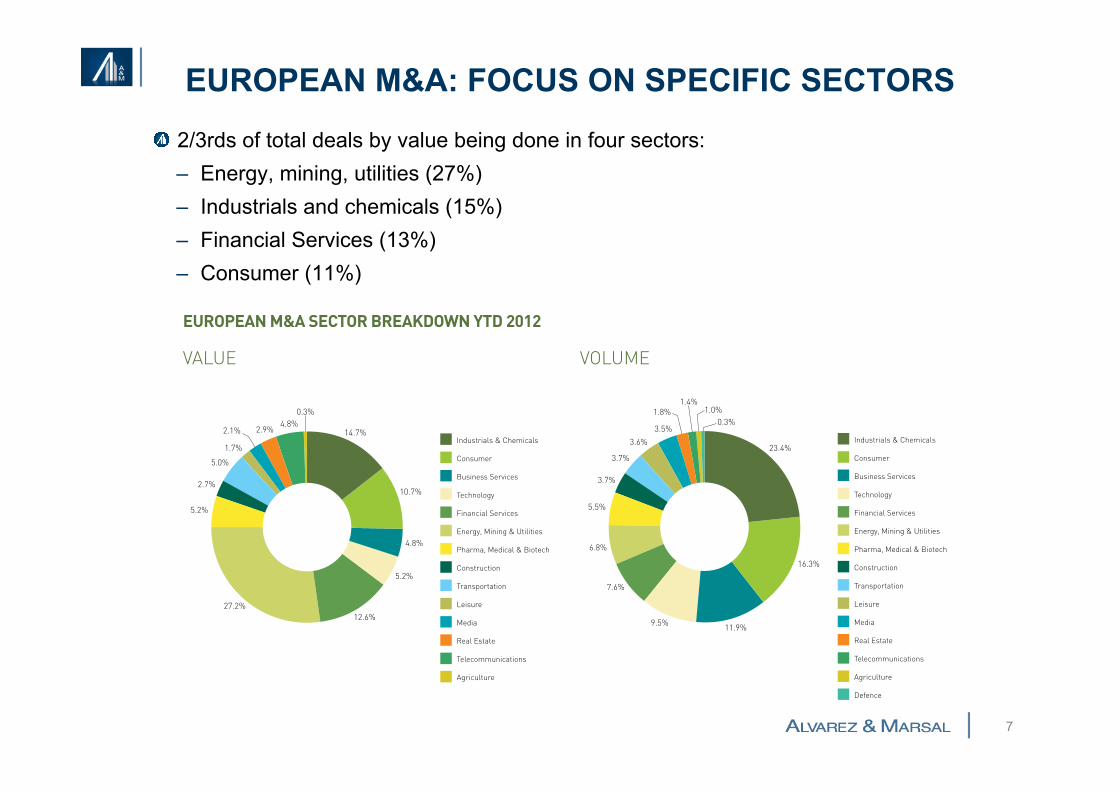
EUROPEAN M&A: FOCUS ON SPECIFIC SECTORS
" 2/3rds of total deals by value being done in four sectors: – Energy, mining, utilities (27%) – Industrials and chemicals (15%) – Financial Services (13%) – Consumer (11%)
7
EUROPE
Monthly M&A Insider 23
TREND GRAPHS
EUROPEAN M&A GEOGRAPHIC BREAKDOWN YTD 2012
VALUE VOLUME
UK
CEE
Iberia
France
Nordic
Germany
Benelux
Italy
Switzerland
Others
7.9%
12.7%
14.2%
6.2%
20.8%
8.5%
4.8%
8.3%
8.2%
8.4%
12.9%
8.6%
3.1%6.2%
5.7%22.3%
10.4%
11.5%
5.3%
14.0%
UK
CEE
Iberia
France
Nordic
Germany
Benelux
Italy
Switzerland
Others
EUROPEAN M&A SECTOR BREAKDOWN YTD 2012
VALUE VOLUME
4.8%
10.7%
14.7%
5.2%
2.7%
1.7%
5.0%
2.9%4.8%
0.3%
2.1%
12.6%
5.2%
27.2%
Industrials & Chemicals
Consumer
Business Services
Technology
Financial Services
Energy, Mining & Utilities
Pharma, Medical & Biotech
Construction
Transportation
Leisure
Media
Real Estate
Telecommunications
Agriculture
3.7%
23.4%
3.5%
6.8%
3.6%
5.5%
3.7%
1.8%1.4%
1.0%0.3%
16.3%
11.9%9.5%
7.6%
Industrials & Chemicals
Consumer
Business Services
Technology
Financial Services
Energy, Mining & Utilities
Pharma, Medical & Biotech
Construction
Transportation
Leisure
Media
Real Estate
Telecommunications
Agriculture
Defence
EUROPEAN M&A: POCKETS OF VALUE " Opportunities are based around a several specific themes: § #1: Financial institutions – selling portfolios of (non)performing
assets § #2: Distressed debt investing – loan-to-own § #3: Corporate carve-outs / divestitures of non core assets § #4: Bolt-ons for existing PE portfolio companies
8

TOPICS
9
I. Alvarez & Marsal Perspectives on the Current State of European Market [Sovereign / PE / Distress]
II. Middle Market Opportunities III. Pitfalls [Do’s and Don’ts]
PORTFOLIOS & DUE DILIGENCE CONSIDERATIONS
10
III. Implications for TPG
Conclusions
Ø Cash
Ø Management quality
Ø Understand the business & the true value drivers and sensitivities
Ø Planning and execution is key
Ø Contingencies – build a Plan B
Ø Gain Stakeholder support before you need it