advanced application 11 - 台灣邁達斯 · a dvanced applications 5 procedure for performing...
TRANSCRIPT
Advanced Application 11
Construction Stage Analysis using
FCM Bridge Wizard
CONTENTS
Overview 1
Bridge Dimensions and Section View s 2
Construction Stages for FCM and Stage Analysis 4
Procedure for performing construction stage analysis for FCM Bridge 5
Material Properties and Allow able Stresses 6
Loads 7
Setting Modeling Environment 9
Section and Material Property Definition 10
FCM Bridge Wizard Modeling 12
Model Data Input 12
PSC Box Section Properties Input 16
Tendon Placement Input 18
Corrections to input data and additional data input 24
Checking construction stages 24
Corrections to construction stages 27
Definition and Link for time dependent material properties 33
Removal of Tapered Section Groups 38
Performing Structural Analysis 39
Checking Analysis Results 41
Checking stresses and member forces by graphs 41
Checking stresses using tables. 46
Checking prestress losses. 47
Checking tendon coordinates. 48
Checking tendon elongation. 49
Checking tendon arrangement. 50
Checking pretension losses in tendons. 51
Deformation at a specif ic construction stage. 52
Resulting member forces at a specif ic construction stage. 53
Camber check. 54
Camber control management. 55
Checking element properties by construction stages. 56
Section properties at the last construction stage. 57
Checking member forces resulting from load combinations. 58
1
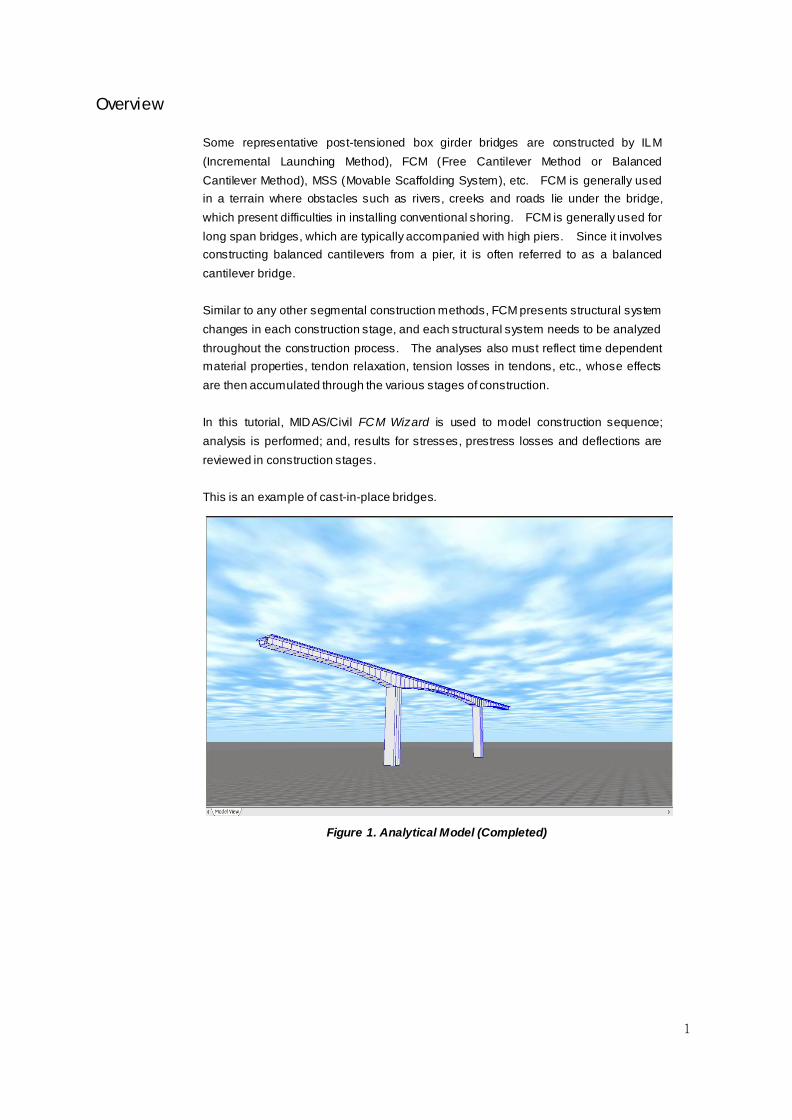
Overview
Some representative post-tensioned box girder bridges are constructed by ILM
(Incremental Launching Method), FCM (Free Cantilever Method or Balanced
Cantilever Method), MSS (Movable Scaffolding System), etc. FCM is generally used
in a terrain where obstacles such as rivers, creeks and roads lie under the bridge,
which present difficulties in installing conventional shoring. FCM is generally used for
long span bridges, which are typically accompanied with high piers. Since it involves
constructing balanced cantilevers from a pier, it is often referred to as a balanced
cantilever bridge.
Similar to any other segmental construction methods, FCM presents structural system
changes in each construction stage, and each structural system needs to be analyzed
throughout the construction process. The analyses also must reflect time dependent
material properties, tendon relaxation, tension losses in tendons, etc., whose effects
are then accumulated through the various stages of construction.
In this tutorial, MIDAS/Civil FCM Wizard is used to model construction sequence;
analysis is performed; and, results for stresses, prestress losses and deflections are
reviewed in construction stages.
This is an example of cast-in-place bridges.
Figure 1. Analytical Model (Completed)
Construction stage analy sis using FCM Wizard
2
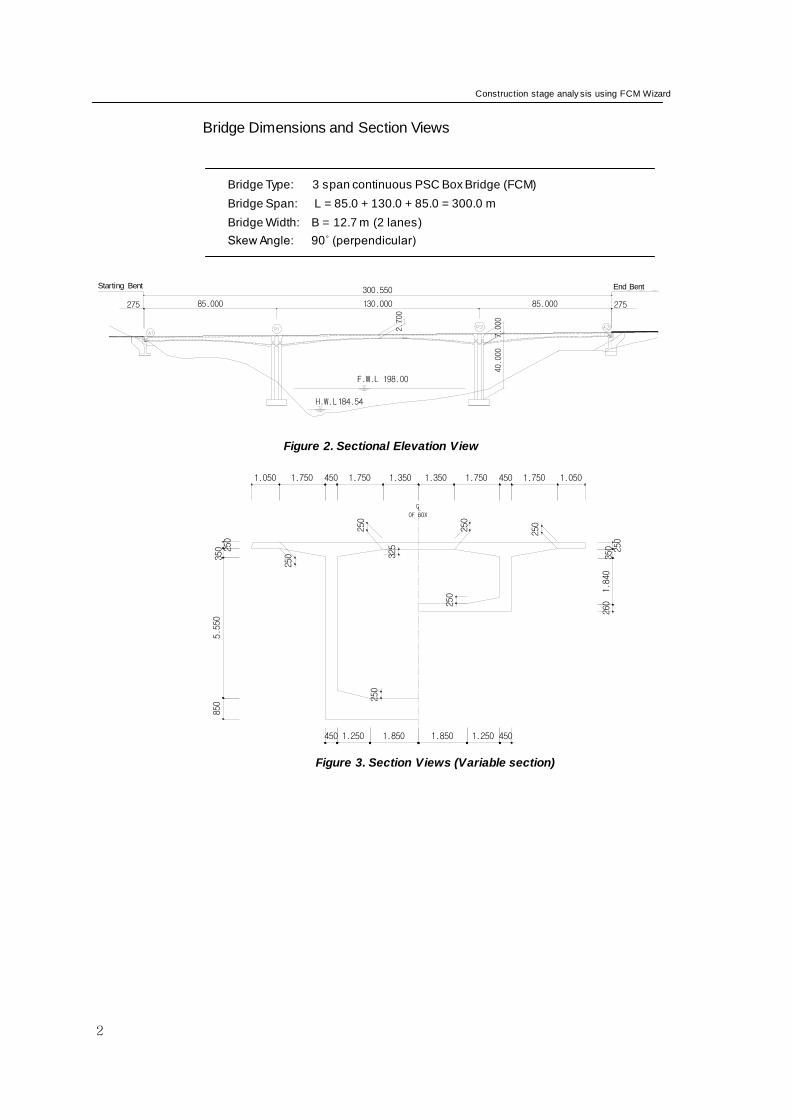
Bridge Dimensions and Section Views
Bridge Type: 3 span continuous PSC Box Bridge (FCM)
Bridge Span: L = 85.0 + 130.0 + 85.0 = 300.0 m
Bridge Width: B = 12.7 m (2 lanes)
Skew Angle: 90˚ (perpendicular)
Figure 2. Sectional Elevation View
Figure 3. Section Views (Variable section)
275
교 량 시 점300.550
130.00085.000 85.000 275
교 량 종 점
2.700
40.000
7.000
OF BOXLC
450 1.250 1.850 1.850 1.250 450
250
250
250
325
250
5.550
850
250
350
1.840
260
250
350
1.050 1.750 450 1.750 1.350 1.350 1.750 450 1.750 1.050
250
250
Starting Bent End Bent
ADVANCED APPLICATIONS
3
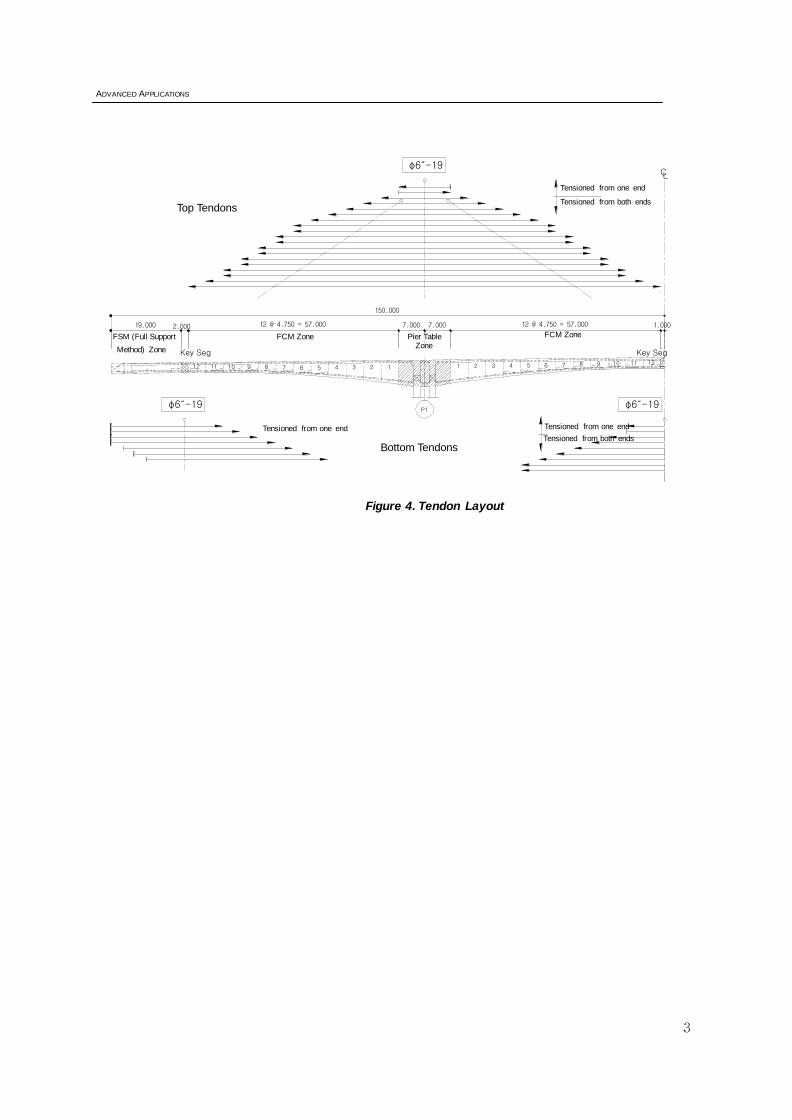
Figure 4. Tendon Layout
150.000
19.000 12 @ 4.750 = 57.000
5 6 7 8 9 10 11 12
1.000
φ6˝-19
P1
2.000 12 @ 4.750 = 57.000 7.000 7.000
12 11 10 9 8 7 6 5 4 3 2 1 1 2 3 4
상 부 강 연 선
하 부 강 연 선
CL
φ6˝-19 φ6˝-19
일단긴장
양단긴장
일단긴장
양단긴장
일단긴장
주두부FCM 구간 FCM 구간FSM 구간Key Seg Key Seg
Top Tendons
Bottom Tendons
Tensioned from one end
Tensioned from both ends
FSM (Full Support
Method) Zone
FCM Zone Pier Table Zone
FCM Zone
Tensioned from one end Tensioned from one end
Tensioned from both ends
Construction stage analy sis using FCM Wizard
4
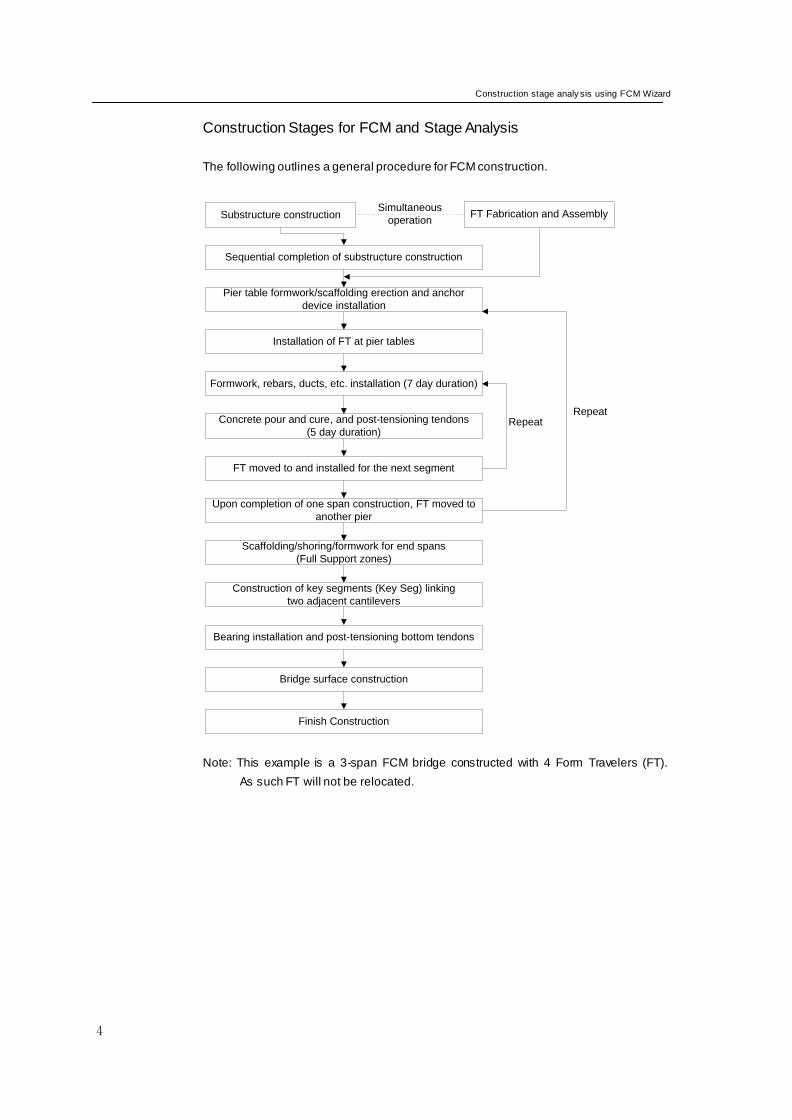
Construction Stages for FCM and Stage Analysis
The following outlines a general procedure for FCM construction.
Note: This example is a 3-span FCM bridge constructed with 4 Form Travelers (FT).
As such FT will not be relocated.
Substructure construction FT Fabrication and AssemblySimultaneous
operation
Sequential completion of substructure construction
Pier table formwork/scaffolding erection and anchor
device installation
Installation of FT at pier tables
Formwork, rebars, ducts, etc. installation (7 day duration)
Concrete pour and cure, and post-tensioning tendons
(5 day duration)
FT moved to and installed for the next segment
Upon completion of one span construction, FT moved to
another pier
Scaffolding/shoring/formwork for end spans
(Full Support zones)
Construction of key segments (Key Seg) linking
two adjacent cantilevers
Bearing installation and post-tensioning bottom tendons
Bridge surface construction
Finish Construction
RepeatRepeat

ADVANCED APPLICATIONS
5
Procedure for performing construction stage analysis for FCM Bridge
The concept of construction stage analysis in MIDAS/Civil entails activation and
deactivation of predefined Structure Groups, Boundary Groups and Load Groups at
each stage of construction.
1. Define Material and Section Properties
2. Structural Modeling
3. Define Structure Groups
4. Define Boundary Groups
5. Define Load Groups
6. Enter Loads
7. Place Tendons
8. Apply Prestress Loads
9. Define & Link Time Dependent Material Properties
10. Perform Structural Analysis
11. Check Results
FCM Wizard automatically performs the steps 2 ~ 8.
Construction stage analy sis using FCM Wizard
6
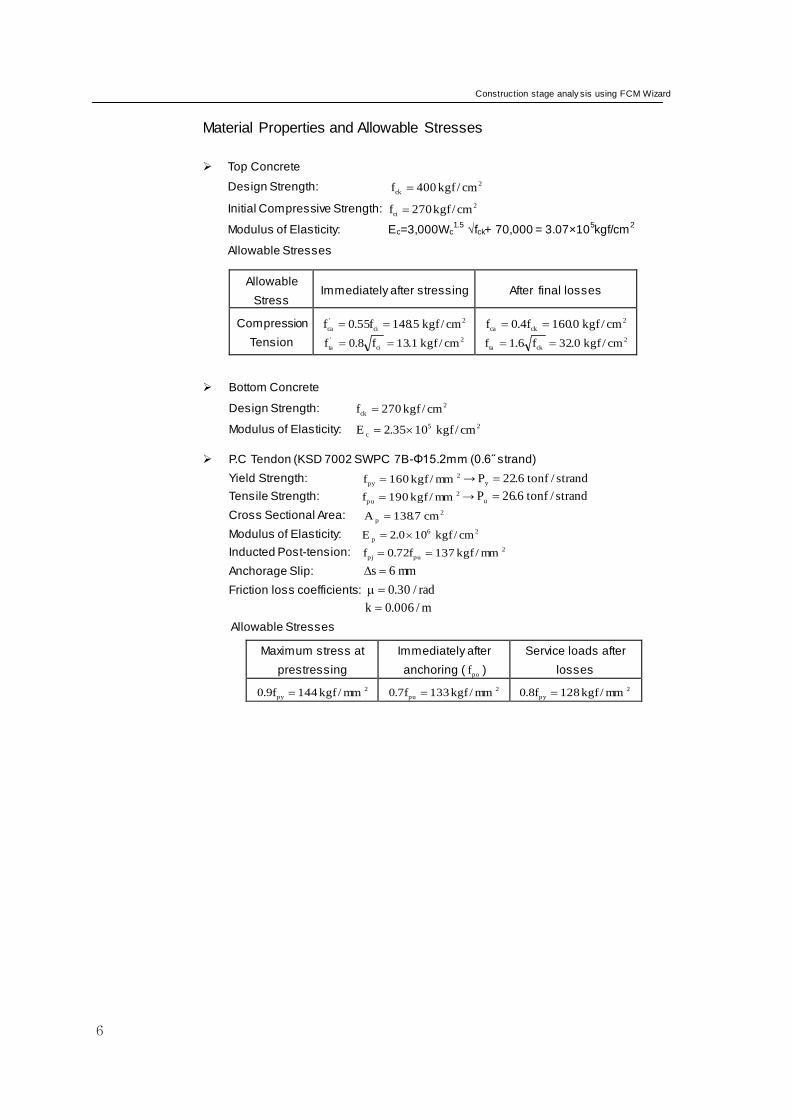
Material Properties and Allowable Stresses
Top Concrete
Design Strength: 2
ck cm/kgf400f
Initial Compressive Strength: 2
ci cm/kgf270f
Modulus of Elasticity: Ec=3,000Wc1.5
√fck+ 70,000 = 3.07×10⁵kgf/cm
2
Allowable Stresses
Allowable
Stress Immediately after stressing After final losses
Compression
Tension
2
ci
'
ca cm/kgf5.148f55.0f
2
ci
'
ta cm/kgf1.13f8.0f
2
ckca cm/kgf0.160f4.0f
2
ckta cm/kgf0.32f6.1f
Bottom Concrete
Design Strength: 2
ck cm/kgf270f
Modulus of Elasticity: 25
c cm/kgf1035.2E
P.C Tendon (KSD 7002 SWPC 7B-Φ15.2mm (0.6˝ strand)
Yield Strength: 2
py mm/kgf160f → strand/tonf6.22Py
Tensile Strength: 2
pu mm/kgf190f → strand/tonf6.26Pu
Cross Sectional Area: 2
p cm7.138A
Modulus of Elasticity: 26
p cm/kgf100.2E
Inducted Post-tension: 2
pupj mm/kgf137f72.0f
Anchorage Slip: mm6s
Friction loss coefficients: rad/30.0
m/006.0k
Allowable Stresses
Maximum stress at
prestressing
Immediately after
anchoring ( pof )
Service loads after
losses
2
py mm/kgf144f9.0 2
pu mm/kgf133f7.0 2
py mm/kgf128f8.0
ADVANCED APPLICATIONS
7
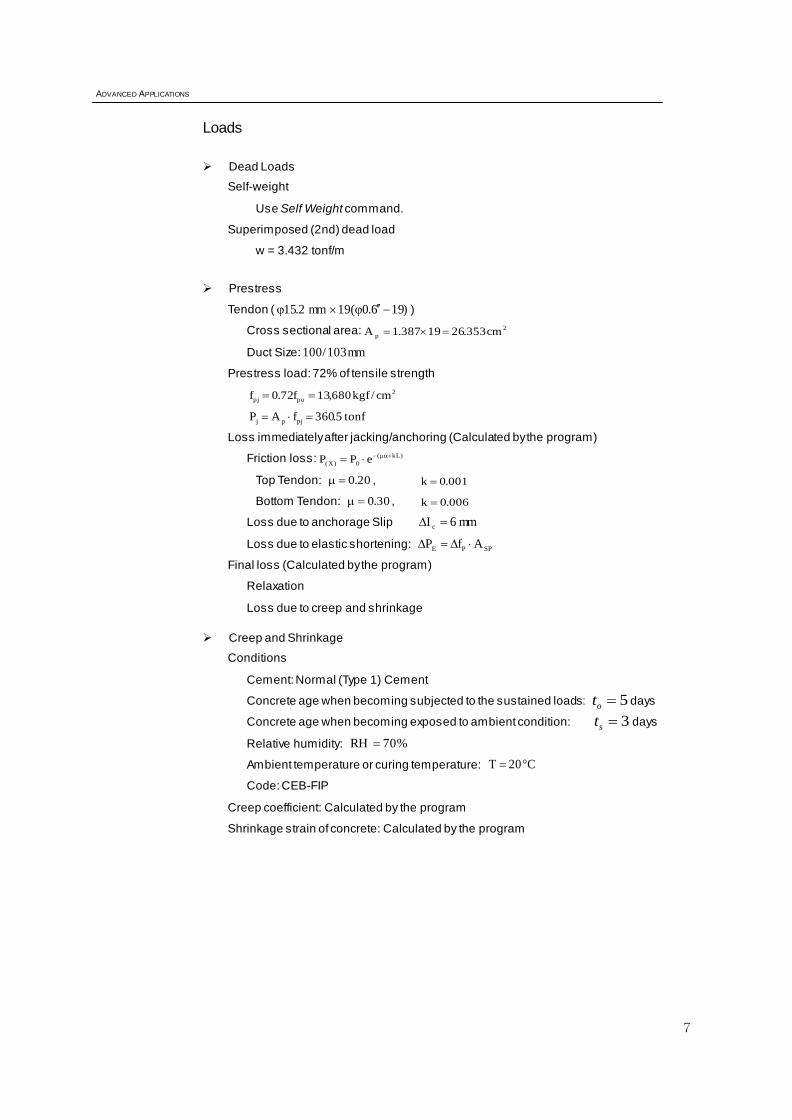
Loads
Dead Loads
Self-weight
Use Self Weight command.
Superimposed (2nd) dead load
w = 3.432 tonf/m
Prestress
Tendon ( )196.0(19mm2.15 )
Cross sectional area: 2
p cm353.2619387.1A
Duct Size: mm103/100
Prestress load: 72% of tensile strength
2
pupj cm/kgf680,13f72.0f
tonf5.360fAP pjpj
Loss immediately after jacking/anchoring (Calculated by the program)
Friction loss: )kL(
0)X( ePP
Top Tendon: 20.0 , 001.0k
Bottom Tendon: 30.0 , 006.0k
Loss due to anchorage Slip mm6I c
Loss due to elastic shortening: SPPE AfP
Final loss (Calculated by the program)
Relaxation
Loss due to creep and shrinkage
Creep and Shrinkage
Conditions
Cement: Normal (Type 1) Cement
Concrete age when becoming subjected to the sustained loads: 5ot days
Concrete age when becoming exposed to ambient condition: 3st days
Relative humidity: %70RH
Ambient temperature or curing temperature: C20T
Code: CEB-FIP
Creep coefficient: Calculated by the program
Shrinkage strain of concrete: Calculated by the program
Construction stage analy sis using FCM Wizard
8
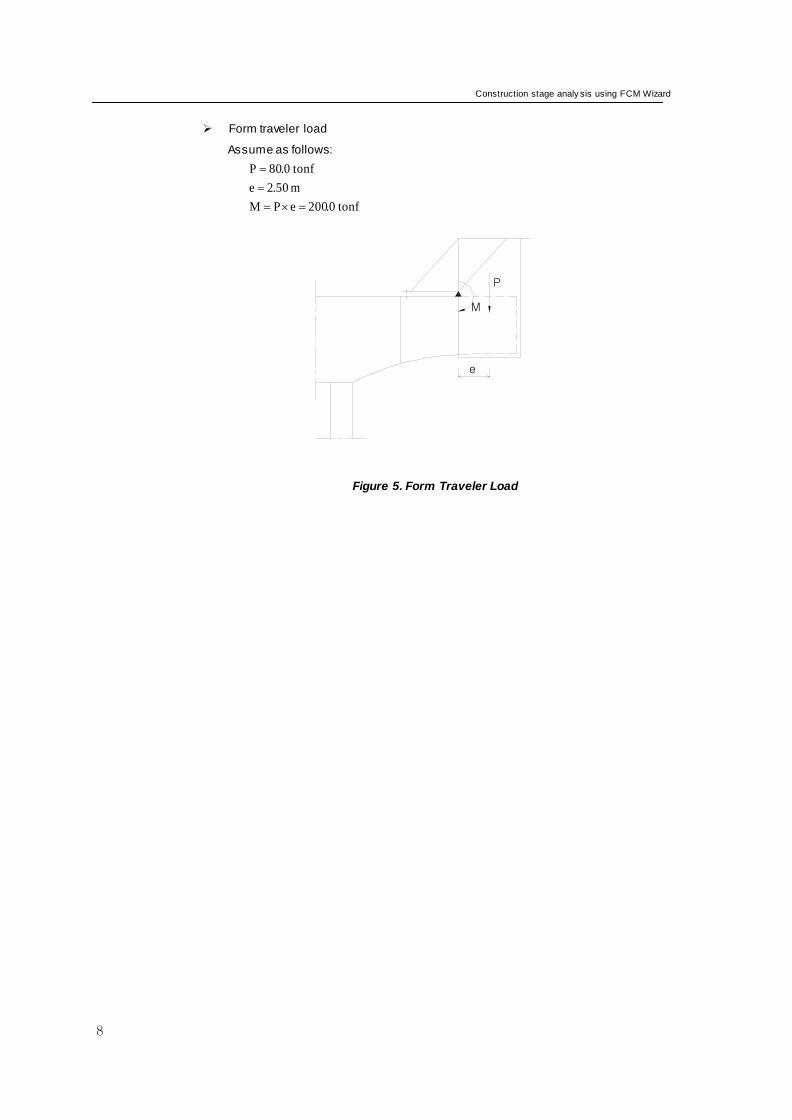
Form traveler load
Assume as follows:
tonf0.80P
m50.2e
tonf0.200ePM
Figure 5. Form Traveler Load
e
P
M
ADVANCED APPLICATIONS
9
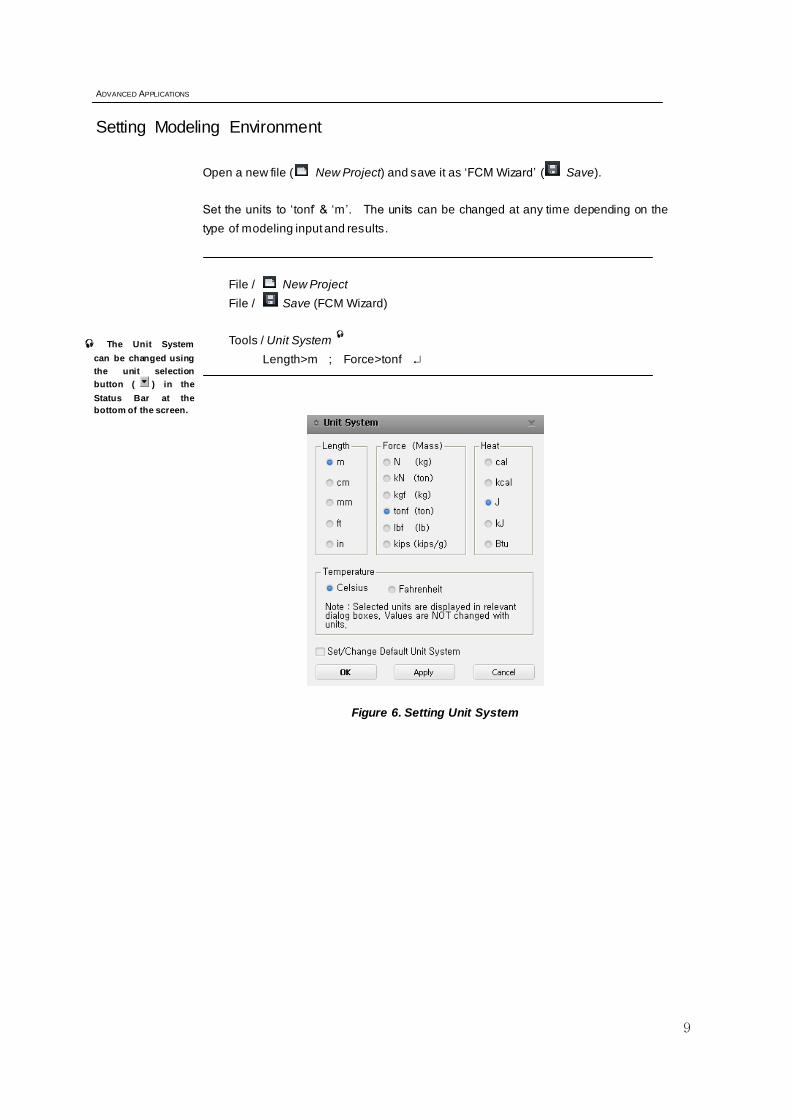
Setting Modeling Environment
Open a new file ( New Project) and save it as ‘FCM Wizard’ ( Save).
Set the units to ‘tonf’ & ‘m ’. The units can be changed at any time depending on the
type of modeling input and results.
File / New Project
File / Save (FCM Wizard)
Tools / Unit System
Length>m ; Force>tonf
Figure 6. Setting Unit System
The Unit System
can be changed using
the unit selection
button ( ) in the
Status Bar at the
bottom of the screen.
Construction stage analy sis using FCM Wizard
10
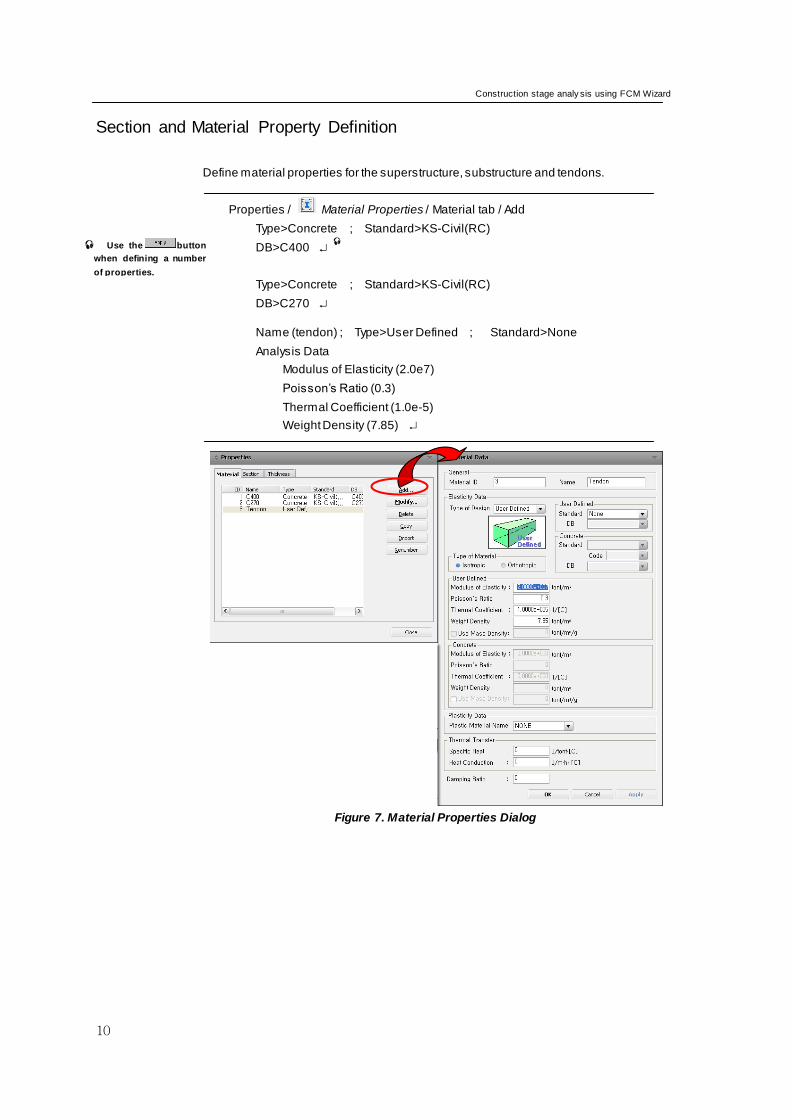
Section and Material Property Definition
Define material properties for the superstructure, substructure and tendons.
Properties / Material Properties / Material tab / Add
Type>Concrete ; Standard>KS-Civil(RC)
DB>C400
Type>Concrete ; Standard>KS-Civil(RC)
DB>C270
Name (tendon) ; Type>User Defined ; Standard>None
Analysis Data
Modulus of Elasticity (2.0e7)
Poisson’s Ratio (0.3)
Thermal Coefficient (1.0e-5)
Weight Density (7.85)
Figure 7. Material Properties Dialog
Use the button
when defining a number
of properties.
ADVANCED APPLICATIONS
11
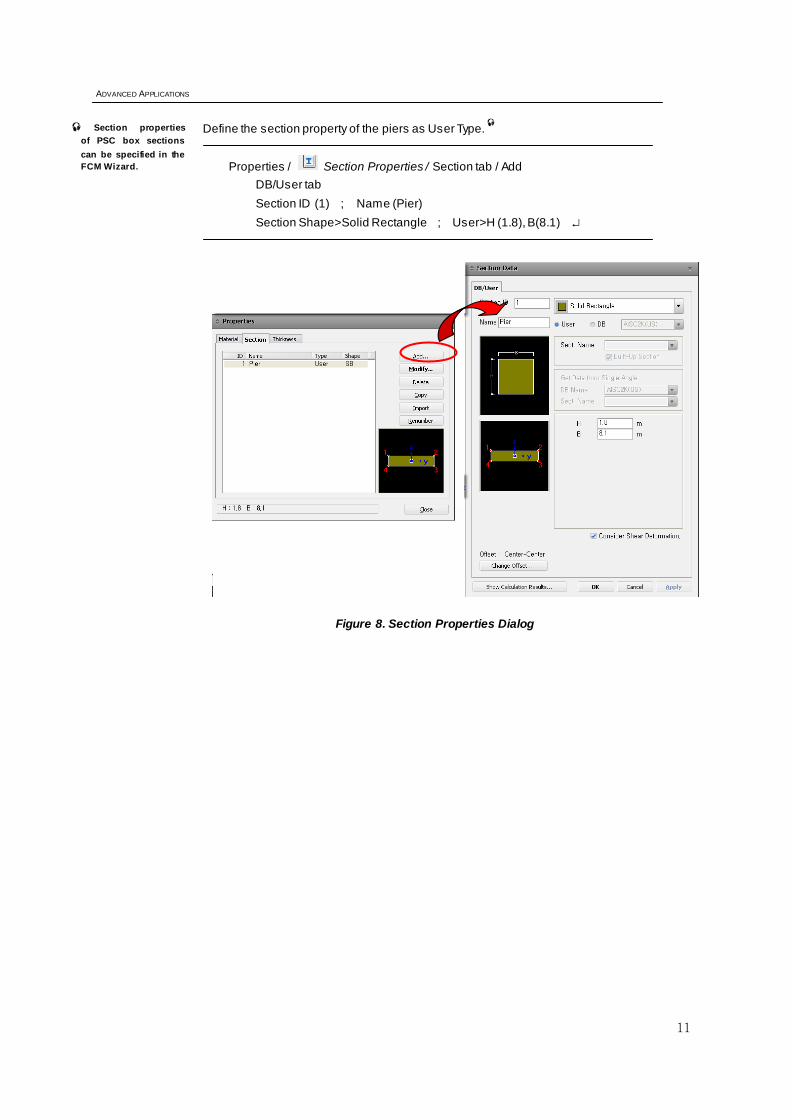
Define the section property of the piers as User Type.
Properties / Section Properties / Section tab / Add
DB/User tab
Section ID (1) ; Name (Pier)
Section Shape>Solid Rectangle ; User>H (1.8), B(8.1)
Figure 8. Section Properties Dialog
Section properties
of PSC box sections
can be specified in the
FCM Wizard.
Construction stage analy sis using FCM Wizard
12
FCM Bridge Wizard Modeling
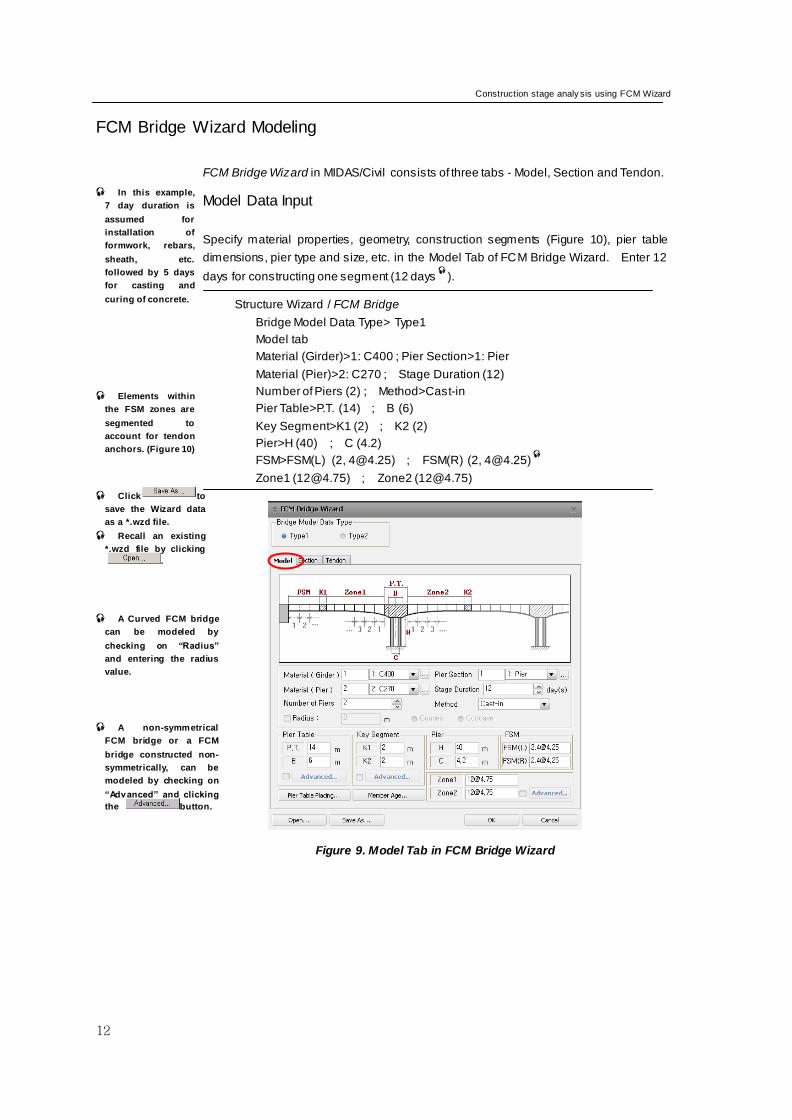
FCM Bridge Wizard in MIDAS/Civil consists of three tabs - Model, Section and Tendon.
Model Data Input
Specify material properties, geometry, construction segments (Figure 10), pier table
dimensions, pier type and size, etc. in the Model Tab of FCM Bridge Wizard. Enter 12
days for constructing one segment (12 days
).
Structure Wizard / FCM Bridge
Bridge Model Data Type> Type1
Model tab
Material (Girder)>1: C400 ; Pier Section>1: Pier
Material (Pier)>2: C270 ; Stage Duration (12)
Number of Piers (2) ; Method>Cast-in
Pier Table>P.T. (14) ; B (6)
Key Segment>K1 (2) ; K2 (2)
Pier>H (40) ; C (4.2)
FSM>FSM(L) (2, [email protected]) ; FSM(R) (2, [email protected])
Zone1 ([email protected]) ; Zone2 ([email protected])
Figure 9. Model Tab in FCM Bridge Wizard
In this example,
7 day duration is
assumed for
installation of
formwork, rebars,
sheath, etc.
followed by 5 days
for casting and
curing of concrete.
A non-symmetrical
FCM bridge or a FCM
bridge constructed non-
symmetrically, can be
modeled by checking on
“Advanced” and clicking
the button.
Elements within
the FSM zones are
segmented to
account for tendon
anchors. (Figure 10)
A Curved FCM bridge
can be modeled by
checking on “Radius”
and entering the radius
value.
Click to
save the Wizard data
as a *.wzd file.
Recall an existing
*.wzd file by clicking
.
ADVANCED APPLICATIONS
13
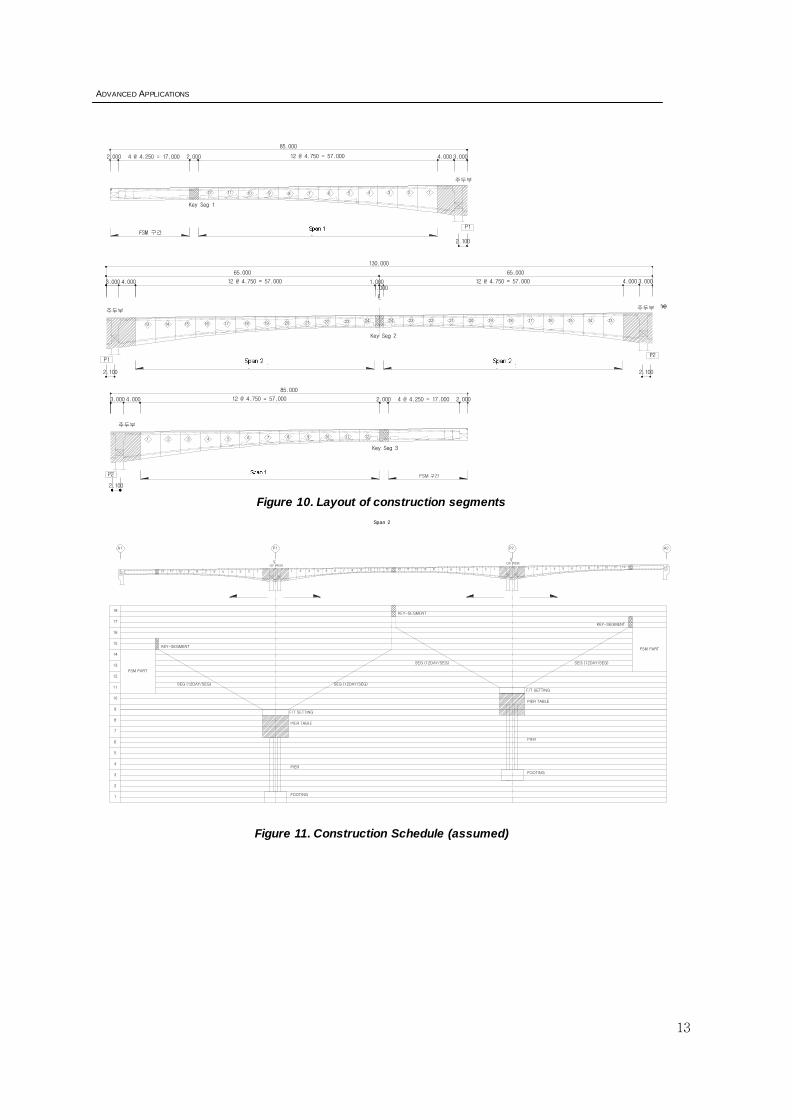
Figure 10. Layout of construction segments
Span 2
Figure 11. Construction Schedule (assumed)
1112 10 9 8 7 6 5 4 3 2 1 1 2 3 4 5 6 7 8 9 10 11 12 12 11 10 9 8 7 6 5 4 3 2 1 1 2 3 4 5 6 7 8 9 10 11 12
A1
SEG (12DAY/SEG)
FSM PART
17
14
15
12
13
16
9
10
11
8
7
6
5
4
3
2
1
SEG (12DAY/SEG)
P1 P2 A2
FSM PART
PIER TABLE
PIER
FOOTING
F/T SETTING
KEY-SEGMENT
KEY-SEGMENT
KEY-SEGMENT
SEG (12DAY/SEG) SEG (12DAY/SEG)
PIER TABLE
PIER
FOOTING
F/T SETTING
18
CLOF PIER
CLOF PIER
FSM zone
Pier Table zone
Pier Table zone Pier Table zone
Pier Table zone
FSM Zone
121110987654321
FSM 구간P2
FSM 구간
12 11 10 9 8 7 6 5 4 3 2 1
P1
85.000
3.00012 @ 4.750 = 57.0002.0004 @ 4.250 = 17.0002.000
85.000
12 @ 4.750 = 57.000 2.000 4 @ 4.250 = 17.000 2.000
13 14 15 16 17 18 19 20 21 22 23 24
P1
65.000
130.000
1.00012 @ 4.750 = 57.000
LC
131415161718192021222324
P2
65.000
1.00012 @ 4.750 = 57.000
Segment 1
4.000
2.100
4.0003.000
2.100Segment 2 Segment 2
Segment 1
2.100
2.100
3.0004.000
4.0003.000
Key Seg 1
주두부
주두부 주두부
주두부
Key Seg 2
Key Seg 3
Construction stage analy sis using FCM Wizard
14
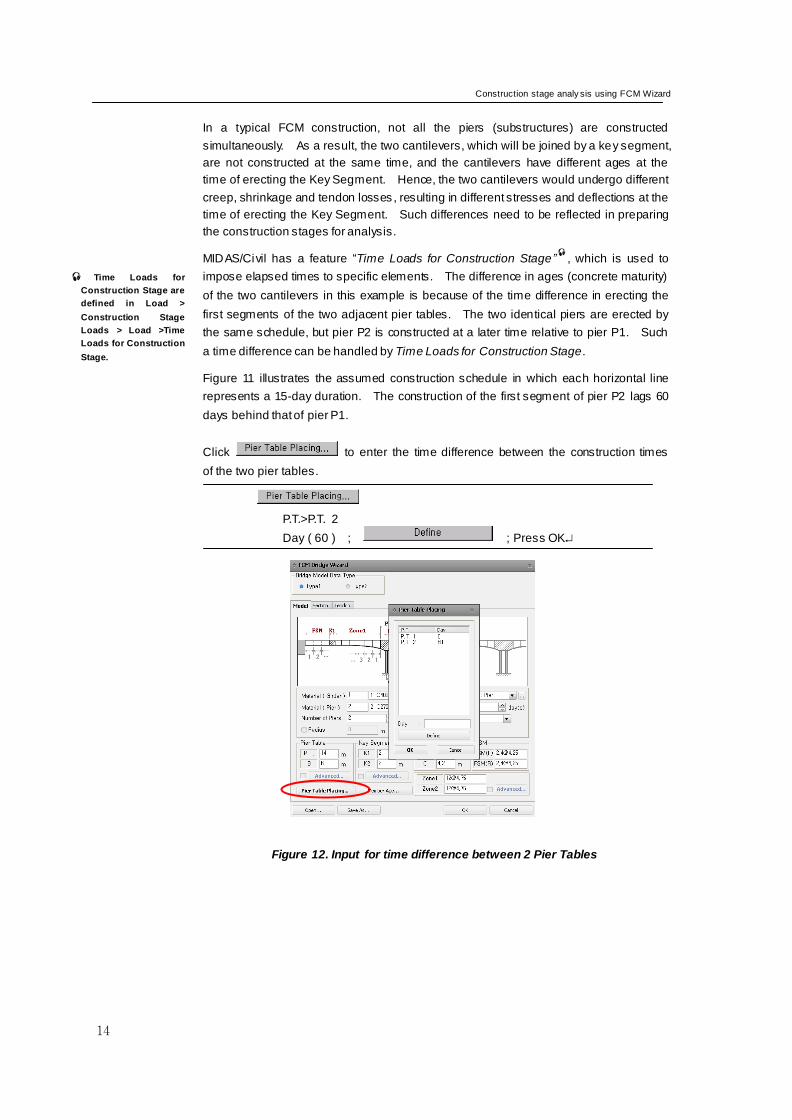
In a typical FCM construction, not all the piers (substructures) are constructed
simultaneously. As a result, the two cantilevers, which will be joined by a key segment,
are not constructed at the same time, and the cantilevers have different ages at the
time of erecting the Key Segment. Hence, the two cantilevers would undergo different
creep, shrinkage and tendon losses , resulting in different stresses and deflections at the
time of erecting the Key Segment. Such differences need to be reflected in preparing
the construction stages for analysis.
MIDAS/Civil has a feature “Time Loads for Construction Stage”
, which is used to
impose elapsed times to specific elements. The difference in ages (concrete maturity)
of the two cantilevers in this example is because of the time difference in erecting the
first segments of the two adjacent pier tables. The two identical piers are erected by
the same schedule, but pier P2 is constructed at a later time relative to pier P1. Such
a time difference can be handled by Time Loads for Construction Stage.
Figure 11 illustrates the assumed construction schedule in which each horizontal line
represents a 15-day duration. The construction of the first segment of pier P2 lags 60
days behind that of pier P1.
Click to enter the time difference between the construction times
of the two pier tables.
P.T.>P.T. 2
Day ( 60 ) ; ; Press OK
Figure 12. Input for time difference between 2 Pier Tables
Time Loads for
Construction Stage are
defined in Load >
Construction Stage
Loads > Load >Time
Loads for Construction
Stage.
ADVANCED APPLICATIONS
15
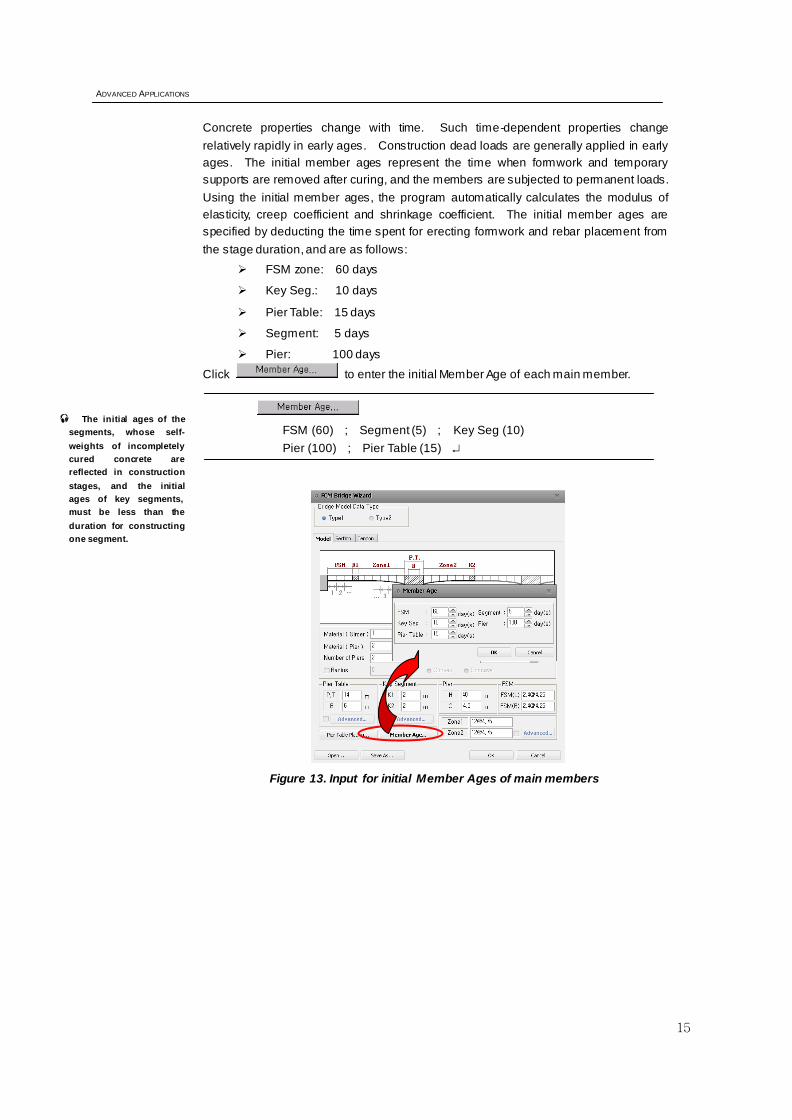
Concrete properties change with time. Such time-dependent properties change
relatively rapidly in early ages. Construction dead loads are generally applied in early
ages. The initial member ages represent the time when formwork and temporary
supports are removed after curing, and the members are subjected to permanent loads.
Using the initial member ages, the program automatically calculates the modulus of
elasticity, creep coefficient and shrinkage coefficient. The initial member ages are
specified by deducting the time spent for erecting formwork and rebar placement from
the stage duration, and are as follows:
FSM zone: 60 days
Key Seg.: 10 days
Pier Table: 15 days
Segment: 5 days
Pier: 100 days
Click to enter the initial Member Age of each main member.
FSM (60) ; Segment (5) ; Key Seg (10)
Pier (100) ; Pier Table (15)
Figure 13. Input for initial Member Ages of main members
The initial ages of the
segments, whose self-
weights of incompletely
cured concrete are
reflected in construction
stages, and the initial
ages of key segments,
must be less than the
duration for constructing
one segment.
Construction stage analy sis using FCM Wizard
16
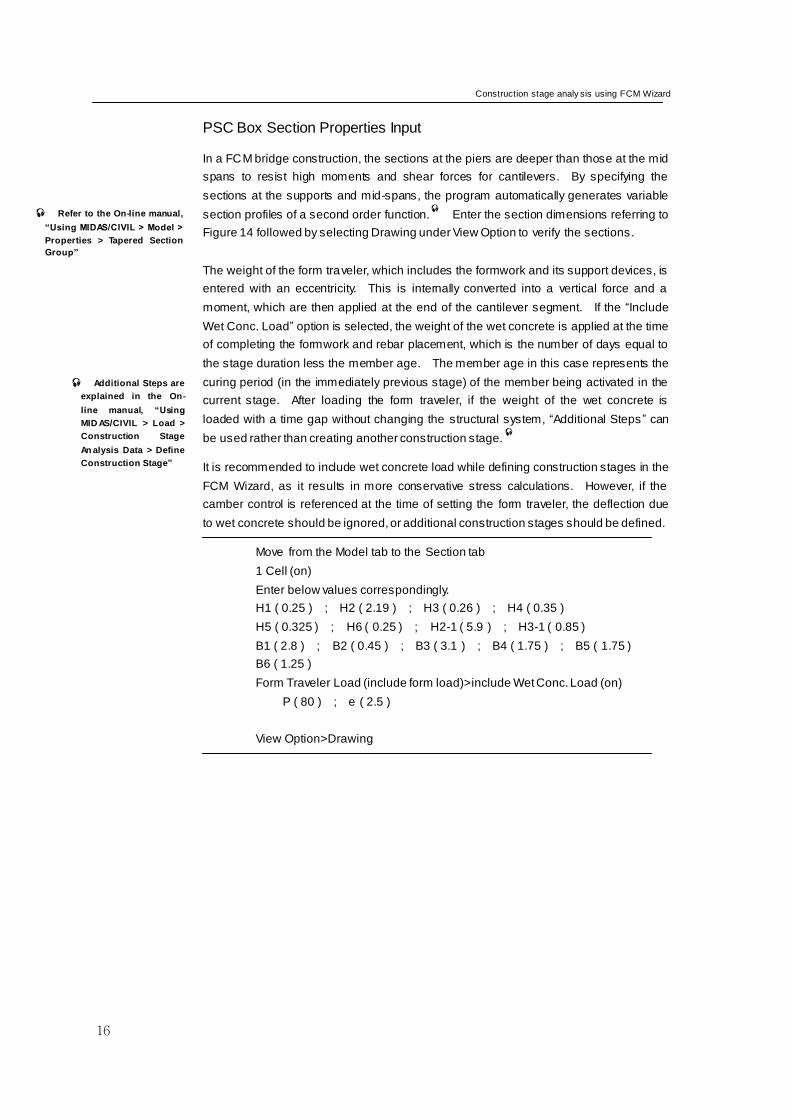
PSC Box Section Properties Input
In a FCM bridge construction, the sections at the piers are deeper than those at the mid
spans to resist high moments and shear forces for cantilevers. By specifying the
sections at the supports and mid-spans, the program automatically generates variable
section profiles of a second order function.
Enter the section dimensions referring to
Figure 14 followed by selecting Drawing under View Option to verify the sections.
The weight of the form traveler, which includes the formwork and its support devices, is
entered with an eccentricity. This is internally converted into a vertical force and a
moment, which are then applied at the end of the cantilever segment. If the “Include
Wet Conc. Load” option is selected, the weight of the wet concrete is applied at the time
of completing the formwork and rebar placement, which is the number of days equal to
the stage duration less the member age. The member age in this case represents the
curing period (in the immediately previous stage) of the member being activated in the
current stage. After loading the form traveler, if the weight of the wet concrete is
loaded with a time gap without changing the structural system, “Additional Steps ” can
be used rather than creating another construction stage.
It is recommended to include wet concrete load while defining construction stages in the
FCM Wizard, as it results in more conservative stress calculations. However, if the
camber control is referenced at the time of setting the form traveler, the deflection due
to wet concrete should be ignored, or additional construction stages should be defined.
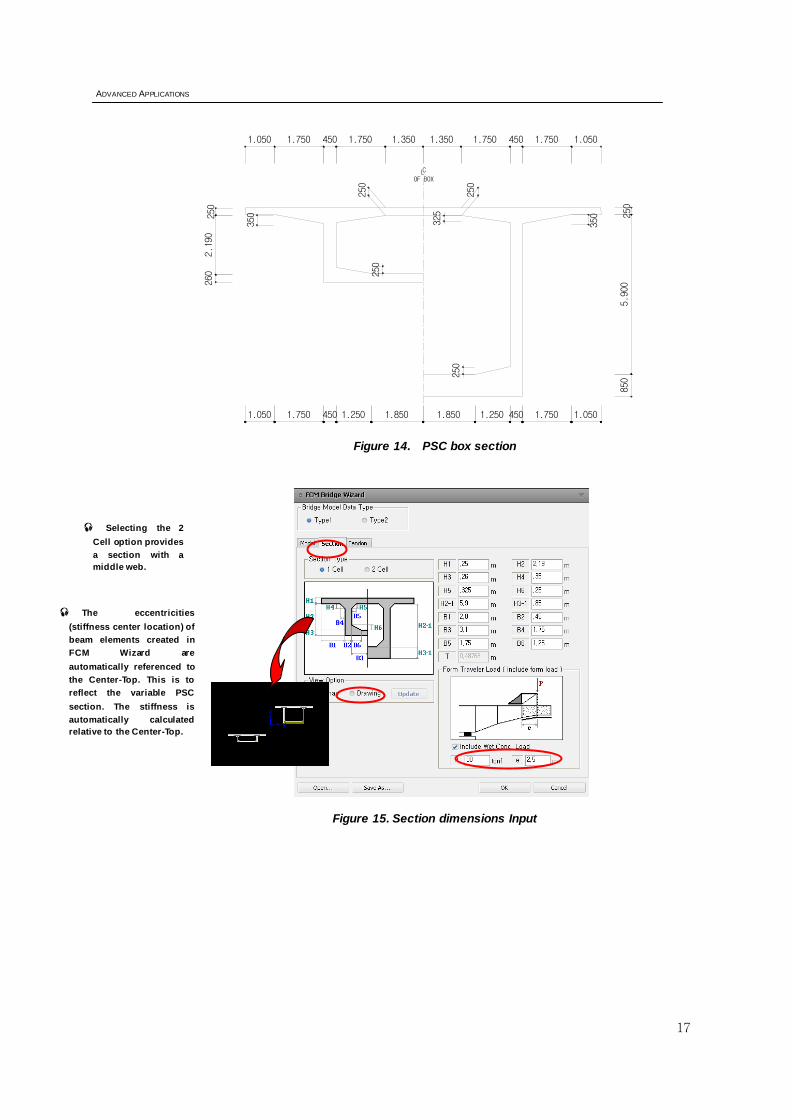
Move from the Model tab to the Section tab
1 Cell (on)
Enter below values correspondingly.
H1 ( 0.25 ) ; H2 ( 2.19 ) ; H3 ( 0.26 ) ; H4 ( 0.35 )
H5 ( 0.325 ) ; H6 ( 0.25 ) ; H2-1 ( 5.9 ) ; H3-1 ( 0.85 )
B1 ( 2.8 ) ; B2 ( 0.45 ) ; B3 ( 3.1 ) ; B4 ( 1.75 ) ; B5 ( 1.75 )
B6 ( 1.25 )
Form Traveler Load (include form load)>include Wet Conc. Load (on)
P ( 80 ) ; e ( 2.5 )
View Option>Drawing
Additional Steps are
explained in the On-
line manual, “Using
MID AS/CIVIL > Load >
Construction Stage
An alysis Data > Define
Construction Stage”
Refer to the On-line manual,
“Using MIDAS/CIVIL > Model >
Properties > Tapered Section
Group”
ADVANCED APPLICATIONS
17
Figure 14. PSC box section
Figure 15. Section dimensions Input
The eccentricities
(stiffness center location) of
beam elements created in
FCM Wizard are
automatically referenced to
the Center-Top. This is to
reflect the variable PSC
section. The stiffness is
automatically calculated
relative to the Center-Top.
Selecting the 2
Cell option provides
a section with a
middle web.
OF BOXLC
4501.2501.8501.8501.250450
250
250
325
250
5.900
850
250
350
2.190
260
250
350
1.0501.7504501.7501.3501.3501.7504501.7501.050
250
1.0501.7501.050 1.750
Construction stage analy sis using FCM Wizard
18
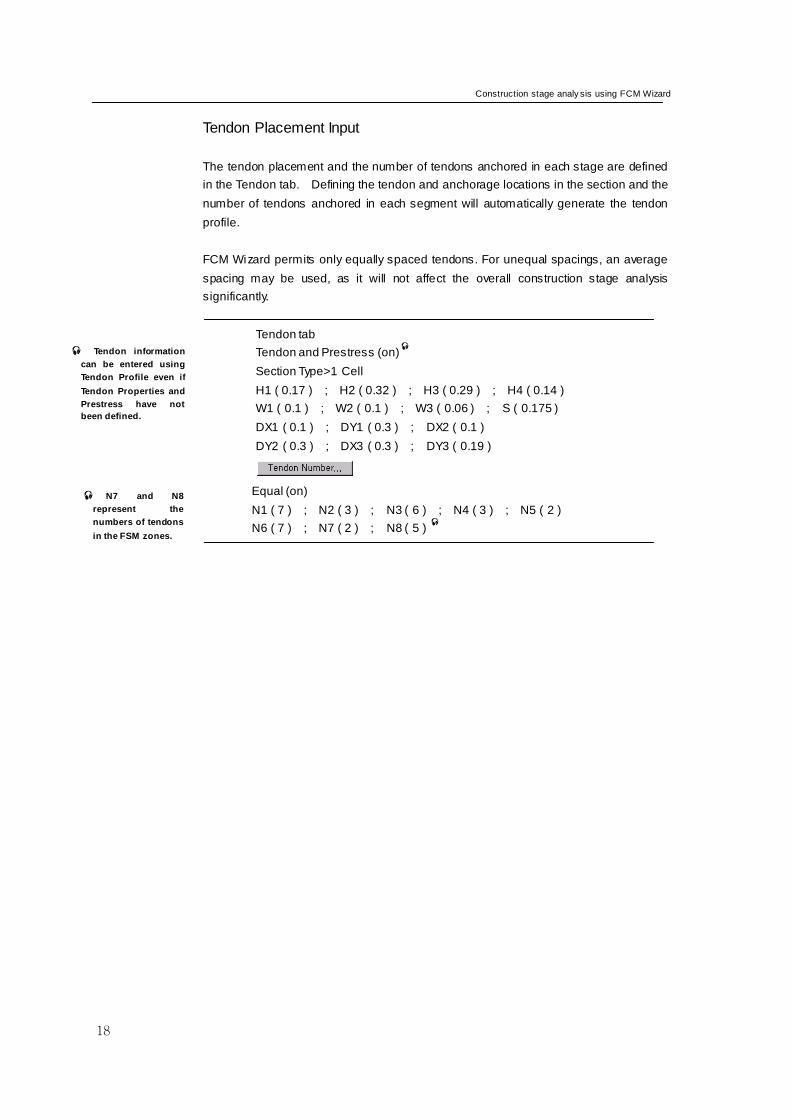
Tendon Placement Input
The tendon placement and the number of tendons anchored in each stage are defined
in the Tendon tab. Defining the tendon and anchorage locations in the section and the
number of tendons anchored in each segment will automatically generate the tendon
profile.
FCM Wizard permits only equally spaced tendons. For unequal spacings, an average
spacing may be used, as it will not affect the overall construction stage analysis
significantly.
Tendon tab
Tendon and Prestress (on)
Section Type>1 Cell
H1 ( 0.17 ) ; H2 ( 0.32 ) ; H3 ( 0.29 ) ; H4 ( 0.14 )
W1 ( 0.1 ) ; W2 ( 0.1 ) ; W3 ( 0.06 ) ; S ( 0.175 )
DX1 ( 0.1 ) ; DY1 ( 0.3 ) ; DX2 ( 0.1 )
DY2 ( 0.3 ) ; DX3 ( 0.3 ) ; DY3 ( 0.19 )
Equal (on)
N1 ( 7 ) ; N2 ( 3 ) ; N3 ( 6 ) ; N4 ( 3 ) ; N5 ( 2 )
N6 ( 7 ) ; N7 ( 2 ) ; N8 ( 5 )
Tendon information
can be entered using
Tendon Profile even if
Tendon Properties and
Prestress have not
been defined.
N7 and N8
represent the
numbers of tendons
in the FSM zones.
ADVANCED APPLICATIONS
19
Figure 16. End span tendon placement. Figure 17. Center span tendon placement.
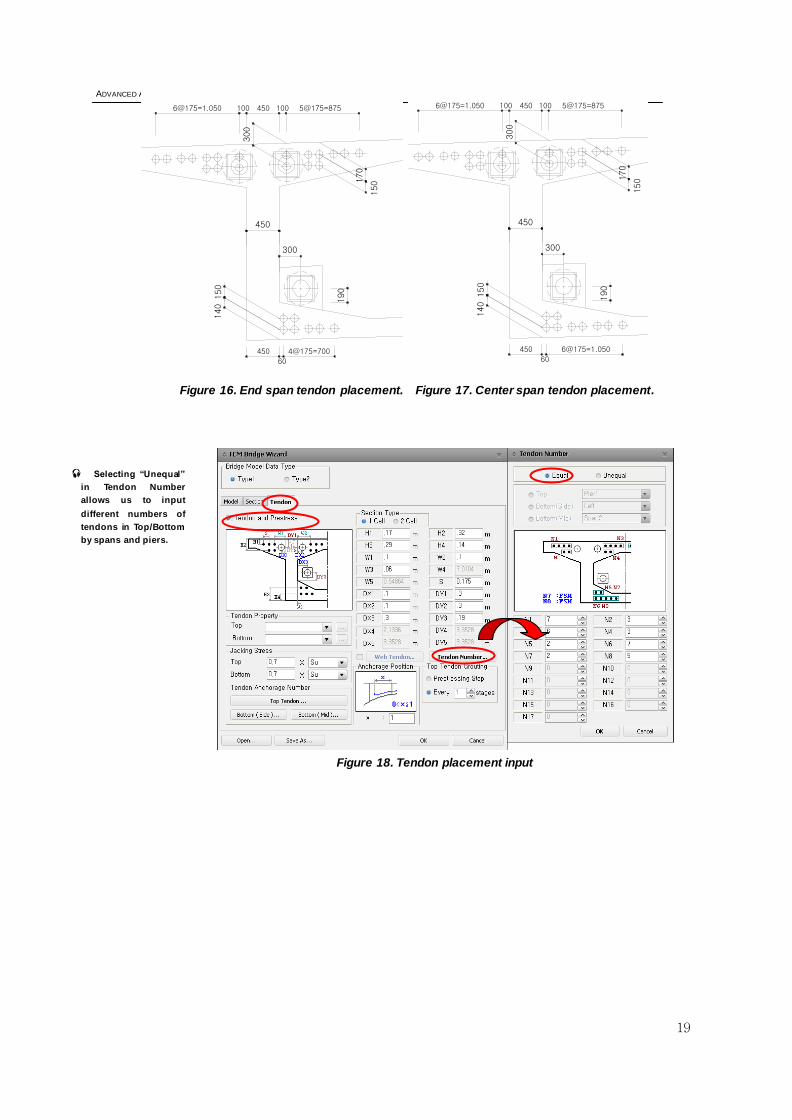
Figure 18. Tendon placement input
Selecting “Unequal”
in Tendon Number
allows us to input
different numbers of
tendons in Top/Bottom
by spans and piers.
4@175=700450
5@175=8754506@175=1.050
60
100 100
170
150
300
300
190
140
150
450
6@175=1.050450
5@175=8754506@175=1.050
60
100 100
170
150
300
300
190
140
150
450
Construction stage analy sis using FCM Wizard
20
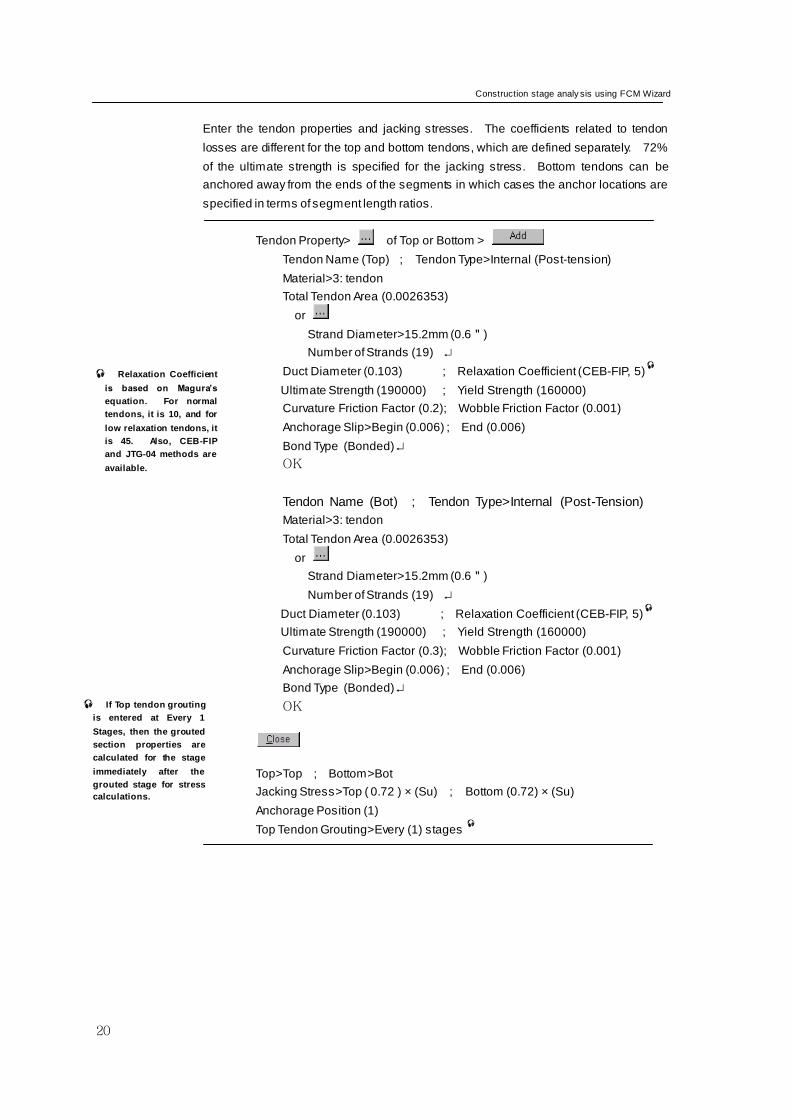
Enter the tendon properties and jacking stresses. The coefficients related to tendon
losses are different for the top and bottom tendons, which are defined separately. 72%
of the ultimate strength is specified for the jacking stress. Bottom tendons can be
anchored away from the ends of the segments in which cases the anchor locations are
specified in terms of segment length ratios.
Tendon Property> of Top or Bottom >
Tendon Name (Top) ; Tendon Type>Internal (Post-tension)
Material>3: tendon
Total Tendon Area (0.0026353)
or
Strand Diameter>15.2mm (0.6")
Number of Strands (19)
Duct Diameter (0.103) ; Relaxation Coefficient (CEB-FIP, 5)
Ultimate Strength (190000) ; Yield Strength (160000)
Curvature Friction Factor (0.2); Wobble Friction Factor (0.001)
Anchorage Slip>Begin (0.006) ; End (0.006)
Bond Type (Bonded)
OK
Tendon Name (Bot) ; Tendon Type>Internal (Post-Tension)
Material>3: tendon
Total Tendon Area (0.0026353)
or
Strand Diameter>15.2mm (0.6")
Number of Strands (19)
Duct Diameter (0.103) ; Relaxation Coefficient (CEB-FIP, 5)
Ultimate Strength (190000) ; Yield Strength (160000)
Curvature Friction Factor (0.3); Wobble Friction Factor (0.001)
Anchorage Slip>Begin (0.006) ; End (0.006)
Bond Type (Bonded)
OK
Top>Top ; Bottom>Bot
Jacking Stress>Top ( 0.72 ) × (Su) ; Bottom (0.72) × (Su)
Anchorage Position (1)
Top Tendon Grouting>Every (1) stages
If Top tendon grouting
is entered at Every 1
Stages, then the grouted
section properties are
calculated for the stage
immediately after the
grouted stage for stress
calculations.
Relaxation Coefficient
is based on Magura’s
equation. For normal
tendons, it is 10, and for
low relaxation tendons, it
is 45. Also, CEB-FIP
and JTG-04 methods are
available.
ADVANCED APPLICATIONS
21
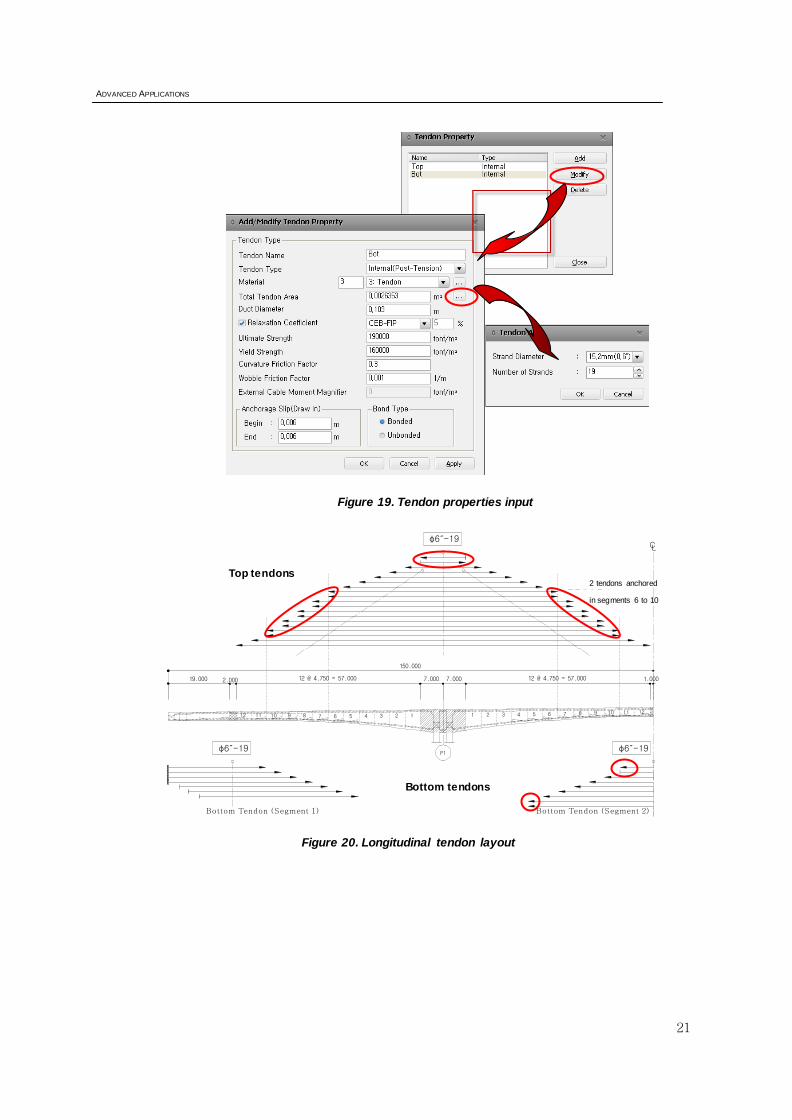
Figure 19. Tendon properties input
Figure 20. Longitudinal tendon layout
150.000
19.000 12 @ 4.750 = 57.000
5 6 7 8 9 10 11 12
1.000
φ6˝-19
P1
2.000 12 @ 4.750 = 57.000 7.000 7.000
12 11 10 9 8 7 6 5 4 3 2 1 1 2 3 4
상 부 강 연 선
하 부 강 연 선
CL
φ6˝-19 φ6˝-19
Bottom Tendon (Segment 1)
segment 6 ~ 10 에
Bottom Tendon (Segment 2)
텐던 2개 정착
Top tendons 2 tendons anchored
in segments 6 to 10
Bottom tendons
Construction stage analy sis using FCM Wizard
22
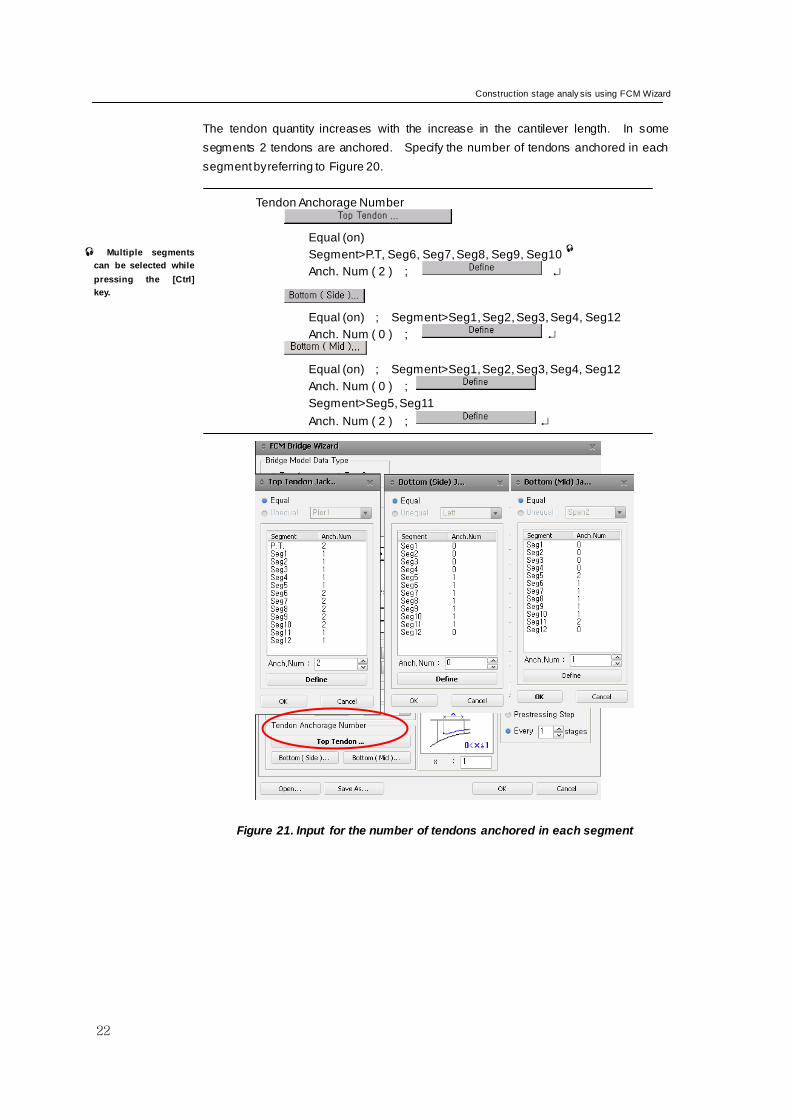
The tendon quantity increases with the increase in the cantilever length. In some
segments 2 tendons are anchored. Specify the number of tendons anchored in each
segment by referring to Figure 20.
Tendon Anchorage Number
Equal (on)
Segment>P.T, Seg6, Seg7, Seg8, Seg9, Seg10
Anch. Num ( 2 ) ;
Equal (on) ; Segment>Seg1, Seg2, Seg3, Seg4, Seg12
Anch. Num ( 0 ) ;
Equal (on) ; Segment>Seg1, Seg2, Seg3, Seg4, Seg12
Anch. Num ( 0 ) ;
Segment>Seg5, Seg11
Anch. Num ( 2 ) ;
Figure 21. Input for the number of tendons anchored in each segment
Multiple segments
can be selected while
pressing the [Ctrl]
key.
ADVANCED APPLICATIONS
23
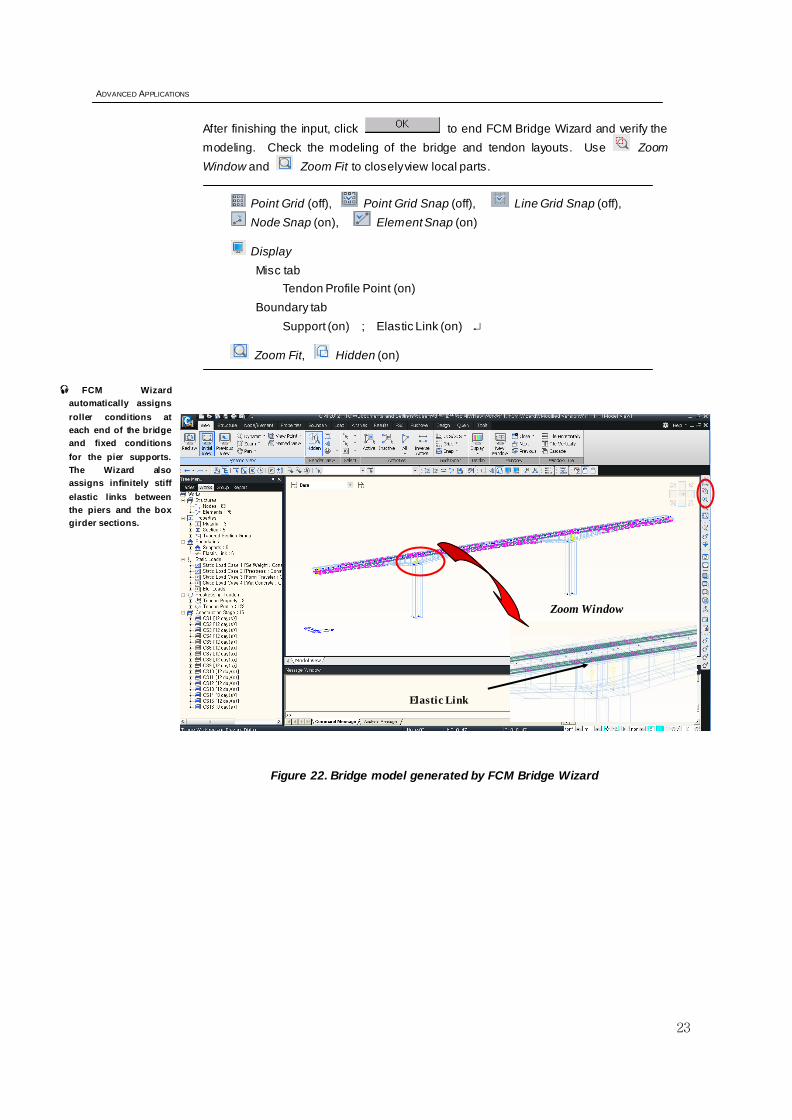
After finishing the input, click to end FCM Bridge Wizard and verify the
modeling. Check the modeling of the bridge and tendon layouts. Use Zoom
Window and Zoom Fit to closely view local parts.
Point Grid (off), Point Grid Snap (off), Line Grid Snap (off),
Node Snap (on), Element Snap (on)
Display
Misc tab
Tendon Profile Point (on)
Boundary tab
Support (on) ; Elastic Link (on)
Zoom Fit, Hidden (on)
Figure 22. Bridge model generated by FCM Bridge Wizard
FCM Wizard
automatically assigns
roller conditions at
each end of the bridge
and fixed conditions
for the pier supports.
The Wizard also
assigns infinitely stiff
elastic links between
the piers and the box
girder sections.
Zoom Window
Elastic Link
Construction stage analy sis using FCM Wizard
24
Corrections to input data and additional data input
Checking construction stages
When Construction Stage is defined, MIDAS/Civil has two operational modes (Base
Stage mode and Construction Stage mode).
In the Base Stage mode, all input related to the structural model data, loading and
boundary conditions is permitted. No analysis is performed for the Base Stage.
Structural analysis is performed for Construction Stage. In the Construction Stage
mode, no structural data is permitted to be changed or deleted other than the Boundary
and Load Groups included in each stage.
Construction Stage is defined by activating and deactivating Structure (element) Groups,
Boundary Groups and Load Groups, not individual elements and boundary and load
conditions. In the Construction Stage Mode, boundary and load conditions included in
each activated Boundary Group and Load Group can be modified and deleted.
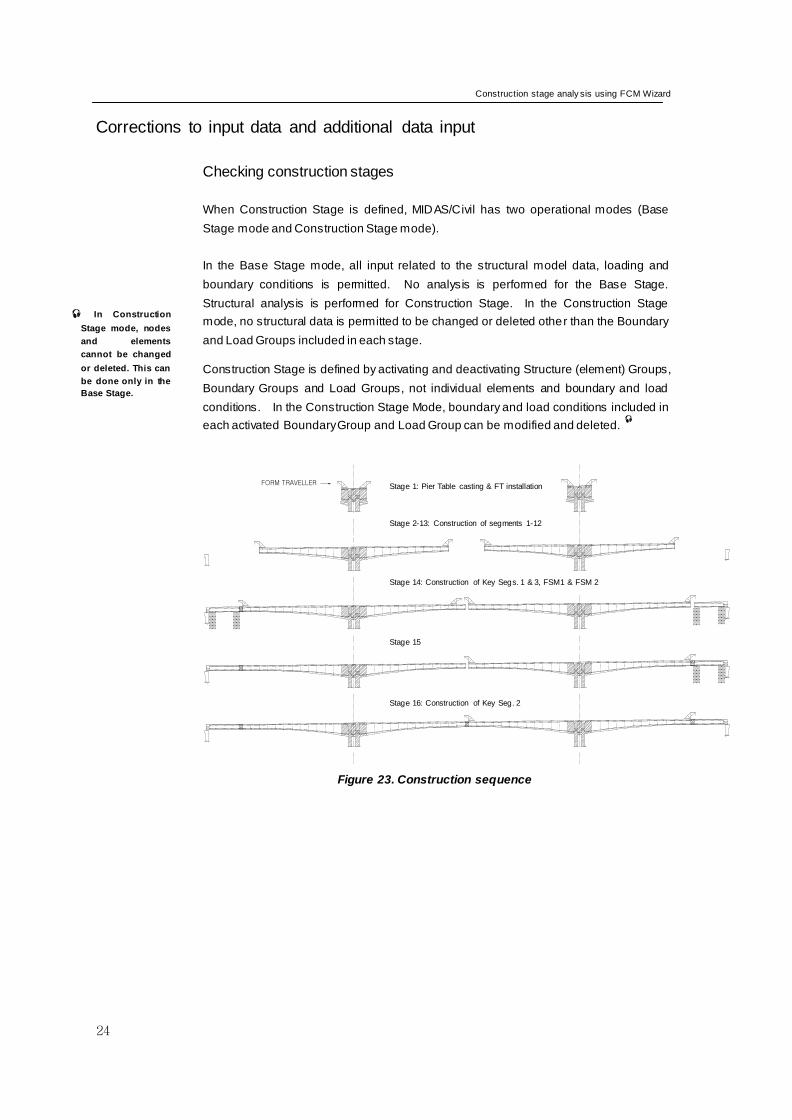
Figure 23. Construction sequence
FORM TRAVELLER "Stage 1" 주두부 시공 및 F/T 설치
"Stage 2~13" 세그먼트 1~12 시공
"Stage 14" Key Seg. 1 체결
"Stage 15" Key Seg. 3 체결
"Stage 16" Key Seg. 2 체결
Stage 1: Pier Table casting & FT installation
Stage 2-13: Construction of segments 1-12
Stage 14: Construction of Key Segs. 1 & 3, FSM1 & FSM 2
Stage 15
Stage 16: Construction of Key Seg. 2
In Construction
Stage mode, nodes
and elements
cannot be changed
or deleted. This can
be done only in the
Base Stage.
ADVANCED APPLICATIONS
25
The construction sequence shown in Figure 23 is summarized by relating it to activation
and inactivation of Structure, Load and Boundary Groups in each construction stage.
1. Construction Stage 1
Activate Structure Groups for piers & pier tables
Activate Boundary Group (Support)
First day: activate prestress, form traveler (FT) & self-wt
7th day: activate self-wt of wet concrete (segment 1)
2. Construction Stage 2
Activate Segment 1
First day: inactivate FT and wet concrete of Construction Stage 1, and
activate FT load and prestress
7th day: activate self-wt of wet concrete (segment 2)
3. Construction Stage 3~12: Repeat Construction Stage 2
4. Construction Stage 13
Activate Segment 12
First day: inactivate FT and wet concrete of Construction Stage 12, and
activate Key Seg. FT loads & prestress
20th day: activate self-wt of wet concrete (Key Seg. 1 and Key Seg. 3)
5. Construction Stage 14
Activate Key Seg. 1, 3 and FSM 1, 2
Activate Boundary Group (FSM_Left, FSM_Right)
First day: inactivate FT loads and self-wt of wet concrete of Key Seg. 1
and Key Seg. 3, and activate prestress
Last day: activate elements at the Pier 1 side and time load for FSM1
6. Construction Stage 15
Activate self-wt of wet concrete of Key Seg. 2
7. Construction Stage 16
Activate Key Seg. 2
First day: inactivate FT loads and self-wt of wet concrete, and activate
prestress
First day: activate 2nd (superimposed) dead loads
Construction stage analy sis using FCM Wizard
26
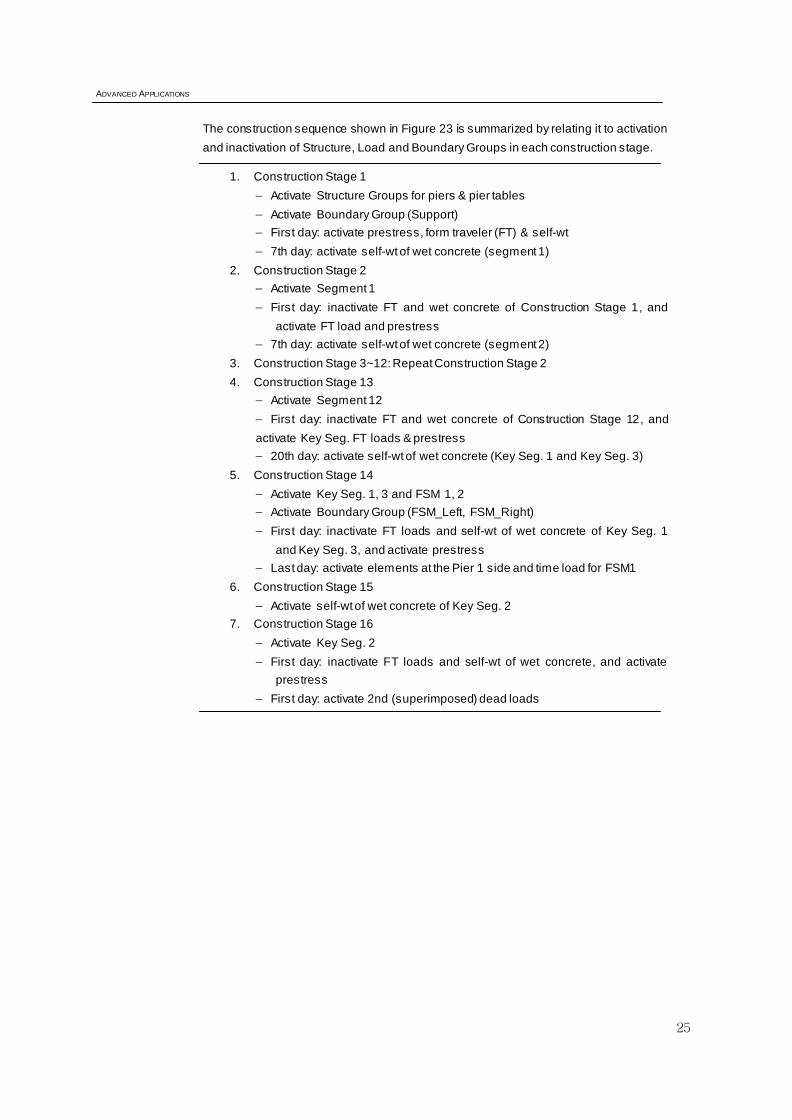
Check the construction stages auto-generated by FCM Bridge Wizard. The Stage
toolbar and Works Tree can be used to verify the construction stage information. From
the Stage toolbar, each construction stage can be checked for activated and
deactivated Structure Group, Boundary Group and Load Group in conjunction with
Works Tree. The Stage toolbar also enables us to check the change of structures
through the various construction stages in the Model View.
Display
Load tab
Load Case > Load Value (on) ; Nodal Load (on)
In Model View > Choose CS4 (Construction Stage 4)
Stage>CS4
Figure 24. Structural system for the construction stage 4
Construction stage information
After placing the
cursor on the Stage
Toolbar, arrows on
the keyboard can be
used to navigate
between the stages. The wheel mouse
can be used as well.
ADVANCED APPLICATIONS
27
Corrections to construction stages
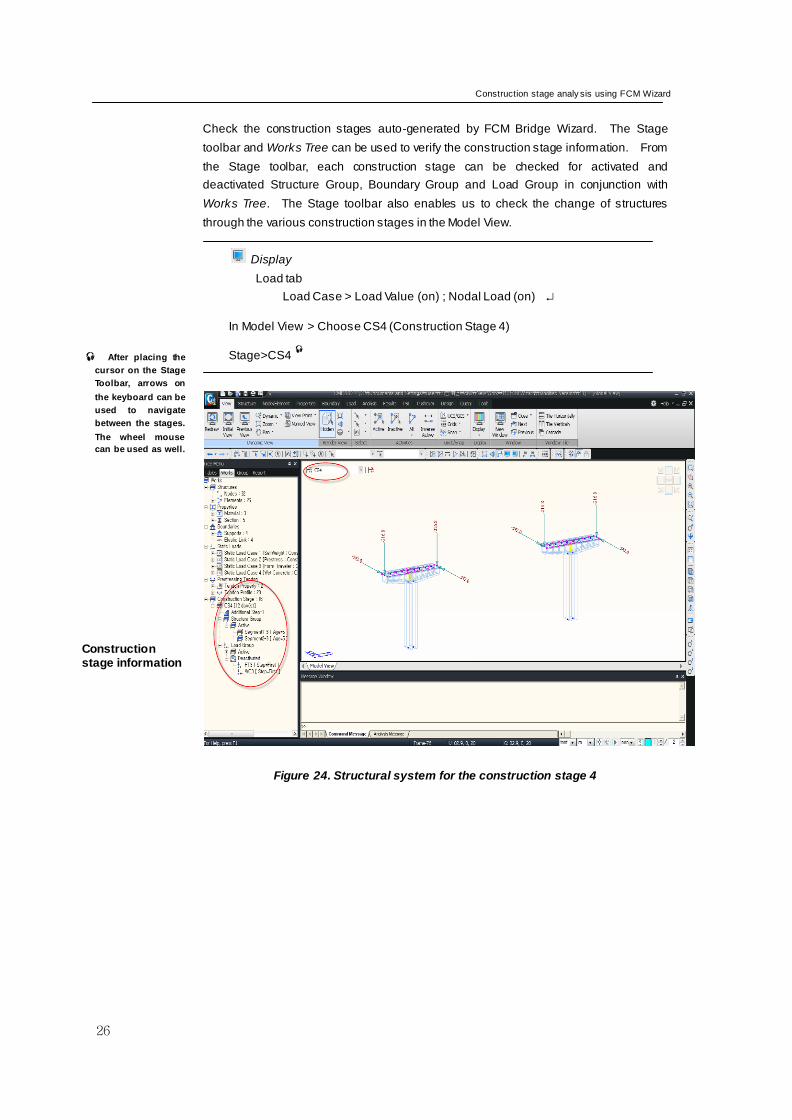
In FCM Wizard, we have specified 12 days for constructing each segment. However,
30 days are required for constructing a Key Segment as per Figure 11. Accordingly,
after activating segment 12, preparation for the construction of Key Segment is 30-
10=20 days (where 10 is the initial age of Key Segment). We then correct the
construction stage duration for segment 12 to 30 days and assign an “Additional Step”
of 20 days for applying the wet concrete weight of the Key Segments (KeyWC1 and
KeyWC3).
Hidden (off)
Stage>Base (In Model View > Choose Base)
Load / Construction Stage / Define Construction Stage
Name>CS13 ;
Stage>Duration ( 30 )
Additional Step > Step Number > 1 ; ; Day ( 20 ) ;
Load tab
Activation
Active Day>20
Group List>Name>KeyWC1, KeyWC3
Figure 25. Corrections to Construction Stage 13 information
Convert to Base
Stage. Construction
stage information can
be changed in Base
Stage only.
Au to-generated Element,
Boundary and Load Groups
by Bridge Wizard is
explained in “Define
Structure (Boundary, Load)
Group” in on-line manual.
Construction stage analy sis using FCM Wizard
28
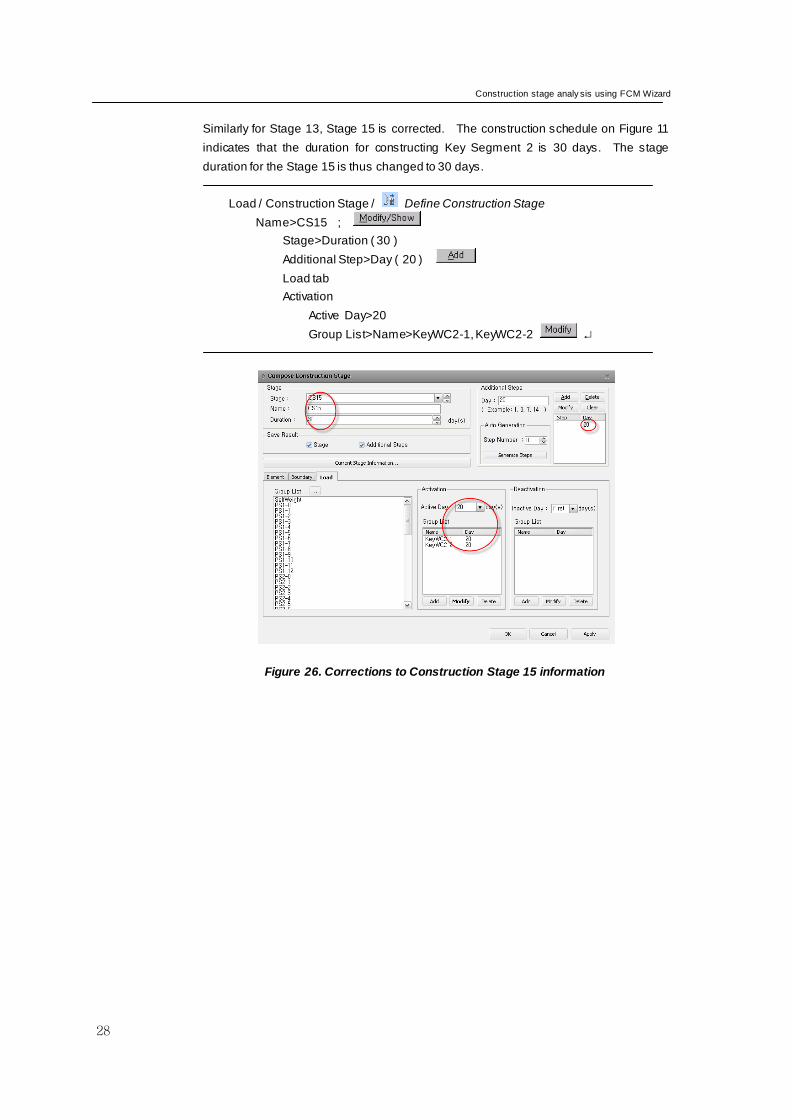
Similarly for Stage 13, Stage 15 is corrected. The construction schedule on Figure 11
indicates that the duration for constructing Key Segment 2 is 30 days. The stage
duration for the Stage 15 is thus changed to 30 days.
Load / Construction Stage / Define Construction Stage
Name>CS15 ;
Stage>Duration ( 30 )
Additional Step>Day ( 20 )
Load tab
Activation
Active Day>20
Group List>Name>KeyWC2-1, KeyWC2-2
Figure 26. Corrections to Construction Stage 15 information
ADVANCED APPLICATIONS
29
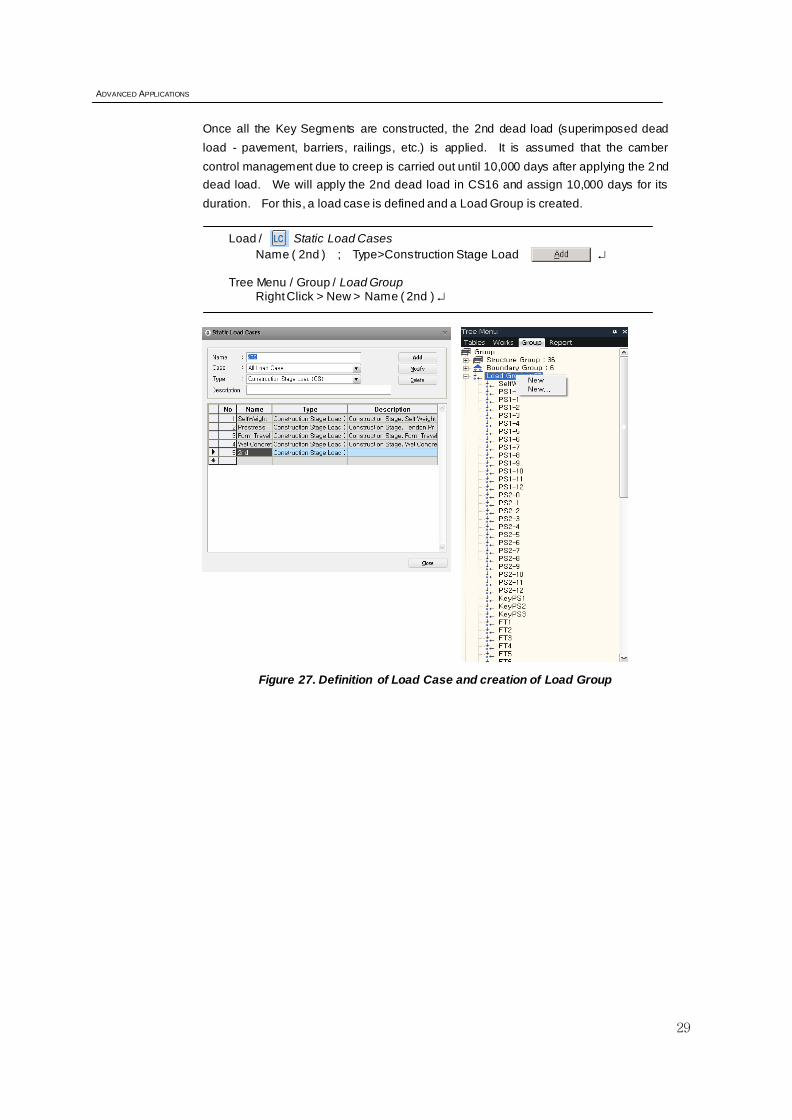
Once all the Key Segments are constructed, the 2nd dead load (superimposed dead
load - pavement, barriers, railings, etc.) is applied. It is assumed that the camber
control management due to creep is carried out until 10,000 days after applying the 2nd
dead load. We will apply the 2nd dead load in CS16 and assign 10,000 days for its
duration. For this, a load case is defined and a Load Group is created.
Load / Static Load Cases
Name ( 2nd ) ; Type>Construction Stage Load
Tree Menu / Group / Load Group Right Click > New > Name ( 2nd )
Figure 27. Definition of Load Case and creation of Load Group
Construction stage analy sis using FCM Wizard
30
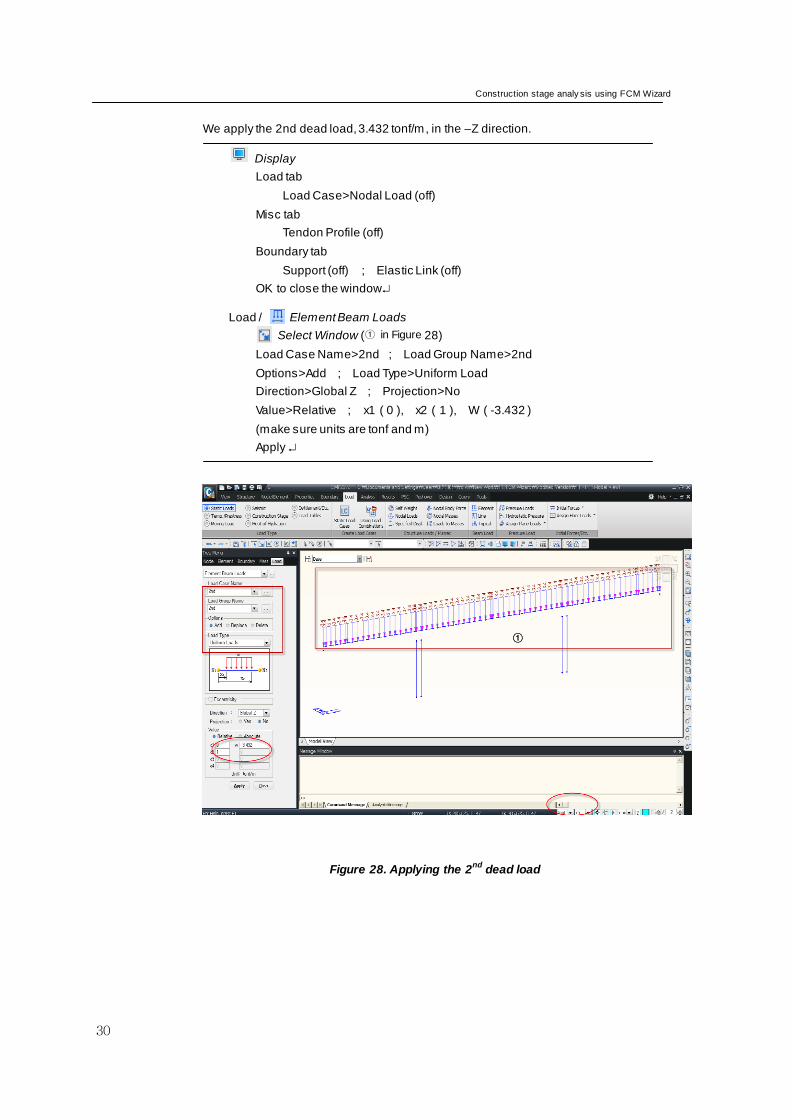
We apply the 2nd dead load, 3.432 tonf/m, in the –Z direction.
Display
Load tab
Load Case>Nodal Load (off)
Misc tab
Tendon Profile (off)
Boundary tab
Support (off) ; Elastic Link (off)
OK to close the window
Load / Element Beam Loads
Select Window (① in Figure 28)
Load Case Name>2nd ; Load Group Name>2nd
Options>Add ; Load Type>Uniform Load
Direction>Global Z ; Projection>No
Value>Relative ; x1 ( 0 ), x2 ( 1 ), W ( -3.432 )
(make sure units are tonf and m)
Apply
Figure 28. Applying the 2nd
dead load
①
ADVANCED APPLICATIONS
31
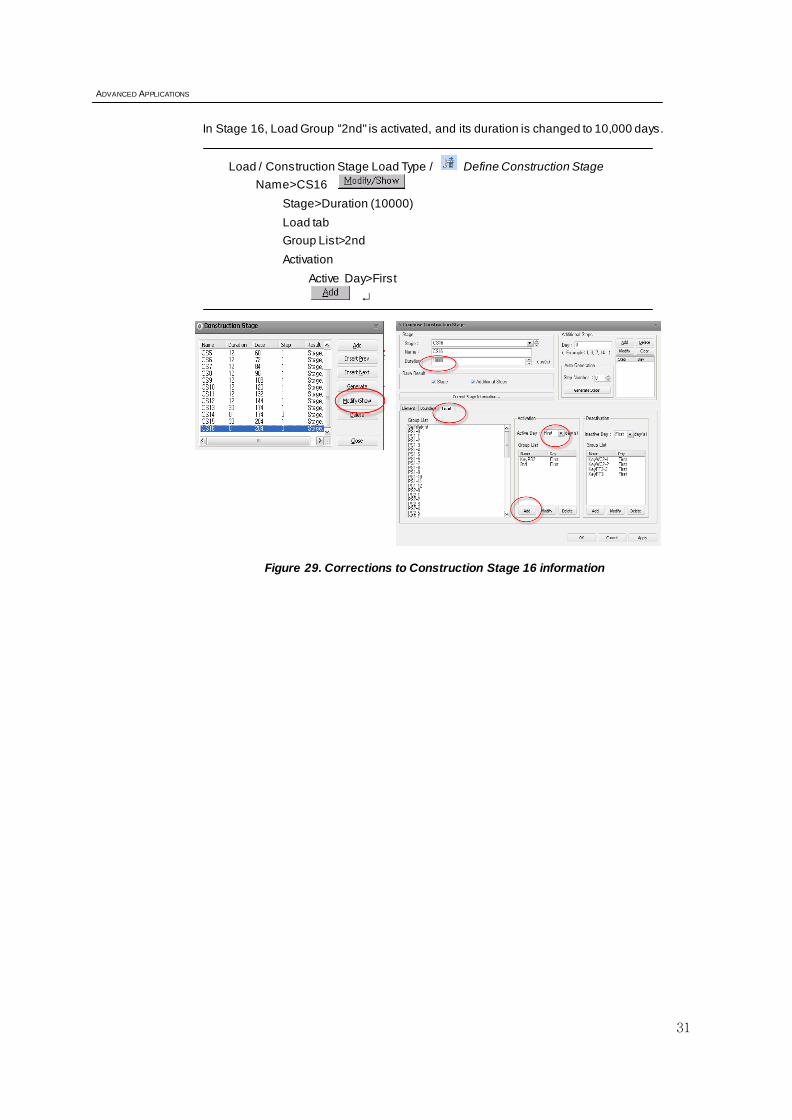
In Stage 16, Load Group “2nd" is activated, and its duration is changed to 10,000 days.
Load / Construction Stage Load Type / Define Construction Stage
Name>CS16
Stage>Duration (10000)
Load tab
Group List>2nd
Activation
Active Day>First
Figure 29. Corrections to Construction Stage 16 information
Construction stage analy sis using FCM Wizard
32
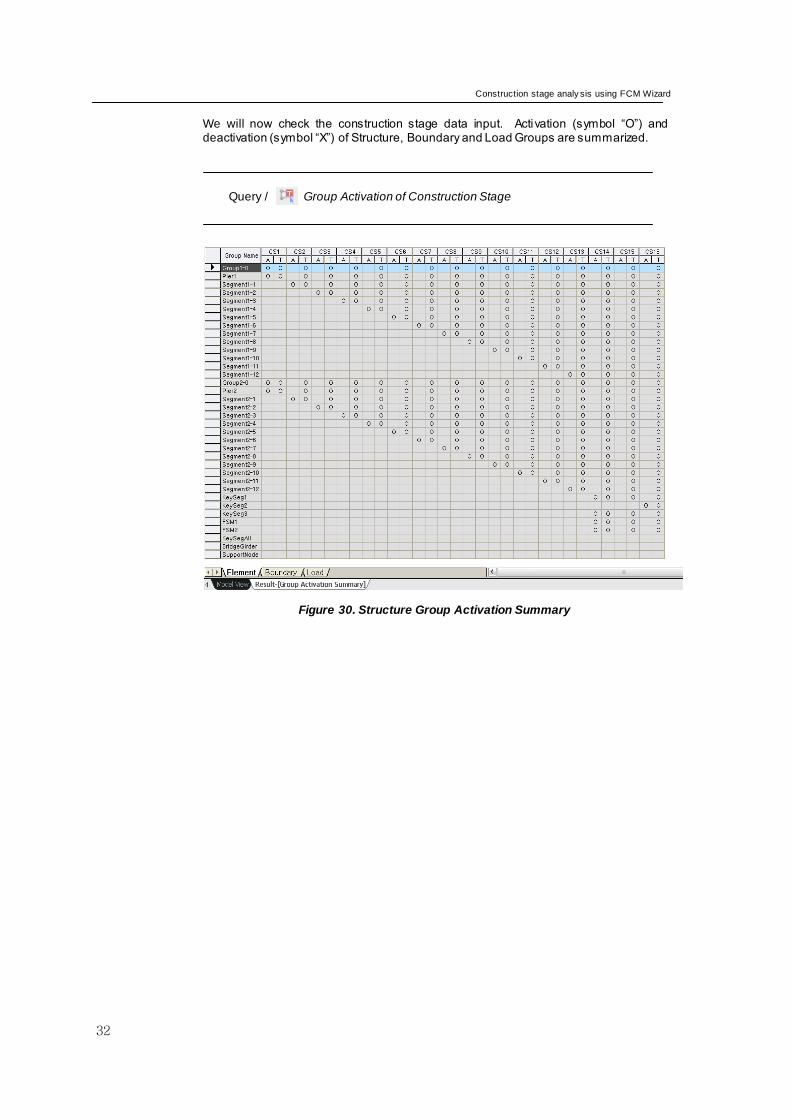
We will now check the construction stage data input. Activation (symbol “O”) and deactivation (symbol “X”) of Structure, Boundary and Load Groups are summarized.
Query / Group Activation of Construction Stage
Figure 30. Structure Group Activation Summary
ADVANCED APPLICATIONS
33
Definition and Link for time dependent material properties
Having completed the modeling of the structure, we now define the time dependent
material properties (compressive strength gain curve, creep and shrinkage coefficients)
and link them to each section.
Based on the CEB-FIP standards, different section dimensions result in different creep
and shrinkage coefficients. That is, each section must be linked to the corresponding
time dependent material properties. MIDAS/Civil automatically calculates time
dependent material properties based on the concrete maturity (age) and apply them to
the corresponding materials. Using Change Element Dependent Material Property,
the time dependent material properties are calculated as per CEB-FIP and
automatically assigned to each corresponding element.
The procedure for applying creep and shrinkage coefficients to the tapered elements by
the Change Element Dependent Material Property function is as follows:
1. Define creep and shrinkage material properties as per CEB-FIP.
2. Link time dependent material properties to (regular) material properties.
3. Using the Change Element Dependent Material Property function, assign
Notational Size of Member (dimensions of elements) to the elements.
When the above procedure is followed, the coefficients defined in the step 1 are not
applied, and rather the creep and coefficients are calculated based on the member
sizes defined in the step 3 and applied to the elements having the Change Element
Dependent Material Property values.
Since the creep
and shrinkage
coefficients are a
function of physical
shapes (Notational
Size of Member), we
will define the time
dependent material
properties after
determining the
variable section
dimensions.
In order to
automatically link
(regular) material
properties and time
dependent material
properties, section
properties must be
defined by DB/User
Type or PSC Type.
Construction stage analy sis using FCM Wizard
34
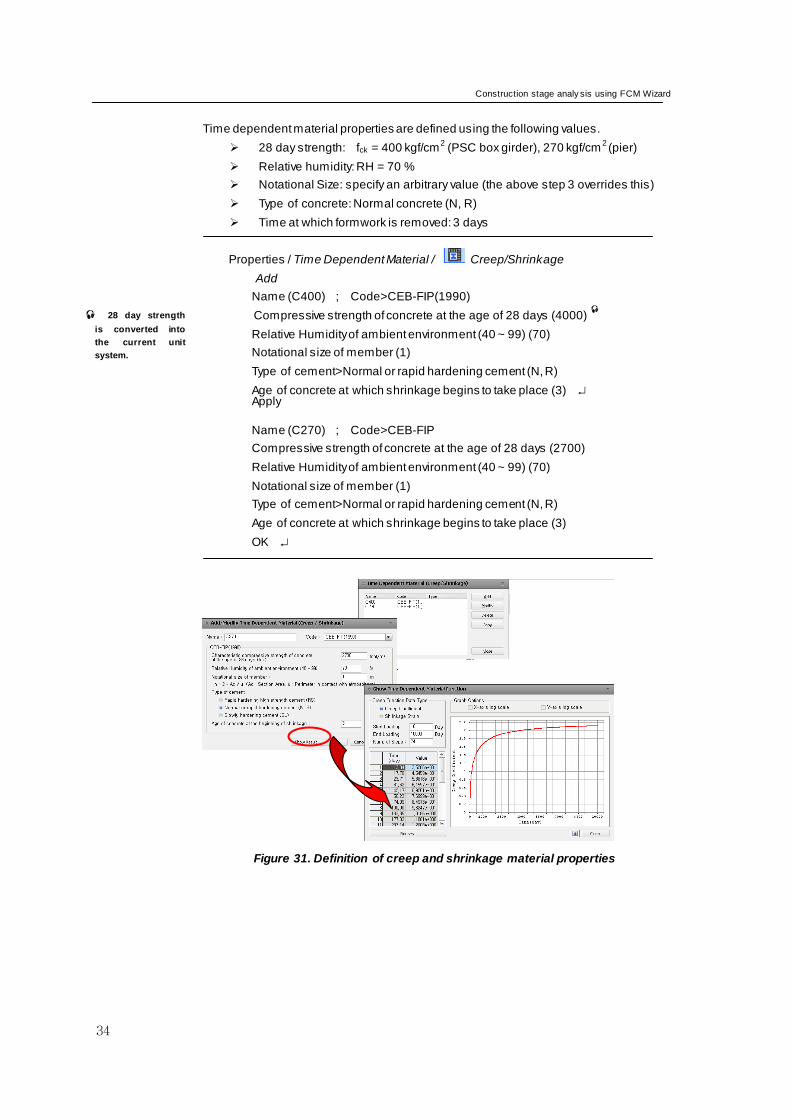
Time dependent material properties are defined using the following values.
28 day strength: fck = 400 kgf/cm2
(PSC box girder), 270 kgf/cm2 (pier)
Relative humidity: RH = 70 %
Notational Size: specify an arbitrary value (the above step 3 overrides this)
Type of concrete: Normal concrete (N, R)
Time at which formwork is removed: 3 days
Properties / Time Dependent Material / Creep/Shrinkage
Add
Name (C400) ; Code>CEB-FIP(1990)
Compressive strength of concrete at the age of 28 days (4000)
Relative Humidity of ambient environment (40 ~ 99) (70)
Notational size of member (1)
Type of cement>Normal or rapid hardening cement (N, R)
Age of concrete at which shrinkage begins to take place (3) Apply
Name (C270) ; Code>CEB-FIP
Compressive strength of concrete at the age of 28 days (2700)
Relative Humidity of ambient environment (40 ~ 99) (70)
Notational size of member (1)
Type of cement>Normal or rapid hardening cement (N, R)
Age of concrete at which shrinkage begins to take place (3)
OK
Figure 31. Definition of creep and shrinkage material properties
28 day strength
is converted into
the current unit
system.
ADVANCED APPLICATIONS
35
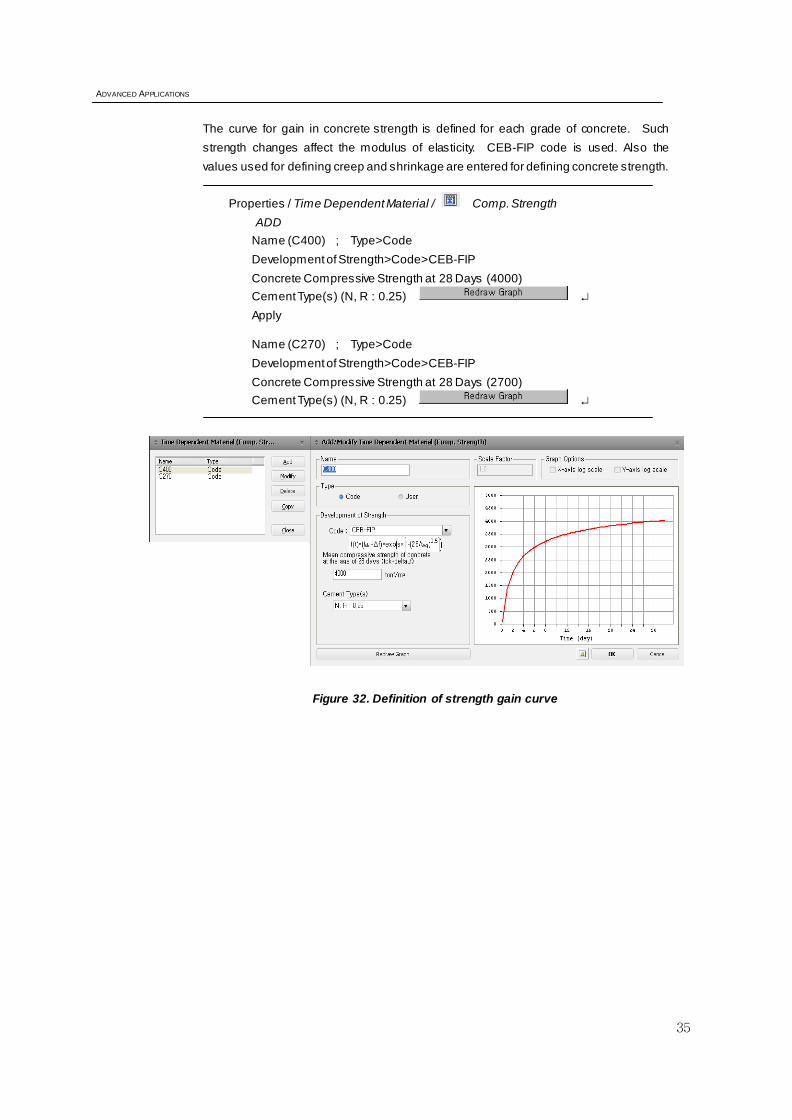
The curve for gain in concrete strength is defined for each grade of concrete. Such
strength changes affect the modulus of elasticity. CEB-FIP code is used. Also the
values used for defining creep and shrinkage are entered for defining concrete strength.
Properties / Time Dependent Material / Comp. Strength
ADD
Name (C400) ; Type>Code
Development of Strength>Code>CEB-FIP
Concrete Compressive Strength at 28 Days (4000)
Cement Type(s) (N, R : 0.25)
Apply
Name (C270) ; Type>Code
Development of Strength>Code>CEB-FIP
Concrete Compressive Strength at 28 Days (2700)
Cement Type(s) (N, R : 0.25)
Figure 32. Definition of strength gain curve
Construction stage analy sis using FCM Wizard
36
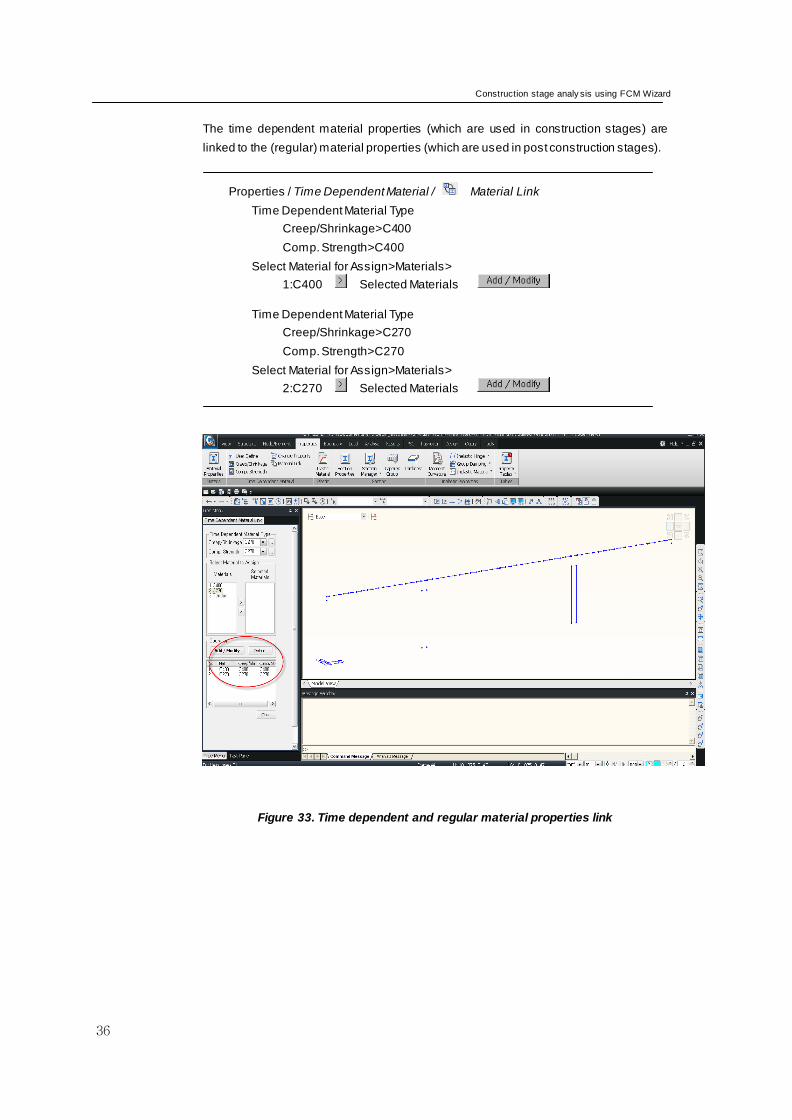
The time dependent material properties (which are used in construction stages) are
linked to the (regular) material properties (which are used in post construction stages).
Properties / Time Dependent Material / Material Link
Time Dependent Material Type
Creep/Shrinkage>C400
Comp. Strength>C400
Select Material for Assign>Materials>
1:C400 Selected Materials
Time Dependent Material Type
Creep/Shrinkage>C270
Comp. Strength>C270
Select Material for Assign>Materials>
2:C270 Selected Materials
Figure 33. Time dependent and regular material properties link
ADVANCED APPLICATIONS
37
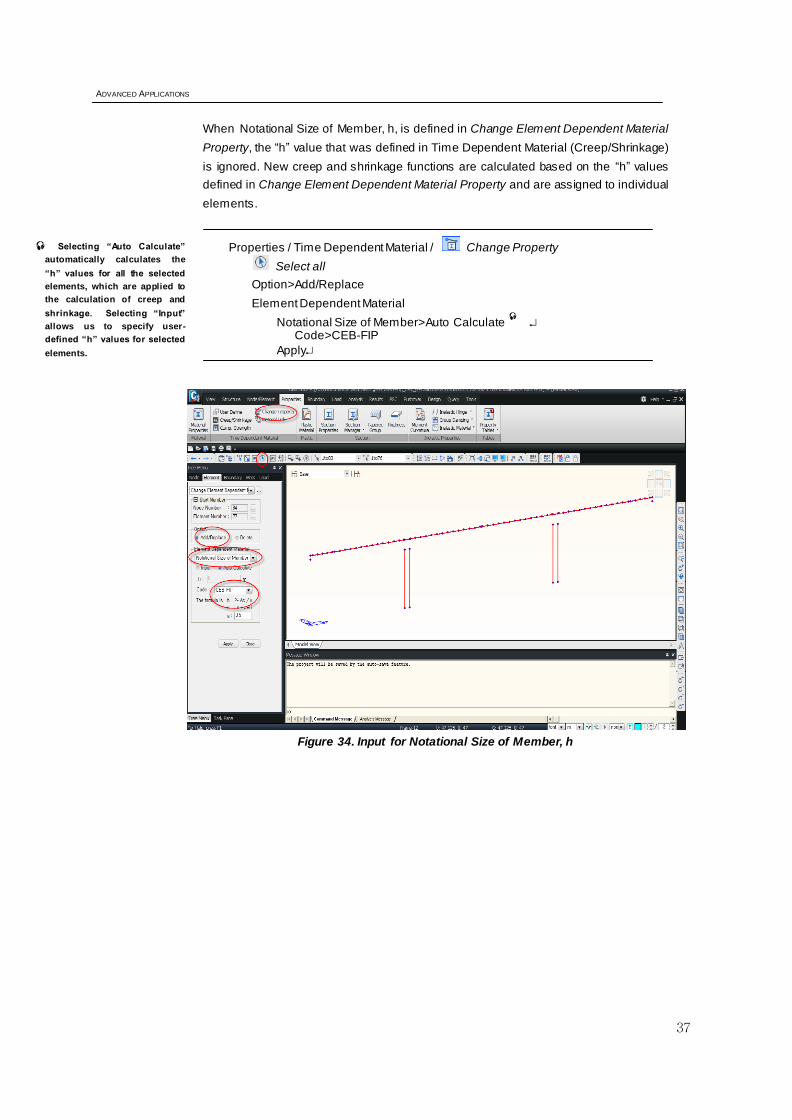
When Notational Size of Member, h, is defined in Change Element Dependent Material
Property, the “h” value that was defined in Time Dependent Material (Creep/Shrinkage)
is ignored. New creep and shrinkage functions are calculated based on the “h” values
defined in Change Element Dependent Material Property and are assigned to individual
elements.
Properties / Time Dependent Material / Change Property
Select all
Option>Add/Replace
Element Dependent Material
Notational Size of Member>Auto Calculate
Code>CEB-FIP
Apply
Figure 34. Input for Notational Size of Member, h
Selecting “Auto Calculate”
automatically calculates the
“h” values for all the selected
elements, which are applied to
the calculation of creep and
shrinkage. Selecting “Input”
allows us to specify user-
defined “h” values for selected
elements.
Construction stage analy sis using FCM Wizard
38
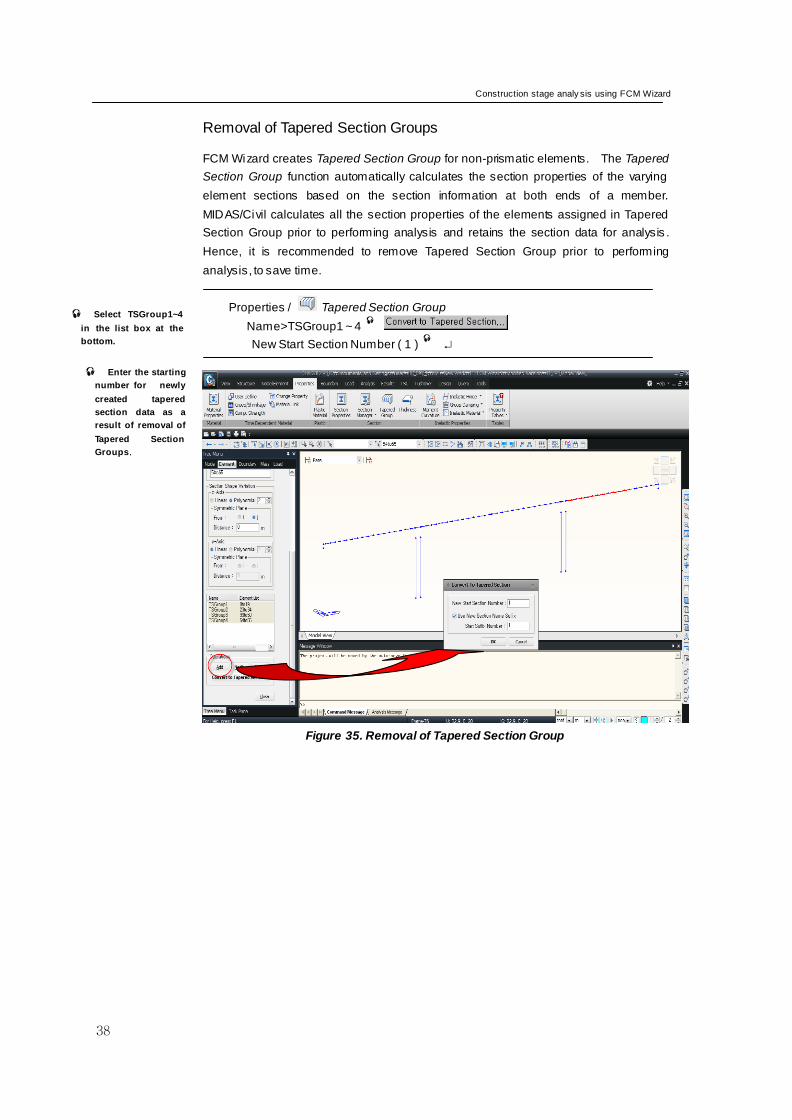
Removal of Tapered Section Groups
FCM Wizard creates Tapered Section Group for non-prismatic elements. The Tapered
Section Group function automatically calculates the section properties of the varying
element sections based on the section information at both ends of a member.
MIDAS/Civil calculates all the section properties of the elements assigned in Tapered
Section Group prior to performing analysis and retains the section data for analysis .
Hence, it is recommended to remove Tapered Section Group prior to performing
analysis, to save time.
Properties / Tapered Section Group
Name>TSGroup1 ~ 4
New Start Section Number ( 1 )
Figure 35. Removal of Tapered Section Group
Enter the starting
number for newly
created tapered
section data as a
result of removal of
Tapered Section
Groups.
Select TSGroup1~4
in the list box at the
bottom.
ADVANCED APPLICATIONS
39
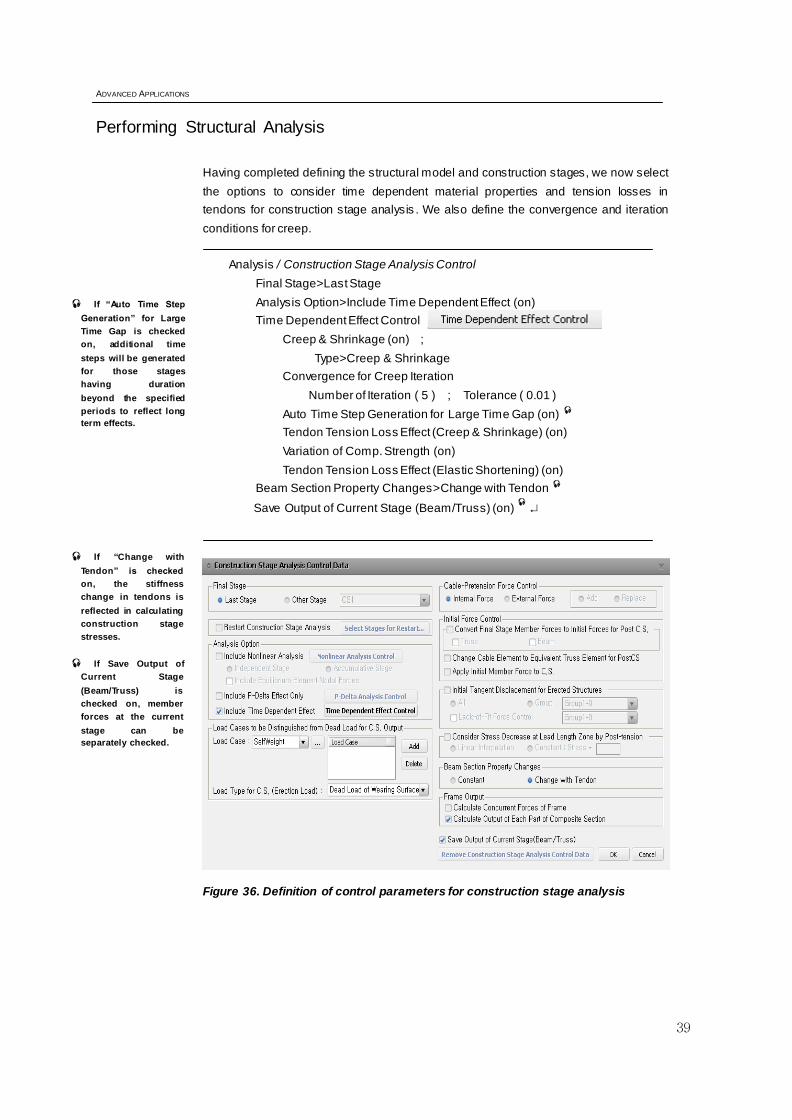
Performing Structural Analysis
Having completed defining the structural model and construction stages, we now select
the options to consider time dependent material properties and tension losses in
tendons for construction stage analysis . We also define the convergence and iteration
conditions for creep.
Analysis / Construction Stage Analysis Control
Final Stage>Last Stage
Analysis Option>Include Time Dependent Effect (on)
Time Dependent Effect Control
Creep & Shrinkage (on) ;
Type>Creep & Shrinkage
Convergence for Creep Iteration
Number of Iteration ( 5 ) ; Tolerance ( 0.01 )
Auto Time Step Generation for Large Time Gap (on)
Tendon Tension Loss Effect (Creep & Shrinkage) (on)
Variation of Comp. Strength (on)
Tendon Tension Loss Effect (Elastic Shortening) (on)
Beam Section Property Changes>Change with Tendon
Save Output of Current Stage (Beam/Truss) (on)
Figure 36. Definition of control parameters for construction stage analysis
If “Auto Time Step
Generation” for Large
Time Gap is checked
on, additional time
steps will be generated
for those stages
having duration
beyond the specified
periods to reflect long
term effects.
If “Change with
Tendon” is checked
on, the stiffness
change in tendons is
reflected in calculating
construction stage
stresses.
If Save Output of
Current Stage
(Beam/Truss) is
checked on, member
forces at the current
stage can be
separately checked.

Construction stage analy sis using FCM Wizard
40
When construction stage analysis is carried out, construction stage load cases are
automatically generated. The loadings that are applied in construction stages are
predominantly due to self-weight. Hence, the program generates all the loads lumped
into “CS: Dead”, except for creep, shrinkage and tendon loads. If there is a specific
load case which needs to be separated from the “CS: Dead”, such a load case is
selected and assigned to “Load Cases to be Distinguished from Dead Load for CS
Output”, which is then classified as CS: Erection. For example, this function may be
applied when we need to separately check the effects of form traveler loads from the
total stage analysis results.
Up to this point we have completed all the input for the structural model and
construction stages. We will now perform analysis.
Analysis / Perform Analysis
ADVANCED APPLICATIONS
41
Checking Analysis Results
Construction stage analysis results can be checked in two ways. Stresses and
displacements accumulated up to a specific construction stage for all the members can
be checked
, or the change in stresses and displacements of a specific element can
be checked with the progress of each construction stage
. MIDAS/Civil generates
graphs and tables to check both results.
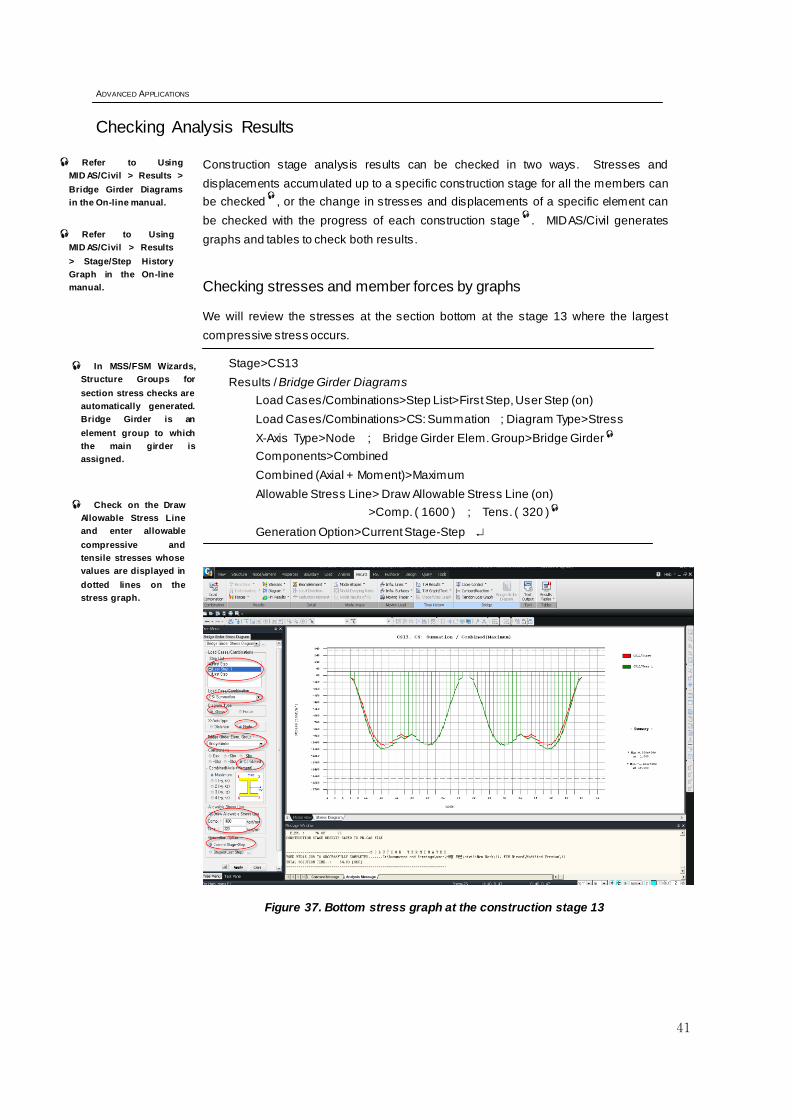
Checking stresses and member forces by graphs
We will review the stresses at the section bottom at the stage 13 where the largest
compressive stress occurs.
Stage>CS13
Results / Bridge Girder Diagrams
Load Cases/Combinations>Step List>First Step, User Step (on)
Load Cases/Combinations>CS: Summation ; Diagram Type>Stress
X-Axis Type>Node ; Bridge Girder Elem. Group>Bridge Girder
Components>Combined
Combined (Axial + Moment)>Maximum
Allowable Stress Line> Draw Allowable Stress Line (on)
>Comp. ( 1600 ) ; Tens. ( 320 )
Generation Option>Current Stage-Step
Figure 37. Bottom stress graph at the construction stage 13
Refer to Using
MID AS/Civil > Results >
Bridge Girder Diagrams
in the On-line manual.
Refer to Using
MID AS/Civil > Results
> Stage/Step History
Graph in the On-line
manual.
Check on the Draw
Allowable Stress Line
and enter allowable
compressive and
tensile stresses whose
values are displayed in
dotted lines on the
stress graph.
In MSS/FSM Wizards,
Structure Groups for
section stress checks are
automatically generated.
Bridge Girder is an
element group to which
the main girder is
assigned.
Construction stage analy sis using FCM Wizard
42
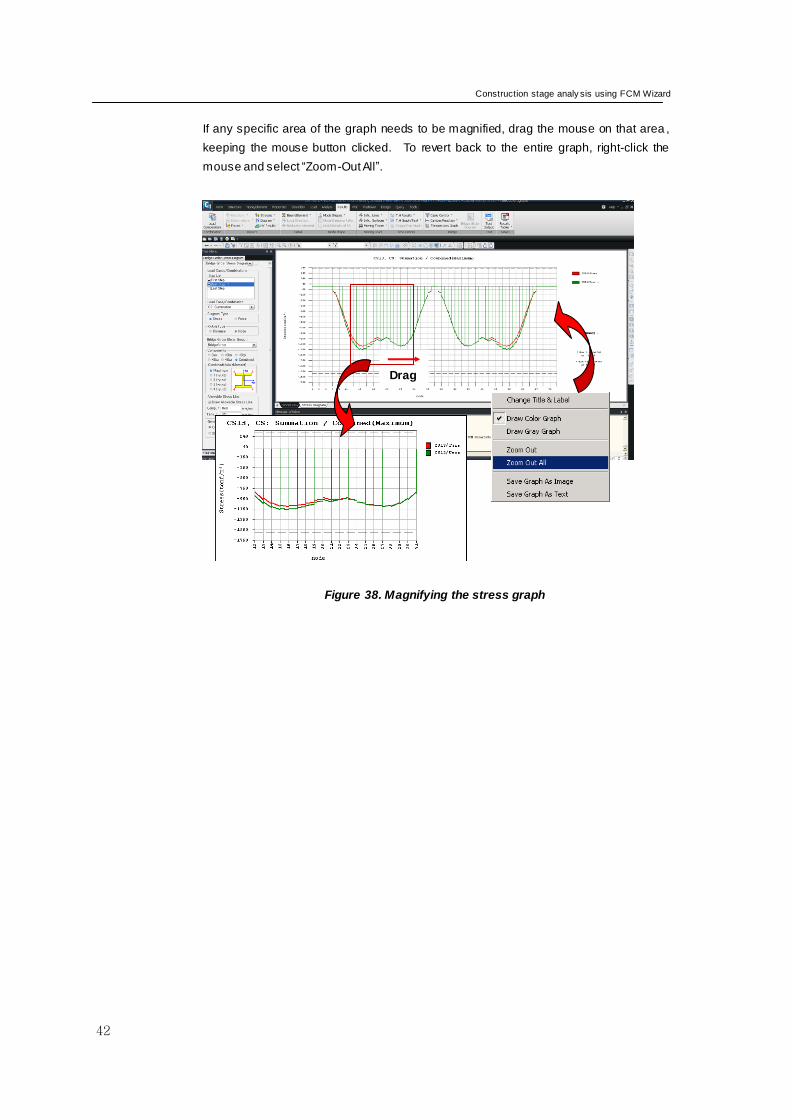
If any specific area of the graph needs to be magnified, drag the mouse on that area ,
keeping the mouse button clicked. To revert back to the entire graph, right-click the
mouse and select “Zoom-Out All”.
Figure 38. Magnifying the stress graph
Drag
ADVANCED APPLICATIONS
43
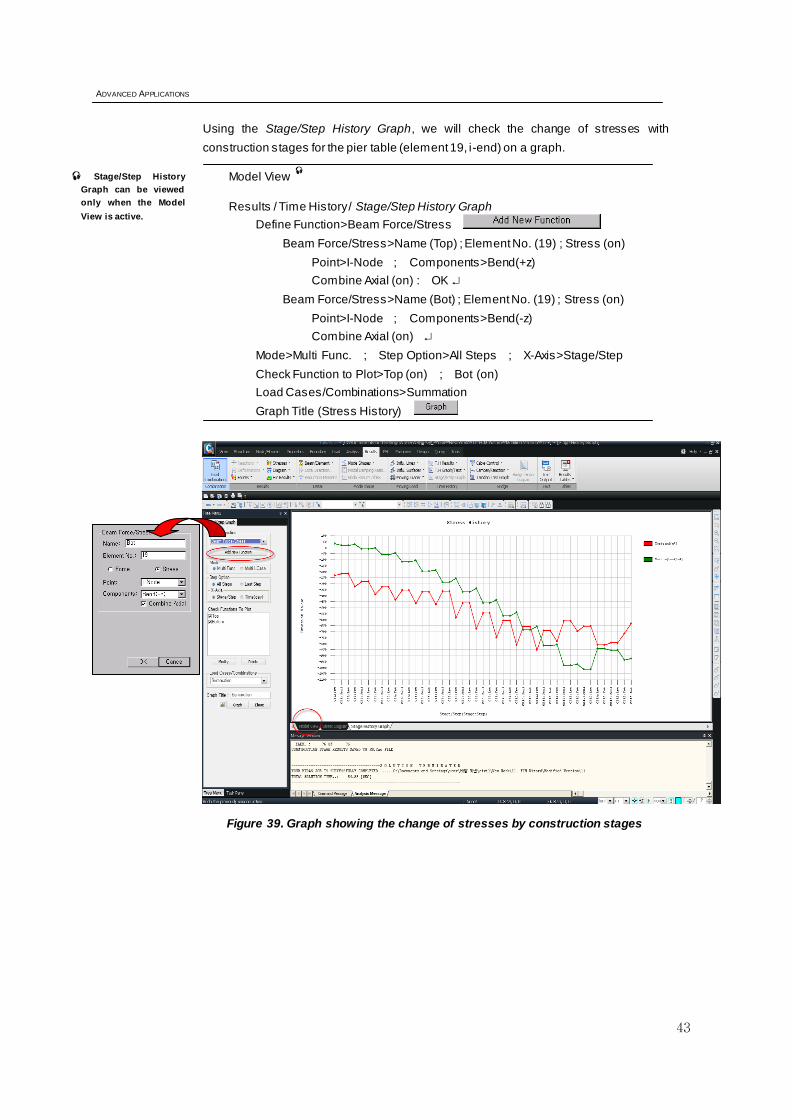
Using the Stage/Step History Graph, we will check the change of stresses with
construction stages for the pier table (element 19, i-end) on a graph.
Model View
Results / Time History / Stage/Step History Graph
Define Function>Beam Force/Stress
Beam Force/Stress>Name (Top) ; Element No. (19) ; Stress (on)
Point>I-Node ; Components>Bend(+z)
Combine Axial (on) : OK
Beam Force/Stress>Name (Bot) ; Element No. (19) ; Stress (on)
Point>I-Node ; Components>Bend(-z)
Combine Axial (on)
Mode>Multi Func. ; Step Option>All Steps ; X-Axis>Stage/Step
Check Function to Plot>Top (on) ; Bot (on)
Load Cases/Combinations>Summation
Graph Title (Stress History)
Figure 39. Graph showing the change of stresses by construction stages
Stage/Step History
Graph can be viewed
only when the Model
View is active.
Construction stage analy sis using FCM Wizard
44
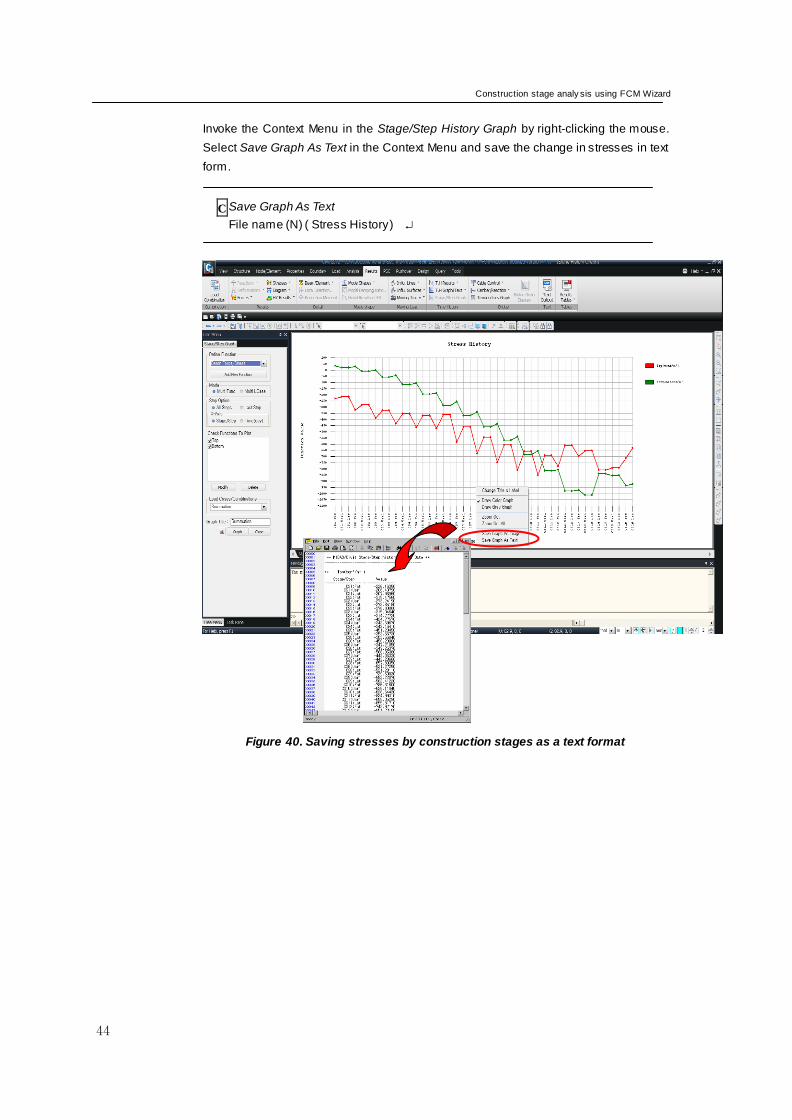
Invoke the Context Menu in the Stage/Step History Graph by right-clicking the mouse.
Select Save Graph As Text in the Context Menu and save the change in stresses in text
form.
Save Graph As Text
File name (N) ( Stress History )
Figure 40. Saving stresses by construction stages as a text format
C
ADVANCED APPLICATIONS
45
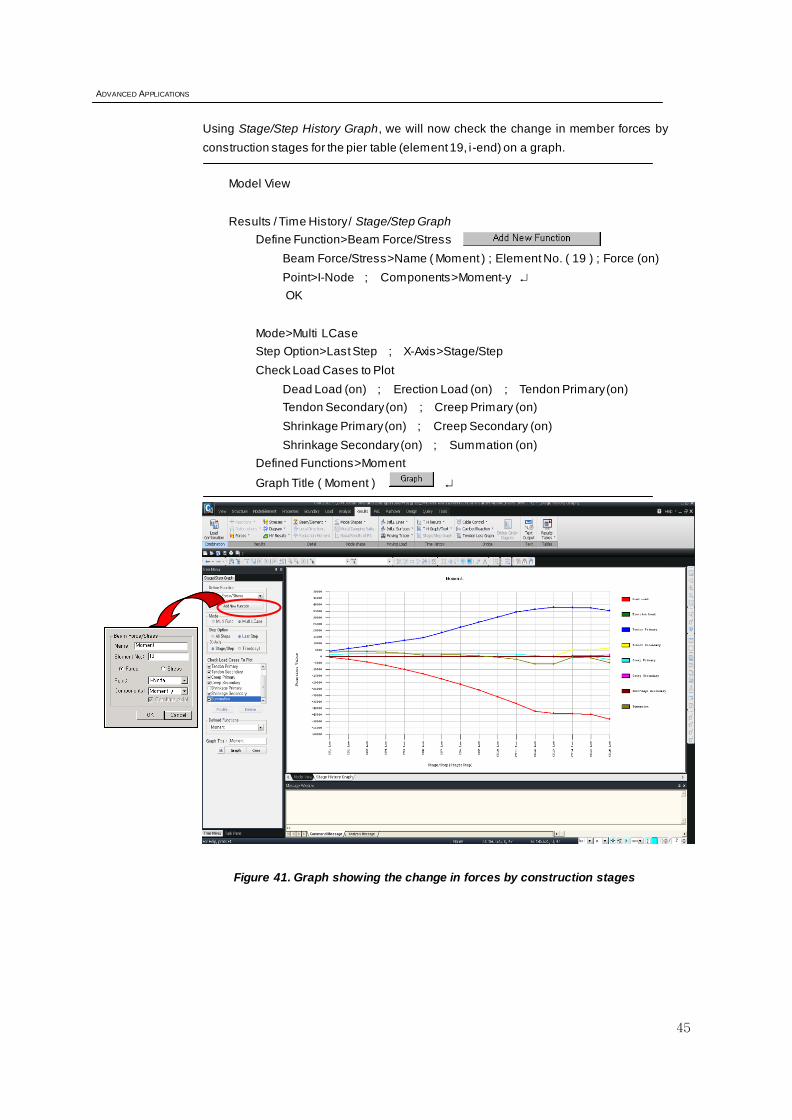
Using Stage/Step History Graph, we will now check the change in member forces by
construction stages for the pier table (element 19, i-end) on a graph.
Model View
Results / Time History / Stage/Step Graph
Define Function>Beam Force/Stress
Beam Force/Stress>Name ( Moment ) ; Element No. ( 19 ) ; Force (on)
Point>I-Node ; Components>Moment-y
OK
Mode>Multi LCase
Step Option>Last Step ; X-Axis>Stage/Step
Check Load Cases to Plot
Dead Load (on) ; Erection Load (on) ; Tendon Primary (on)
Tendon Secondary (on) ; Creep Primary (on)
Shrinkage Primary (on) ; Creep Secondary (on)
Shrinkage Secondary (on) ; Summation (on)
Defined Functions>Moment
Graph Title ( Moment )
Figure 41. Graph showing the change in forces by construction stages
Construction stage analy sis using FCM Wizard
46
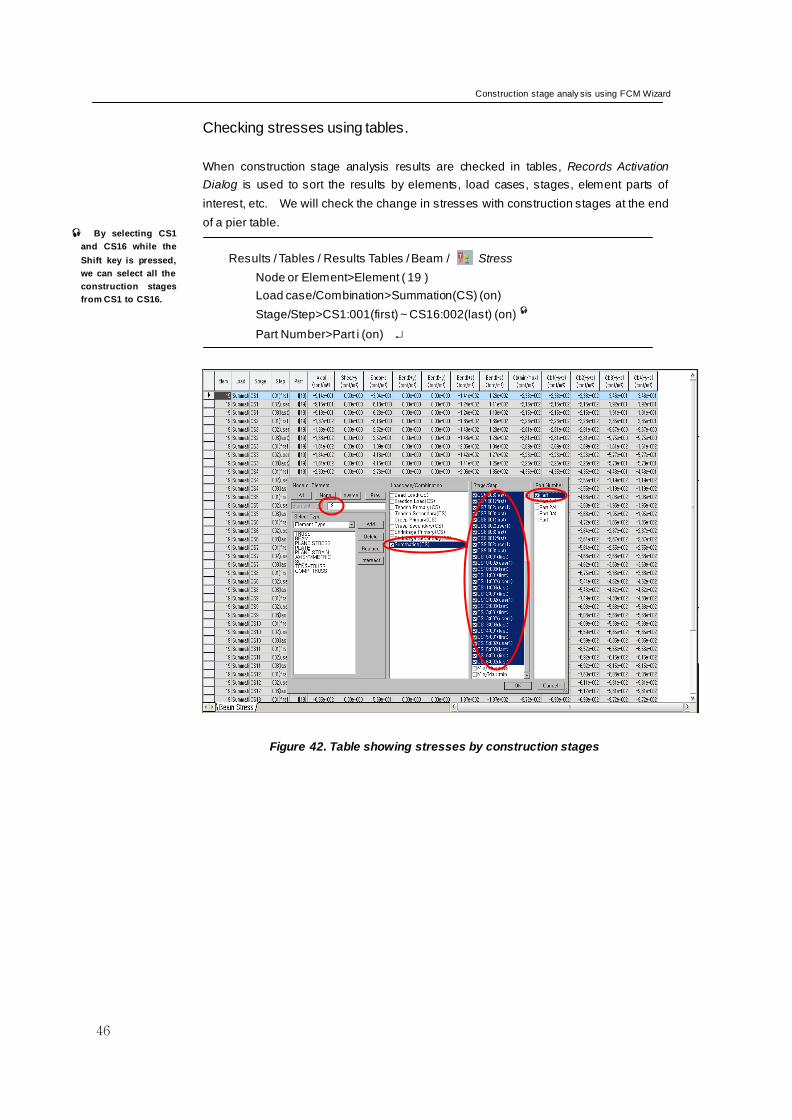
Checking stresses using tables.
When construction stage analysis results are checked in tables, Records Activation
Dialog is used to sort the results by elements, load cases, stages, element parts of
interest, etc. We will check the change in stresses with construction stages at the end
of a pier table.
Results / Tables / Results Tables / Beam / Stress
Node or Element>Element ( 19 )
Load case/Combination>Summation(CS) (on)
Stage/Step>CS1:001(first) ~ CS16:002(last) (on)
Part Number>Part i (on)
Figure 42. Table showing stresses by construction stages
By selecting CS1
and CS16 while the
Shift key is pressed,
we can select all the
construction stages
from CS1 to CS16.
ADVANCED APPLICATIONS
47
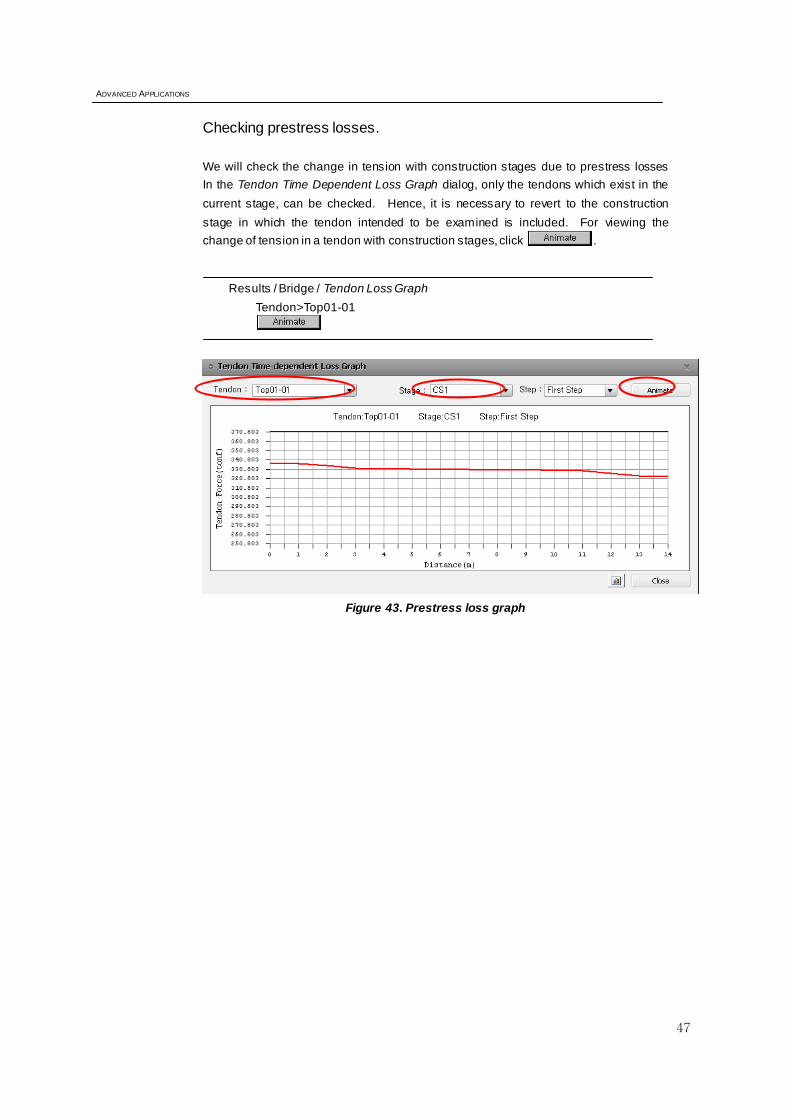
Checking prestress losses.
We will check the change in tension with construction stages due to prestress losses
In the Tendon Time Dependent Loss Graph dialog, only the tendons which exist in the
current stage, can be checked. Hence, it is necessary to revert to the construction
stage in which the tendon intended to be examined is included. For viewing the
change of tension in a tendon with construction stages, click .
Results / Bridge / Tendon Loss Graph
Tendon>Top01-01
Figure 43. Prestress loss graph
Construction stage analy sis using FCM Wizard
48
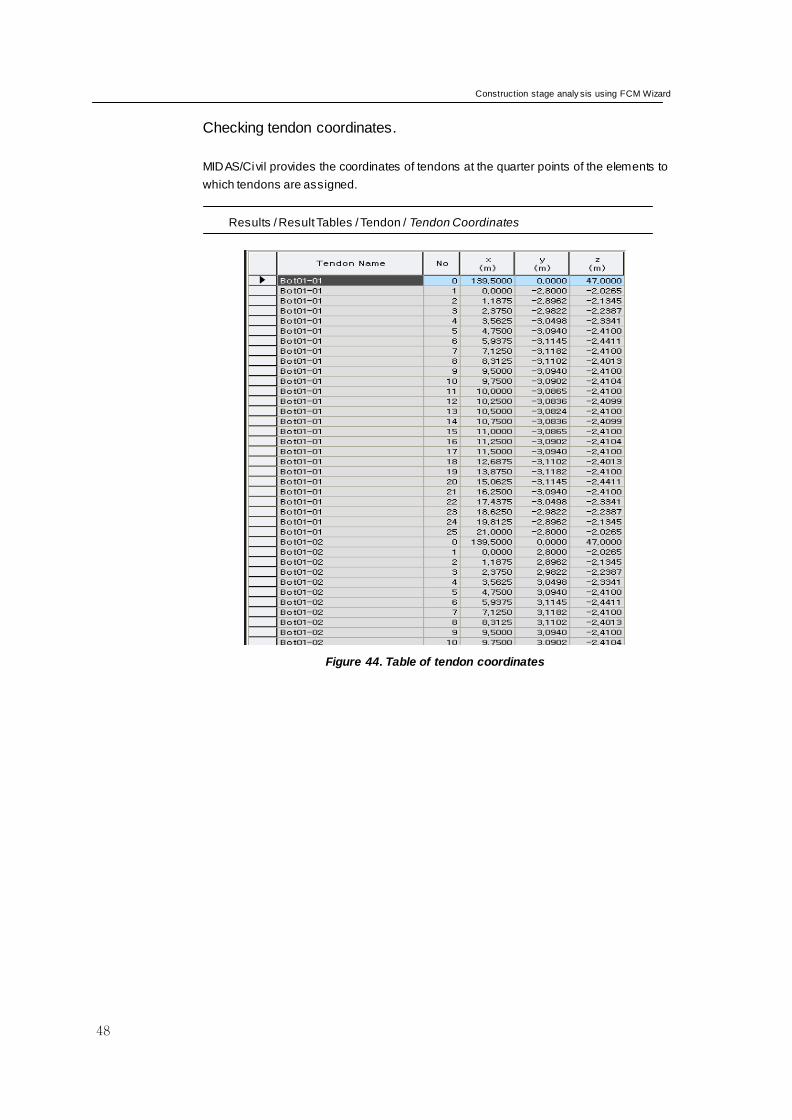
Checking tendon coordinates.
MIDAS/Civil provides the coordinates of tendons at the quarter points of the elements to
which tendons are assigned.
Results / Result Tables / Tendon / Tendon Coordinates
Figure 44. Table of tendon coordinates
ADVANCED APPLICATIONS
49
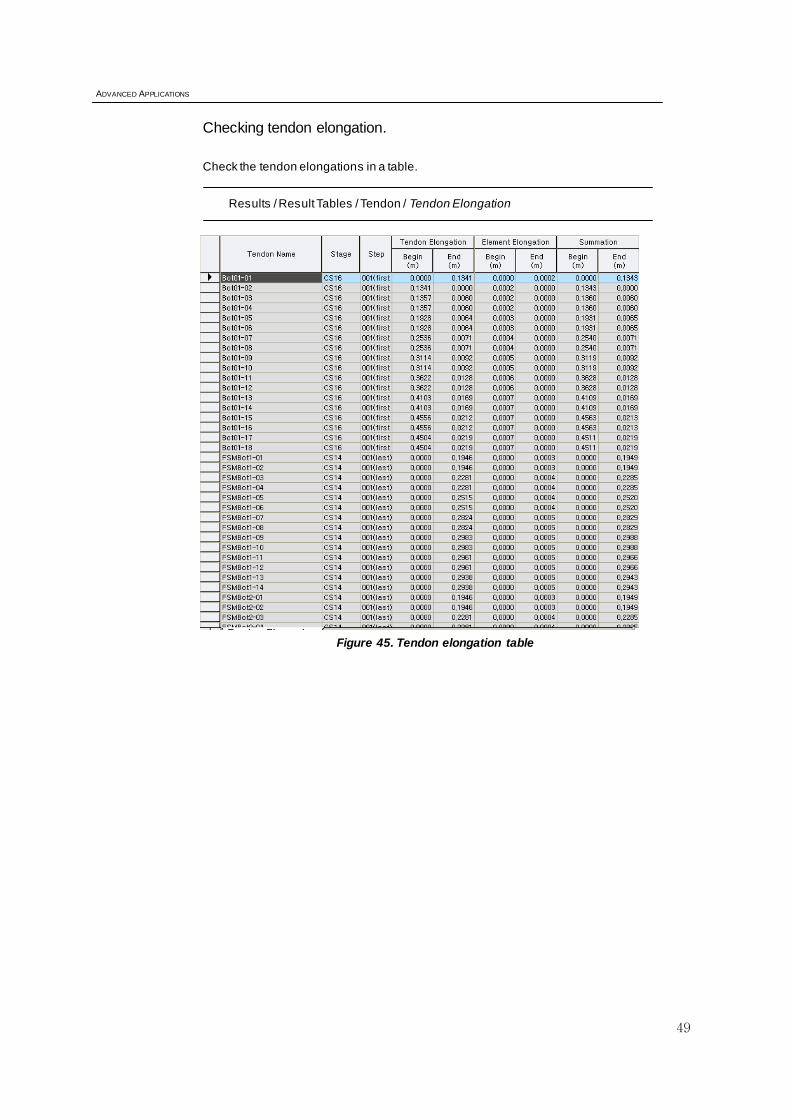
Checking tendon elongation.
Check the tendon elongations in a table.
Results / Result Tables / Tendon / Tendon Elongation
Figure 45. Tendon elongation table
Construction stage analy sis using FCM Wizard
50
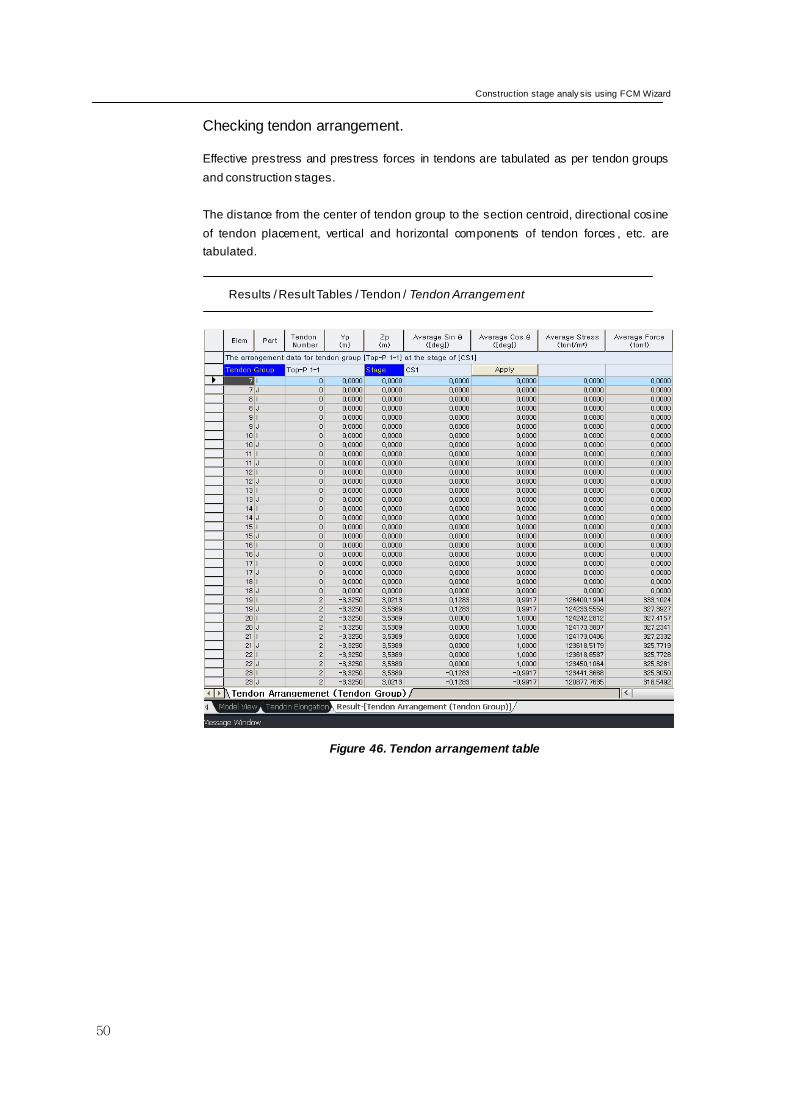
Checking tendon arrangement.
Effective prestress and prestress forces in tendons are tabulated as per tendon groups
and construction stages.
The distance from the center of tendon group to the section centroid, directional cosine
of tendon placement, vertical and horizontal components of tendon forces , etc. are
tabulated.
Results / Result Tables / Tendon / Tendon Arrangement
Figure 46. Tendon arrangement table
ADVANCED APPLICATIONS
51
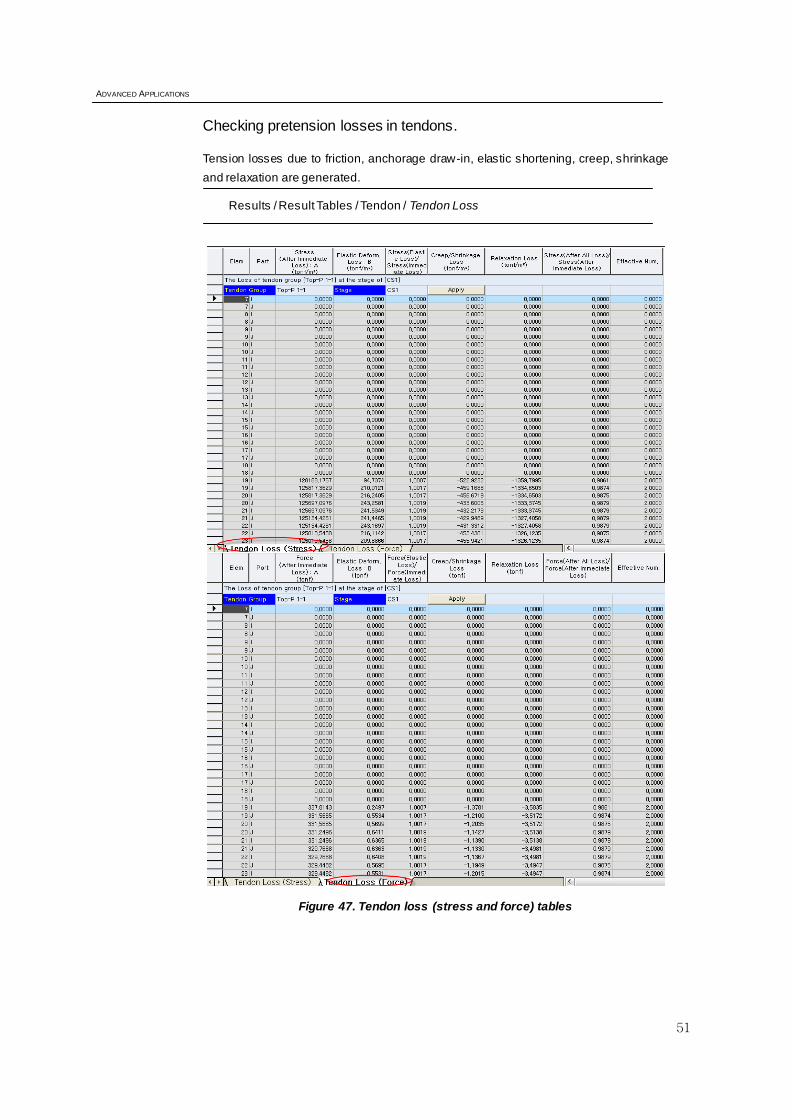
Checking pretension losses in tendons.
Tension losses due to friction, anchorage draw-in, elastic shortening, creep, shrinkage
and relaxation are generated.
Results / Result Tables / Tendon / Tendon Loss
Figure 47. Tendon loss (stress and force) tables
Construction stage analy sis using FCM Wizard
52
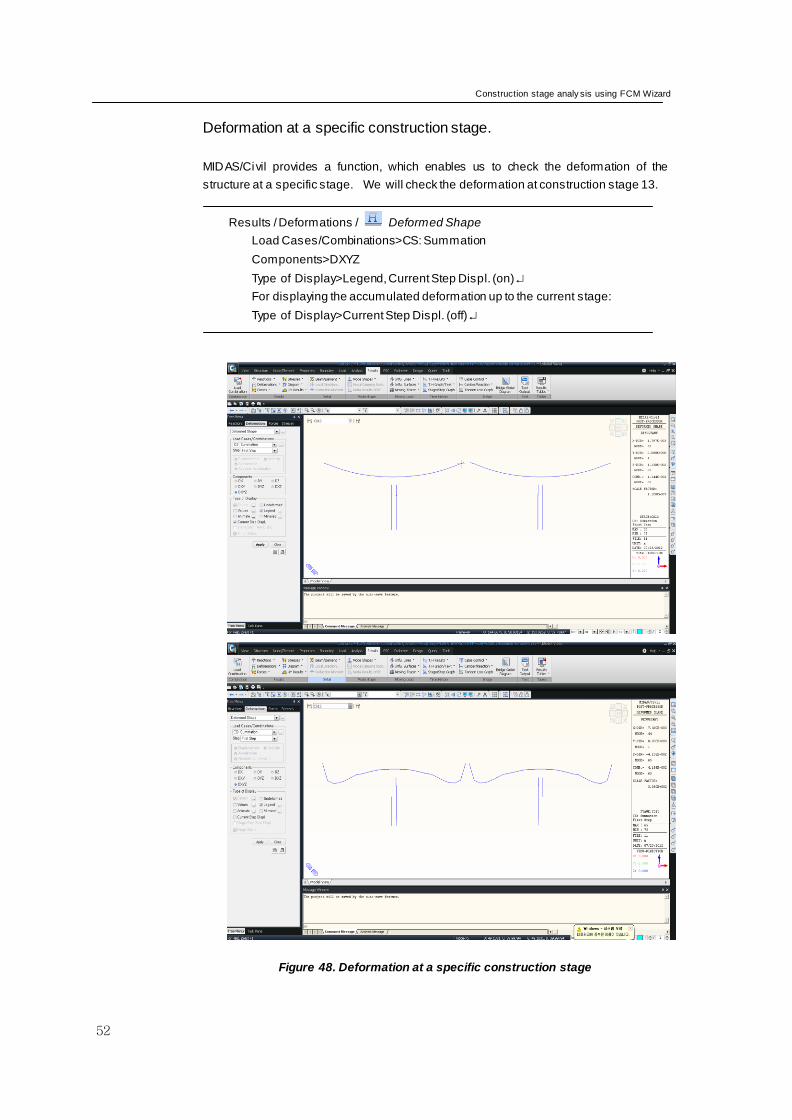
Deformation at a specific construction stage.
MIDAS/Civil provides a function, which enables us to check the deformation of the
structure at a specific stage. We will check the deformation at construction stage 13.
Results / Deformations / Deformed Shape
Load Cases/Combinations>CS: Summation
Components>DXYZ
Type of Display>Legend, Current Step Displ. (on)
For displaying the accumulated deformation up to the current stage:
Type of Display>Current Step Displ. (off)
Figure 48. Deformation at a specific construction stage
ADVANCED APPLICATIONS
53
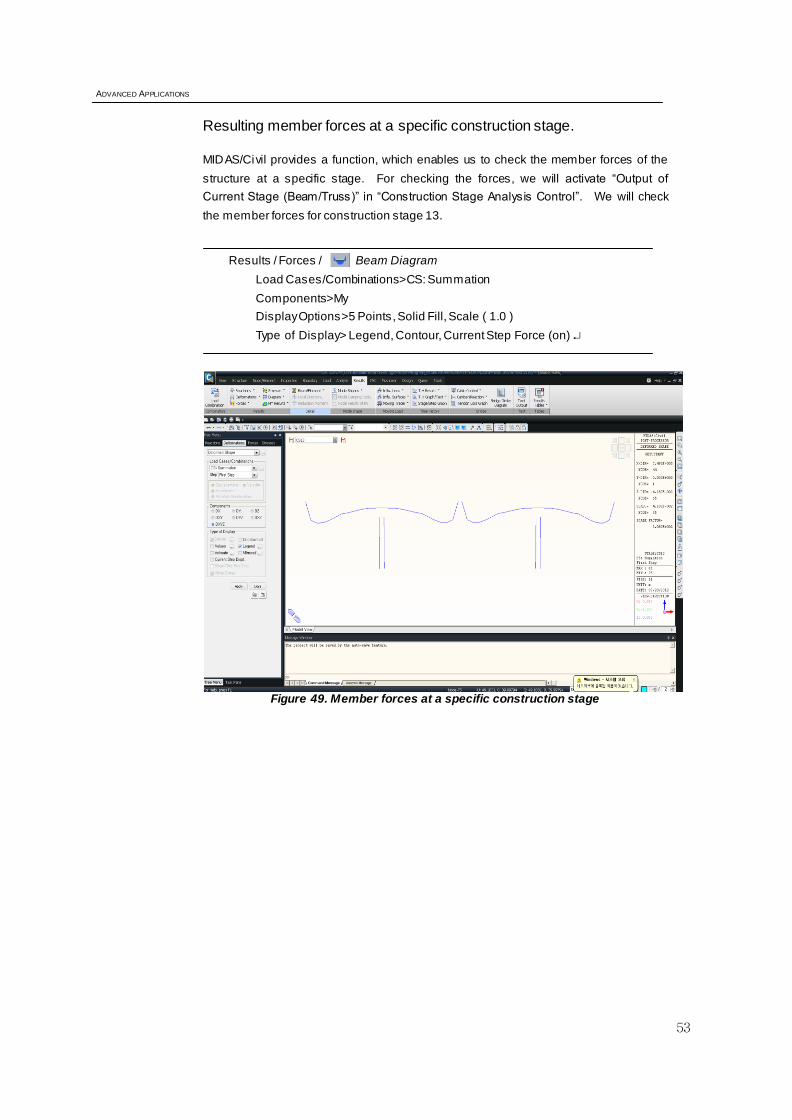
Resulting member forces at a specific construction stage.
MIDAS/Civil provides a function, which enables us to check the member forces of the
structure at a specific stage. For checking the forces, we will activate “Output of
Current Stage (Beam/Truss)” in “Construction Stage Analysis Control”. We will check
the member forces for construction stage 13.
Results / Forces / Beam Diagram
Load Cases/Combinations>CS: Summation
Components>My
Display Options>5 Points, Solid Fill, Scale ( 1.0 )
Type of Display> Legend, Contour, Current Step Force (on)
Figure 49. Member forces at a specific construction stage
Construction stage analy sis using FCM Wizard
54
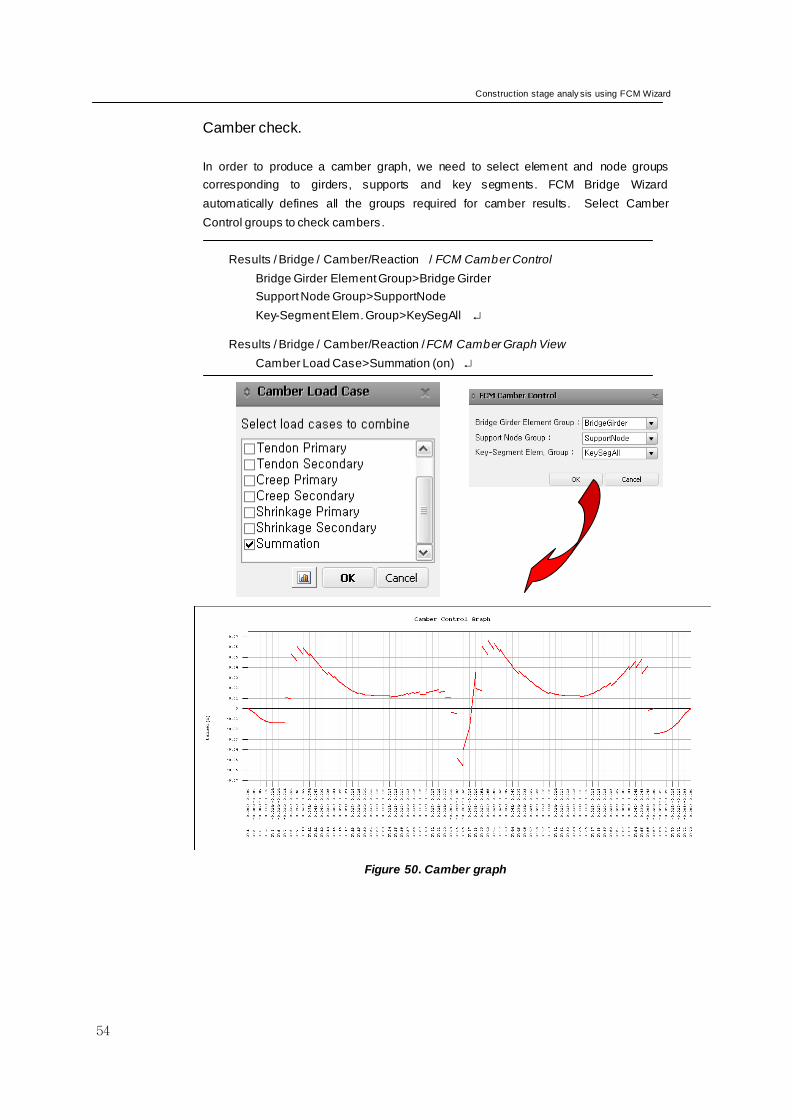
Camber check.
In order to produce a camber graph, we need to select element and node groups
corresponding to girders, supports and key segments. FCM Bridge Wizard
automatically defines all the groups required for camber results. Select Camber
Control groups to check cambers .
Results / Bridge / Camber/Reaction / FCM Camber Control
Bridge Girder Element Group>Bridge Girder
Support Node Group>SupportNode
Key-Segment Elem. Group>KeySegAll
Results / Bridge / Camber/Reaction / FCM Camber Graph View
Camber Load Case>Summation (on)
Figure 50. Camber graph
ADVANCED APPLICATIONS
55
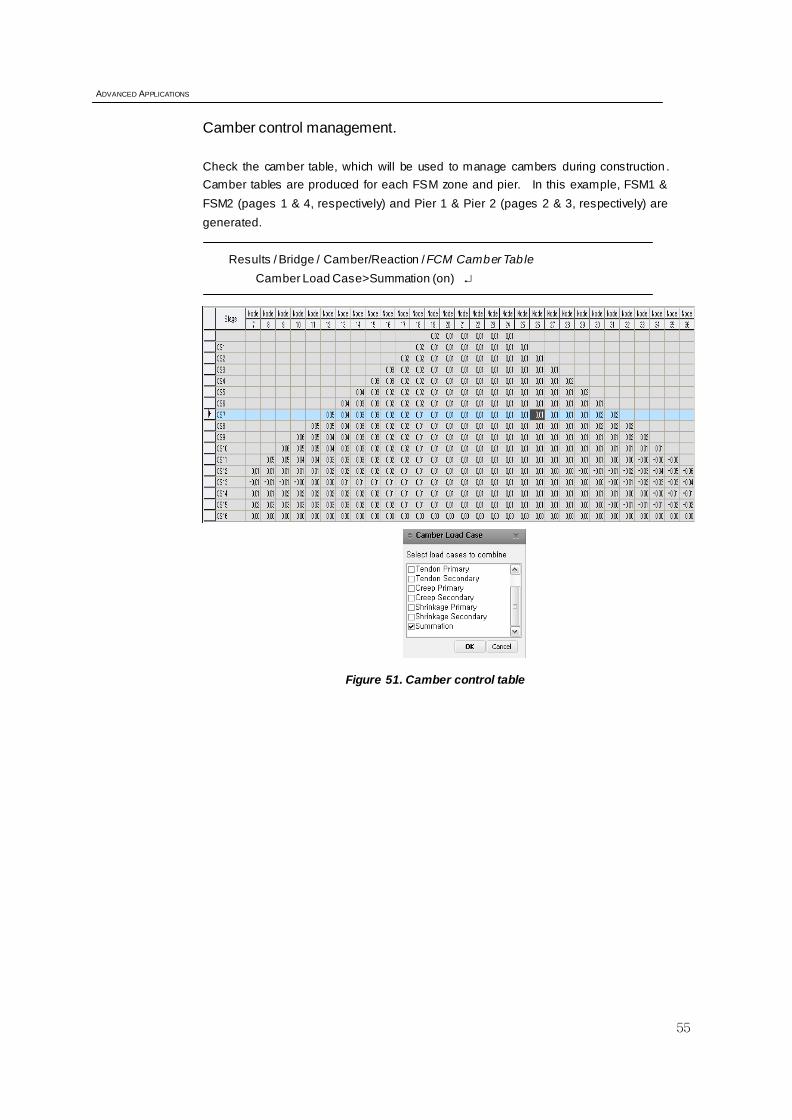
Camber control management.
Check the camber table, which will be used to manage cambers during construction .
Camber tables are produced for each FSM zone and pier. In this example, FSM1 &
FSM2 (pages 1 & 4, respectively) and Pier 1 & Pier 2 (pages 2 & 3, respectively) are
generated.
Results / Bridge / Camber/Reaction / FCM Camber Table
Camber Load Case>Summation (on)
Figure 51. Camber control table
Construction stage analy sis using FCM Wizard
56
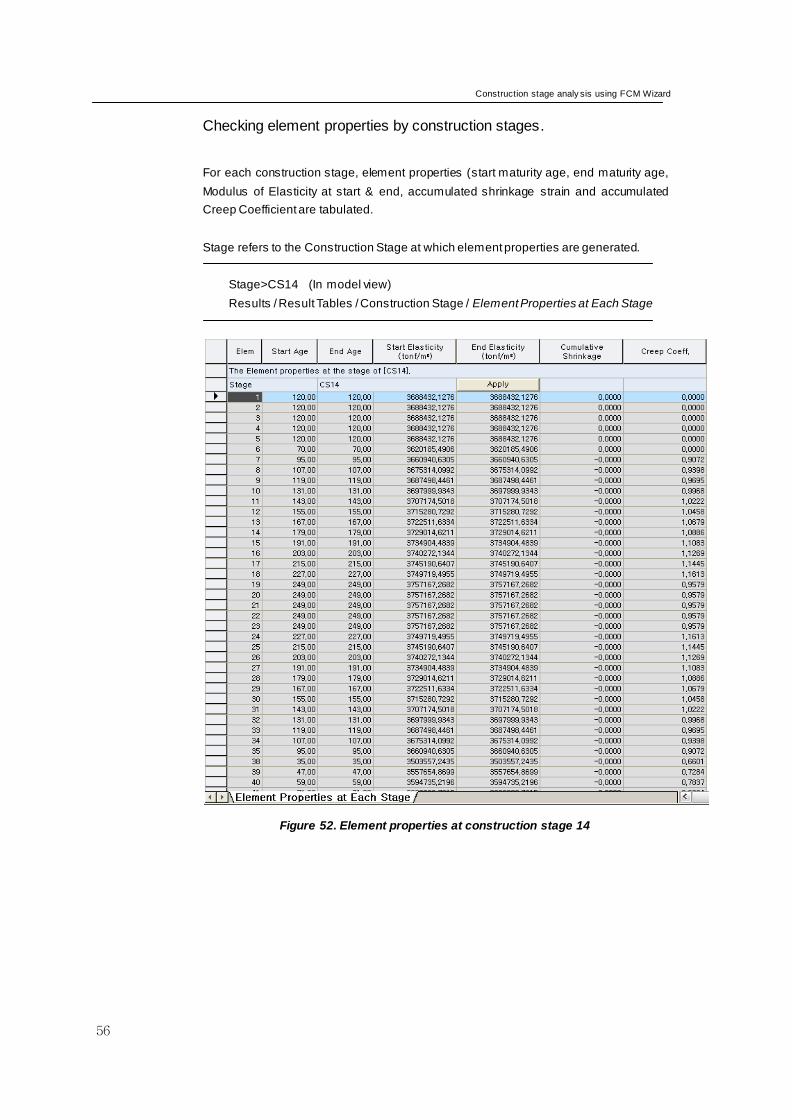
Checking element properties by construction stages.
For each construction stage, element properties (start maturity age, end maturity age,
Modulus of Elasticity at start & end, accumulated shrinkage strain and accumulated
Creep Coefficient are tabulated.
Stage refers to the Construction Stage at which element properties are generated.
Stage>CS14 (In model view)
Results / Result Tables / Construction Stage / Element Properties at Each Stage
Figure 52. Element properties at construction stage 14
ADVANCED APPLICATIONS
57
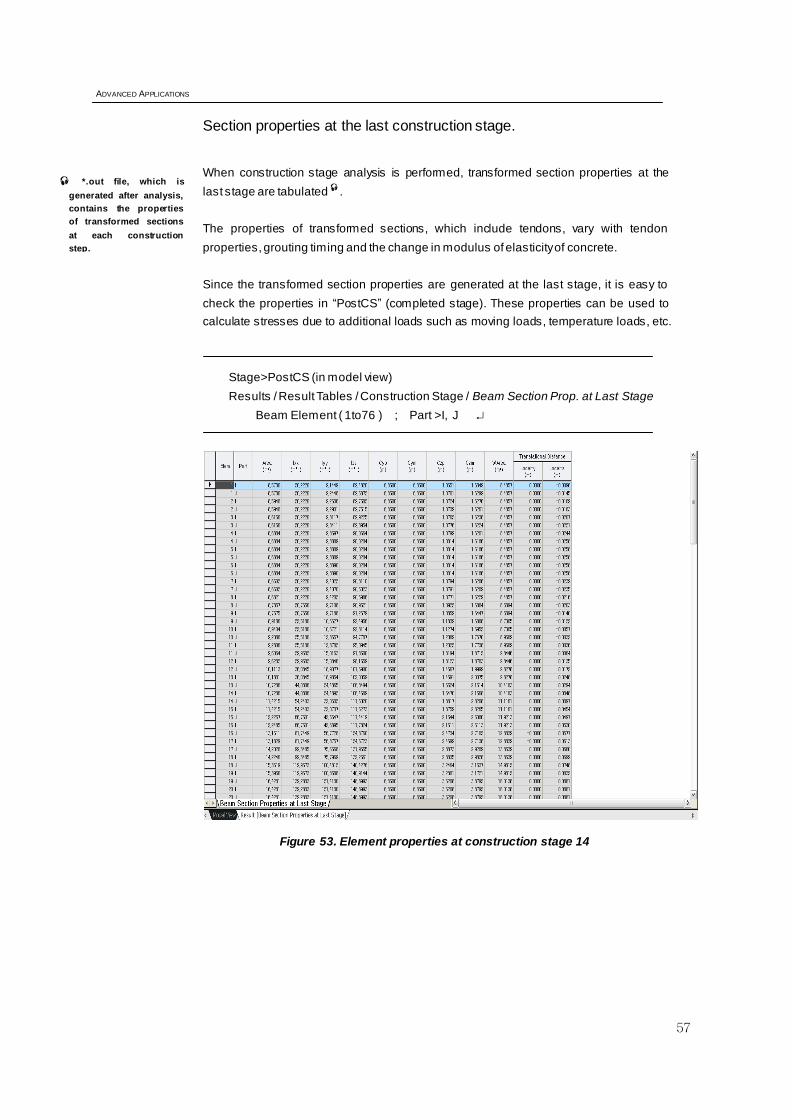
Section properties at the last construction stage.
When construction stage analysis is performed, transformed section properties at the
last stage are tabulated.
The properties of transformed sections, which include tendons, vary with tendon
properties, grouting timing and the change in modulus of elasticity of concrete.
Since the transformed section properties are generated at the last stage, it is easy to
check the properties in “PostCS” (completed stage). These properties can be used to
calculate stresses due to additional loads such as moving loads, temperature loads, etc.
Stage>PostCS (in model view)
Results / Result Tables / Construction Stage / Beam Section Prop. at Last Stage
Beam Element ( 1to76 ) ; Part >I, J
Figure 53. Element properties at construction stage 14
*.out file, which is
generated after analysis,
contains the properties
of transformed sections
at each construction
step.

Construction stage analy sis using FCM Wizard
58
Checking member forces resulting from load combinations.
Once the PSC box bridge has been constructed, wearing surface, live load,
temperature change, support settlement, etc. need to be combined with the effects of
construction dead load. Structural analysis for loads other than the Construction Stage
Load is carried out in the PostCS Stage (final stage). Such PostCS loads can be
combined with the results of the construction stage analysis. Since we have not
specified any load other than the construction stage load in this example, we will define
load factors for the construction stage loads and check member forces. First, we will
define the load combinations.
Stage>PostCS
Results / Load Combinations
Active (on) ; Name ( Dead ) ; Type>Add
Load Case and Factors >Dead Load (CS) ; Factor ( 1.3 )
Load Case and Factors >Erection Load (CS) ; Factor ( 1.3 )
Load Case and Factors >Tendon Secondary (CS) ; Factor ( 1.0 )
Load Case and Factors >Creep Secondary (CS) ; Factor ( 1.3 )
Load Case and Factors >Shrinkage Secondary (CS) ; Factor ( 1.3 )
Figure 54. Definition of load combinations
We switch to the
PostCS, as the load
combinations can
be defined or
deleted in only Base
Stage or PostCS
Stage.
ADVANCED APPLICATIONS
59
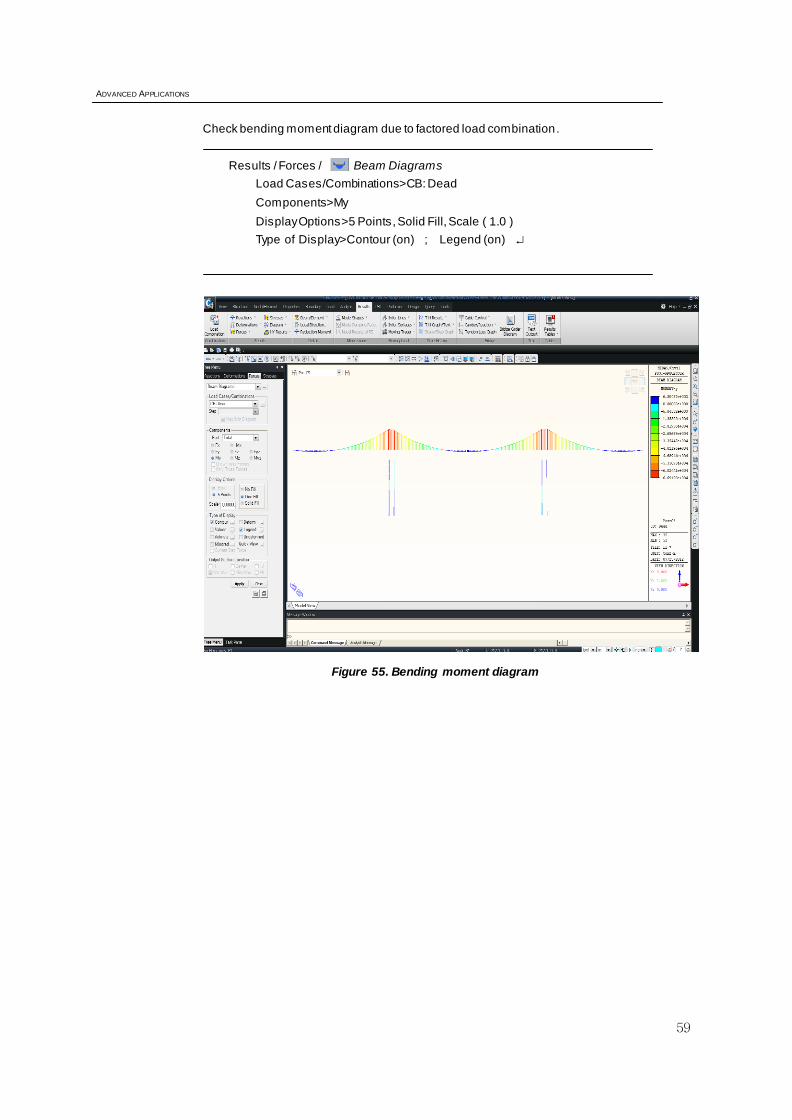
Check bending moment diagram due to factored load combination.
Results / Forces / Beam Diagrams
Load Cases/Combinations>CB: Dead
Components>My
Display Options>5 Points, Solid Fill, Scale ( 1.0 )
Type of Display>Contour (on) ; Legend (on)
Figure 55. Bending moment diagram