airport planing & layout - الصفحات...
TRANSCRIPT

AIRPORT PLANING
& LAYOUT Instructor:
Dr. Yahya R. Sarraj

Introduction
The air age began on December 17, 1903 at Kitty Hawk beach in North Carolina, USA.
Wilbur and Orville Wright (Wright Brothers) tried their first heavier than-air craft.
Air transportation, the most recent mode in modern technology, has vastly changed world travel
Improved opportunities to reach distant places in minimum travel time for business and recreational communities.

Introduction
First flight of the Wright Flyer I, December 17, 1903,
Orville piloting, Wilbur running at wingtip Wright brothers in 1910
Introduction
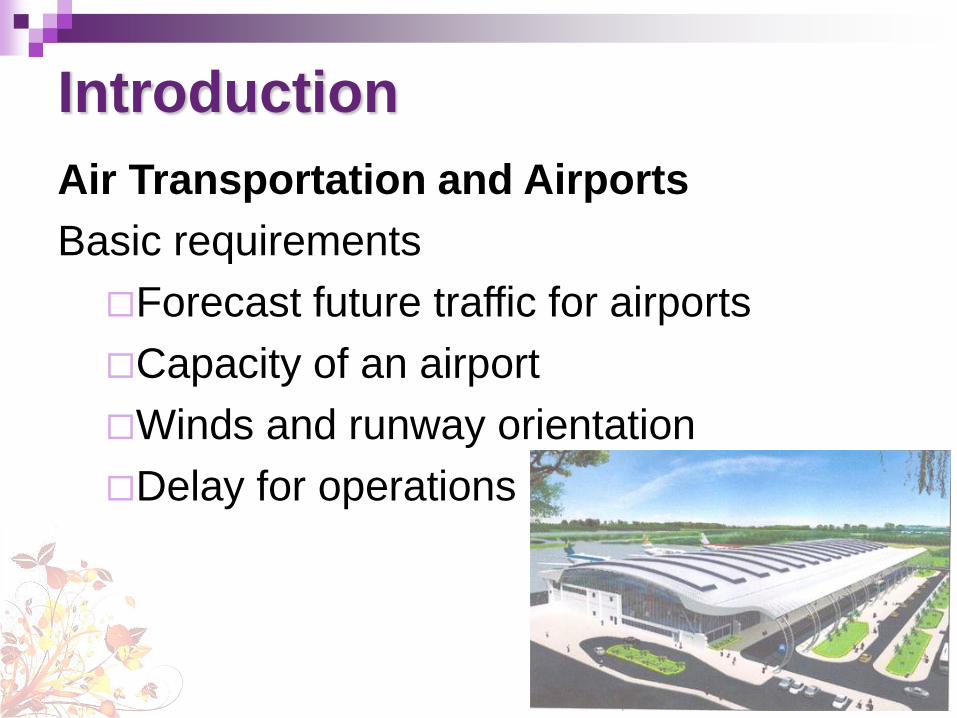
Air Transportation and Airports
Basic requirements
Forecast future traffic for airports
Capacity of an airport
Winds and runway orientation
Delay for operations
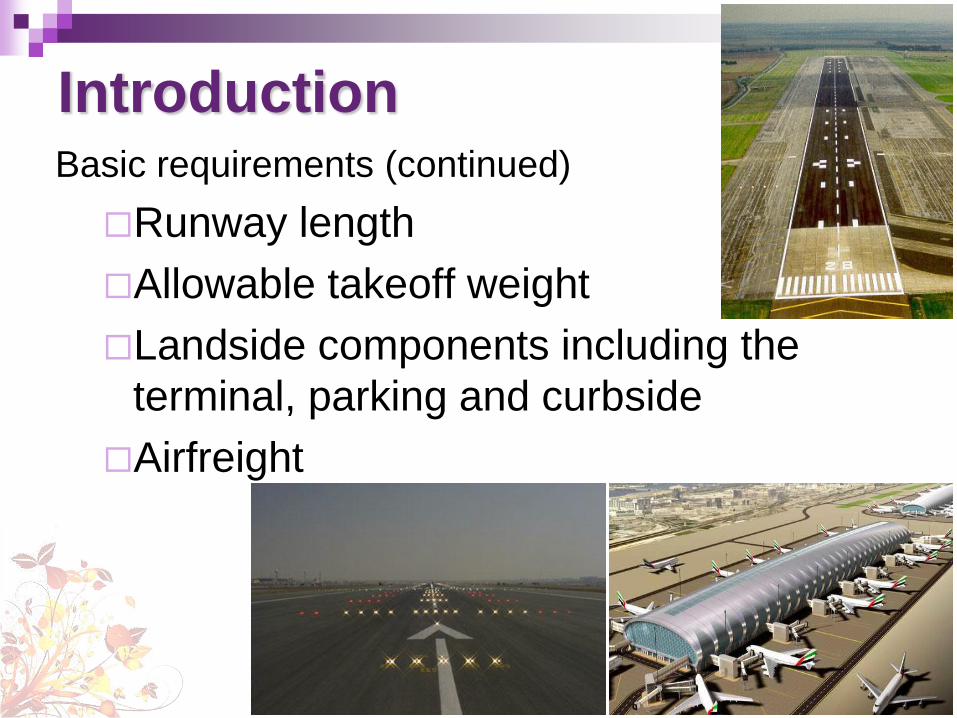
Introduction Basic requirements (continued)
Runway length
Allowable takeoff weight
Landside components including the
terminal, parking and curbside
Airfreight
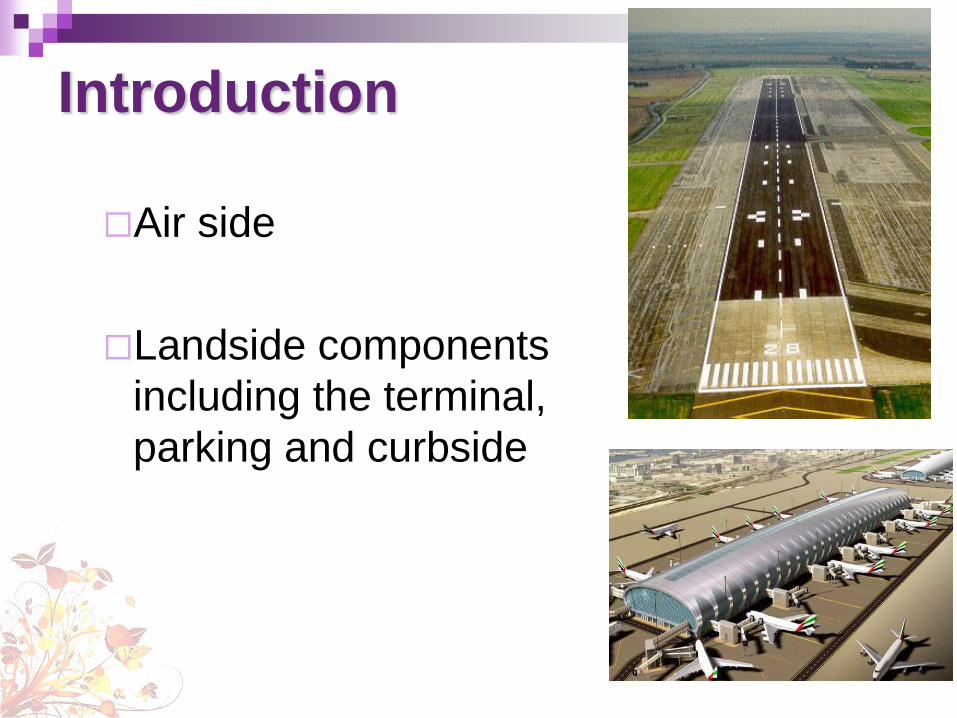
Introduction
Air side
Landside components
including the terminal,
parking and curbside
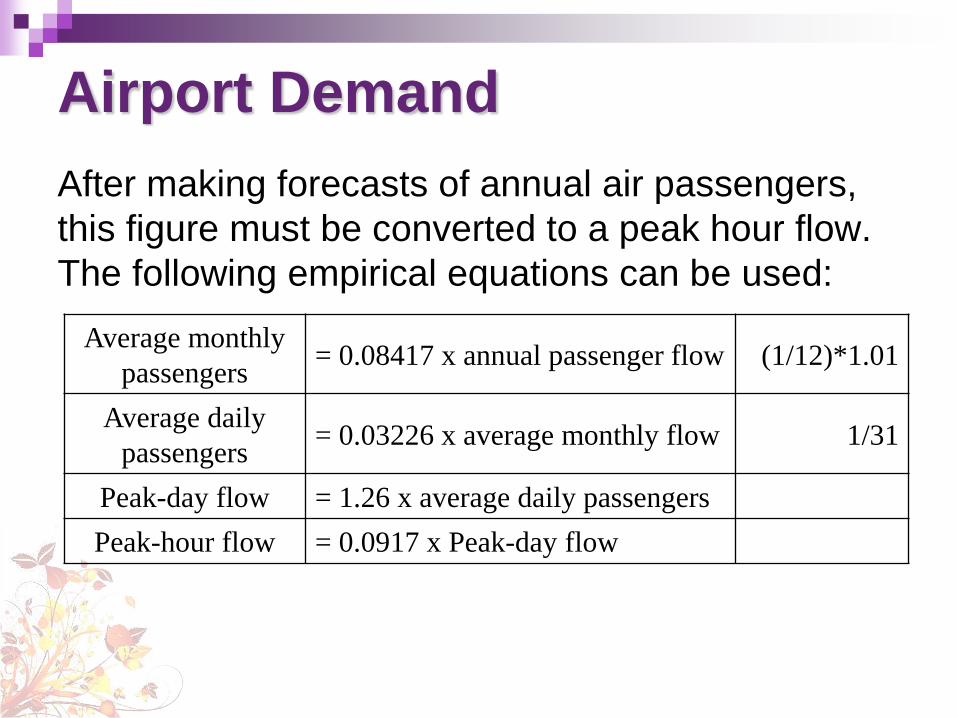
Airport Demand
After making forecasts of annual air passengers,
this figure must be converted to a peak hour flow.
The following empirical equations can be used:
Average monthly
passengers = 0.08417 x annual passenger flow (1/12)*1.01
Average daily
passengers = 0.03226 x average monthly flow 1/31
Peak-day flow = 1.26 x average daily passengers
Peak-hour flow = 0.0917 x Peak-day flow

Airport Demand Peak hour passenger flow can be used to estimate
peak hourly aircraft movements, using estimates of
average passenger load/aircraft
Aviation is growing fast In the USA:
11 September 2001 had a major impact on the growth
of aviation in the U.S. However it is gradually returning
to previous levels.
Year Revenue Passenger Miles (RPM)
1945 005.3 Billion
1970 104.1 Billion
1999 668.0 Billion

Selection of Airport Site
This is the most important aspect of the planning and design of airports.
Procedure:
I. Desk study of the area
1. review of existing land-use plans
2. analysis of wind data (runway orientation)
3. study of national survey,
4. road maps
5. study of land costs
Selection of Airport Site
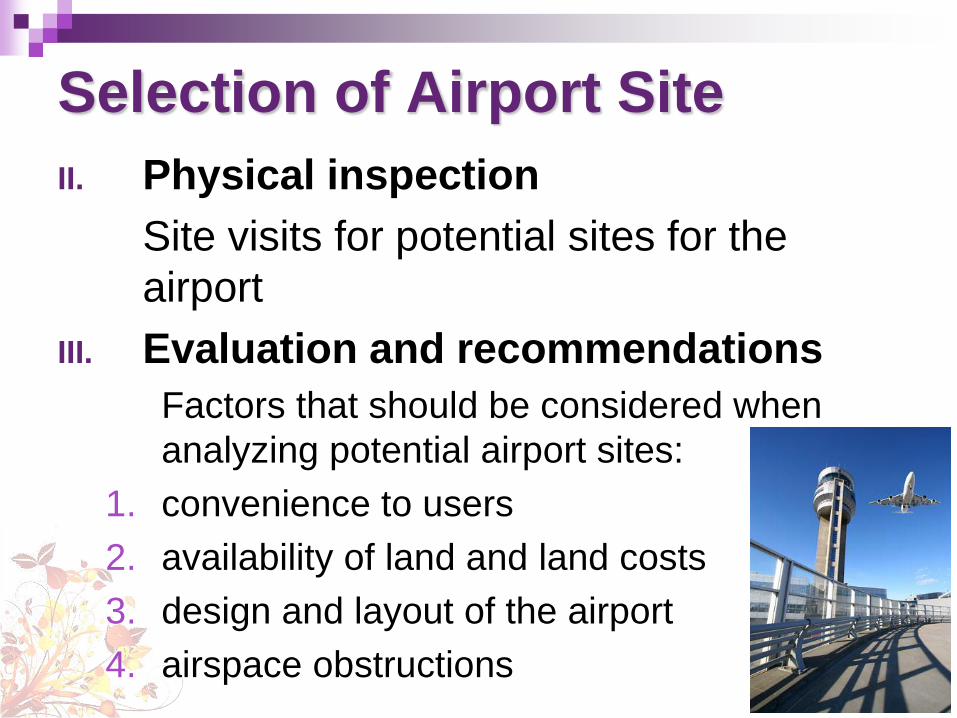
II. Physical inspection
Site visits for potential sites for the
airport
III. Evaluation and recommendations
Factors that should be considered when
analyzing potential airport sites:
1. convenience to users
2. availability of land and land costs
3. design and layout of the airport
4. airspace obstructions
Selection of Airport Site
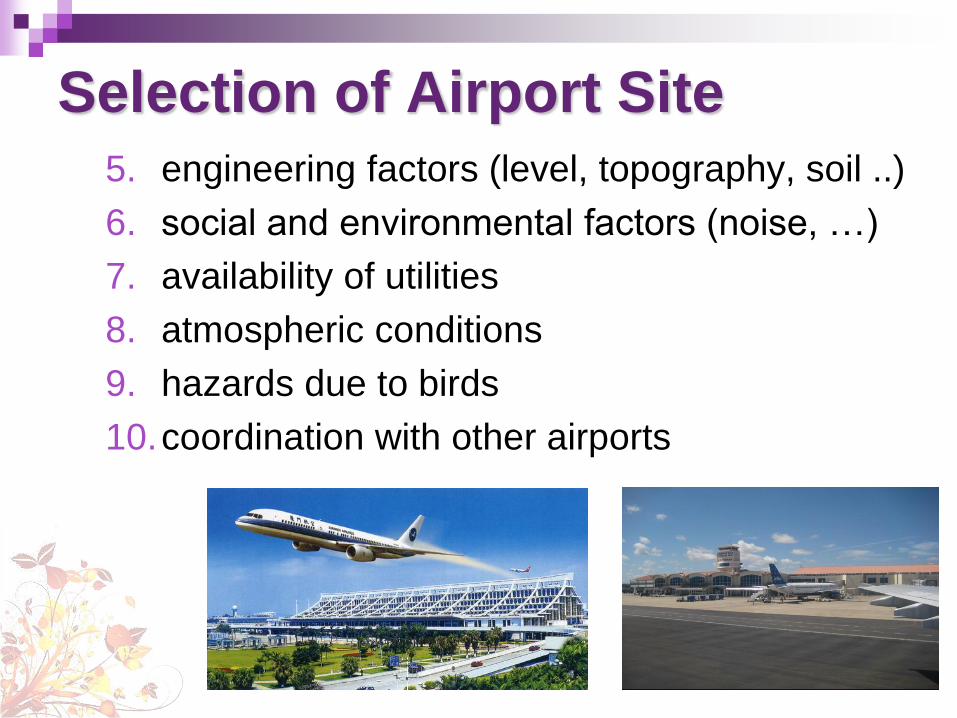
5. engineering factors (level, topography, soil ..)
6. social and environmental factors (noise, …)
7. availability of utilities
8. atmospheric conditions
9. hazards due to birds
10.coordination with other airports
Runway Orientation Runways are oriented in the direction of
prevailing winds.
Crosswind is not very safe for the operation
of aircraft.
Limits for crosswind is 12 mph – 15 mph.
Runways should be oriented so that aircraft
may be landed at least 95% of the time
without exceeding the allowable crosswind.
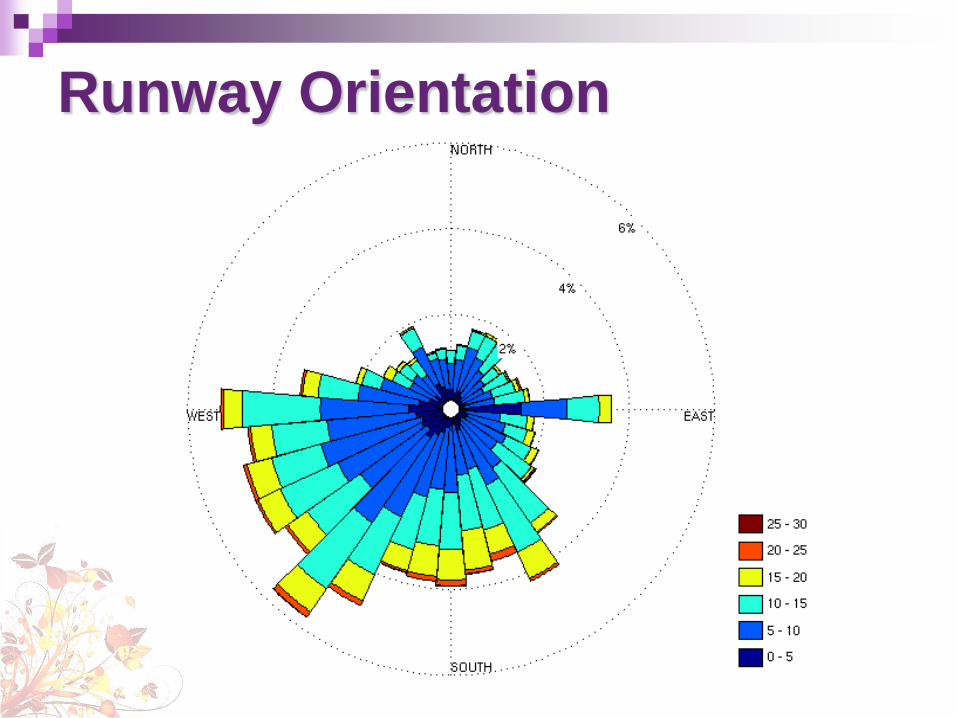
Runway Orientation
Wind Rose Method:
A graphical procedure utilizing a wind rose
is used to determine the best runway
orientation.
10 years of wind observations are
required.
Wind data are arranged according to
velocity, direction and frequency as shown
in Table 16-1 page 554 (Paquette)
Runway Orientation
Runway Orientation
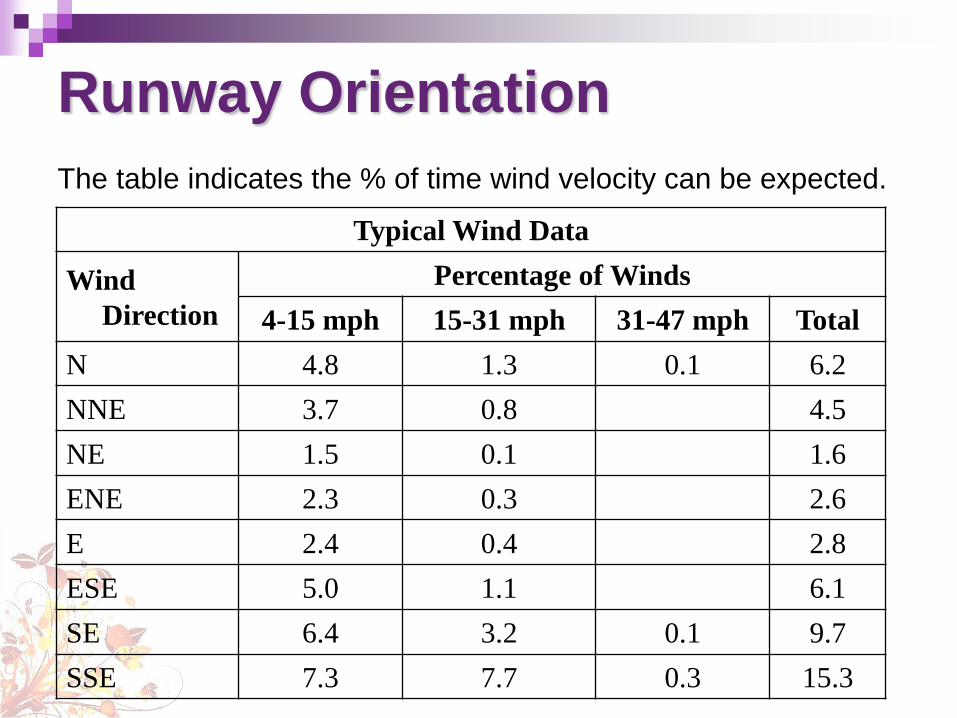
The table indicates the % of time wind velocity can be expected.
Typical Wind Data
Wind
Direction
Percentage of Winds
4-15 mph 15-31 mph 31-47 mph Total
N 4.8 1.3 0.1 6.2
NNE 3.7 0.8 4.5
NE 1.5 0.1 1.6
ENE 2.3 0.3 2.6
E 2.4 0.4 2.8
ESE 5.0 1.1 6.1
SE 6.4 3.2 0.1 9.7
SSE 7.3 7.7 0.3 15.3
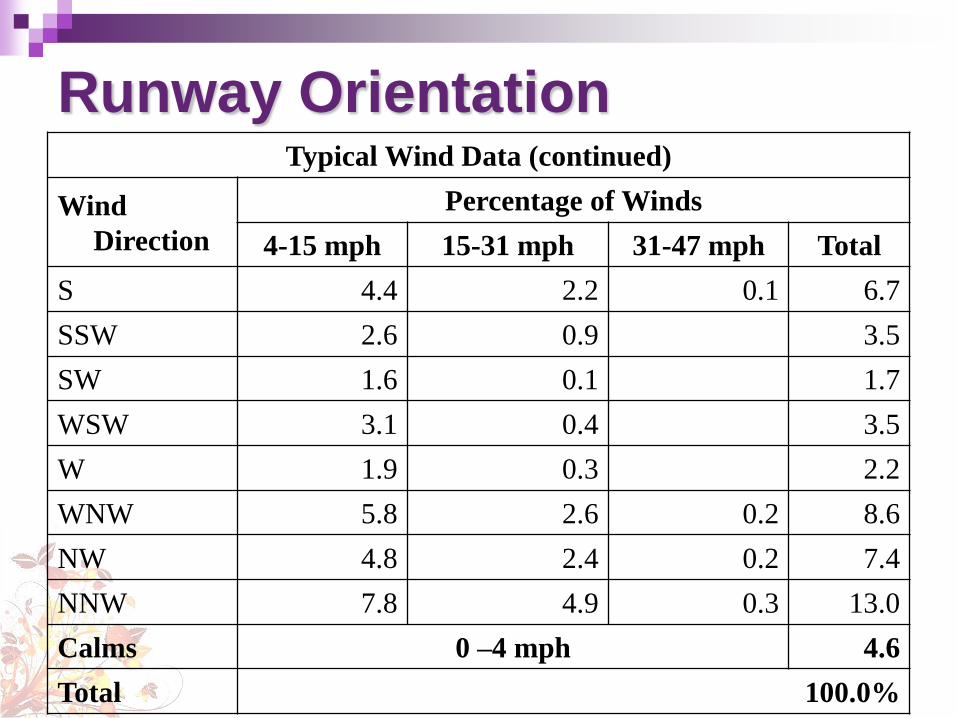
Runway Orientation Typical Wind Data (continued)
Wind
Direction
Percentage of Winds
4-15 mph 15-31 mph 31-47 mph Total
S 4.4 2.2 0.1 6.7
SSW 2.6 0.9 3.5
SW 1.6 0.1 1.7
WSW 3.1 0.4 3.5
W 1.9 0.3 2.2
WNW 5.8 2.6 0.2 8.6
NW 4.8 2.4 0.2 7.4
NNW 7.8 4.9 0.3 13.0
Calms 0 –4 mph 4.6
Total 100.0%

Runway Orientation
These data are plotted on the wind rose by
placing the percentages in the appropriate
segments of the graph.
On the graph:
Circles represent wind
Velocity Radial lines
indicate wind direction
Wind speed Wind direction

Runway Orientation
Wind
direction

Runway Orientation Steps to determine the best runway orientation and to
determine the percentage of time that orientation
conforms to the cross-wind standards:
1. Place the template on the wind rose so that the
middle line passes through the center of the wind
rose.
2. Rotate the template to get the maximum sum of
percentages between the outside lines of the
template.
3. Read the bearing of runway on the outer scale of
the wind rose, beneath the centerline of the
template.
4. Check cross-wind

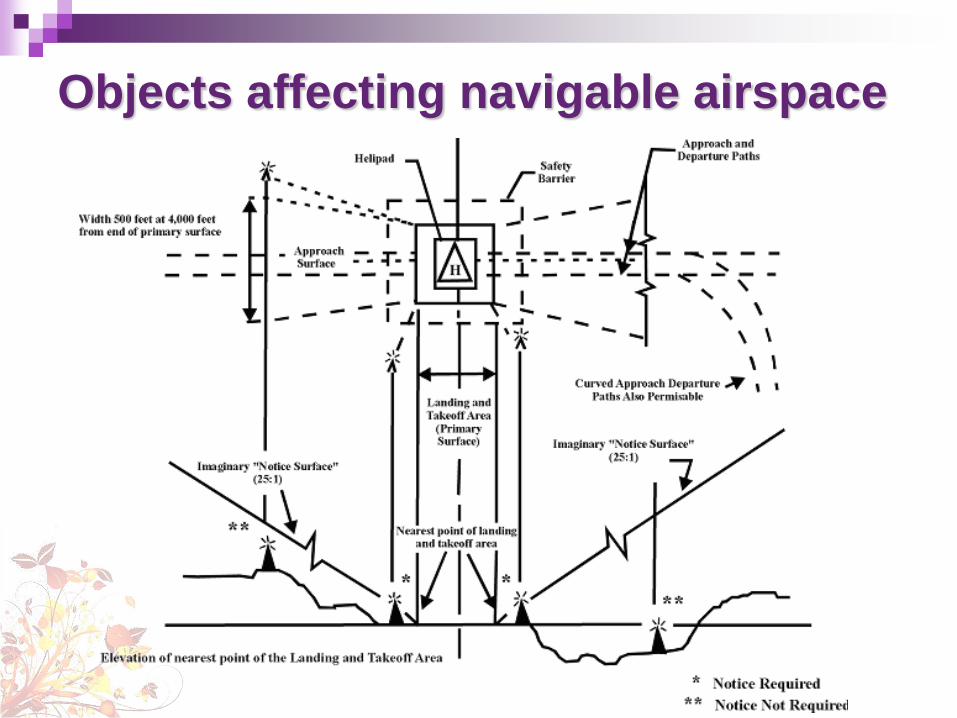
Objects affecting navigable airspace
The required space around the airport
should be with controlled building heights.
This is important for safety during landings
and takeoffs of aircrafts.
Objects affecting navigable airspace

Runway Capacity
Runway capacity is the determining
element of airport capacity.
Definition:
Runway capacity refers to the ability of a
runway system to accommodate aircraft
operations (landings and takeoffs).
It is expressed in operations per unit time.
i.e. operation per hour or per year.
Runway Capacity
Ultimate or saturation capacity:
It is based on the assumption of a continuous backlog of aircraft waiting to take off and land.
Definition:
Ultimate or saturation capacity is the maximum number of aircraft operations that can be handled during a given period under conditions of continuous demand.
Runway Capacity
Factors that affect capacity:
minimum safe allowable separation
between aircraft during landing and takeoff
size of aircraft
weather conditions
over all layout and design of airport.
Runway configuration
single
non-intersecting divergent runway
parallel runway
offset parallel
intersecting runway
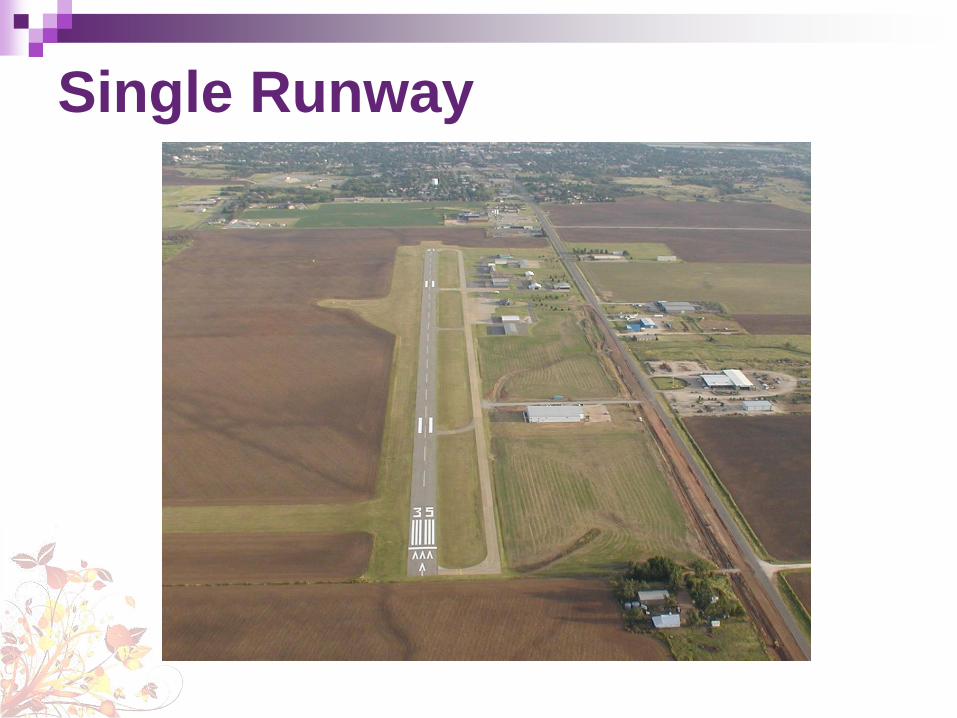
Single Runway
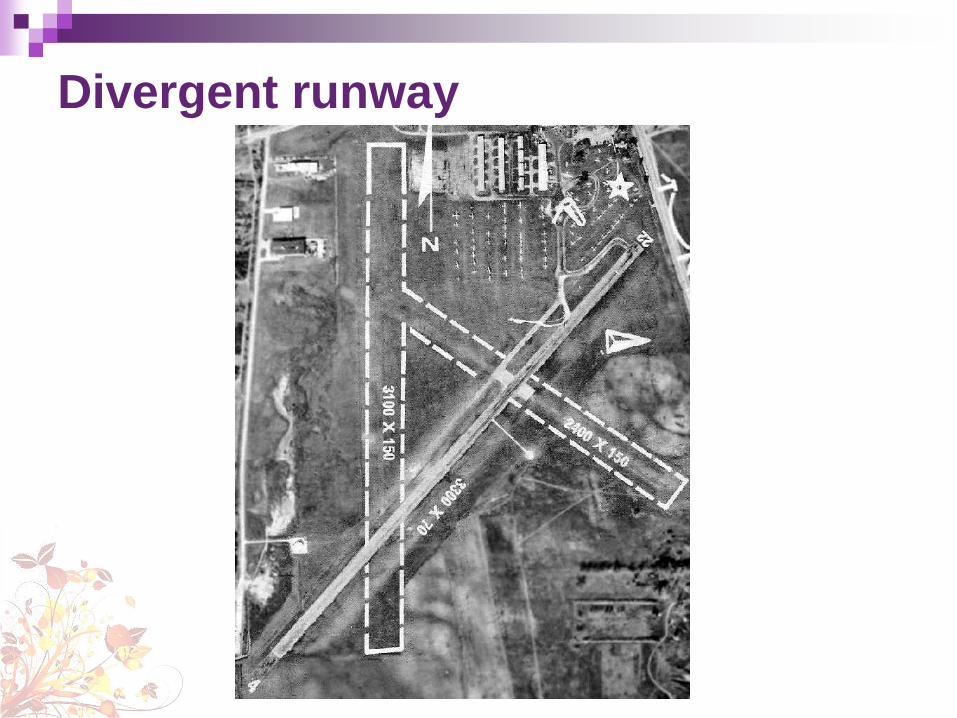
Divergent runway
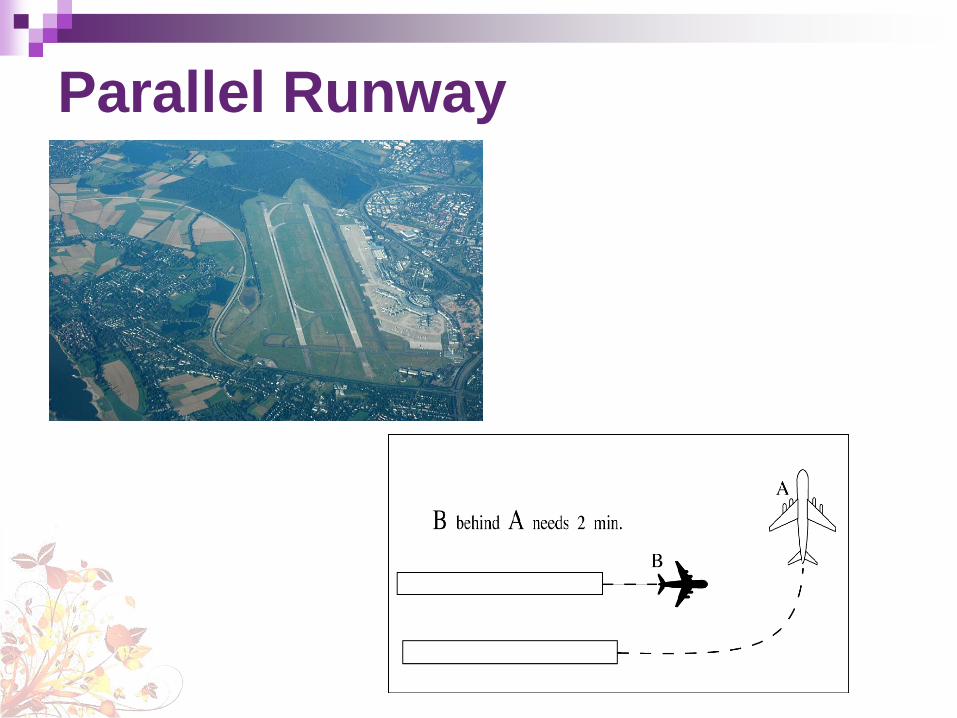
Parallel Runway

Offset parallel
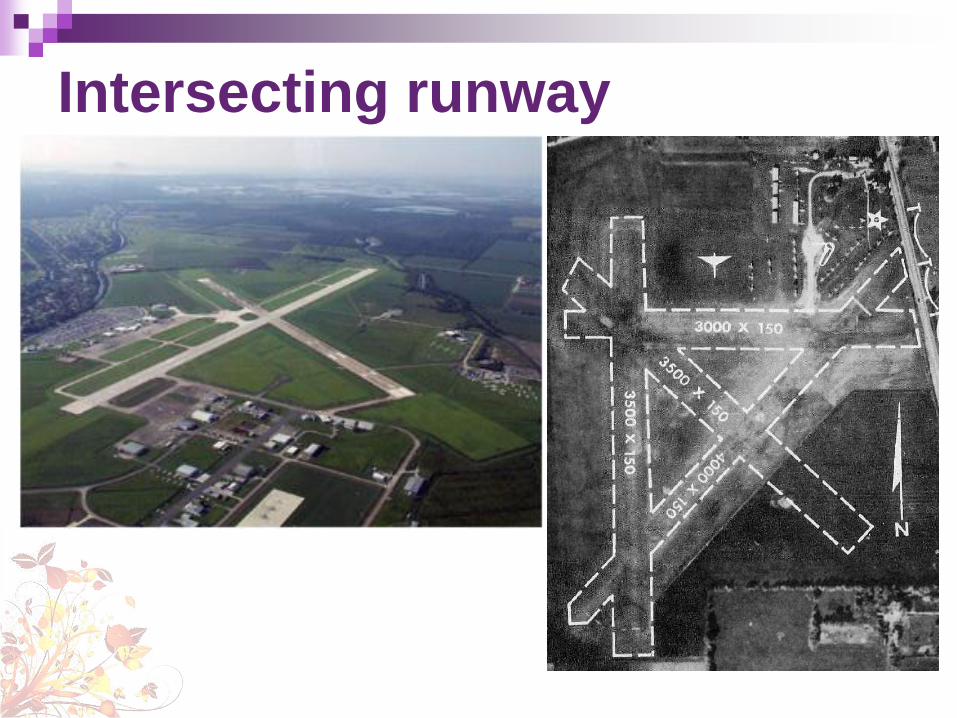
Intersecting runway

Number of gates
The required number of gates at an airport can
be determined using the following equation:
Where:
n = number of gates required
v = design hour flow for departures or arrivals
(aircraft / hour)
t = mean stand occupancy (hour)
u = utilization factor 0.6 – 0.8
n = v t
u
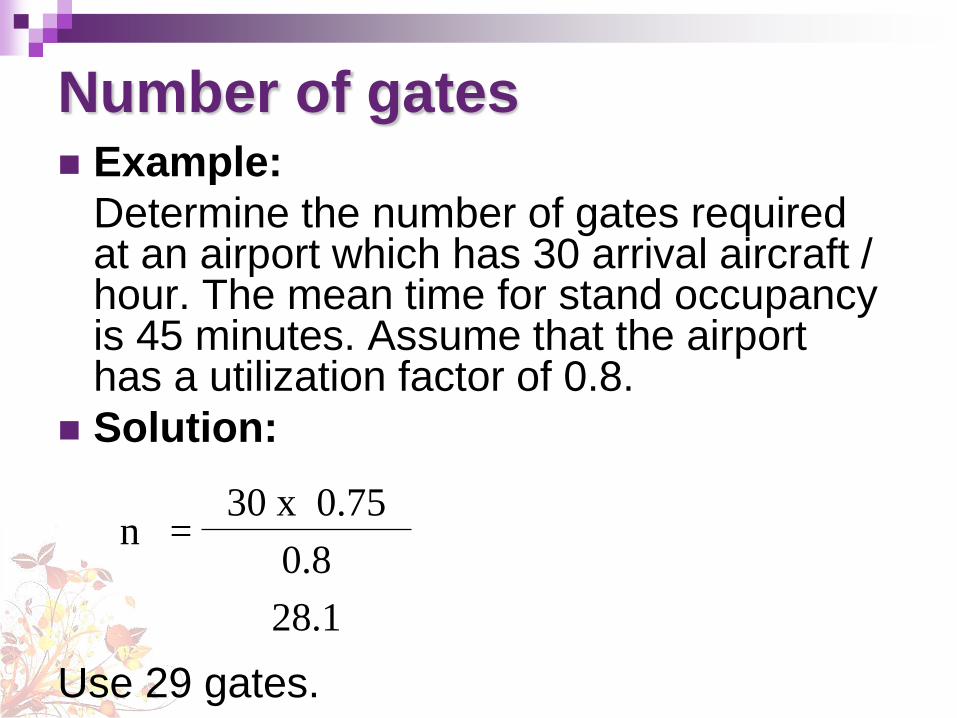
Number of gates Example:
Determine the number of gates required at an airport which has 30 arrival aircraft / hour. The mean time for stand occupancy is 45 minutes. Assume that the airport has a utilization factor of 0.8.
Solution:
Use 29 gates.
n = 30 x 0.75
0.8
28.1
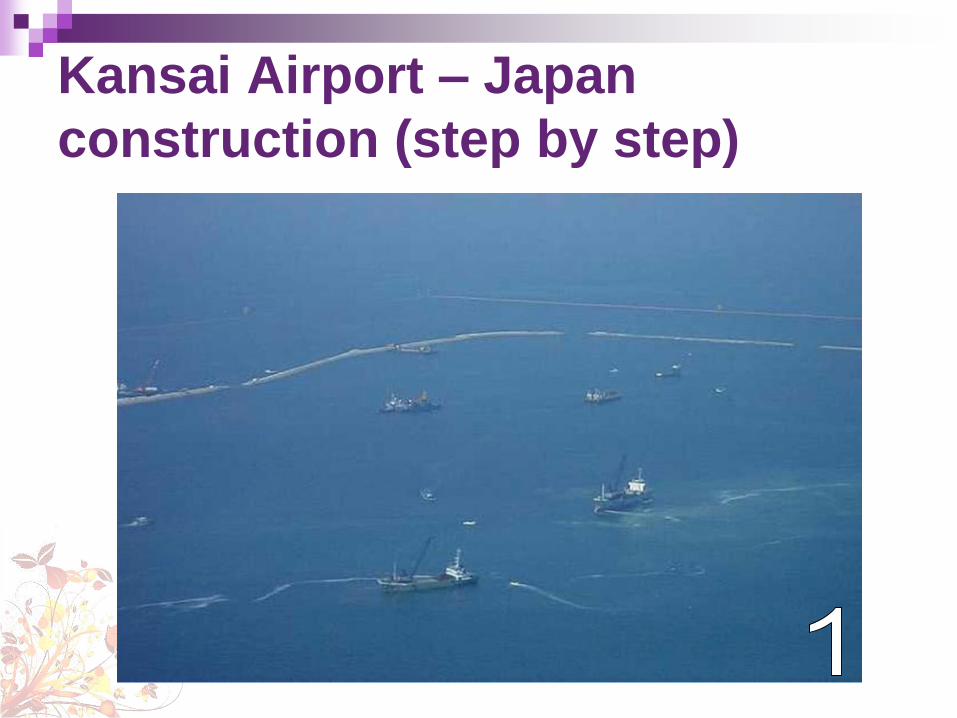
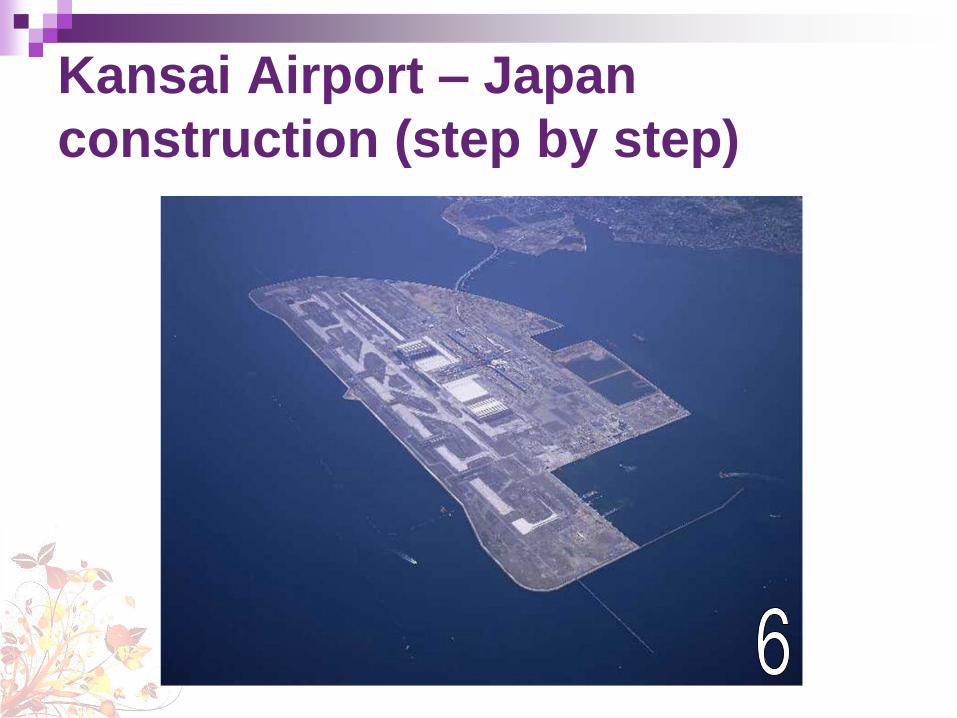
Kansai Airport – Japan
construction (step by step)
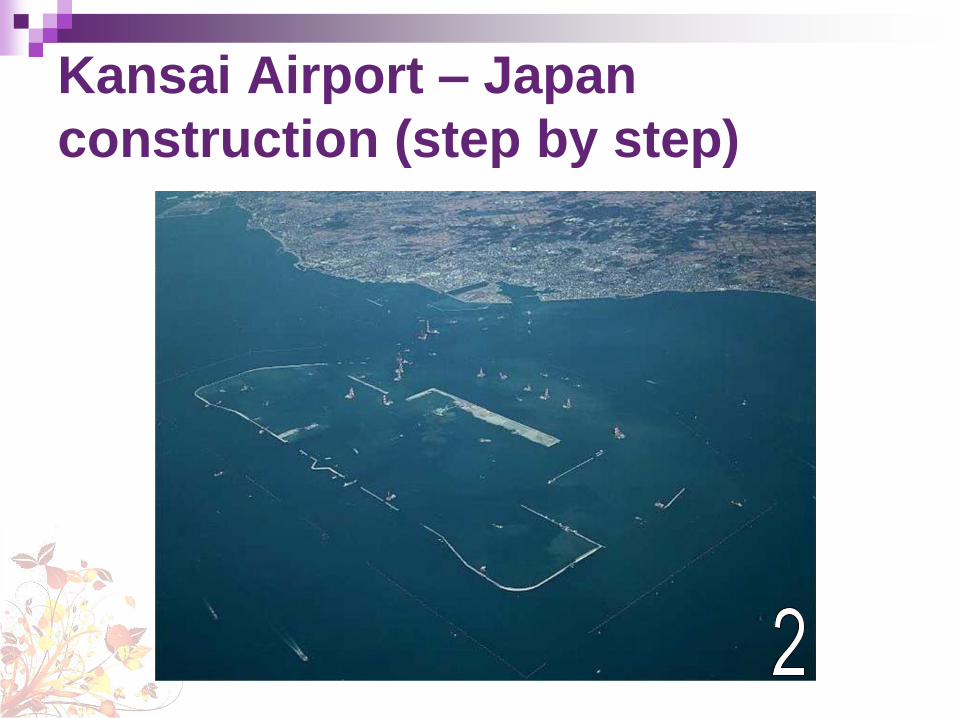
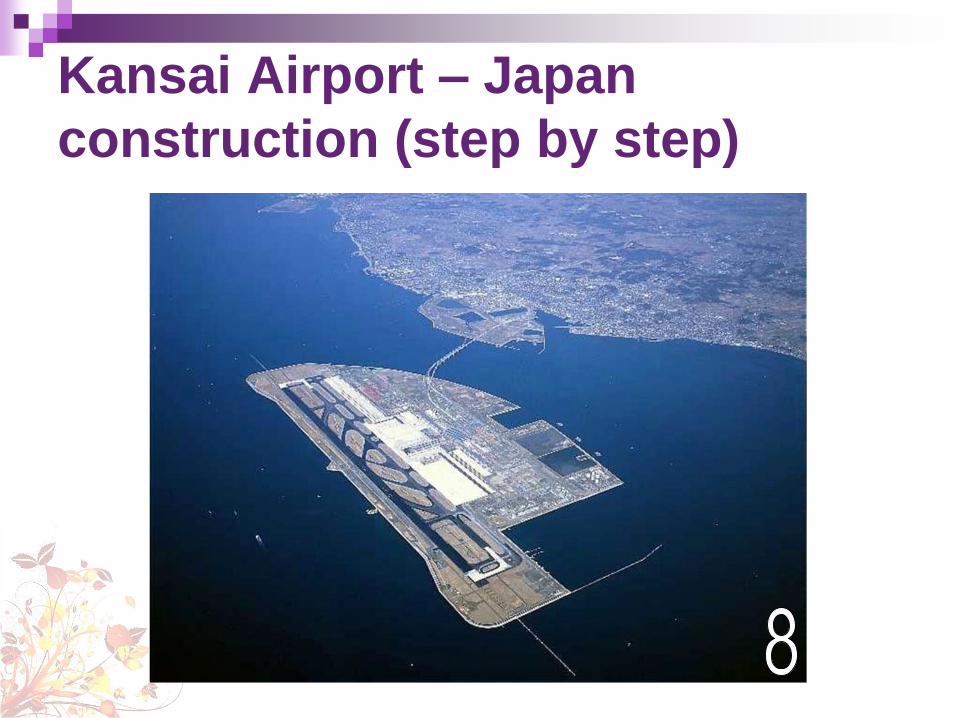
Kansai Airport – Japan
construction (step by step)

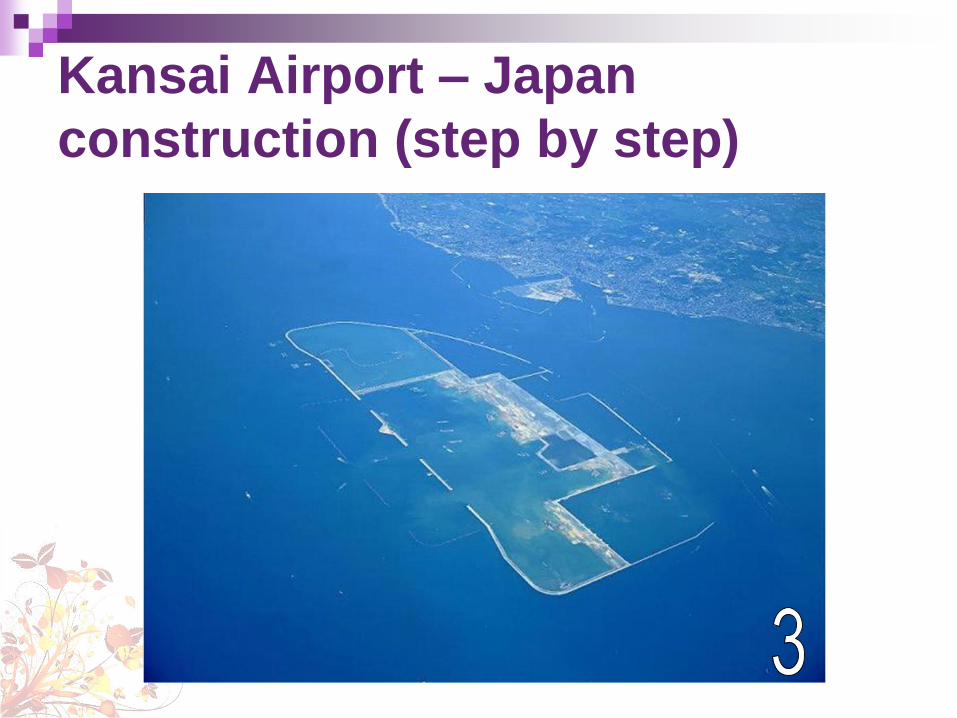
Kansai Airport – Japan
construction (step by step)
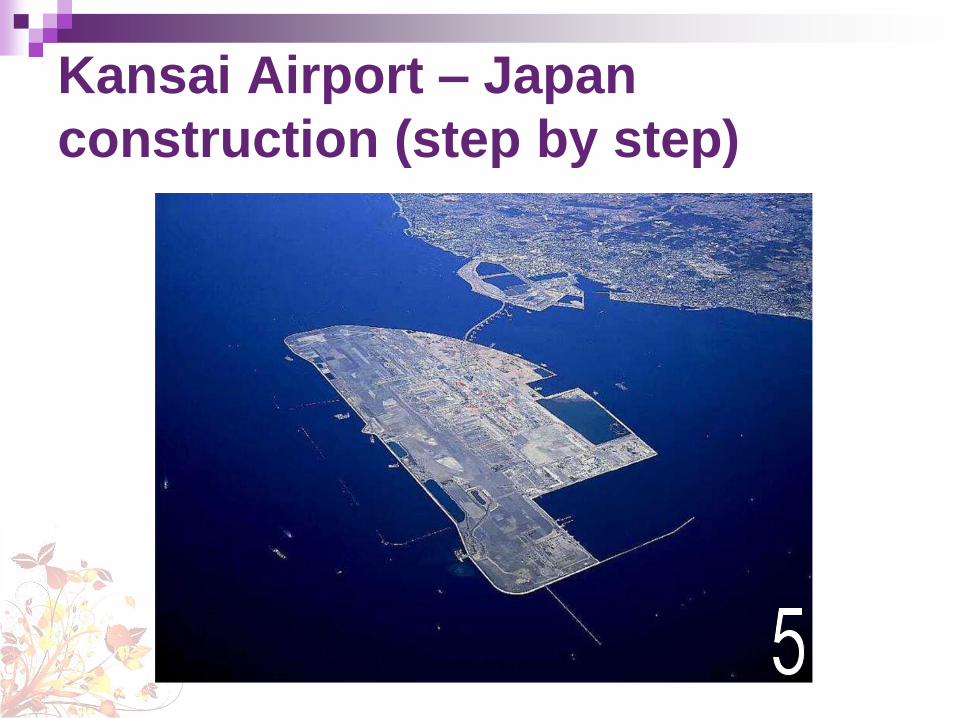
Kansai Airport – Japan
construction (step by step)

Kansai Airport – Japan
construction (step by step)

How do Airplanes fly ?
This video demonstrates the airplane operation in a
logical manner with help of animation. Please check out
a video by a Cambridge professor to clear your
misconception about the lift generation.
Published on Oct 17, 2015
Help us to make future videos for you. Make LE's efforts
sustainable. Please support us at Patreon.com !
https://www.patreon.com/LearnEngineering
https://www.youtube.com/watch?v=YyeX6ArxCYI