algebra i work sta on rate of change - esc4.net · algebra i work sta on rate of change...
TRANSCRIPT

Algebra I Work Sta on
Rate of Change
#ThankATeacher
#TeacherDay
#TeacherApprecia onWeek
©2017 Region 4
Educa on Service Center

Make and Take STAAR® Review 2017, Algebra I © Region 4 Education Service Center All Rights Reserved
Rate of Change
TEKS A(10)(E) Reporting Category 1
Number and Algebraic Methods
Materials For the folder
• Yellow folder • Yellow cardstock • 2 Plastic sandwich bags • 1 transparency • Packing tape • Dry erase markers
For each student
• Rate of Change Recording Sheet
1. Print the document.
2. Cut out, arrange, and glue the Cover and the Content Objective, Language Objective, and Key
Questions to the front of the folder.
3. Cut out and glue the Folder Tab Label to the tab of the folder.
Cover
Content Objective, Language Objective,
and Key Questions
Folder Tab Label

Make and Take STAAR® Review 2017, Algebra I © Region 4 Education Service Center All Rights Reserved
4. Cut out and glue the Answer Key to the back of the folder. Use packing tape and cardstock to
make a cover for the Answer Key. Use a Velcro® dot to keep the cover closed until needed.
Cardstock Cover
Velcro® Dot
Answer Key
Velcro® Dot
Packing tape

Make and Take STAAR® Review 2017, Algebra I © Region 4 Education Service Center All Rights Reserved
5. Cut out, arrange, and glue the Instructions, Task 3: Rate of Change or Slope, and
Task 4: Assessment Item to the inside of the folder.
6. Print the Conversation Cards for Task 1 and the Challenge Cards for Task 2 on cardstock. Cut
out the cards, place them in 2 different plastic bags. Staple one side of the bag to the folder
so that the bag can still be opened once attached. Tape the label for Task 1 and Task 2 to the
outside of the plastic bags.
7. Cut out the Task 2 Game Board. Glue the Game Board on the inside of the folder. Cut a
transparency so that its dimensions will cover the Game Board, tape the cut transparency to
protect the Game Board and provide a surface that can be written on and cleaned using dry
erase markers.
8. The student recording sheet is not attached to the folder. Place copies for your students inside
the folder.
Task 3
Task 1: Conversation Cards
Instructions
Task 2: Challenge Cards
Student Recording
Sheet
Task 4: Assessment
Item

Make and Take STAAR® Review 2017, Algebra I © Region 4 Education Service Center All Rights Reserved
Task 2: Game Board

Center 2: Rate of Change Reporting Category 2, TEKS A(3)(B)
STAAR® Make and Take: Algebra I ©2017 Region 4 Education Service Center All Rights Reserved
Folder tab label: Cover:
Reporting Category 2 Describing and Graphing Linear
Functions, Equations, and Inequalities
TEKS A(3)(B)
Rate of Change
RC 2 TEKS A(3)(B) Rate of Change
Content Objective I can determine the rate of change from a table, a graph, or an equation in mathematical and real-world situations. Language Objective I can describe how to determine the rate of change. Key Questions 1. How is rate of change represented algebraically?
2. How can you determine the rate of change of a linear function from different
representations?
x y
−28 −5
−7 1
28 11
35 13

Center 2: Rate of Change Reporting Category 2, TEKS A(3)(B)
STAAR® Make and Take: Algebra I ©2017 Region 4 Education Service Center All Rights Reserved
Rate of Change Instructions
Task 1: Conversation Cards (yellow)
• Each student takes one of the Conversation Cards.
• Determine the rate of change of the relationship represented on your card.
• Each student takes a turn explaining how he or she determined the rate of change for the given card.
Task 2: Rate of Change Challenge (orange)
• Each student should choose a pattern card.
• Shuffle the Rate of Change Challenge Cards and place in a pile.
• Draw one card from the pile. All players will determine the rate of change which completes the sentence.
• Use a dry erase marker to color the square with the answer on the Game Board.
• Continue drawing cards and determining the rate of change.
• The winner is the player whose pattern card matches the colored squares on the Game Board.
Task 3: Rate of Change • Use the phrase bank to complete the
handout. Task 4: Assessment
• Read and work through the assessment question.
Task 1
Conversation Cards (3 cards)
Please do not write
on the cards.
Task 3: Rate of Change
Phrase Bank
• Equation • Horizontal change • Graph • Ordered pairs • Rise • Run • Slope formula • Table • Vertical change
Task 2
Rate of Change Challenge Cards
(12 cards)
Please do not write on the cards.

Center 2: Rate of Change Reporting Category 2, TEKS A(3)(B)
STAAR® Make and Take: Algebra I ©2017 Region 4 Education Service Center All Rights Reserved
Task 2: Game Board
‒7 50 12
−
900 60 ‒3.5
0.2 4.5 3
4 ‒4 43
Task 4: Assessment The table represents some points on the graph of a linear function.
x y ‒4 29 2 2 5 ‒11.5 9 ‒29.5
What is the rate of change of y with respect to x for this function?
A 29
B 29
−
C 92
D 92
−
Center 2: Rate of Change Reporting Category 2, TEKS A(3)(B)
STAAR® Make and Take: Algebra I ©2017 Region 4 Education Service Center All Rights Reserved
Back cover of folder:
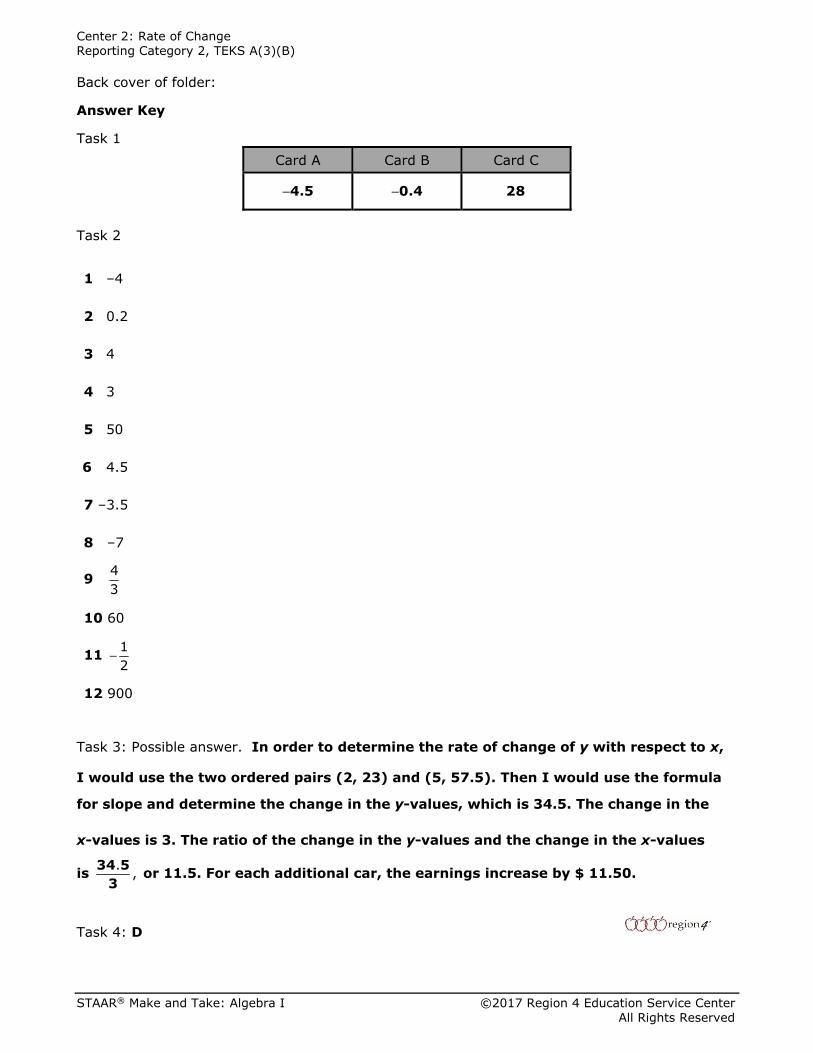
Answer Key
Task 1 Card A Card B Card C
4.5− 0.4− 28
Task 2
1 ‒4
2 0.2
3 4
4 3
5 50
6 4.5
7 ‒3.5
8 ‒7
9 43
10 60
11 12
−
12 900
Task 3: Possible answer. In order to determine the rate of change of y with respect to x,
I would use the two ordered pairs (2, 23) and (5, 57.5). Then I would use the formula
for slope and determine the change in the y-values, which is 34.5. The change in the
x-values is 3. The ratio of the change in the y-values and the change in the x-values
is . ,34 53
or 11.5. For each additional car, the earnings increase by $ 11.50.
Task 4: D

Center 2: Rate of Change Reporting Category 2, TEKS A(3)(B)
STAAR® Make and Take: Algebra I ©2017 Region 4 Education Service Center All Rights Reserved
Task 1: Conversation Cards
Yellow cardstock
A The table represents some points on the graph of a linear function.
x y
‒8 30
0 ‒6
4 ‒24
10 ‒51 What is the rate of change of y with respect to x for this function?
B The amount of money on a gift card can be modeled by the graph of the linear function shown on the grid.
Money on Gift Card
What is the rate of change of the balance with respect to the number of candy purchases?
C A store pays an hourly rate and a monthly stipend for expenses. The equation
28 25y x= + can be used to determine the total pay, y, that a worker would be paid for x hours of work. What is the rate of change of the total pay with respect to the number of hours worked?
Number of Candy Purchases
Bal
ance
(do
llars
)

Center 2: Rate of Change Reporting Category 2, TEKS A(3)(B)
STAAR® Make and Take: Algebra I ©2017 Region 4 Education Service Center All Rights Reserved
Task 2: Rate of Change Challenge Cards Orange cardstock 1 The number of baskets made and the distance from the basket is recorded in the table below.
Distance from basket (feet)
Number of baskets made
0 60 4 44 8 28 12 12
The rate of change of the number of baskets made with respect to the distance from the basket is _____ baskets per foot.
2 The scatterplot shows the average price of a movie ticket, y, over the last 20 years. The rate of change of the cost of a ticket with respect to elapsed number of years is $_____ per year.
3 The rate of change of x with respect to y of the line that passes through the points (8, 9) and (5, ‒3) is _______.
4 The table represents some points on the graph of a linear function.
x y ‒3 ‒6.5 ‒1 ‒0.5 2 8.5 5 17.5
The rate of change of y with respect to x is ______.
Ave
rage
Tic
ket
Pric
e ($
)
Elapsed Number of Years
(20, 8.40)
(12, 6.80)
(3, 5.00)(0, 4.40)

Center 2: Rate of Change Reporting Category 2, TEKS A(3)(B)
STAAR® Make and Take: Algebra I ©2017 Region 4 Education Service Center All Rights Reserved
5 The function that models the total cost of a plumbing repair is y = 48 + 50x, where y represents the total cost and x represents the number of hours needed to complete the repair. The rate of change of the total cost with respect to the number of hours needed to complete the repair is $_____ per hour.
6 The table represents paired values that show the relationship between the total distance walked and the elapsed time.
Elapsed time
(hours) 0 0.5 2.25 3.5
Total distance walked (miles)
0 2.25 10.125 15.75
The rate of change of y with respect to x is ______ miles per hour.
7 The graph shows a spring’s distance from the floor, y, and the mass, x, attached to the end of the spring. The rate of change of distance from the floor with respect to the weight of the mass is _____ centimeters per gram.
8 Since he started working in the animal control department, an officer has recorded y, the number of stray dogs found each year in his district.
Year 2013 2014 2015 2016
Number of Stray Dogs
62 55 48 41
The rate of change of the number of stray dogs with respect to the year is _____ dogs per year.
Dis
tanc
e fr
om t
he F
loor
(cm
)
Mass (grams)
Center 2: Rate of Change Reporting Category 2, TEKS A(3)(B)
STAAR® Make and Take: Algebra I ©2017 Region 4 Education Service Center All Rights Reserved
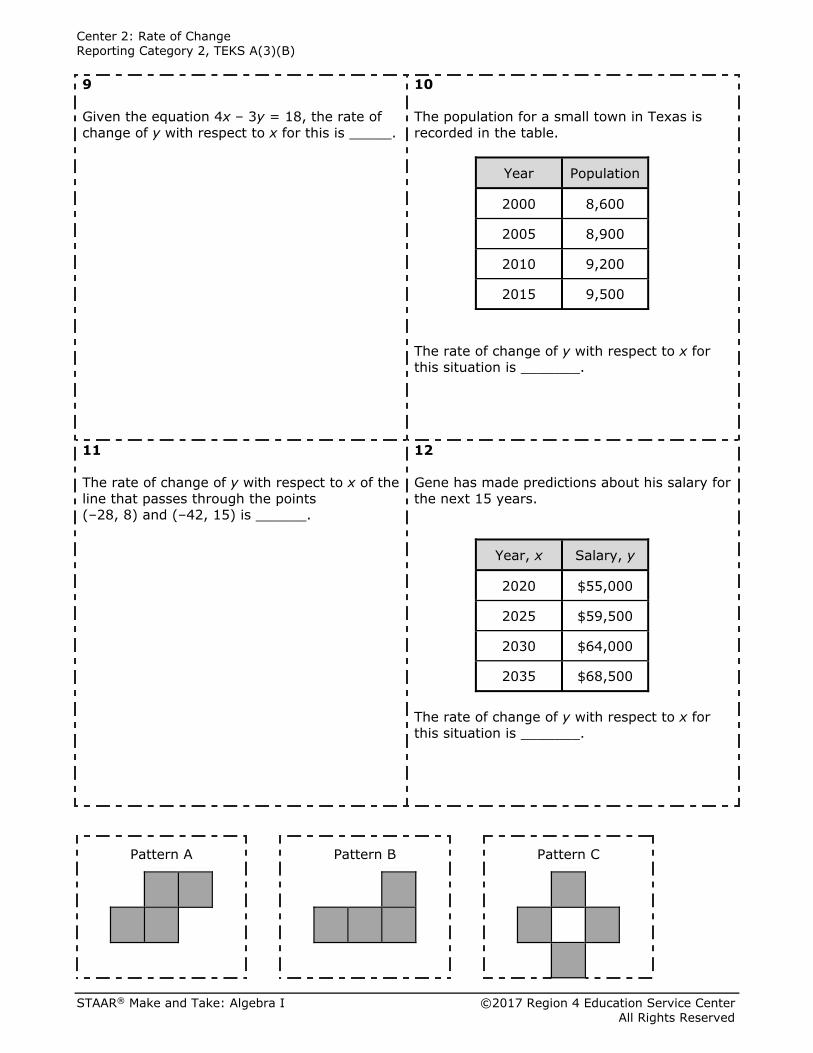
Pattern A Pattern B Pattern C
9 Given the equation 4x – 3y = 18, the rate of change of y with respect to x for this is _____.
10 The population for a small town in Texas is recorded in the table.
Year Population
2000 8,600
2005 8,900
2010 9,200
2015 9,500
The rate of change of y with respect to x for this situation is _______.
11 The rate of change of y with respect to x of the line that passes through the points (‒28, 8) and (‒42, 15) is ______.
12 Gene has made predictions about his salary for the next 15 years.
Year, x Salary, y
2020 $55,000
2025 $59,500
2030 $64,000
2035 $68,500
The rate of change of y with respect to x for this situation is _______.

Name: _________________________________ Date: _____________________
STAAR® Make and Take: Algebra I ©2017 Region 4 Education Service Center All Rights Reserved
Task 3: Rate of Change
Describe how to determine the rate of change of y with respect to x for this situation.
Number of Cars
Washed
Earnings
2 $ 23.00 5 $ 57.50 7 $ 80.50 12 $ 138.00
______________________________________________________________________________
______________________________________________________________________________
______________________________________________________________________________
______________________________________________________________________________
Task 4: Assessment
The answer is _____ because . . . STAAR® Make and Take: Algebra I ©2017 Region 4 Education Service Center All Rights Reserved Name: _________________________________ Date: _____________________
Task 3: Rate of Change
Describe how to determine the rate of change of y with respect to x for this situation.
Number of Cars
Washed Earnings
2 $ 23.00 5 $ 57.50 7 $ 80.50 12 $ 138.00
______________________________________________________________________________
______________________________________________________________________________
______________________________________________________________________________
______________________________________________________________________________
Task 4: Assessment The answer is _____ because . . .