an economic analysis of sports performance in africa · pdf filean economic analysis of sports...
TRANSCRIPT

An Economic Analysis of Sports Performance in Africa
John Luiz1 and Riyas Fadal2
Working Paper Number 162
1 University of Witwatersrand, Wits Business School 2 University of Witwatersrand, Wits Business School

An Economic Analysis of Sports Performance in Africa
John M. Luiz and Riyas Fadal∗
January 28, 2010
Abstract
The purpose of this study is to develop insight into the socio-economic determinants ofAfrican sports performance. Previous studies have argued that a country’s success in sports isdirectly related to the economic resources that are available for those sports. However, factorsthat are used to determine the levels of success for developed countries are not necessarilythe same, or bear the same weight, as for developing countries. The premise of this study isto identify specific factors that increase success in sports in developing countries by means ofseveral econometric specifications, using cross-sectional data for African countries. This studyfinds evidence that suggests that Africa’s performance in sports is dependent on a range of socio-economic factors, which in some respects confirms worldwide studies, but also adds significantnuance.
Keywords: Sports performance, economic determinants, AfricaJEL Codes: L83, J4, L2, O55, Z00
1 IntroductionWhy do some countries win medals whilst others do not? Research conducted internationally toidentify factors that affect sports performance focuses on resource endowments, a country’s popula-tion and cultural and social resources (Kiviaho and Makela 1978; Bernard and Busse 2004; Andreff,2001; Johnson and Ali 2004). It is suggested that countries that are successful in sports have anabundance of financial resources, have a large population and an appropriate climate. The studiestend to suggest that countries such as the United States, Great Britain, and Australia have an ad-vantage in sports competitions due to their economic endowments. The research fails to explain whypoor countries are able often to compete successfully despite these apparent obstacles. For instance,Kenya and Ethiopia excel in middle distance running, Angola in basketball, and the Cameroon infootball. Yet, South Africa, with its economic hegemony on the continent, underperforms relativeto its economic endowment.It can be argued that a country’s success in sport should be evaluated relative to its economic
resources and that medal achievement should therefore be weighted relative to a country’s GrossDomestic Product (GDP) per capita. Utilising this criteria, countries including Mongolia, Jamaica,Zimbabwe and Kenya topped the list of achievement at the Beijing Olympics, while South Africaperformed well below expectation. The discrepancy between actual and predicted achievement fora given amount of resources represents the total inefficiency of resource utilisation. The purpose ofthis study is to explore factors that increase success in sports in developing countries by means ofseveral econometric specifications, using cross-sectional data for African countries.
∗University of the Witwatersrand, Wits Business School
1

2 The Economics of Sport and Sporting PerformanceSport and recreation potentially have a significant impact on a country’s economy. The sport in-dustry creates direct economic benefits through employment, revenue from events, consumables andgeneral taxation. In fact, sport can be considered a composite sector that contributes to hospitalityand tourism, to the textile industry through the manufacture of sports clothing, and to employeeproductivity through activity and health. Sport has assumed an ever greater role within the global-isation process and in the regeneration of national identity .(Nauright 2004). The Olympic Games,The Federation Internationale de Football Association (FIFA) World Championship and other sig-nificant sporting events have become highly sought-after commodities. These events are used asa global platform to create an awareness of the host city, and present the country as an excitingdestination for tourists. In industrialised countries sport contributes to about two percent of annualGDP. For example, in the United States, the sports sector includes the manufacturing of sportsgoods, sports-related services and sports events. Various studies have estimated the size of thesports industry in the US. Depending on the method employed, estimates range from $152 billion(making it the 11thlargest industry), to between $44 and $73 billion (Ashton, Gerrard and Hudson2003; and Humphreys and Ruseski 2009).
2.1 Socio-Economic Determinants of Sporting Performance
Various studies have found that sporting success — or a lack of success — is an outcome of severalfactors, including the financial, social, and population resources of a country (Bernard and Busse2004; Johnson and Ali 2004; Churilov and Flitman 2006). The conclusions are based on an economicand statistical analysis of the relationship between success in sport and variables including: GDPper capita, population, nature of polity, cultural and social resources, home advantage, and levels ofurbanisation.An attempt to conduct a trans-national comparison in sport on the basis of prevailing social
and economic conditions can be challenging. Comparing budgets allocated to sports for differentcountries can provide crude results. Comparisons on the basis of the number of stadia, track andfield training areas or swimming pools, measured on a per capita basis or evaluated in terms of theirdistribution, could be of value but may not be entirely feasible: private ownership and cross-bordersponsorship of sports installations may limit the accuracy of the data. As a result, economistsstudying the relative effects of financial resources on sporting success have been limited to usingaggregate macro-level data.Irrespective of financial and domestic circumstances, a few countries have been able consistently
to excel, through a strategic allocation of resources to sports in which they have developed a com-parative advantage (Hamilton 2000). For instance, some countries have focused their resources onindividual, medal-intensive sports such as swimming and gymnastics, as opposed to team sports,(Tcha 2004, Novikov and Maksimenko 1972).While evidence indicates that economic resources are an important consideration, there are other
factors to consider, too. Local traditions steer talented individuals in the direction of the mostpopular local sport. For example, India has a tendency to promote cricket as opposed to athletics,which helps explain India’s consistent poor performance at multi-sport games. Other examplesof how local traditions promote certain types of sport are the distance runners from Kenya andfencers from Tauberbischofsheim in Germany (Hamilton 2000). Cote et al (2006) conclude that theplace of birth and therefore the benefits of being born in that particular area, contribute to sportsperformance.Tcha and Pershin’s (2003) analysis revealed that certain countries are successful in specific sports
due to their geophysical and climatic conditions. This reasoning has been used in an attempt toexplain Kenya’s success at marathon running, even though countries that have similar altitudes andclimates have not been as successful as Kenya. According to a review by Bernard and Busse (2004),
2

there is a lack of consensus regarding the relationship between geographic variables and sportingsuccess.It is assumed that countries with relatively larger populations provide a wider pool of athletes to
compete. Johnson and Ali (2004) find that, in the 1996 Olympic Games, nations that won at leastone summer medal had a population five times greater than non-medal populations. It is possiblethat the fixed costs of training, infrastructure and facilities can be shared more effectively acrosslarge populations (Rathke and Woitek 2008). However, population levels alone may not be sufficientto explain success (Condon, Golden and Wasil 1999). India, with a population of 1.5 billion peopleis relatively unsuccessful at the Olympic Games. It appears that the effect of a large populationmay only be positive for relatively wealthy countries that are able to allocate additional resourcesto sports development (Kuper and Sterken 2001). Hoffmann et al (2002) could not find evidenceto suggest that success in soccer is dependent on the size of a country’s population. They were,however, able to prove that success is dependent on population size if the population spoke Latin ora derivative of Latin, which they included as dummy variables. This is likely to be football specific.
2.2 Econometric Evidence
The determinants of sporting success have been investigated in many studies (Kiviaho and Makela1978; Baimbridge 1998; Condon et al. 1999; Kuper and Sterken 2001; Hoffmann, Ging and Ra-masamy 2002, 2004; Tcha and Pershin 2003; Bernard and Busse 2004; Johnson and Ali 2004; Matrosand Namoro 2004). The researchers utilised Olympic medal counts as a dependent variable, to rep-resent Olympic success, and socio-economic variables as independent variables. Some authors triedto improve on the methodology of the previous studies by utilising weighted medal counts, modifiedregression analysis, and including White-corrected errors to account for heteroskedasticity (Condonet al. 1999; Tcha and Pershin 2003; Bernard and Busse 2004). Two macro-economic variables,namely GDP and population, were consistently associated with sporting success. There were fewerconsensuses regarding other variables, including land mass, polity, urbanisation, health and culture.All of the studies included Olympic medal achievement, or a variant, as a proxy for sporting success.Hoffmann et al .(2002) utilised FIFA rankings and points allocated, but only included countries thatachieved medals at the previous summer Olympics and excluded zero-medal countries to adjust forcensored data. Their results were in keeping with the common consensus. The studies are based onthe assumption that there is equal sporting talent throughout the world, and every nation has equalopportunity of producing competitive athletes.According to the models based on GDP and population, African countries are predicted to win
few, or no medals (Bernard and Busse 2004; Johnson and Ali 2004). These models are sufficient forpredictions in the developed world and for non-medal winning countries, but are poor predictors ofmedal winning in African countries. According to the models, South Africa was predicted to winten medals, Tunisia five and Kenya two. The actual medal tally was South Africa and Tunisia withone medal and Kenya with 14 (Johnson and Ali 2004; Hawksworth 2008). Theories and models usedfor developed market economies may not be appropriate for developing economies. De Bosscher etal (2006) cite research which finds that the importance of these variables in explaining internationalsporting success has decreased over the last two decades and may only explain 45% of successafter1980. Further research into sporting success is warranted and may include delving further intothe systems of sport.
3 Empirical Methodology and Estimation ResultsThe research includes the development of several econometric models utilising variables identifiedin the literature above. Several studies have reported variables that impact on sports performance,specifically at the Olympic Games (Kiviaho and Makela 1978; Bernard and Busse 2004; Johnsonand Ali 2004). The four models developed below labelled A, B, C and D are representative of the
3
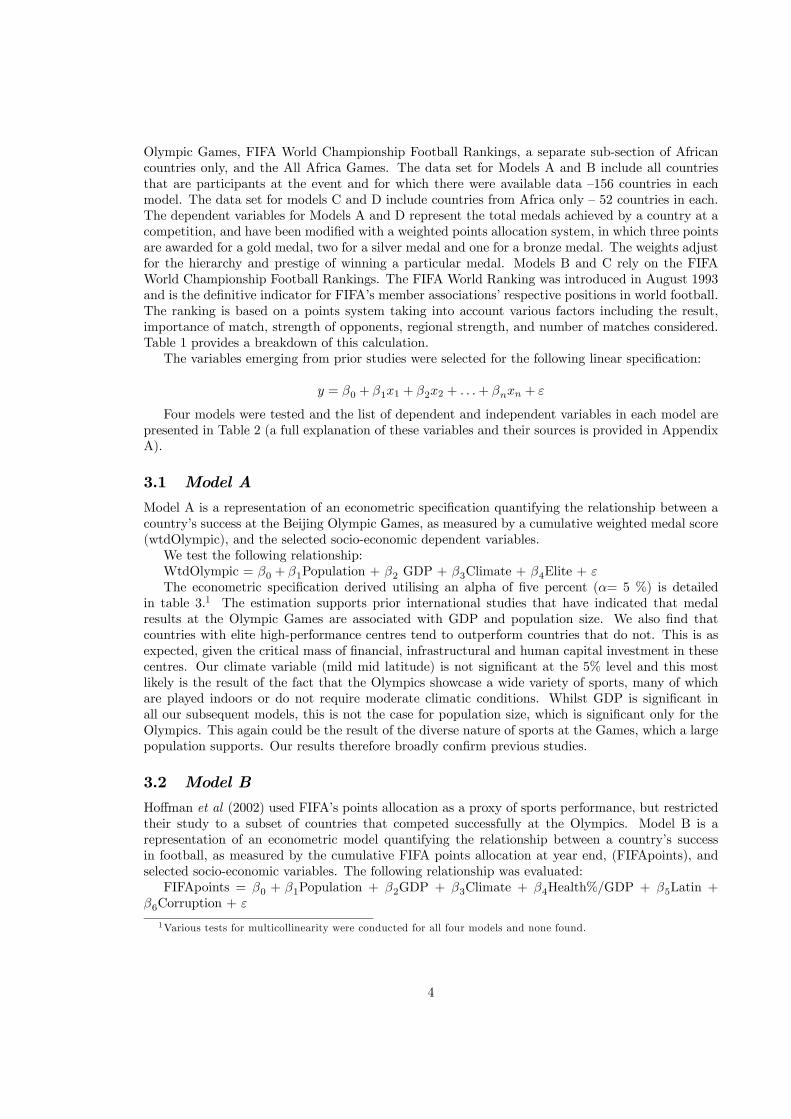
Olympic Games, FIFA World Championship Football Rankings, a separate sub-section of Africancountries only, and the All Africa Games. The data set for Models A and B include all countriesthat are participants at the event and for which there were available data —156 countries in eachmodel. The data set for models C and D include countries from Africa only — 52 countries in each.The dependent variables for Models A and D represent the total medals achieved by a country at acompetition, and have been modified with a weighted points allocation system, in which three pointsare awarded for a gold medal, two for a silver medal and one for a bronze medal. The weights adjustfor the hierarchy and prestige of winning a particular medal. Models B and C rely on the FIFAWorld Championship Football Rankings. The FIFA World Ranking was introduced in August 1993and is the definitive indicator for FIFA’s member associations’ respective positions in world football.The ranking is based on a points system taking into account various factors including the result,importance of match, strength of opponents, regional strength, and number of matches considered.Table 1 provides a breakdown of this calculation.The variables emerging from prior studies were selected for the following linear specification:
y = β0 + β1x1 + β2x2 + . . .+ βnxn + ε
Four models were tested and the list of dependent and independent variables in each model arepresented in Table 2 (a full explanation of these variables and their sources is provided in AppendixA).
3.1 Model A
Model A is a representation of an econometric specification quantifying the relationship between acountry’s success at the Beijing Olympic Games, as measured by a cumulative weighted medal score(wtdOlympic), and the selected socio-economic dependent variables.We test the following relationship:WtdOlympic = β0 + β1Population + β2 GDP + β3Climate + β4Elite + εThe econometric specification derived utilising an alpha of five percent (α= 5 %) is detailed
in table 3.1 The estimation supports prior international studies that have indicated that medalresults at the Olympic Games are associated with GDP and population size. We also find thatcountries with elite high-performance centres tend to outperform countries that do not. This is asexpected, given the critical mass of financial, infrastructural and human capital investment in thesecentres. Our climate variable (mild mid latitude) is not significant at the 5% level and this mostlikely is the result of the fact that the Olympics showcase a wide variety of sports, many of whichare played indoors or do not require moderate climatic conditions. Whilst GDP is significant inall our subsequent models, this is not the case for population size, which is significant only for theOlympics. This again could be the result of the diverse nature of sports at the Games, which a largepopulation supports. Our results therefore broadly confirm previous studies.
3.2 Model B
Hoffman et al (2002) used FIFA’s points allocation as a proxy of sports performance, but restrictedtheir study to a subset of countries that competed successfully at the Olympics. Model B is arepresentation of an econometric model quantifying the relationship between a country’s successin football, as measured by the cumulative FIFA points allocation at year end, (FIFApoints), andselected socio-economic variables. The following relationship was evaluated:FIFApoints = β0 + β1Population + β2GDP + β3Climate + β4Health%/GDP + β5Latin +
β6Corruption + ε
1Various tests for multicollinearity were conducted for all four models and none found.
4

The econometric specification derived utilising an alpha of five percent (α= 5 %) is detailed intable 4. The estimation confirms GDP as being positively and significantly associated with betterperformance in world football in line with previous studies. Furthermore the inclusion of the Latindummy variable is significant as in prior studies. Our climatic variable is significant, indicatingthat countries with mild climates at mid latitudes have a competitive advantage relative to thoselocated at more unfavourable conditions. Lastly we find that higher levels of health spend as apercentage of GDP is positively associated with better football performance, presumably reflectingbetter population health which in turn supports more robust football players.We included a proxy for corruption to test for organisational effects, although it is insignificant.
The corruption variable is a Transparency International Index and represents the perception ofcorruption in a country. The index ranges from zero to ten, with ten indicating the best perceptionof a country (i.e. lowest corruption), and zero indicating the highest perception of corruption in acountry. Figure 1 shows a scatter plot of perceived corruption (CPI) versus GDP per capita andFIFA points. It illustrates a positive relationship in each case indicating that lower corruption isassociated with higher GDP per capita and higher FIFA rankings.
3.3 Model C
The model specification described in the literature discounts the effects of specific factors which affectsports performance in African countries. Most African countries perform poorly at the Olympics.As a result, subsequent models developed for sports performance specified for the Olympics, dif-ferentiates poorly for African countries. This study accommodates African countries by modellingsports performance at the All Africa Games and by examining a sub-section of African FIFA coun-tries. Model C examines the factors affecting the performance of African countries, using the FIFApoint system as the dependent variable. It is therefore a re-run of Model B, applied to 52 Africancountries. We do, however, drop the Latin variable, as it is largely irrelevant in the African context.Table 5 presents the results.In this case our estimation finds only GDP to be significantly associated with better football
performance . None of the other variables that came through as significant in Model B for all FIFAcountries, including climate and health, appear significant when we focus on the 52 African countriesonly. The main driver of football performance in Africa is the size of a country’s economy, indirectlyreflecting the prominent role that money plays in football — even in poorer developing countries. Inthe case of Africa it may well reflect the lack of basic sporting facilities in the poorest countries;GDP may act as a useful proxy for such sport investment.
3.4 Model D
Model D is a representation of an econometric model which quantifies the relationship betweena country’s success at the All Africa Games, as measured by a cumulative weighted medal score(wtdAfrica), and the selected socio-economic and organisational dependent variables. The followingrelationship was evaluated:WtdAfrica = β0 + β1GDP + β2 Climate + β3Education +β4 Health%/GDP + β5 Corruption
+ εThe econometric specification derived using an alpha of five percent (α= 5 %) is detailed in table
6. The All Africa Games represent a multitude of sport and is thus more representative of the typesof sports conducted at the Olympic Games. GDP once again is positively associated with betterperformance and is highly significant. Our climate variable is significant, with dry climate beingpositively related to performance. Our final variable that is significant is education, which capturesthe percentage of the population that enrolled for formal secondary education. It indicates thathaving a greater proportion enrolled in secondary education is associated with better performancein high-level sport. This could reflect various possibilities, with one explanation being that it is a
5

proxy for better coaching and administrative/managerial staff in sporting administrations. It couldalso reflect the fact that skill levels in some sports may be associated with overall skill levels, whichwould be captured by educational enrolment.Our research has thus confirmed some previous results but also illustrated the nuance required
when examining the case of African sporting performance. The one result which is consistentthroughout the four model specifications is the importance of GDP. Regardless of whether oneis looking at the Olympics, FIFA points, the All Africa Games or indeed a sub-section of Africancountries — GDP matters for sport performance. A summary of the results is presented in Table 7.This study adds further evidence to the Revealed Comparative Advantage (RCA) theory pro-
posed by Tcha and Pershin (2003), by explaining and developing the association between high incomeand sports performance. Countries with larger GDPs have a higher probability of exploiting andcreating a dynamic comparative advantage. Whilst variables like climate may be associated withstatic comparative advantage, larger economies allow one the possibility of creating comparative ad-vantage through excellence in coaching and through high-quality facilities for example. In additionto a higher income, a country needs to allocate its resources appropriately to realise its compara-tive advantage. The theory of RCA is incomplete without considering that the required allocationmay be misspecified without alluding to allocative and technical efficiency. A modified perspectivesuggests that countries that have a higher GDP, and that are able to allocate and utilise the re-sources efficiently, will have an increased probability of success in sports (Gerrard, 2005). This maybe a more feasible explanation in describing the success of Great Britain and Australia in sports(Bloomfield, 2002; Green, 2004). In as much as there is an abundance of financial input by thegovernments of both Australia and Great Britain, both sports systems were forced into change toensure that the financial inputs were appropriately utilised to maximise the output ...(Green andOakley 2001). It may also account for the fact that whilst South Africa is the economic powerhouseon the continent, it has not been able to translate that into any real comparative advantage. Thus,although GDP is one component of sports success, it needs to be translated effectively into medalsand points through a competent production function. Some countries are more successful at thistranslation process than others.
4 ConclusionSport is tied intimately to issues of national pride and has the potential to transcend deep divides infragmented societies. But it also has the capacity to further polarize and expose underlying schisms.Matters are complicated further by the fact that sport is big business. This research has shownthat money does indeed matter: GDP was the overwhelmingly consistent dependent variable in allfour models tested. Interestingly we do find important shades of distinction between the variousdependent variables. With respect to the Olympics, besides GDP, we also indicate the importanceof population size and elite facilities. Climate does not seem to matter in sporting success, whichis probably the result of the diversity of sports represented at the Olympics, many of them indoors.On the other hand, football success is explained by GDP, climate and health spending for all FIFAcountries, but, when only African countries are considered, only GDP appears significant. In thecase of the All Africa Games, the explanatory power of GDP and climate are confirmed, and theimportance of education is introduced.Previous studies have treated countries as a homogenous grouping and allowed the broad ag-
gregates to reveal the determinants. In this study we focus on a sub-group of countries that arerelatively poor, have had a complex past with colonial masters, and that generally have weak ad-ministrative structures. We find that a country’s performance in sports is not only dependent onfinancial resources, but also on the level of investment in education and health. This raises interest-ing questions. In a developing country, sport is a luxury good and one needs to question whethercountries should indeed be preferentially allocating funds directly to sports performance, or whether
6

they should rather concentrate on improving economic growth, education and health which may inany event indirectly promote an improved sports performance.On the African continent, South Africa is an interesting case of underachievement, given its
relatively high level of resources. It has the largest GDP on the continent by a large margin, butis ranked only 17th amongst African countries in football, with poor countries like Guinea, Congo,Uganda and Angola featuring higher up the rankings. Likewise, at the summer Olympics in Beijing,South Africa was ranked 12th amongst African countries, with Kenya, Ethiopia and Zimbabweachieving superior positions. The bang for buck in South Africa in terms of its production functionis poor and this reveals internal problems and inconsistencies. The promotion in South Africa ofmass access and efforts to eradicate the inequalities of the past contrast with the single-mindedfocus in other countries on pushing medals. While not the focus of this study, this does expose theclassic dilemma where organisations face a multitude of performance indicators and goals, but donot reconcile these fully into an overarching mission. It also illustrates the importance of furtherstudy at the micro and organisational level within sport (see Weinberg and McDermott, 2002).There is a lack of research in the field of sports and organisational economics especially in
emerging countries. This paper used cross-sectional data to suggest that sporting performance isdependent on a range of socio-economic and organisational determinants. Future research shouldfocus on longitudinal studies of countries and their sport performance over time. Panel studies,case studies eliciting a detailed understanding of a chosen country or organisation and its sportsperformance, and impact assessments of real interventions, would also be valuable.
References[1] Andreff, W. (2001) The correlation between economic underdevelopment and sport, European
Sport Management Quarterly, 1(4), pp. 251 - 279.
[2] Ashton, A. J. K., Gerrard, B. and Hudson, R. (2003) Economic impact of national sportingsuccess : evidence from the London stock exchange, Applied Economics Letters, 10(12), pp.783-785.
[3] Baimbridge, M. (1998) Outcome uncertainty in sporting competition : the Olympic Games1896-1996, Applied Economics Letters, 5(3), pp. 161-164.
[4] Bernard, A. B. and Busse, M. R. (2004) Who Wins the Olympic Games : Economic Resourcesand Medal Totals, The Review of Economics and Statistics, 86(1), pp. 413-511.
[5] Bloomfield, J. (2002) The contribution of sports science and sports medicine to the developmentof the Australian sports system, Journal of Science and Medicine in Sport, 5(1), pp. 1-7.
[6] Churilov, L. and Flitman, A. (2006) Towards fair ranking of Olympics achievements: the caseof Sydney 2000, Computers and Operations Research, 33(7), pp. 2057-2082.
[7] Condon, E., Golden, B. L. and Wasil, A. E. (1999) Predicting the success of nations at theSummer Olympics using neural networks, Computers and Operations Research, 26(13), pp.1243-1265.
[8] Cote, J., Macdonald, D. J., Baker, J. and Abernethy, B. (2006) When " where" is more impor-tant than " when" : Birthplace and birthdate effects on the achievement of sporting expertise,Journal of Sports Sciences, 24(10), pp. 1065-1073.
[9] De Bosscher, V., De Knop, P., Bottenburg, V. M. and Shibli, S. (2006) A Conceptual Frameworkfor Analysing Sports Policy Factors Leading to International Sporting Success, European SportManagement Quarterly, 6(2), pp. 185-215.
7

[10] Gerrard, G. B. (2005) A resource - utilization model of organizational efficiency in professionalsports teams, Journal of Sport Management, 19(2), pp. 143-169.
[11] Green, M. (2004) Changing policy priorities for sport in England : the emergence of elite sportdevelopment as a key policy concern, Leisure Studies, 23(4), pp. 365-383.
[12] Green, M. and Oakley, B. (2001) Elite sport development systems and playing to win : unifor-mity and diversity in international approaches, Leisure Studies, 20(4), pp. 247-267.
[13] Hamilton, B. (2000) East African running dominance: what is behind it?, British Journal ofSports Medicine„ 34(5), pp. 391-394.
[14] Hawksworth, J. (2008) ’Economic Briefing Paper: Modelling Olympic Performance’, Pricewa-terhouseCoopers, June 2008, pp. 1-8.
[15] Hoffmann, R., Ging, L. C. and Ramasamy, B. (2002) The Socio-Economic Determinants ofInternational Soccer Performance, Journal of Applied Economics, 5(2), pp. 253-272.
[16] Hoffmann, R., Ging, L. C. and Ramasamy, B. (2004) Olympic Success and ASEAN Countries:Economic Analysis and Policy Implications, Journal of Sports Economics, 5(3), pp. 262-276.
[17] Humphreys,B.R. and Ruseski,J.E. (2009) Estimates of the Dimensions of the Sports Market inthe US. International Journal of Sports Finance. 4(2): 94-113.
[18] International Forum on Elite Sport (2005) Data base of the high performance centres worldwide,last accessed 5 February 2009, from http://www.forumelitesport.org/.
[19] Johnson, D. K. and Ali, A. (2004) A Tale of Two Seasons : Participation and Medal Counts atthe Summer and Winter Olympic Games Social Science Quarterly, 85(4), pp. 974-993.
[20] Kiviaho, P. and Makela, P. (1978) Olympic Success: A sum of Non-Material and MaterialFactors, International Review for the Sociology of Sport, 13(2), pp. 5-22.
[21] Kuper, G. H. and Sterken, E. (2001) Olympic Participation and Performance since 1896, Mimeo.Department of Economics, University of Groningen.
[22] Martin, G. S., Arin, P. K., Palakshappa, N. and Chetty, S. (2005) Do elite sports systems meanmore Olympic medals?, pp. 1-14, Massey University, Auckland, New Zealand
[23] Matros, A. and Namoro, S. D. (2004) Economic Incentives of the Olympic Games, Mimeo,University of Pittsburg.
[24] Nauright (2004) Global Games: Culture, Political Economy and Sport in the Globalised Worldof the 21st Century, Third World Quarterly, 25(7), pp. 1325-1336.
[25] Novikov, A. D. and Maksimenko, A. M. (1972) The influence of selected socio-economic fac-tors on the level of sports achievement in the various countries, International Review of SportSociology, 7, pp. 27-40.
[26] Rathke, A. and Woitek, U. (2008) Economics and the Summer Olympics: An Efficiency Analy-sis, Journal of Sports Economics, 9(5), pp. 520-537.
[27] Tcha, M. (2004) The Color of Medals: An Economic Analysis of the Eastern and Western Blocs’Performance in the Olympics, Journal of Sports Economics, 5(4), pp. 311-328.
[28] Tcha, M. and Pershin, V. (2003) Reconsidering Performance at the Summer Olympics andRevealed Comparative Advantage, Journal of Sports Economics, 4(3), pp. 216-239.
8

[29] Transparency International (2007) Corruption Perception Index, last, fromhttp://www.transparency.org/
[30] United Nations Database (2009), last accessed 02 February 2009, from http://data.un.org.
[31] Weinberg, R. and McDermott, M. (2002) A Comparative Analysis of Sport and Business Or-ganizations: Factors Perceived Critical for Organizational Success, Journal of Applied SportPsychology, 14(4), pp. 282 - 298.
9

Table 1 - Basic Calculation Criteria of FIFA World Rankings
Matches All international “A” matches
Result: Win-Draw-Defeat 3 points – 1 points – 0 points
Importance of match 1 (friendly match) to 4 (FIFA World Cup)
Strength of opponent Position in world ranking (no 1 = 2.00, no. 30 = 1.70, no 118 = 0.82 etc.)
Formula: [200 - Position] / 100
Regional strength Based on results in last three FIFA World Cups (wins per confederation per match)
Period Last four years, gradual decline in importance of results: 100% - 50% - 30 % - 20 %
Number of matches considered per year
Average points gained from all matches in last 12 months (minimum: 5 matches)
Source: www.FIFA.com
10

Table 2 - A list of variables utilised for the development of the econometric models
Description of Model Dependent variable Independent Variables
Model A
A sample of 152 countries
Beijing Olympics, 2008
Weighted Olympic Medals
3 points for a gold
2 points for a silver
1 point for a bronze
Elite
Log GDP
Log Population
Mild mid latitude
Model B
A sample of 152 countries
FIFA 2008 Rankings
Points at year end Corruption Perception Index
Latin
Log GDP
Log Population
Mild mid latitude
Health spending as % of GDP
Model C
A sample of 52 countries
FIFA 2008 Rankings: African Countries Only
Points at year end Corruption Perception Index
Log GDP
Log Population
Mild mid latitude
Health spending as % of GDP
Model D
A sample of 52 countries
All Africa Games, 2007
Weighted All Africa Medals
3 points for a gold
2 points for a silver
1 point for a bronze
Corruption Perception Index
Dry Climate
Education
Log GDP
11
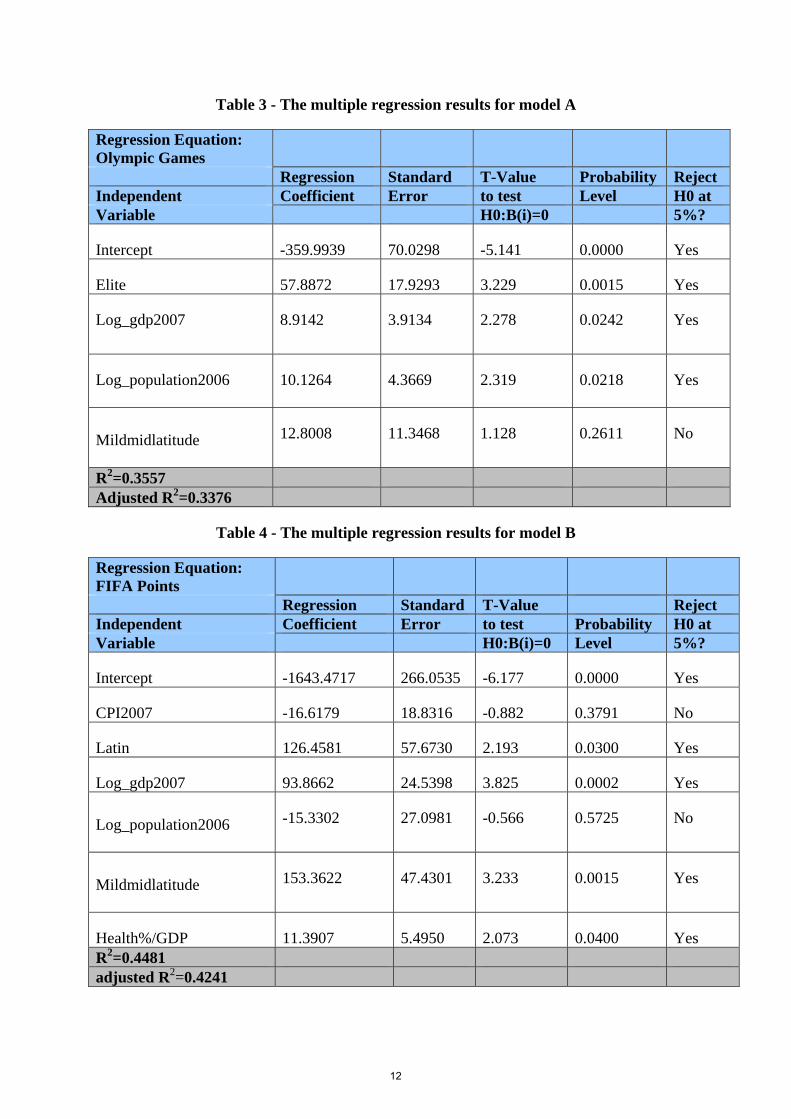
Table 3 - The multiple regression results for model A
Regression Equation: Olympic Games Regression Standard T-Value Probability Reject Independent Coefficient Error to test Level H0 at Variable H0:B(i)=0 5%?
Intercept -359.9939 70.0298 -5.141 0.0000 Yes
Elite 57.8872 17.9293 3.229 0.0015 Yes
Log_gdp2007 8.9142 3.9134 2.278 0.0242 Yes
Log_population2006
10.1264 4.3669 2.319 0.0218 Yes
Mildmidlatitude
12.8008 11.3468 1.128 0.2611 No
R2=0.3557 Adjusted R2=0.3376
Table 4 - The multiple regression results for model B
Regression Equation: FIFA Points Regression Standard T-Value Reject Independent Coefficient Error to test Probability H0 at Variable H0:B(i)=0 Level 5%?
Intercept -1643.4717 266.0535 -6.177 0.0000 Yes
CPI2007 -16.6179 18.8316 -0.882 0.3791 No
Latin 126.4581 57.6730 2.193 0.0300 Yes
Log_gdp2007 93.8662 24.5398 3.825 0.0002 Yes
Log_population2006
-15.3302 27.0981 -0.566 0.5725 No
Mildmidlatitude
153.3622 47.4301 3.233 0.0015 Yes
Health%/GDP 11.3907 5.4950 2.073 0.0400 Yes R2=0.4481 adjusted R2=0.4241
12
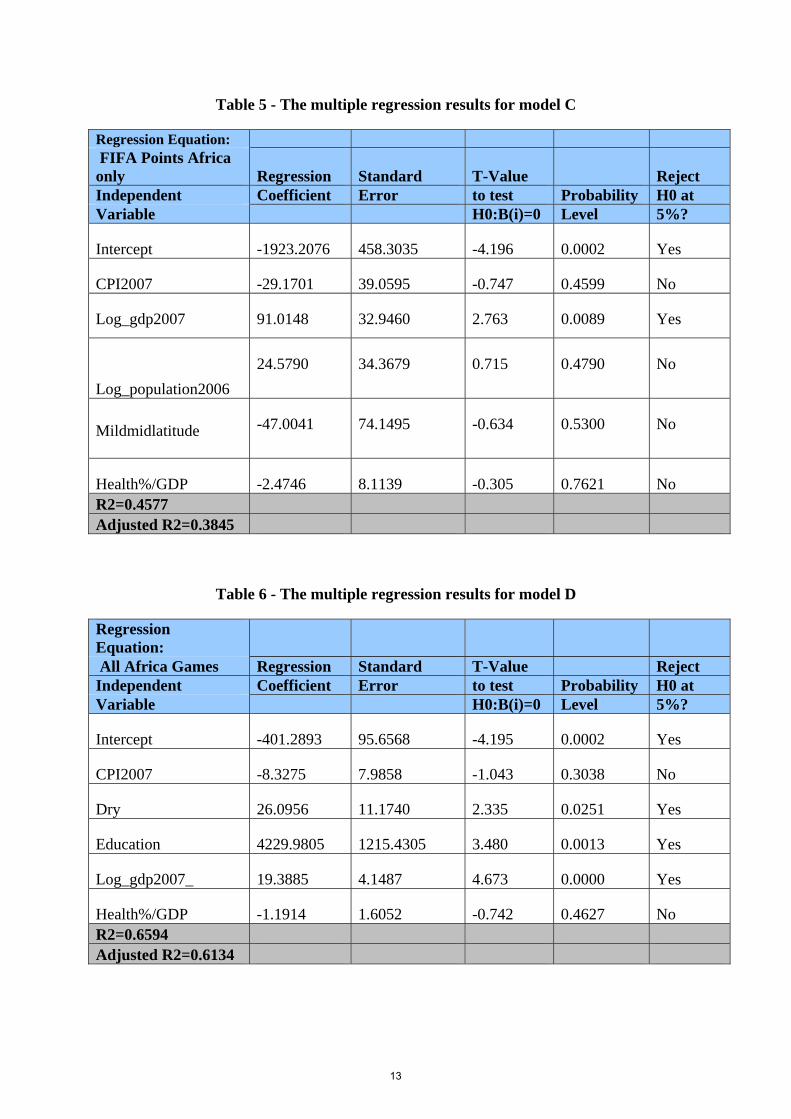
Table 5 - The multiple regression results for model C
Regression Equation: FIFA Points Africa only Regression Standard T-Value Reject Independent Coefficient Error to test Probability H0 at Variable H0:B(i)=0 Level 5%?
Intercept -1923.2076 458.3035 -4.196 0.0002 Yes
CPI2007 -29.1701 39.0595 -0.747 0.4599 No
Log_gdp2007 91.0148 32.9460 2.763 0.0089 Yes
Log_population2006 24.5790 34.3679 0.715 0.4790 No
Mildmidlatitude
-47.0041 74.1495 -0.634 0.5300 No
Health%/GDP -2.4746 8.1139 -0.305 0.7621 No R2=0.4577 Adjusted R2=0.3845
Table 6 - The multiple regression results for model D
Regression Equation: All Africa Games Regression Standard T-Value Reject Independent Coefficient Error to test Probability H0 at Variable H0:B(i)=0 Level 5%?
Intercept -401.2893 95.6568 -4.195 0.0002 Yes
CPI2007 -8.3275 7.9858 -1.043 0.3038 No
Dry 26.0956 11.1740 2.335 0.0251 Yes
Education 4229.9805 1215.4305 3.480 0.0013 Yes
Log_gdp2007_ 19.3885 4.1487 4.673 0.0000 Yes
Health%/GDP -1.1914 1.6052 -0.742 0.4627 No R2=0.6594 Adjusted R2=0.6134
13
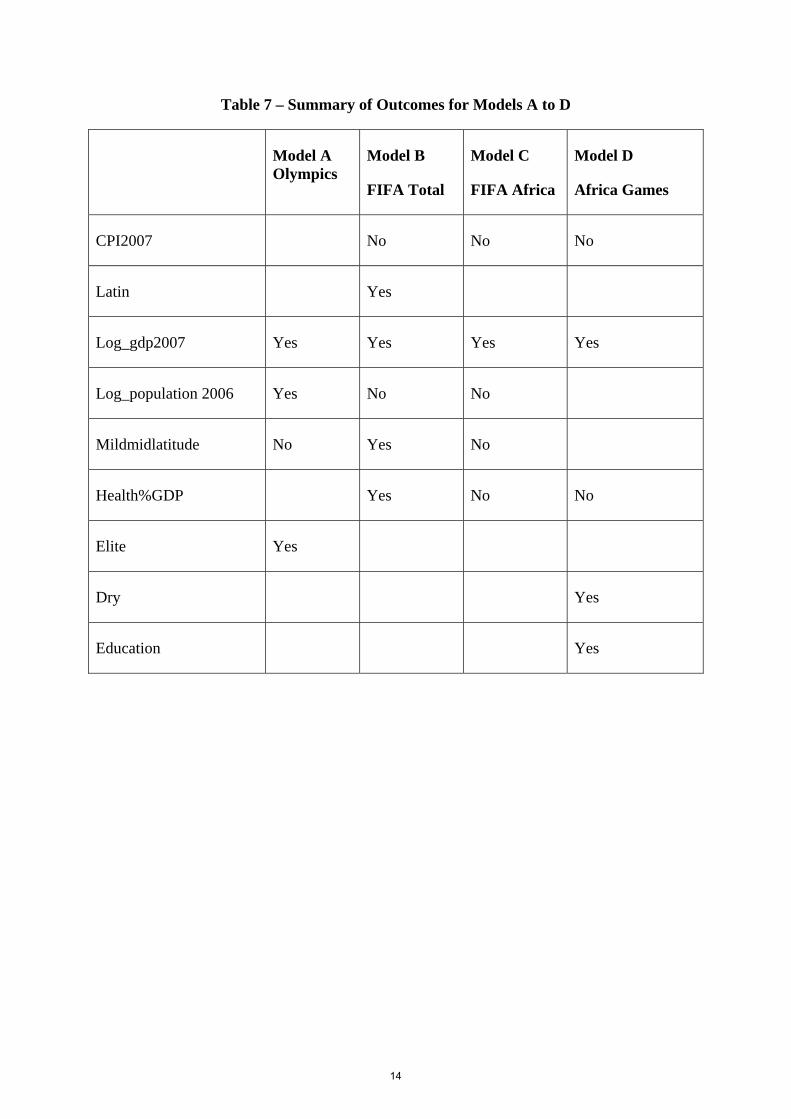
Table 7 – Summary of Outcomes for Models A to D
Model A Olympics
Model B
FIFA Total
Model C
FIFA Africa
Model D
Africa Games
CPI2007 No No No
Latin Yes
Log_gdp2007 Yes Yes Yes Yes
Log_population 2006 Yes No No
Mildmidlatitude No Yes No
Health%GDP Yes No No
Elite Yes
Dry Yes
Education Yes
14

0.0
666.7
1333.3
2000.0
0.0 3.3 6.7 10.0
Fifa_points_2008 vs cpi2007
cpi2007
Fifa
_poi
nts_
2008
0.0
26666.7
53333.3
80000.0
0.0 3.3 6.7 10.0
gdp_c vs cpi2007
cpi2007
gdp_
c
Figure 1 – Scatter plot of perceived corruption index (CPI) versus GDP per capita and FIFA points
15

Appendix A – Data, Variables and Data Sources
The independent variables selected for this research include:
GDP and Population: data for these variables have been obtained from the United Nations Database (2009).
Latin: The variable “Latin” represents countries that have a common Luso-Hispanic culture. This variable is a categorical variable and is represented as a dummy variable. Categorical variables are assigned a value of one (1) for all Latin Central and South American countries including Spain and Portugal, and a zero (0) for other countries (Hoffmann et al. 2002).
Total Health Spend as a percentage of GDP (Health%/GDP): This variable is used as a proxy to represent the allocation of resources in a country towards overall wellness, and is further indicative of a population’s health (Source: United Nations Database, 2009).
Education: This variable has been calculated using data gathered from the United Nations Database (2009). The education variable represents the percentage of the population that is enrolled for formal secondary education. The variable has been selected to represent the allocation of resources in a country towards education, and as a proxy for the level of administrative skills of employees.
Elite: It is a categorical variable and denotes countries that had an established High Performance Centre prior to 2005. This variable is represented as a dummy variable, which is assigned a value of one (1) for countries that have a High Performance Centre, and a zero (0) for other countries (Martin et al. 2005). The data is gathered from http://www.forumelitesport.org (International Forum on Elite Sport, 2005).
Climate: Climate information was obtained utilising the Koppen-Geiger climate classification (KGT) and by visual inspection of the KGT climatic world map from http://www.worldclimate.com. The KGT classification is based on climate zone boundaries, which are delineated by vegetation distribution, combined average annual and monthly temperature, and the seasonality of precipitation. Countries are grouped according to Tropical, Dry, Mild mid altitude (temperate), Continental or Polar climates.
Corruption Perception Index (CPI2007): This variable represents the perception of
corruption by multinational firms and institutions as impacting on commercial or social life.
It is developed as a public opinion survey that assesses the general public’s perception and
experience of corruption around the world. This variable is utilised as a proxy for corporate
governance. The data was retrieved from http://www.transparency.org (Transparency
International 2007)
16