analysis: customer satisfaction survey ‘03 city of … · dms # 304154 1 of 33 analysis: customer...
TRANSCRIPT

DMS # 304154 1 of 33
������������ ������������
����� ����������
Analysis: Customer Satisfaction Survey ‘03
City of UMhlathuze
�����������������������
���������� �������������� ������������ ���
������ �!��!"#�083 275 2834�
DMS # 304154 2 of 33
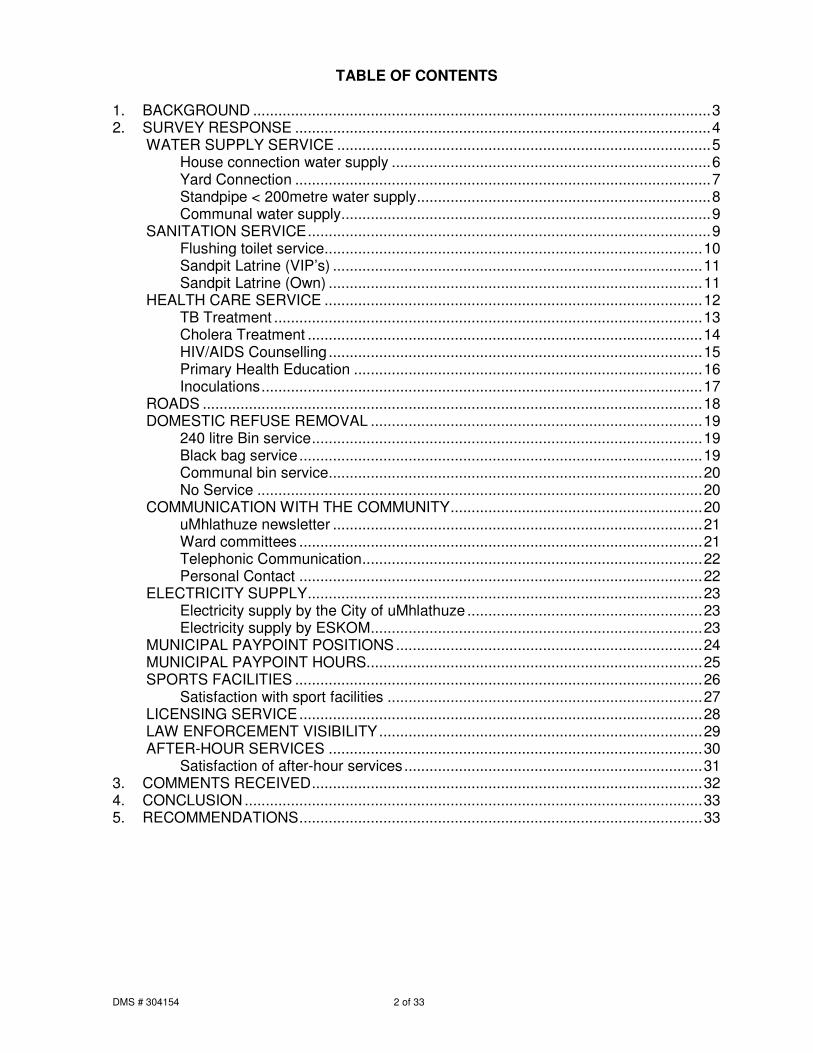
TABLE OF CONTENTS 1. BACKGROUND .............................................................................................................3 2. SURVEY RESPONSE ...................................................................................................4
WATER SUPPLY SERVICE .........................................................................................5 House connection water supply ............................................................................6 Yard Connection ...................................................................................................7 Standpipe < 200metre water supply......................................................................8 Communal water supply........................................................................................9
SANITATION SERVICE................................................................................................9 Flushing toilet service..........................................................................................10 Sandpit Latrine (VIP’s) ........................................................................................11 Sandpit Latrine (Own) .........................................................................................11
HEALTH CARE SERVICE ..........................................................................................12 TB Treatment ......................................................................................................13 Cholera Treatment ..............................................................................................14 HIV/AIDS Counselling .........................................................................................15 Primary Health Education ...................................................................................16 Inoculations.........................................................................................................17
ROADS .......................................................................................................................18 DOMESTIC REFUSE REMOVAL ...............................................................................19
240 litre Bin service.............................................................................................19 Black bag service................................................................................................19 Communal bin service.........................................................................................20 No Service ..........................................................................................................20
COMMUNICATION WITH THE COMMUNITY............................................................20 uMhlathuze newsletter ........................................................................................21 Ward committees ................................................................................................21 Telephonic Communication.................................................................................22 Personal Contact ................................................................................................22
ELECTRICITY SUPPLY..............................................................................................23 Electricity supply by the City of uMhlathuze ........................................................23 Electricity supply by ESKOM...............................................................................23
MUNICIPAL PAYPOINT POSITIONS.........................................................................24 MUNICIPAL PAYPOINT HOURS................................................................................25 SPORTS FACILITIES .................................................................................................26
Satisfaction with sport facilities ...........................................................................27 LICENSING SERVICE................................................................................................28 LAW ENFORCEMENT VISIBILITY.............................................................................29 AFTER-HOUR SERVICES .........................................................................................30
Satisfaction of after-hour services.......................................................................31 3. COMMENTS RECEIVED.............................................................................................32 4. CONCLUSION .............................................................................................................33 5. RECOMMENDATIONS................................................................................................33

DMS # 304154 3 of 33
1. BACKGROUND A Customer Satisfaction Survey needs to be conducted annually to obtain statistical data for the quality indicators developed within the Performance Management Framework of the municipality. The customer satisfaction index is further required to review annual performance targets for services delivered by the municipality. The previous Customer Satisfaction Survey for 2001\2002 financial year was done as part of the previous Socio Economic Survey whereby only the most important services in respect of National Key Performance Indicators were covered. Students from the University of Zululand were engaged in the data collection and data capturing process. As part of the fixed retainer, AST Consulting (Richards Bay) performed the data analysis and reporting function. Although the previous survey covered the geographical area of jurisdiction of the uMhlathuze Municipality, the results of the survey were not within the required accuracy (95%) and confidence (±5%) levels due to a lack of sufficient funding for the statistical required sample size of the survey. Dr. John Boughey from UNIZUL, who was involved in the previous customer satisfaction survey, was again approached to manage the data collection process, as his team of students is familiar with the total area of jurisdiction of the uMhlathuze Municipality. As part of the fixed retainer, AST Consulting (Richards Bay) again performed the data analysis and reporting function.
The total number of households in the uMhlathuze area of jurisdiction used for national indicators (38 152 households) according to the uMhlathuze Water Services Development Plan was used as basis. The geographical distribution and the following population sample size, calculated to ensure statistical accuracy of the survey, as reflected in the number of questionnaires, were utilised to ensure the statistical accuracy of the survey as follows:
Urban Areas Number of households
% Of total population
Number of Questionnaires per area
Richards Bay 6 142 16.0 % 480 Empangeni 3 529 9,0 % 295 Nseleni 1 872 5.0 % 150 Esikawini 7 359 19.5 % 585 Ngwelezane 2 187 6.0 % 210 Vulindlela 286 1,0 % 40 Felixton 129 0.5 % 0 21 504 57.0 % 1 760 Tribal Areas Number of
households % Of total population
Number of Questionnaires per area
Bhejane Khoza 3 794 10.0 % 320 Dube 1 586 4.0 % 160 Madlebe 6 209 16.0 % 500 Mhkwanazi North 5 059 13.0 % 130 Mhkwanazi South 130 16 648 43.0 % 1 240 Total 38 152 100% 3 000
The previous questionnaire was amended to include questions pertaining to additional services delivered by the municipality. A further pre-requisite was that the information received be captured separately for each of the different areas and be available as per distribution table above. This will ensure management information for each service delivered per geographical area. For the purpose of this report the results will be illustrated for the total area of jurisdiction as well as separate response for the urban areas and for the Tribal areas. Information on all the questions is available on all the different areas, with a further breakdown per suburb in Richards Bay. Information for individual areas is available upon request.

DMS # 304154 4 of 33
2. SURVEY RESPONSE A total of 3000 households responded to the twenty-one survey questions. The satisfaction level of these households with regard to the services is illustrated throughout this report. The following services were regarded as high priority, water supply, health care, sanitation/sewerage, electricity supply, domestic refuse removal, condition of roads, communication with the community, municipal pay points, sports facilities, licensing services, law enforcement visibility and after-hour emergency services. Most of these services are also identified to be National Key Performance Indicators. The following figures illustrate the number of response received per service:
WA
TER
SU
PP
LY
SA
NIT
ATI
ON
/SE
WA
GE
SE
RV
ICE
CO
MM
UN
ICA
TIO
N B
Y U
MH
LATH
UZE
CO
ND
ITIO
N O
F R
OA
DS
DO
ME
STI
C R
EFU
SE
SE
RV
ICE
ELE
CTR
ICIT
Y S
UP
PLY
HE
ALT
H C
AR
E S
ER
VIC
E
MO
TOR
VE
HIC
LE L
ICE
NC
ING
LAW
EN
FOR
CE
ME
NT
VIS
IBIL
ITY
US
E O
F A
FTE
R-H
OU
RS
SE
RV
ICE
SP
OR
TS F
AC
ILIT
IES
US
ED
MU
NIC
IPA
L P
AY
PO
INT
HO
UR
S
PO
SIT
ION
OF
MU
NIC
IPA
L P
AY
PO
INT
0
500
1000
1500
2000
2500
3000
Num
ber
of r
espo
nded
per
ser
vice
us
ed
The above figure illustrates the number of respondents for each of the services as well as the percentage contributed towards the total number of 28142 population data.
RESPONDENTS DISTRIBUTION FOR SERVICE USED(TOTAL RESPONDENTS PER SERVICE USED = 28142)
2834LAW ENFORCEMENT
VISIBILITY10%
2803WATER SUPPLY
10%
2749SANITATION/SEWAGE
SERVICE10%
1772COMMUNICATION BY
UMHLATHUZE6%
2964CONDITION OF ROADS
11%
1704DOMESTIC REFUSE
SERVICE6%
2804ELECTRICITY SUPPLY
10%1208HEALTH CARE SERVICE
4%
1154MOTOR VEHICLE
LICENCING4%
1593SPORTS FACILITIES
USED6%
1443USE OF AFTER-HOURS
SERVICE5%
2554POSITION OF
MUNICIPAL PAYPOINT9%
2560MUNICIPAL PAYPOINT
HOURS9%
The results of customer satisfaction with the above services are discussed and illustrated individually below.
DMS # 304154 5 of 33
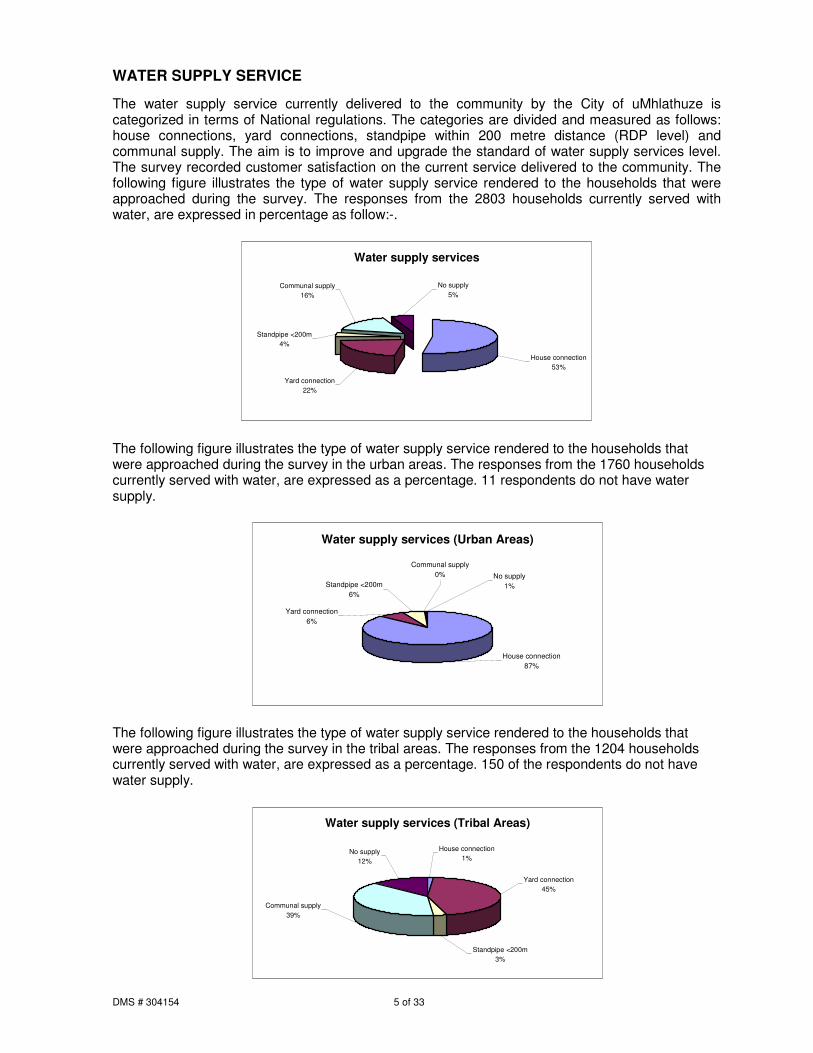
WATER SUPPLY SERVICE The water supply service currently delivered to the community by the City of uMhlathuze is categorized in terms of National regulations. The categories are divided and measured as follows: house connections, yard connections, standpipe within 200 metre distance (RDP level) and communal supply. The aim is to improve and upgrade the standard of water supply services level. The survey recorded customer satisfaction on the current service delivered to the community. The following figure illustrates the type of water supply service rendered to the households that were approached during the survey. The responses from the 2803 households currently served with water, are expressed in percentage as follow:-.
Water supply services
Communal supply16%
Yard connection22%
Standpipe <200m4%
House connection53%
No supply5%
The following figure illustrates the type of water supply service rendered to the households that were approached during the survey in the urban areas. The responses from the 1760 households currently served with water, are expressed as a percentage. 11 respondents do not have water supply.
Water supply services (Urban Areas)
No supply1%
House connection87%
Standpipe <200m6%
Yard connection6%
Communal supply0%
The following figure illustrates the type of water supply service rendered to the households that were approached during the survey in the tribal areas. The responses from the 1204 households currently served with water, are expressed as a percentage. 150 of the respondents do not have water supply.
Water supply services (Tribal Areas)
Communal supply39%
Yard connection45%
Standpipe <200m3%
House connection1%
No supply12%

DMS # 304154 6 of 33
House connection water supply House water supply connections are predominantly found in the urban developed areas. The number of households responded during the survey was 1554. The following figure illustrates a high satisfaction level among the respondents currently receiving this service.
Satisfaction with house connectionwater supply
NOT COMPLETELY SATISFACTORY
8%
SATISFACTORY54%
EXCELLENT34%
N/A1%
TOTALLY UNSATISFACTORY
3%
The following figure illustrates the satisfaction level among the 1538 respondents currently receiving this service in the urban areas:-
Satisfaction with house connectionwater supply (Urban Areas)
TOTALLY UNSATISFACTORY
3% N/A0%
EXCELLENT35%
SATISFACTORY55%
NOT COMPLETELY SATISFACTORY
7%
The following figure illustrates the satisfaction level among the 16 respondents currently receiving this service in the tribal areas:-
Satisfaction with house connectionwater supply (Tribal Areas)
NOT COMPLETELY SATISFACTORY
37%
SATISFACTORY37%
EXCELLENT0%
N/A13%TOTALLY
UNSATISFACTORY13%

DMS # 304154 7 of 33
Yard Connection The number of households responded to this service is 645. The satisfaction level of the households currently receiving yard connection water supply is illustrated as follows:
Satisfaction with yard connection water supply
EXCELLENT5%
SATISFACTORY53%
NOT COMPLETELY SATISFACTORY
33%
TOTALLY UNSATISFACTORY
7%
N/A2%
The following figure illustrates the satisfaction level among the 110 respondents currently receiving this service in the urban areas:-
Satisfaction with yard connection water supply (Urban Areas)
N/A1%TOTALLY
UNSATISFACTORY11%
NOT COMPLETELY SATISFACTORY
20%
SATISFACTORY66%
EXCELLENT2%
The following figure illustrates the satisfaction level among the 535 respondents currently receiving this service in the tribal areas:-
Satisfaction with yard connection water supply (Tribal Areas)
EXCELLENT6%
SATISFACTORY49%
NOT COMPLETELY SATISFACTORY
36%
TOTALLY UNSATISFACTORY
6%
N/A3%

DMS # 304154 8 of 33
Standpipe < 200metre water supply This level of service is as per RDP standard where running water is supplied via a standpipe within a distance of no more than 200 metres from the residence. The satisfaction level of the 132 respondents currently receiving this service is illustrated as follows:
Satisfaction with standpipe < 200m water supply
EXCELLENT6%
SATISFACTORY61%
NOT COMPLETELY SATISFACTORY
26%
TOTALLY UNSATISFACTORY
7%
The following figure illustrates the satisfaction level among the 99 respondents currently receiving this service in the urban areas:-
Satisfaction with standpipe < 200m water supply (Urban Areas)
TOTALLY UNSATISFACTORY
1%
N/A2%
NOT COMPLETELY SATISFACTORY
19%
SATISFACTORY71%
EXCELLENT7%
The following figure illustrates the satisfaction level among the 33 respondents currently receiving this service in the tribal areas:-
Satisfaction with standpipe < 200m water supply (Tribal Areas)
EXCELLENT0%
SATISFACTORY18%
NOT COMPLETELY SATISFACTORY
43%
N/A15%
TOTALLY UNSATISFACTORY
24%
DMS # 304154 9 of 33
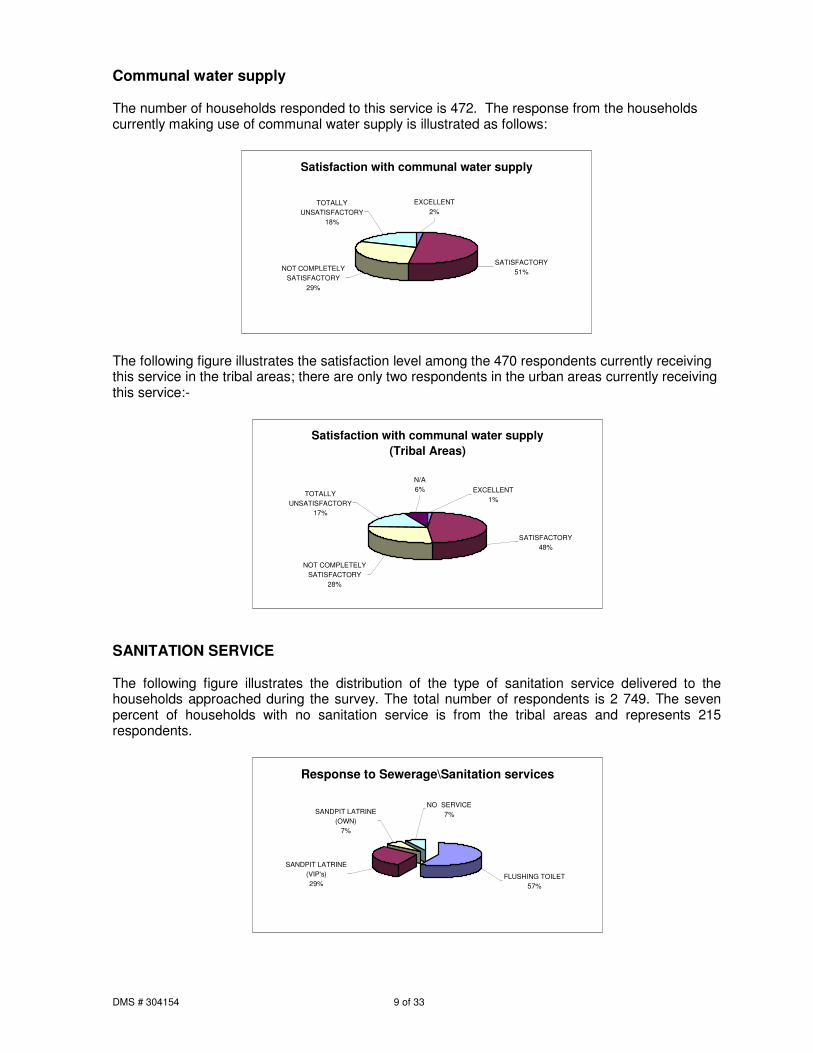
Communal water supply The number of households responded to this service is 472. The response from the households currently making use of communal water supply is illustrated as follows:
Satisfaction with communal water supply
TOTALLY UNSATISFACTORY
18%
NOT COMPLETELY SATISFACTORY
29%
SATISFACTORY51%
EXCELLENT2%
The following figure illustrates the satisfaction level among the 470 respondents currently receiving this service in the tribal areas; there are only two respondents in the urban areas currently receiving this service:-
Satisfaction with communal water supply(Tribal Areas)
N/A6% EXCELLENT
1%
SATISFACTORY48%
NOT COMPLETELY SATISFACTORY
28%
TOTALLY UNSATISFACTORY
17%
SANITATION SERVICE The following figure illustrates the distribution of the type of sanitation service delivered to the households approached during the survey. The total number of respondents is 2 749. The seven percent of households with no sanitation service is from the tribal areas and represents 215 respondents.
Response to Sewerage\Sanitation services
SANDPIT LATRINE (OWN)
7%
SANDPIT LATRINE (VIP's)29%
FLUSHING TOILET57%
NO SERVICE7%

DMS # 304154 10 of 33
Flushing toilet service A flushing toilet service is delivered to households in the urban and developed areas. The following figure illustrates the satisfaction rating of 1 681 respondents currently receiving this service. The satisfaction level for this service is exceptional good.
Satisfaction with flushing toilet service
NOT COMPLETELY SATISFACTORY
2.5%
N/A0.4%
TOTALLY UN-SATISFACTORY
0.4%
EXCELLENT38.3%
SATISFACTORY58.5%
The following figure illustrates the satisfaction level among the 1644 respondents currently receiving this service in the urban areas:-
Satisfaction with flushing toilet service(Urban Areas)
SATISFACTORY58.1%
EXCELLENT39.0%
TOTALLY UN-SATISFACTORY
0.4% N/A0.2%
NOT COMPLETELY SATISFACTORY
2.3%
The following figure illustrates the satisfaction level among the 37 respondents currently receiving this service in the tribal areas:-
Satisfaction with flushing toilet service(Tribal Areas)
SATISFACTORY75.7%
EXCELLENT5.4%
TOTALLY UN-SATISFACTORY
0.4%
N/A8.1%
NOT COMPLETELY SATISFACTORY
10.8%
DMS # 304154 11 of 33
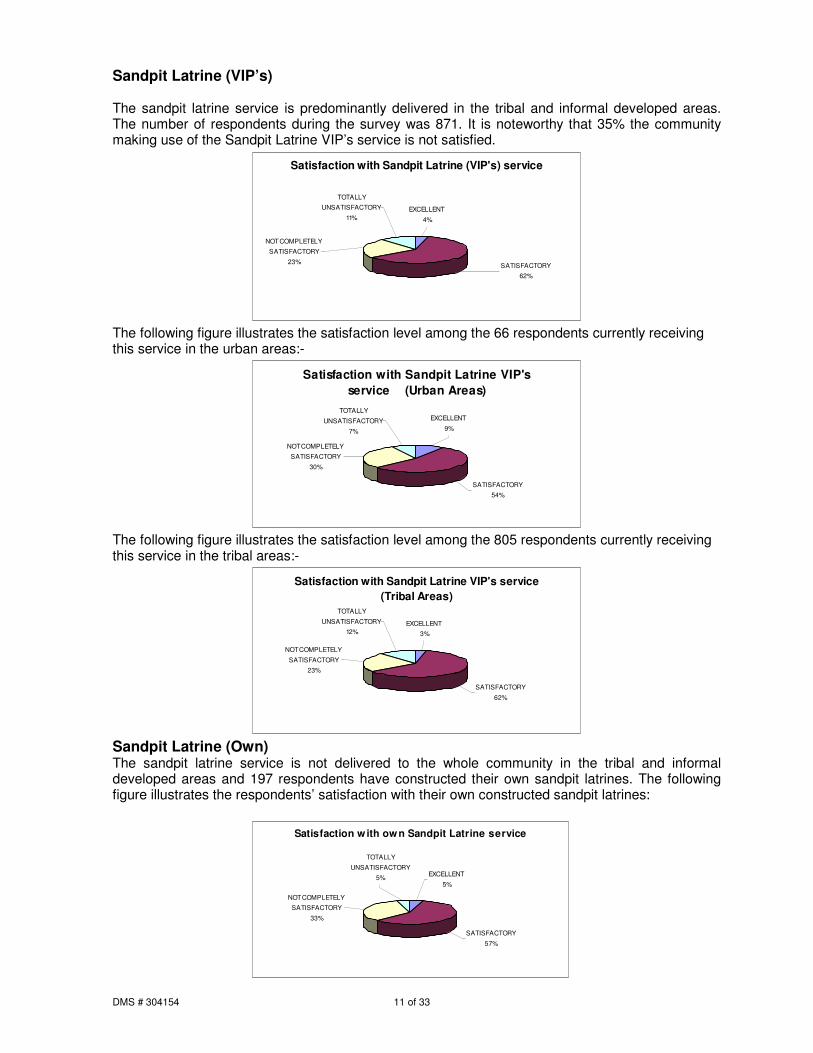
Sandpit Latrine (VIP’s) The sandpit latrine service is predominantly delivered in the tribal and informal developed areas. The number of respondents during the survey was 871. It is noteworthy that 35% the community making use of the Sandpit Latrine VIP’s service is not satisfied.
Satisfaction with Sandpit Latrine (VIP's) service
EXCELLENT
4%
SATISFACTORY
62%
NOT COMPLETELY
SATISFACTORY
23%
TOTALLY
UNSATISFACTORY
11%
The following figure illustrates the satisfaction level among the 66 respondents currently receiving this service in the urban areas:-
Satisfaction with Sandpit Latrine VIP's service (Urban Areas)
TOTALLY
UNSATISFACTORY
7%
NOT COMPLETELY
SATISFACTORY
30%
SATISFACTORY
54%
EXCELLENT
9%
The following figure illustrates the satisfaction level among the 805 respondents currently receiving this service in the tribal areas:-
Satisfaction with Sandpit Latrine VIP's service (Tribal Areas)
EXCELLENT
3%
SATISFACTORY
62%
NOT COMPLETELY
SATISFACTORY
23%
TOTALLY
UNSATISFACTORY
12%
Sandpit Latrine (Own) The sandpit latrine service is not delivered to the whole community in the tribal and informal developed areas and 197 respondents have constructed their own sandpit latrines. The following figure illustrates the respondents’ satisfaction with their own constructed sandpit latrines:
Satisfaction w ith own Sandpit Latrine service
TOTALLY
UNSATISFACTORY
5%
NOT COMPLETELY
SATISFACTORY
33%
SATISFACTORY
57%
EXCELLENT
5%
DMS # 304154 12 of 33
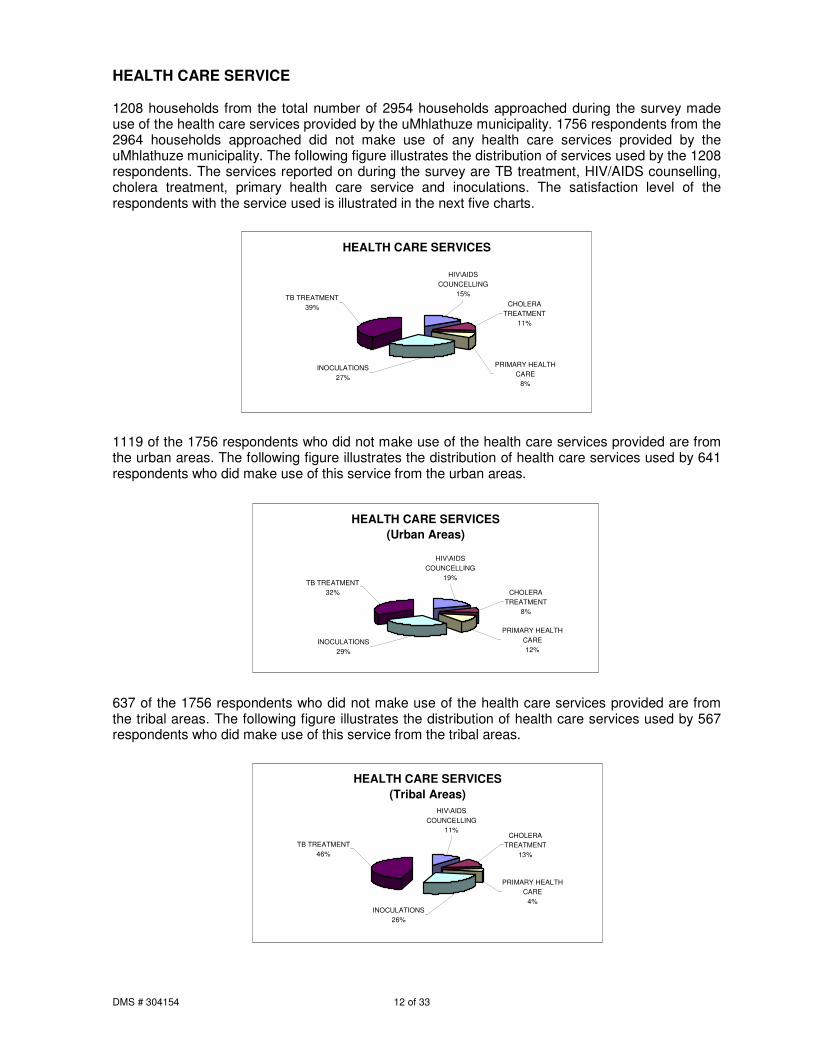
HEALTH CARE SERVICE 1208 households from the total number of 2954 households approached during the survey made use of the health care services provided by the uMhlathuze municipality. 1756 respondents from the 2964 households approached did not make use of any health care services provided by the uMhlathuze municipality. The following figure illustrates the distribution of services used by the 1208 respondents. The services reported on during the survey are TB treatment, HIV/AIDS counselling, cholera treatment, primary health care service and inoculations. The satisfaction level of the respondents with the service used is illustrated in the next five charts.
HEALTH CARE SERVICES
TB TREATMENT39%
INOCULATIONS27%
PRIMARY HEALTH CARE
8%
CHOLERA TREATMENT
11%
HIV\AIDS COUNCELLING
15%
1119 of the 1756 respondents who did not make use of the health care services provided are from the urban areas. The following figure illustrates the distribution of health care services used by 641 respondents who did make use of this service from the urban areas.
HEALTH CARE SERVICES(Urban Areas)
HIV\AIDS COUNCELLING
19%
CHOLERA TREATMENT
8%
PRIMARY HEALTH CARE12%
INOCULATIONS29%
TB TREATMENT32%
637 of the 1756 respondents who did not make use of the health care services provided are from the tribal areas. The following figure illustrates the distribution of health care services used by 567 respondents who did make use of this service from the tribal areas.
HEALTH CARE SERVICES(Tribal Areas)
TB TREATMENT46%
INOCULATIONS26%
PRIMARY HEALTH CARE
4%
CHOLERA TREATMENT
13%
HIV\AIDS COUNCELLING
11%
DMS # 304154 13 of 33
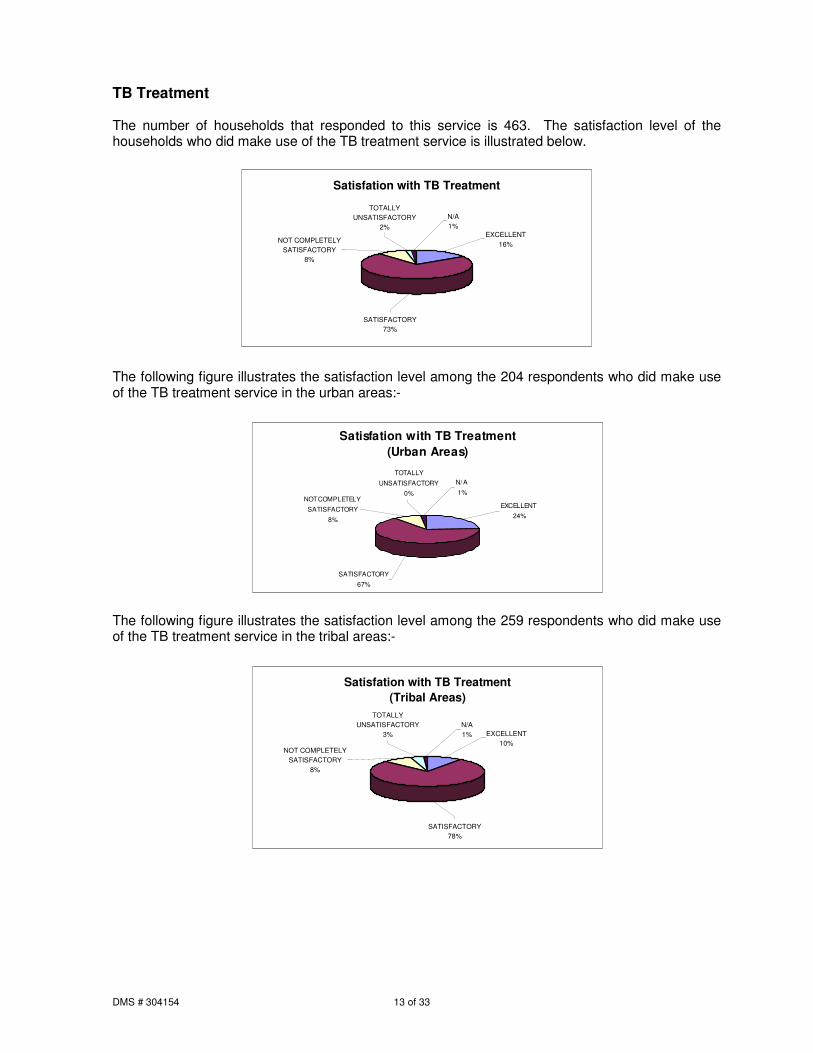
TB Treatment The number of households that responded to this service is 463. The satisfaction level of the households who did make use of the TB treatment service is illustrated below.
Satisfation with TB Treatment
EXCELLENT16%
N/A1%
TOTALLY UNSATISFACTORY
2%
NOT COMPLETELY SATISFACTORY
8%
SATISFACTORY73%
The following figure illustrates the satisfaction level among the 204 respondents who did make use of the TB treatment service in the urban areas:-
Satisfation with TB Treatment(Urban Areas)
SATISFACTORY
67%
NOT COMPLETELY
SATISFACTORY
8%
TOTALLY
UNSATISFACTORY
0%
N/A
1%
EXCELLENT
24%
The following figure illustrates the satisfaction level among the 259 respondents who did make use of the TB treatment service in the tribal areas:-
Satisfation with TB Treatment(Tribal Areas)
EXCELLENT10%
N/A1%
TOTALLY UNSATISFACTORY
3%
NOT COMPLETELY SATISFACTORY
8%
SATISFACTORY78%

DMS # 304154 14 of 33
Cholera Treatment The number of households that responded on this service is 128. The satisfaction level from the households who did make use of the Cholera treatment service is illustrated below.
Satisfaction with Cholera treatment
NOT COMPLETELY SATISFACTORY
11%
SATISFACTORY61%
EXCELLENT20%
TOTALLY UNSATISFACTORY
7%N/A1%
The following figure illustrates the satisfaction level among the 54 respondents who did make use of the Cholera treatment service in the urban areas:-
Satisfaction with Cholera treatment(Urban Areas)
N/A0%
TOTALLY UNSATISFACTORY
0%EXCELLENT
28%
SATISFACTORY70%
NOT COMPLETELY SATISFACTORY
2%
The following figure illustrates the satisfaction level among the 74 respondents who did make use of the Cholera treatment service in the tribal areas:-
Satisfaction with Cholera treatment(Tribal Areas)
NOT COMPLETELY SATISFACTORY
18%
SATISFACTORY55%
EXCELLENT14%
TOTALLY UNSATISFACTORY
12%
N/A1%
DMS # 304154 15 of 33
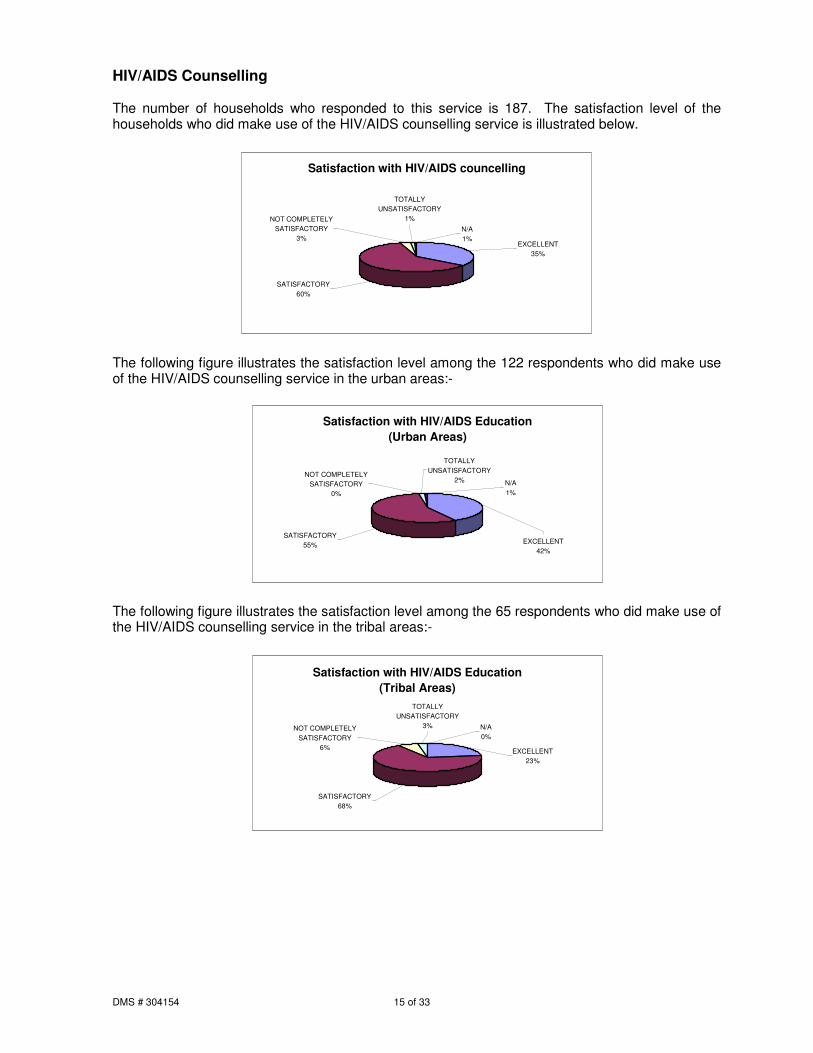
HIV/AIDS Counselling The number of households who responded to this service is 187. The satisfaction level of the households who did make use of the HIV/AIDS counselling service is illustrated below.
Satisfaction with HIV/AIDS councelling
NOT COMPLETELY SATISFACTORY
3%
TOTALLY UNSATISFACTORY
1%
N/A1%
EXCELLENT35%
SATISFACTORY60%
The following figure illustrates the satisfaction level among the 122 respondents who did make use of the HIV/AIDS counselling service in the urban areas:-
Satisfaction with HIV/AIDS Education(Urban Areas)
NOT COMPLETELY SATISFACTORY
0%
TOTALLY UNSATISFACTORY
2% N/A1%
EXCELLENT42%
SATISFACTORY55%
The following figure illustrates the satisfaction level among the 65 respondents who did make use of the HIV/AIDS counselling service in the tribal areas:-
Satisfaction with HIV/AIDS Education(Tribal Areas)
SATISFACTORY68%
EXCELLENT23%
N/A0%
TOTALLY UNSATISFACTORY
3%NOT COMPLETELY SATISFACTORY
6%

DMS # 304154 16 of 33
Primary Health Education The number of households who responded to this service is 100. The satisfaction level of the households who did make use of the primary health education service is illustrated below.
Satisfaction with Primary Health education
N/A1%
EXCELLENT27%
SATISFACTORY69%
NOT COMPLETELY SATISFACTORY
2%
TOTALLY UNSATISFACTORY
1%
The following figure illustrates the satisfaction level among the 76 respondents who did make use of the primary health education service in the urban areas:-
Satisfaction with Health education(Urban Areas)
TOTALLY UNSATISFACTORY
1%NOT COMPLETELY
SATISFACTORY1%
SATISFACTORY69%
EXCELLENT29%
N/A0%
The following figure illustrates the satisfaction level among the 24 respondents who did make use of the primary health education service in the tribal areas:-
Satisfaction with Health education(Tribal Areas)
N/A4%
EXCELLENT21%
SATISFACTORY71%
NOT COMPLETELY SATISFACTORY
0%
TOTALLY UNSATISFACTORY
4%

DMS # 304154 17 of 33
Inoculations The number of households who responded to this service is 330. The satisfaction level of the households who did make use of inoculations service is illustrated below.
Satisfaction with inoculations
NOT COMPLETELY SATISFACTORY
10%
TOTALLY UNSATISFACTORY
3%
N/A1% EXCELLENT
16%
SATISFACTORY70%
The following figure illustrates the satisfaction level among the 185 respondents who did make use of inoculations service in the urban areas:-
Satisfaction with inoculations(Urban Areas)
SATISFACTORY71%
EXCELLENT17%
N/A1%
TOTALLY UNSATISFACTORY
3%NOT COMPLETELY SATISFACTORY
8%
The following figure illustrates the satisfaction level among the 145 respondents who did make use of inoculations service in the tribal areas:-
Satisfaction with inoculations(Tribal Areas)
NOT COMPLETELY SATISFACTORY
12%
TOTALLY UNSATISFACTORY
3% N/A1% EXCELLENT
14%
SATISFACTORY70%

DMS # 304154 18 of 33
ROADS The perception of the community with regard to satisfaction of the roads infrastructure and the condition of roads was measured in general. This includes tarred as well as gravel roads and streets. The number of respondents during the survey was 2964. The following figure illustrates the satisfaction response received.
Satisfaction with condition of Roads
SATISFACTORY37%
NOT COMPLETELY SATISFACTORY
23%
TOTALLY UNSATISFACTORY
21%
EXCELLENT17%
N/A2%
The following figure illustrates the satisfaction level among the 1760 respondents currently using the roads in the urban areas:-
Satisfaction with condition of Roads(Urban Areas)
SATISFACTORY52%
NOT COMPLETELY SATISFACTORY
14%
TOTALLY UNSATISFACTORY
6%EXCELLENT
27%
N/A1%
The following figure illustrates the satisfaction level among the 1204 respondents currently using the roads in the tribal areas:-
Satisfaction with condition of Roads(Tribal Areas)
N/A5%
EXCELLENT3%
TOTALLY UNSATISFACTORY
43%
NOT COMPLETELY SATISFACTORY
34%
SATISFACTORY15%

DMS # 304154 19 of 33
DOMESTIC REFUSE REMOVAL The domestic service currently delivered by the City of uMhlathuze per household is either 240 litre bins, black bags or communal bins. The tribal areas are currently not receiving a refuse removal service. The total number of respondents was 2964 of which 1 704 of the respondents receive a domestic refuse removal service and 1260 respondents do not receive this service. The following figure illustrates the distribution of the response to the type of domestic refuse removal services currently delivered to the respondents who were approached during the survey.
Domestic refuse removal - Type of Service
Black bags42%
Communal bin2%
No service42%
240 Litre bin14%
240 litre Bin service This service is delivered predominantly in the Richards Bay area once per week. The satisfaction level with service delivery per household as experienced by 405 of the 1704 respondents receiving a domestic refuse service is illustrated as follows:
Domestic refuse removal - 240 Litre bin
TOTALLY UNSATISFACTORY
1% N/A1%
EXCELLENT36%
NOT COMPLETELY SATISFACTORY
3%
SATISFACTORY59%
Black bag service This service is delivered in the Empangeni and other municipal areas once per week. The satisfaction level with service delivery per household as experienced by 1245 of the 1704 respondents receiving a domestic refuse service is illustrated as follows:
Domestic refuse removal - Black Bags
EXCELLENT31%
SATISFACTORY54%
NOT COMPLETELY SATISFACTORY
10%
TOTALLY UNSATISFACTORY
4%N/A1%

DMS # 304154 20 of 33
Communal bin service This service is delivered in the tribal municipal areas once per week. The satisfaction level with service delivery per household as experienced by 54 of the 1704 respondents receiving a domestic refuse service is illustrated as follows:
Domestic refuse removal - Communal Bin
TOTALLY UNSATISFACTORY
7%
NOT COMPLETELY SATISFACTORY
4%
SATISFACTORY78%
EXCELLENT11%
No Service Forty two percent (42%) of the households who participated in the survey receives no domestic refuse removal service and is predominantly in the tribal areas (1260 households). 82 of the 1260 respondents are not satisfied with the situation of no domestic removal service and the majority of 1178 respondents are satisfied with the fact that this service is not delivered. COMMUNICATION WITH THE COMMUNITY Communication between the City of uMhlathuze and the community is very important for public participation. The public needs to be informed regularly on all issues and their inputs and participation must be obtained to make informed decisions for the future. Communication is recorded in the following categories, personal contact, telephonic contact, ward committees and the uMhlathuze newsletter. The following chart illustrates the response distribution per category from 1772 of the 2964 respondents with regard to communication with the municipality.
Communication with the community
UMHLATHUZE NEWSLETTER
62%
PERSONAL CONTACT
5%
NO COMMUNICATION
20%
TELEPHONIC1%
WARD COMMITTEES
12%
DMS # 304154 21 of 33
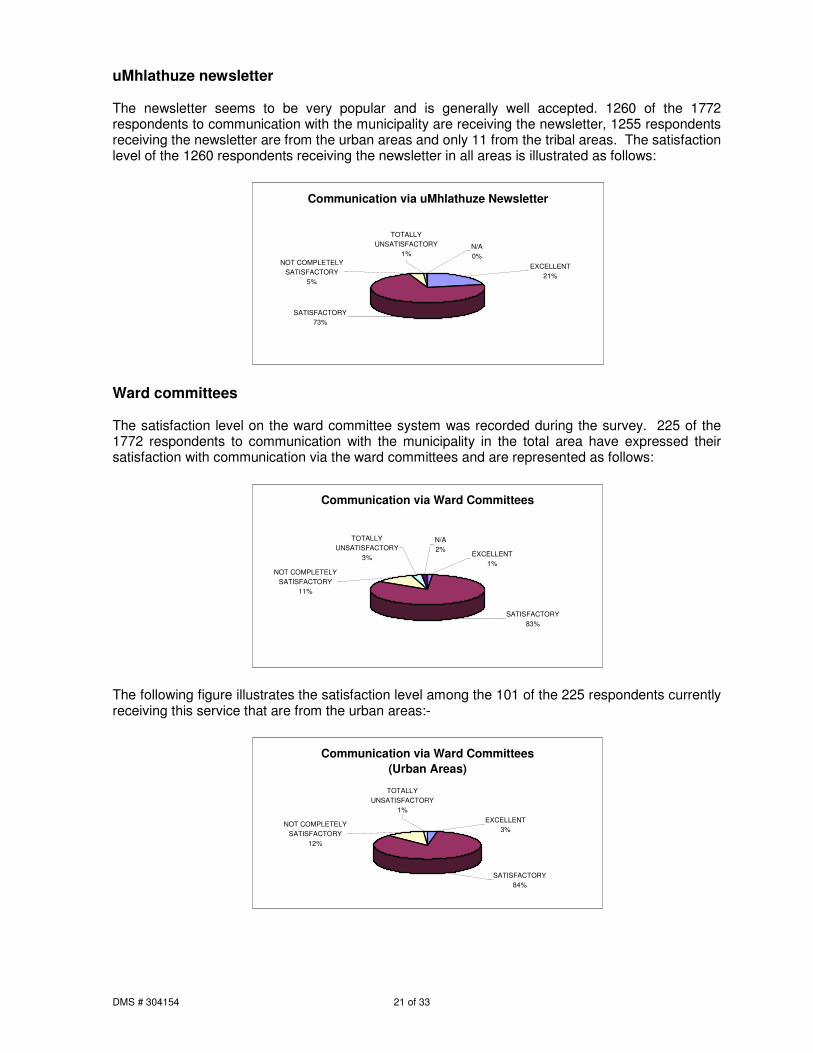
uMhlathuze newsletter The newsletter seems to be very popular and is generally well accepted. 1260 of the 1772 respondents to communication with the municipality are receiving the newsletter, 1255 respondents receiving the newsletter are from the urban areas and only 11 from the tribal areas. The satisfaction level of the 1260 respondents receiving the newsletter in all areas is illustrated as follows:
Communication via uMhlathuze Newsletter
EXCELLENT21%
SATISFACTORY73%
NOT COMPLETELY SATISFACTORY
5%
TOTALLY UNSATISFACTORY
1%N/A0%
Ward committees The satisfaction level on the ward committee system was recorded during the survey. 225 of the 1772 respondents to communication with the municipality in the total area have expressed their satisfaction with communication via the ward committees and are represented as follows:
Communication via Ward Committees
N/A2%
EXCELLENT1%
SATISFACTORY83%
NOT COMPLETELY SATISFACTORY
11%
TOTALLY UNSATISFACTORY
3%
The following figure illustrates the satisfaction level among the 101 of the 225 respondents currently receiving this service that are from the urban areas:-
Communication via Ward Committees(Urban Areas)
TOTALLY UNSATISFACTORY
1%
NOT COMPLETELY SATISFACTORY
12%
SATISFACTORY84%
EXCELLENT3%

DMS # 304154 22 of 33
The following figure illustrates the satisfaction level among the 124 of the 225 total respondents currently receiving this service that are from the tribal areas:-
Communication via Ward Committees(Tribal Areas)
EXCELLENT0%
SATISFACTORY84%
NOT COMPLETELY SATISFACTORY
11%
TOTALLY UNSATISFACTORY
5%
Telephonic Communication Satisfaction levels on telephonic communication with the uMhlathuze municipality from the community were recorded during the survey from respondents making use of telephonic contact. 71 of the 89 respondents communicating via telephone to the municipality are from the urban areas and have expressed their satisfaction with communication via telephone and are represented as follows:
Telephonic Communication
TOTALLY UNSATISFACTORY
1%
NOT COMPLETELY SATISFACTORY
16%
SATISFACTORY57%
EXCELLENT20%
N/A6%
Personal Contact Satisfaction levels on personal contact were recorded during the survey from respondents making personal contact with the uMhlathuze municipality. 172 of the 192 respondents who made personal contact with the municipality as means of communication are from the urban areas and have expressed their satisfaction with personal communication as follows:
Communication via Personal Contact
N/A1%
TOTALLY UNSATISFACTORY
3%
NOT COMPLETELY SATISFACTORY
13%
SATISFACTORY44%
EXCELLENT39%

DMS # 304154 23 of 33
ELECTRICITY SUPPLY Electrical supply to households within the jurisdiction of the City of uMhlathuze is presently delivered by the municipality in the urban developed areas, mainly in Richards Bay and Empangeni and electricity supply to the more tribal areas is delivered by ESKOM. The following figure illustrates the split between electricity supply from the two suppliers to the 2 804 respondents.
Electricity supply
Eskom supply37%
Municipal supply58%
No Supply5%
Electricity supply by the City of uMhlathuze 1695 of the 2804 households surveyed receive their electrical supply via the City of uMhlathuze. The satisfaction level in the response received from the 1695 households (1638 of the respondents are from the urban areas) with electricity supplied by the City of uMhlathuze is illustrated in the following chart. Remarks were however received referring to frequent interruption of the service as well as non-consistent current.
Satisfaction with uMhlathuze Electrical supply
EXCELLENT30%
SATISFACTORY58%
NOT COMPLETELY SATISFACTORY
10%
TOTALLY UNSATISFACTORY
2%N/A0%
Electricity supply by ESKOM 1109 of the 2804 households surveyed receive their electrical supply via ESKOM. The satisfaction level in the response received from the 1109 households (1018 of the respondents are from the tribal areas) with electricity supplied by ESKOM is illustrated in the following chart. Remarks were received referring to frequent interruption of the service.
Satisfaction with Eskom supply
N/A1% EXCELLENT
17%
SATISFACTORY66%
NOT COMPLETELY SATISFACTORY
13%
TOTALLY UNSATISFACTORY
3%

DMS # 304154 24 of 33
MUNICIPAL PAYPOINT POSITIONS The satisfaction level in the response received from 2554 of the total of 2964 respondents (1760 respondents from the urban areas and 1204 respondents from the tribal areas) making use of this facility is illustrated in the following chart.
Satisfaction with position of municipal paypoints
EXCELLENT23%
SATISFACTORY64%
TOTALLY UNSATISFACTORY
3%NOT COMPLETELY SATISFACTORY
10%
The following figure illustrates the satisfaction level among all 1760 respondents currently using this service in the urban areas:-
Satisfaction with position of municipal paypoints (Urban Areas)
NOT COMPLETELY SATISFACTORY
7%
TOTALLY UNSATISFACTORY
1%
SATISFACTORY63%
EXCELLENT28%
N/A1%
The following figure illustrates the satisfaction level among 820 of the 1204 respondents currently using this service in the tribal areas:-
Satisfaction with position of municipal paypoints (Tribal Areas)
EXCELLENT10%
SATISFACTORY70%
TOTALLY UNSATISFACTORY
5%NOT COMPLETELY
SATISFACTORY15%

DMS # 304154 25 of 33
MUNICIPAL PAYPOINT HOURS The satisfaction level in the response received from 2560 respondents making use of this facility out of the total of 2964 responded (1760 respondents from the urban areas and 1204 respondents from the tribal areas) as follows.
Satisfaction with municipal paypoint hours
EXCELLENT23%
TOTALLY UNSATISFACTORY
3%NOT COMPLETELY SATISFACTORY
12%
SATISFACTORY62%
The following figure illustrates the satisfaction level among all 1760 respondents currently using this service in the urban areas:-
Satisfaction with municipal paypoint hours(Population from Urban Areas)
SATISFACTORY57%
NOT COMPLETELY SATISFACTORY
13%
TOTALLY UNSATISFACTORY
3%N/A2% EXCELLENT
25%
The following figure illustrates the satisfaction level among the 832 of the 1204 respondents currently using this service in the tribal areas:-
Satisfaction with municipal paypoint hours(Population from Tribal Areas)
EXCELLENT17%
TOTALLY UNSATISFACTORY
2%NOT COMPLETELY
SATISFACTORY8%
SATISFACTORY73%

DMS # 304154 26 of 33
SPORTS FACILITIES The following chart illustrates the response received from 2964 respondents pertaining the type of sports facilities used or visited as provided by the City of uMhlathuze. 1371 respondents indicated that there are no sports facilities available in their areas whereas 903 respondents did make use of municipal sports facilities and 686 respondents never made use of these facilities, although it is available.
Extent of Sports Facilities used
THERE ARE NO FACILITIES
46%
FREQUENTLY9%
SOMETIMES22%
NEVER23%
The following chart illustrates the response received among all 1760 respondents for the use of sports facilities in the urban areas:-
Extent of Sports Facilities used(Urban Areas)
NEVER36%
SOMETIMES34%
FREQUENTLY14%
THERE ARE NO FACILITIES
16%
The following figure illustrates the response received among all 1204 respondents for the use of sports facilities in the tribal areas:-
Extent of Sports Facilities used(Tribal Areas)
THERE ARE NO FACILITIES
91%
FREQUENTLY1%
SOMETIMES4% NEVER
4%

DMS # 304154 27 of 33
Satisfaction with sport facilities The following figure illustrates the response received from 1366 respondents (from all areas) having used or visited the sports facilities and expressing their satisfaction with the service.
Satisfaction rating of Sports Facilitiesused or visited
TOTALLY UNSATISFACTORY
6%
EXCELLENT16%
SATISFACTORY62%
NOT COMPLETELY SATISFACTORY
16%
The following figure illustrates the satisfaction level among 1256 of the 1366 respondents currently using or visited this service in the urban areas:-
Satisfaction rating of Sports Facilitiesused (Urban Areas)
NOT COMPLETELY SATISFACTORY
15%
SATISFACTORY64%
EXCELLENT16%
TOTALLY UNSATISFACTORY
5%
The following figure illustrates the satisfaction level among 110 of the 1366 respondents currently using or visited this service in the tribal areas:-
Satisfaction rating of Sports Facilitiesused (Tribal Areas)
TOTALLY UNSATISFACTORY
26%
EXCELLENT12%
SATISFACTORY37%
NOT COMPLETELY SATISFACTORY
25%
DMS # 304154 28 of 33
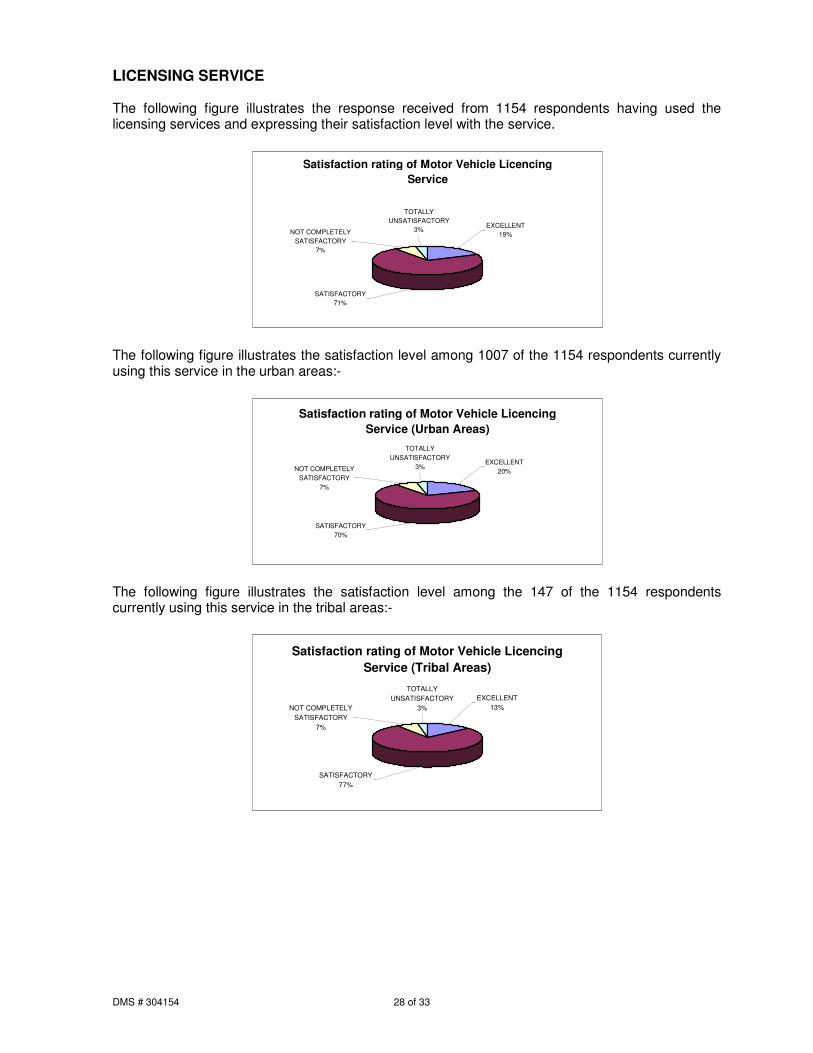
LICENSING SERVICE The following figure illustrates the response received from 1154 respondents having used the licensing services and expressing their satisfaction level with the service.
Satisfaction rating of Motor Vehicle Licencing Service
NOT COMPLETELY SATISFACTORY
7%
SATISFACTORY71%
EXCELLENT19%
TOTALLY UNSATISFACTORY
3%
The following figure illustrates the satisfaction level among 1007 of the 1154 respondents currently using this service in the urban areas:-
Satisfaction rating of Motor Vehicle Licencing Service (Urban Areas)
TOTALLY UNSATISFACTORY
3%EXCELLENT
20%
SATISFACTORY70%
NOT COMPLETELY SATISFACTORY
7%
The following figure illustrates the satisfaction level among the 147 of the 1154 respondents currently using this service in the tribal areas:-
Satisfaction rating of Motor Vehicle Licencing Service (Tribal Areas)
NOT COMPLETELY SATISFACTORY
7%
SATISFACTORY77%
EXCELLENT13%
TOTALLY UNSATISFACTORY
3%

DMS # 304154 29 of 33
LAW ENFORCEMENT VISIBILITY The following figure illustrates the response received from 2834 respondents from all areas expressing their satisfaction level with regard to the visibility of the law enforcement service. It is evident that the satisfaction level with this service is not up to standard.
Satisfaction rating of Law Enforcement Visibility
TOTALLY
UNSATISFACTORY
13%
EXCELLENT
8%
SATISFACTORY
53%NOT COMPLETELY
SATISFACTORY
22%
N/ A
4%
The following figure illustrates the satisfaction level among 1712 of the 2834 respondents to this service in the urban areas:-
Satisfaction rating of Law Enforcement Visibility (Urban Areas)
NOT COMPLETELY SATISFACTORY
21%
SATISFACTORY58%
EXCELLENT12%
TOTALLY UNSATISFACTORY
9%
The following figure illustrates the satisfaction level among the 1122 of the 2834 respondents to this service in the tribal areas:-
Satisfaction rating of Law Enforcement Visibility (Tribal Areas)
TOTALLY UNSATISFACTORY
20%
EXCELLENT3%
SATISFACTORY52%
NOT COMPLETELY SATISFACTORY
25%

DMS # 304154 30 of 33
AFTER-HOUR SERVICES 1535 respondents out of the 2964 total respondents indicated that they never called upon the after hour service provided by the uMhlathuze municipality. The following figure illustrates the response received from 1443 respondents on the type of after hour service called upon.
Type of After-Hour Service called upon(Total of 1443 respondents)
FIRE & RESCUE2%
ELECTRICITY47%
SEWERAGE8%
WATER20%
LAW ENFORCEMENT
23%
The following figure illustrates the type of after hour service called upon by the 1082 of the 1443 respondents in the urban areas:-
Type of After-Hour Service called upon(Total of 1082 respondents - Urban Areas)
LAW ENFORCEMENT
14%WATER
24%
SEWERAGE11%
ELECTRICITY49%
FIRE & RESCUE2%
The following figure illustrates the type of after hour service called upon by the 361 of the 1443 respondents in the tribal areas:-
Type of After-Hour Service called upon(Total of 361 respondents - Tribal Areas)
FIRE & RESCUE2%
ELECTRICITY41%
SEWERAGE1%
WATER6%
LAW ENFORCEMENT
50%

DMS # 304154 31 of 33
Satisfaction of after-hour services The following figure illustrates the satisfaction level of the response received from 1429 respondents from all areas having used the after hour service.
Rating of After-Hour Service called upon(Total of 1429 respondents)
TOTALLY UNSATISFACTORY
9%EXCELLENT
21%
SATISFACTORY58%
NOT COMPLETELY SATISFACTORY
12%
The following figure illustrates the satisfaction level among 1074 of the 1429 respondents currently responding to this service in the urban areas:-
Rating of After-Hour Service called upon(Total of 1074 respondents - Urban Areas)
NOT COMPLETELY SATISFACTORY
12%
SATISFACTORY59%
EXCELLENT22%
TOTALLY UNSATISFACTORY
7%
The following figure illustrates the satisfaction level among 355 of the 1429 respondents currently using this service in the tribal areas:-
Rating of After-Hour Service called upon(Total of 355 respondents - Urban Areas)
TOTALLY UNSATISFACTORY
15%EXCELLENT
17%
SATISFACTORY56%
NOT COMPLETELY SATISFACTORY
12%

DMS # 304154 32 of 33
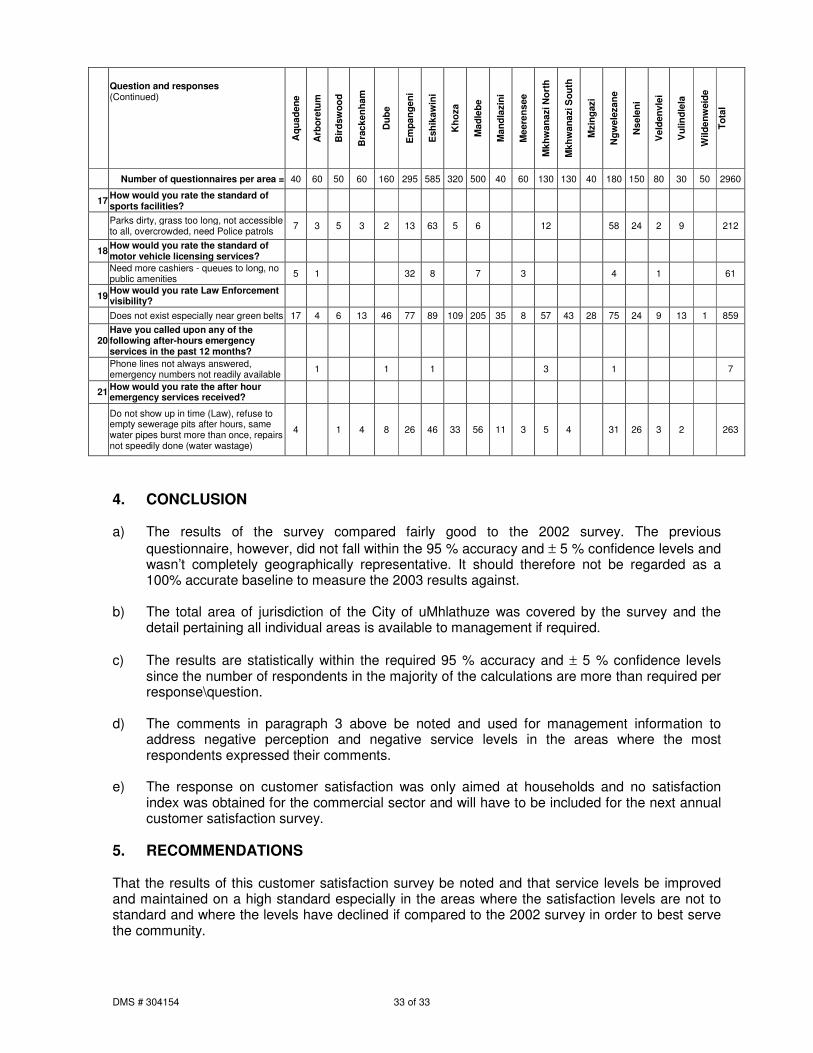
3. COMMENTS RECEIVED The following is a summary of the comments received during the survey and number of comments per area against each of the services in question:
Question and responses A
quad
ene
Arb
oret
um
Bir
dsw
ood
Bra
cken
ham
Dub
e
Em
pang
eni
Esh
ikaw
ini
Kho
za
Mad
lebe
Man
dlaz
ini
Mee
rens
ee
Mkh
wan
azi N
orth
Mkh
wan
azi S
outh
Mzi
ngaz
i
Ngw
elez
ane
Nse
leni
Vel
denv
lei
Vul
indl
ela
Wild
enw
eide
Tota
l
Number of questionnaires per area = 40 60 50 60 160 295 585 320 500 40 60 130 130 40 180 150 80 30 50 2960
1 What type of water supply do you have? 4
2 How would you rate your water supply?
Water pressure to low, notification before water is cut would be appreciated, water dirty and smelly, to far away, to expensive
2 1 58 27 64 125 245 14 14 57 52 9 41 3 2 5 2 709
3 What type of sanitation/sewerage service would you have?
Own sandpits had to be built. 1 7 2 1 1 1 13
4 How would you rate your sanitation/sewerage service?
Unhealthy, would like flushing toilets, poor drainage of pits, need ventilation, sanitation pipes broken
1 49 1 15 57 71 7 26 31 30 2 1 291
5 What type of domestic refuse removal service do you have?
Own refuse (Dube), need more black bags (Esikaweni) 1 4 1 5 11
6 How would you rate your refuse removal service?
Refuse pickups infrequent - need twice weekly, shortage of black bags, bins preferable to black bags
6 4 2 23 38 44 15 1 10 3 43 11 2 7 209
7 Which health care service have you made use of in the past 12 months?
8 How would you rate the health service?
Clinics to far away, shortage of medicines, unfriendly service in some areas (Ngwelezane , Vulindlela, Madlebe)
12 2 16 26 38 16 2 17 2 2 133
9 From where do you receive your electricity?
10 How would you rate your electrical power?
Electricity to expensive, power cuts without notice, Frequent power cuts 1 1 22 15 28 47 53 3 1 24 24 3 49 18 1 4 292
11 What is the condition of roads and streets in your area?
Potholes, need speed humps, prefer roads to be tarred and more streetlights 3 2 4 7 108 43 48 270 402 39 69 82 14 71 68 2 5 1237
12 How does uMhlathuze municipality communicate with you?
13 How would you rate communication between the municipality and you?
No communication (Dube), infrequent communication 2 16 12 30 10 2 7 6 38 2 1 126
14 How would you rate the position of the municipal pay point?
To far, need more pay points, pay point to close to bottle store (Dube) 1 6 1 11 6 43 40 51 14 24 24 22 11 2 17 1 274
15 How would you rate the times that pay points are open?
Office hours to be extended, need similar facilities as cell phone & Telkom prepaid facilities
5 1 1 3 28 91 20 31 9 7 6 10 20 32 20 15 9 308
16 To what extent do you make use of municipal sports facilities?
Not clean, to far, does not exist 1 1 6 1 8 3 20
DMS # 304154 33 of 33
Question and responses (Continued)
Aqu
aden
e
Arb
oret
um
Bir
dsw
ood
Bra
cken
ham
Dub
e
Em
pang
eni
Esh
ikaw
ini
Kho
za
Mad
lebe
Man
dlaz
ini
Mee
rens
ee
Mkh
wan
azi N
orth
Mkh
wan
azi S
outh
Mzi
ngaz
i
Ngw
elez
ane
Nse
leni
Vel
denv
lei
Vul
indl
ela
Wild
enw
eide
Tota
l
Number of questionnaires per area = 40 60 50 60 160 295 585 320 500 40 60 130 130 40 180 150 80 30 50 2960
17 How would you rate the standard of sports facilities?
Parks dirty, grass too long, not accessible to all, overcrowded, need Police patrols 7 3 5 3 2 13 63 5 6 12 58 24 2 9 212
18 How would you rate the standard of motor vehicle licensing services?
Need more cashiers - queues to long, no public amenities 5 1 32 8 7 3 4 1 61
19 How would you rate Law Enforcement visibility?
Does not exist especially near green belts 17 4 6 13 46 77 89 109 205 35 8 57 43 28 75 24 9 13 1 859
20 Have you called upon any of the following after-hours emergency services in the past 12 months?
Phone lines not always answered, emergency numbers not readily available 1 1 1 3 1 7
21 How would you rate the after hour emergency services received?
Do not show up in time (Law), refuse to empty sewerage pits after hours, same water pipes burst more than once, repairs not speedily done (water wastage)
4 1 4 8 26 46 33 56 11 3 5 4 31 26 3 2 263
4. CONCLUSION a) The results of the survey compared fairly good to the 2002 survey. The previous
questionnaire, however, did not fall within the 95 % accuracy and ± 5 % confidence levels and wasn’t completely geographically representative. It should therefore not be regarded as a 100% accurate baseline to measure the 2003 results against.
b) The total area of jurisdiction of the City of uMhlathuze was covered by the survey and the
detail pertaining all individual areas is available to management if required. c) The results are statistically within the required 95 % accuracy and ± 5 % confidence levels
since the number of respondents in the majority of the calculations are more than required per response\question.
d) The comments in paragraph 3 above be noted and used for management information to
address negative perception and negative service levels in the areas where the most respondents expressed their comments.
e) The response on customer satisfaction was only aimed at households and no satisfaction
index was obtained for the commercial sector and will have to be included for the next annual customer satisfaction survey.
5. RECOMMENDATIONS That the results of this customer satisfaction survey be noted and that service levels be improved and maintained on a high standard especially in the areas where the satisfaction levels are not to standard and where the levels have declined if compared to the 2002 survey in order to best serve the community.