analysis of cfl purchases in vermont - home page...
TRANSCRIPT
22 HASKELL STREET, CAMBRIDGE, MA 02140 PHONE: (617) 497-7544 FAX: (617) 497-7543
WWW.NEXUSMARKETRESEARCH.COM
Analysis of CFL Purchases
in Vermont FINAL REPORT
Submitted to: Vermont Department of Public Service
Vermont Energy Investment Corporation
Submitted by: Nexus Market Research, Inc.
June 9, 2009
Analysis of CFL Purchases in Vermont – FINAL REPORT
Table of Contents
Executive Summary ........................................................................................................................ 1 1 Introduction............................................................................................................................. 3 2 CFL Awareness....................................................................................................................... 5 3 Purchases................................................................................................................................. 6 4 In-service Rate ...................................................................................................................... 20 5 Demographics ....................................................................................................................... 23 6 Net-to-Gross Analysis........................................................................................................... 29
Nexus Market Research
Analysis of CFL Purchases in Vermont – FINAL REPORT Page 1
Executive Summary The objective of this analysis is to provide the Department of Public Service and Vermont Energy Investment Corporation with information to characterize the current level of compact fluorescent light bulb (CFL) purchases in Vermont. The analysis provides the DPS with estimates of the market-level net-to-gross ratio, CFL purchases per household, and overall in-service rates. In addition, the analysis provides VEIC with information on the level and location of CFL purchases in two geotargeted regions: St. Albans and Newport/Derby. This section presents a summary of the key findings of this study for the entire state of Vermont; the GT results are presented solely in the main report. CFL Awareness. Overall, 97% of statewide respondents said they were familiar with one of the three styles of CFL bulbs described in the survey. CFL Purchases in the Past Year. Seventy-nine percent of respondents reported purchasing CFLs over the previous year. Respondents reported purchasing an average of ten CFLs over the previous year; this figure includes all survey respondents, including those who reported purchasing CFLs and not purchasing CFLs. CFL Purchases in the Past Three Months. One-half of all statewide respondents reported purchasing a CFL within the previous three months. Statewide, survey respondents reported purchasing an average of 3.6 CFLs and a median of 2.8 CFLs over the three months prior to the survey; this figure includes all survey respondents, including those who reported purchasing CFLs and not purchasing CFLs. Stores. Respondents from across Vermont were most likely to report purchasing CFLs within the previous three months from a hardware store (64%). Statewide, respondents reported purchasing 15% of CFLs at Wal-Mart, 14% at Aubuchon hardware, 13% at Costco, 11% at Ace hardware, and 9% at Home Depot. Towns. As might be expected, statewide purchases were not concentrated in any single town, though the highest concentrations were in the Burlington region, with 12% from Williston, 11% from Colchester, and 8% from Burlington. Efficiency Vermont. Statewide, 14% of respondents report using rebate coupons to purchase 12% of CFLs, and 35% of CFLs were identified as likely markdown CFLs, purchased by 44% of respondents. In-Service Rate. Seventy-six percent of CFLs purchased within the previous three months are currently installed, 2% have been removed, and respondents plan to install 13% of CFLS in the coming year. Respondents report that 89% of the installed CFL bulbs replaced incandescent bulbs, 8% replaced other CFLs, and 3% were installed in new fixtures.
Nexus Market Research
Analysis of CFL Purchases in Vermont –FINAL REPORT Page 2
Demographics. Compared to the population of Vermont (according to the American Community Survey) Vermont CFL purchasers are more likely to own their homes, live in single-family homes, and live in larger-sized homes, as well as be higher educated and older. Respondents with a college degree or above reported purchasing an average of 5.2 CFLs over the past three months and 12.1 CFLs over the past year; these figures are significantly higher (at the 90% confidence level) than those reported by respondents with less than a college degree (3.9 CFLs over the past three months and 8.7 CFLs over the past year). A similar pattern is evident for respondents with annual household incomes of $50,000 or above versus those earning less than $50,000 and for respondents who own their home versus rent. Net-to-Gross Ratio. Our approach for estimating the baseline, program effects, and net-to-gross ratio (inclusive of market-level freeridership and spillover) for Vermont relies on a comparison area—that is, an area that has similar demographic patterns as Vermont, but no active CFL promotion programs. However, because of limited resources available for this study, we considered two comparison areas with publicly available data: Michigan1 and Georgia/Kansas/Pennsylvania.2 The demographic characteristics of each of these regions differ from those of Vermont. Thus, we opt to develop multiple scenarios using both Michigan and GA/KS/PA as comparison regions with different time periods and weighting schemes. The market for CFLs has rapidly expanded over the past several years; national shipments of CFLs quadrupled from approximately 93 million in 2004 to nearly 400 million in 2007, before declining somewhat in 2008.3 Because of the rapid growth in CFL sales, many of the non-program regions have also experienced a surge in CFL sales, led by national retailers such as Wal-Mart, Home Depot, and Lowes. In addition, the CFL has become the symbol of the “green” movement, and thus appears more often in the media, leading to greater familiarity. All of these factors will likely result in a smaller difference in sales per household between states with programs and states without programs. Lastly, Vermont has supported CFLs for several years, helping to establish a mature market in which CFL saturation is relatively high; this may eventually lead to declining demand for CFLs. For all of these reasons, we would expect to see declining NTG ratios in Vermont over the next several years, and therefore recommend using a conservative NTG estimate — 1.09. The NTG estimate of 1.09 was calculated using GA/KS/PA as the baseline area with an analysis that weighted the Vermont data to reflect the demographic characteristics of the baseline area. The GA/KS/PA surveys were conducted just prior to the Vermont surveys, thus we believe the results are more comparable than the Michigan surveys, which were conducted over six months prior. In addition, given the differences in demographics between the Vermont survey respondents and the baseline data, the weighted analysis facilitates a more direct comparison.
1 Glacier Consulting Group, LLC and Prahl Associates, FY08 CFL Customer Research, Final Report, September 30, 2008. 2 Cadmus Group, KEMA, Itron, Nexus Market Research, and A. Goett Consulting. Compact Fluorescent Lamps Market Effects Interim Report – DRAFT. For the California Public Utilities Commission, Energy Division. January 22, 2009. 3 U.S. Department of Commerce
Nexus Market Research
Analysis of CFL Purchases in Vermont –FINAL REPORT Page 3
However, note that the weighted Michigan analysis yields a very similar NTG value — 1.06, which appears to confirm our recommended NTG estimate of 1.09.
1 Introduction The objective of this analysis is to provide the Department of Public Service (DPS) and Vermont Energy Investment Corporation (VEIC) with information to characterize the current level of compact fluorescent lamp (CFL) purchases in Vermont. The analysis provides the DPS with information to estimate the market-level net-to-gross ratio, CFL purchases per household, and overall in-service rates. In addition, the analysis provides VEIC with information on the level and location of CFL purchases in two geotargeted (GT) regions.4 The CFL purchase data were collected through a random digit dial telephone survey conducted with 404 Vermont residents between December 2nd and December 8th, 2008. The response rate for the survey is estimated to be 40%.5 A total of 203 surveys were conducted with residents from throughout Vermont who reported purchasing at least one CFL within the past three months. After finishing the statewide surveys, an additional 98 surveys were done with residents from the St. Albans region and 103 surveys with residents from the Newport/Derby region who reported purchasing at least one CFL within the past three months.6 The two GT region samples are entirely independent from the statewide sample. Because comparing the GT results to the statewide results was not a major thrust of the analysis, we did not conduct statistical tests between the results of the GT samples and the statewide sample. The original survey did not collect demographic data for statewide respondents who reported not purchasing CFLs in the previous three months (and thus were screened out of the survey); these respondents were called back between March 2nd and March 8th, 2008. Of the 227 statewide respondents who screened out, demographic data was collected for 142 respondents during these call backs. A proportion of 50% (i.e., one-half of respondents reply “yes” to a given question) provides the largest sampling error. Assuming a proportion of 50%, a sample size of 200 provides a sampling
4 Beginning in 2006, Efficiency Vermont has conducted targeted lighting campaigns in the GT regions that consisted of enhanced marketing and special coupon offers. The marketing included additional newspaper ads, coordination with local energy committees, recruitment of local influencers (politicians, civic minded residents, etc) to speak out, and hosting employee events and booths at home shows. In addition, the campaign mailed special CFL coupons to GT accounts. Residential customers could buy two CFLs and get one free or buy four CFLs and get two free; commercial accounts could buy one CFL and get one free. These special coupons were layered atop the typical buydown programs. 5 The response rate was calculated using a Council of America Survey Research Organization (CASRO) methodology. 6 The following telephone exchange codes (in the 802 area code) were used to identify residents in the two GT regions:
St. Albans: 309, 370, 524, 527, 713, 752, 782 Newport/Derby: 313, 323, 334, 487, 619, 673, 766, 880
Nexus Market Research
Analysis of CFL Purchases in Vermont –FINAL REPORT Page 4
error of about ±6% at the 90% confidence level while a sample size of 100 yields a sampling error of less than ±9% at the 90% confidence level. The following sections present the results of the telephone survey for the entire state of Vermont and the two GT regions. The report concludes with an analysis net-to-gross ratio for the entire state.
Nexus Market Research
Analysis of CFL Purchases in Vermont –FINAL REPORT Page 5
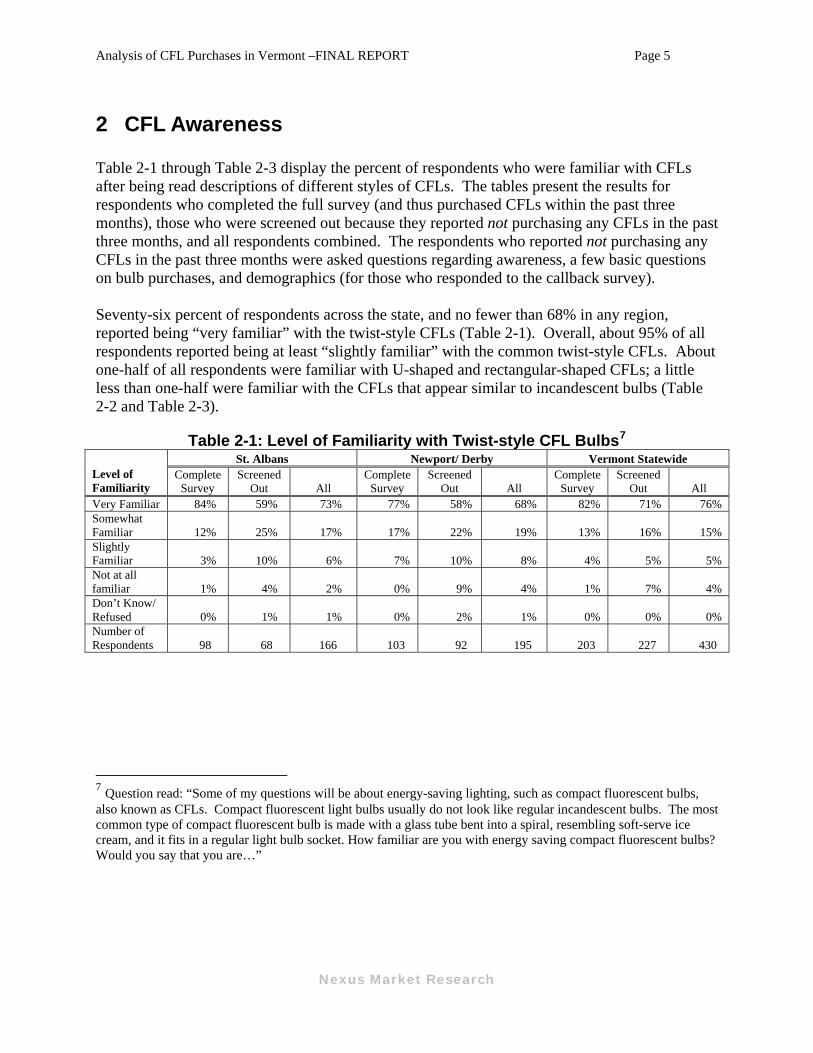
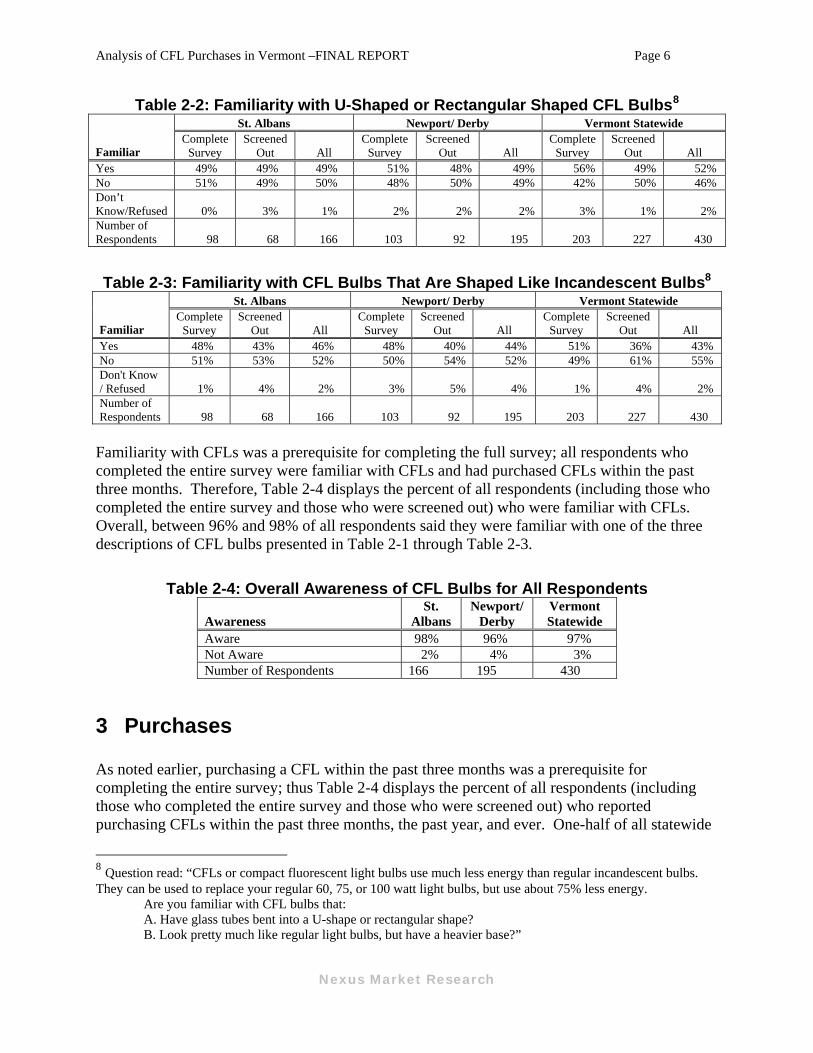
2 CFL Awareness Table 2-1 through Table 2-3 display the percent of respondents who were familiar with CFLs after being read descriptions of different styles of CFLs. The tables present the results for respondents who completed the full survey (and thus purchased CFLs within the past three months), those who were screened out because they reported not purchasing any CFLs in the past three months, and all respondents combined. The respondents who reported not purchasing any CFLs in the past three months were asked questions regarding awareness, a few basic questions on bulb purchases, and demographics (for those who responded to the callback survey). Seventy-six percent of respondents across the state, and no fewer than 68% in any region, reported being “very familiar” with the twist-style CFLs (Table 2-1). Overall, about 95% of all respondents reported being at least “slightly familiar” with the common twist-style CFLs. About one-half of all respondents were familiar with U-shaped and rectangular-shaped CFLs; a little less than one-half were familiar with the CFLs that appear similar to incandescent bulbs (Table 2-2 and Table 2-3).
Table 2-1: Level of Familiarity with Twist-style CFL Bulbs7 St. Albans Newport/ Derby Vermont Statewide
Level of Familiarity
Complete Survey
Screened Out All
Complete Survey
Screened Out All
Complete Survey
Screened Out All
Very Familiar 84% 59% 73% 77% 58% 68% 82% 71% 76% Somewhat Familiar 12% 25% 17% 17% 22% 19% 13% 16% 15% Slightly Familiar 3% 10% 6% 7% 10% 8% 4% 5% 5% Not at all familiar 1% 4% 2% 0% 9% 4% 1% 7% 4% Don’t Know/ Refused 0% 1% 1% 0% 2% 1% 0% 0% 0% Number of Respondents 98 68 166 103 92 195 203 227 430
7 Question read: “Some of my questions will be about energy-saving lighting, such as compact fluorescent bulbs, also known as CFLs. Compact fluorescent light bulbs usually do not look like regular incandescent bulbs. The most common type of compact fluorescent bulb is made with a glass tube bent into a spiral, resembling soft-serve ice cream, and it fits in a regular light bulb socket. How familiar are you with energy saving compact fluorescent bulbs? Would you say that you are…”
Nexus Market Research
Analysis of CFL Purchases in Vermont –FINAL REPORT Page 6
Table 2-2: Familiarity with U-Shaped or Rectangular Shaped CFL Bulbs8 St. Albans Newport/ Derby Vermont Statewide
Familiar Complete
Survey Screened
Out All Complete
Survey Screened
Out All Complete
Survey Screened
Out All Yes 49% 49% 49% 51% 48% 49% 56% 49% 52% No 51% 49% 50% 48% 50% 49% 42% 50% 46% Don’t Know/Refused 0% 3% 1% 2% 2% 2% 3% 1% 2% Number of Respondents 98 68 166 103 92 195 203 227 430
Table 2-3: Familiarity with CFL Bulbs That Are Shaped Like Incandescent Bulbs8 St. Albans Newport/ Derby Vermont Statewide
Familiar Complete
Survey Screened
Out All Complete
Survey Screened
Out All Complete
Survey Screened
Out All Yes 48% 43% 46% 48% 40% 44% 51% 36% 43% No 51% 53% 52% 50% 54% 52% 49% 61% 55% Don't Know / Refused 1% 4% 2% 3% 5% 4% 1% 4% 2% Number of Respondents 98 68 166 103 92 195 203 227 430
Familiarity with CFLs was a prerequisite for completing the full survey; all respondents who completed the entire survey were familiar with CFLs and had purchased CFLs within the past three months. Therefore, Table 2-4 displays the percent of all respondents (including those who completed the entire survey and those who were screened out) who were familiar with CFLs. Overall, between 96% and 98% of all respondents said they were familiar with one of the three descriptions of CFL bulbs presented in Table 2-1 through Table 2-3.
Table 2-4: Overall Awareness of CFL Bulbs for All Respondents
Awareness St.
Albans Newport/
Derby Vermont Statewide
Aware 98% 96% 97% Not Aware 2% 4% 3% Number of Respondents 166 195 430
3 Purchases As noted earlier, purchasing a CFL within the past three months was a prerequisite for completing the entire survey; thus Table 2-4 displays the percent of all respondents (including those who completed the entire survey and those who were screened out) who reported purchasing CFLs within the past three months, the past year, and ever. One-half of all statewide
8 Question read: “CFLs or compact fluorescent light bulbs use much less energy than regular incandescent bulbs. They can be used to replace your regular 60, 75, or 100 watt light bulbs, but use about 75% less energy.
Are you familiar with CFL bulbs that: A. Have glass tubes bent into a U-shape or rectangular shape? B. Look pretty much like regular light bulbs, but have a heavier base?”
Nexus Market Research
Analysis of CFL Purchases in Vermont –FINAL REPORT Page 7
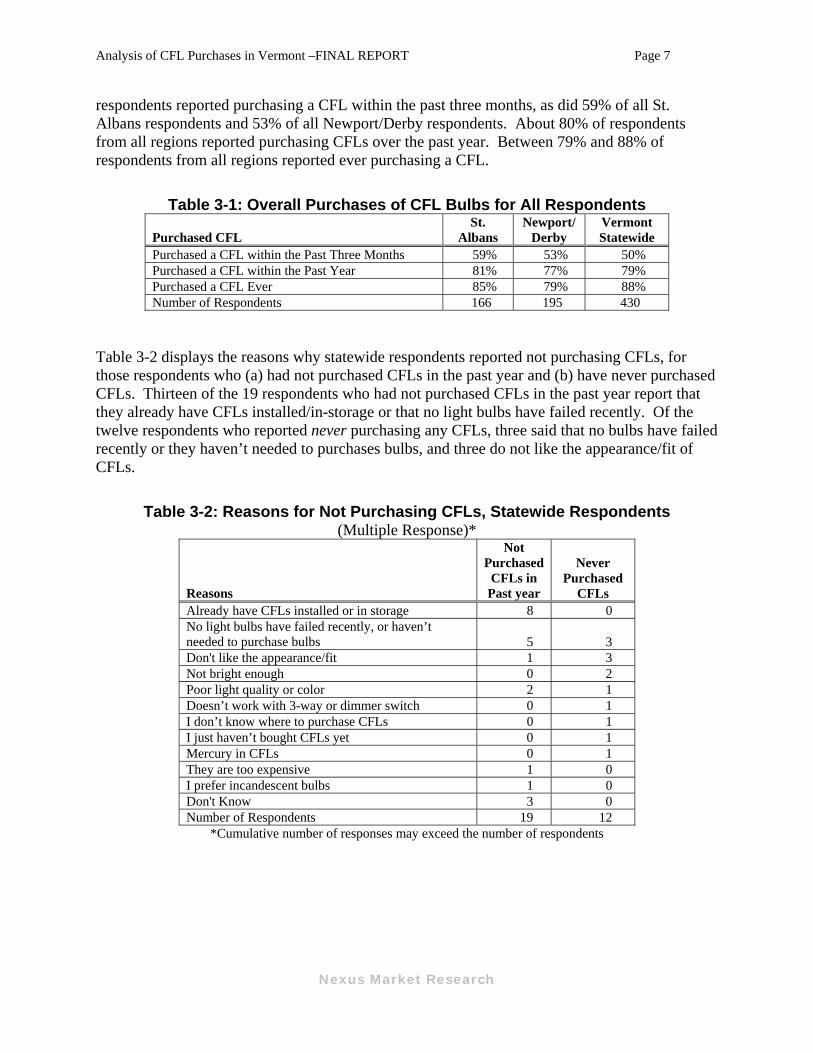
respondents reported purchasing a CFL within the past three months, as did 59% of all St. Albans respondents and 53% of all Newport/Derby respondents. About 80% of respondents from all regions reported purchasing CFLs over the past year. Between 79% and 88% of respondents from all regions reported ever purchasing a CFL.
Table 3-1: Overall Purchases of CFL Bulbs for All Respondents
Purchased CFL St.
Albans Newport/
Derby Vermont Statewide
Purchased a CFL within the Past Three Months 59% 53% 50% Purchased a CFL within the Past Year 81% 77% 79% Purchased a CFL Ever 85% 79% 88% Number of Respondents 166 195 430
Table 3-2 displays the reasons why statewide respondents reported not purchasing CFLs, for those respondents who (a) had not purchased CFLs in the past year and (b) have never purchased CFLs. Thirteen of the 19 respondents who had not purchased CFLs in the past year report that they already have CFLs installed/in-storage or that no light bulbs have failed recently. Of the twelve respondents who reported never purchasing any CFLs, three said that no bulbs have failed recently or they haven’t needed to purchases bulbs, and three do not like the appearance/fit of CFLs.
Table 3-2: Reasons for Not Purchasing CFLs, Statewide Respondents (Multiple Response)*
Reasons
Not Purchased
CFLs in Past year
Never Purchased
CFLs Already have CFLs installed or in storage 8 0 No light bulbs have failed recently, or haven’t needed to purchase bulbs 5 3 Don't like the appearance/fit 1 3 Not bright enough 0 2 Poor light quality or color 2 1 Doesn’t work with 3-way or dimmer switch 0 1 I don’t know where to purchase CFLs 0 1 I just haven’t bought CFLs yet 0 1 Mercury in CFLs 0 1 They are too expensive 1 0 I prefer incandescent bulbs 1 0 Don't Know 3 0 Number of Respondents 19 12
*Cumulative number of responses may exceed the number of respondents
Nexus Market Research
Analysis of CFL Purchases in Vermont –FINAL REPORT Page 8
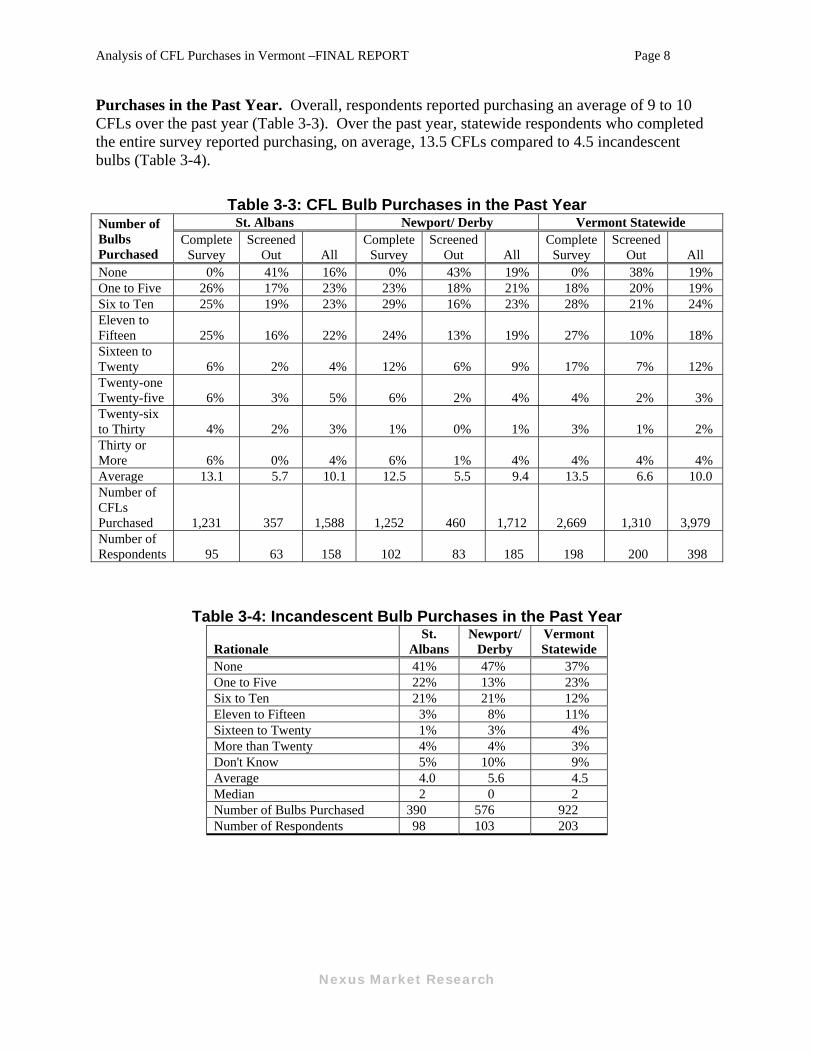
Purchases in the Past Year. Overall, respondents reported purchasing an average of 9 to 10 CFLs over the past year (Table 3-3). Over the past year, statewide respondents who completed the entire survey reported purchasing, on average, 13.5 CFLs compared to 4.5 incandescent bulbs (Table 3-4).
Table 3-3: CFL Bulb Purchases in the Past Year St. Albans Newport/ Derby Vermont Statewide Number of
Bulbs Purchased
Complete Survey
Screened Out All
Complete Survey
Screened Out All
Complete Survey
Screened Out All
None 0% 41% 16% 0% 43% 19% 0% 38% 19% One to Five 26% 17% 23% 23% 18% 21% 18% 20% 19% Six to Ten 25% 19% 23% 29% 16% 23% 28% 21% 24% Eleven to Fifteen 25% 16% 22% 24% 13% 19% 27% 10% 18% Sixteen to Twenty 6% 2% 4% 12% 6% 9% 17% 7% 12% Twenty-one Twenty-five 6% 3% 5% 6% 2% 4% 4% 2% 3% Twenty-six to Thirty 4% 2% 3% 1% 0% 1% 3% 1% 2% Thirty or More 6% 0% 4% 6% 1% 4% 4% 4% 4% Average 13.1 5.7 10.1 12.5 5.5 9.4 13.5 6.6 10.0 Number of CFLs Purchased 1,231 357 1,588 1,252 460 1,712 2,669 1,310 3,979 Number of Respondents 95 63 158 102 83 185 198 200 398
Table 3-4: Incandescent Bulb Purchases in the Past Year
Rationale St.
Albans Newport/
Derby Vermont Statewide
None 41% 47% 37% One to Five 22% 13% 23% Six to Ten 21% 21% 12% Eleven to Fifteen 3% 8% 11% Sixteen to Twenty 1% 3% 4% More than Twenty 4% 4% 3% Don't Know 5% 10% 9% Average 4.0 5.6 4.5 Median 2 0 2 Number of Bulbs Purchased 390 576 922 Number of Respondents 98 103 203
Nexus Market Research
Analysis of CFL Purchases in Vermont –FINAL REPORT Page 9
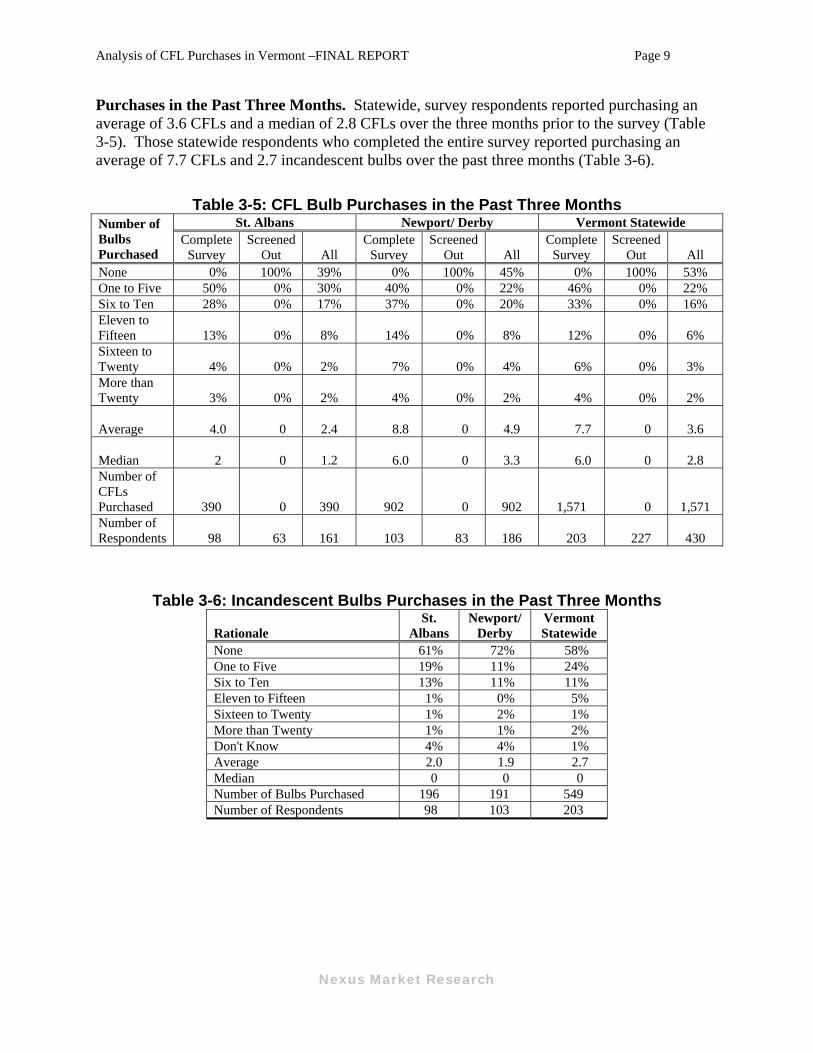
Purchases in the Past Three Months. Statewide, survey respondents reported purchasing an average of 3.6 CFLs and a median of 2.8 CFLs over the three months prior to the survey (Table 3-5). Those statewide respondents who completed the entire survey reported purchasing an average of 7.7 CFLs and 2.7 incandescent bulbs over the past three months (Table 3-6).
Table 3-5: CFL Bulb Purchases in the Past Three Months St. Albans Newport/ Derby Vermont Statewide Number of
Bulbs Purchased
Complete Survey
Screened Out All
Complete Survey
Screened Out All
Complete Survey
Screened Out All
None 0% 100% 39% 0% 100% 45% 0% 100% 53% One to Five 50% 0% 30% 40% 0% 22% 46% 0% 22% Six to Ten 28% 0% 17% 37% 0% 20% 33% 0% 16% Eleven to Fifteen 13% 0% 8% 14% 0% 8% 12% 0% 6% Sixteen to Twenty 4% 0% 2% 7% 0% 4% 6% 0% 3% More than Twenty 3% 0% 2% 4% 0% 2% 4% 0% 2%
Average 4.0 0
2.4 8.8 0
4.9 7.7 0
3.6
Median 2 0
1.2 6.0 0
3.3 6.0 0
2.8 Number of CFLs Purchased 390 0 390 902 0 902 1,571 0 1,571 Number of Respondents 98 63 161 103 83 186 203 227 430
Table 3-6: Incandescent Bulbs Purchases in the Past Three Months
Rationale St.
Albans Newport/
Derby Vermont Statewide
None 61% 72% 58% One to Five 19% 11% 24% Six to Ten 13% 11% 11% Eleven to Fifteen 1% 0% 5% Sixteen to Twenty 1% 2% 1% More than Twenty 1% 1% 2% Don't Know 4% 4% 1% Average 2.0 1.9 2.7 Median 0 0 0 Number of Bulbs Purchased 196 191 549 Number of Respondents 98 103 203
Nexus Market Research
Analysis of CFL Purchases in Vermont –FINAL REPORT Page 10
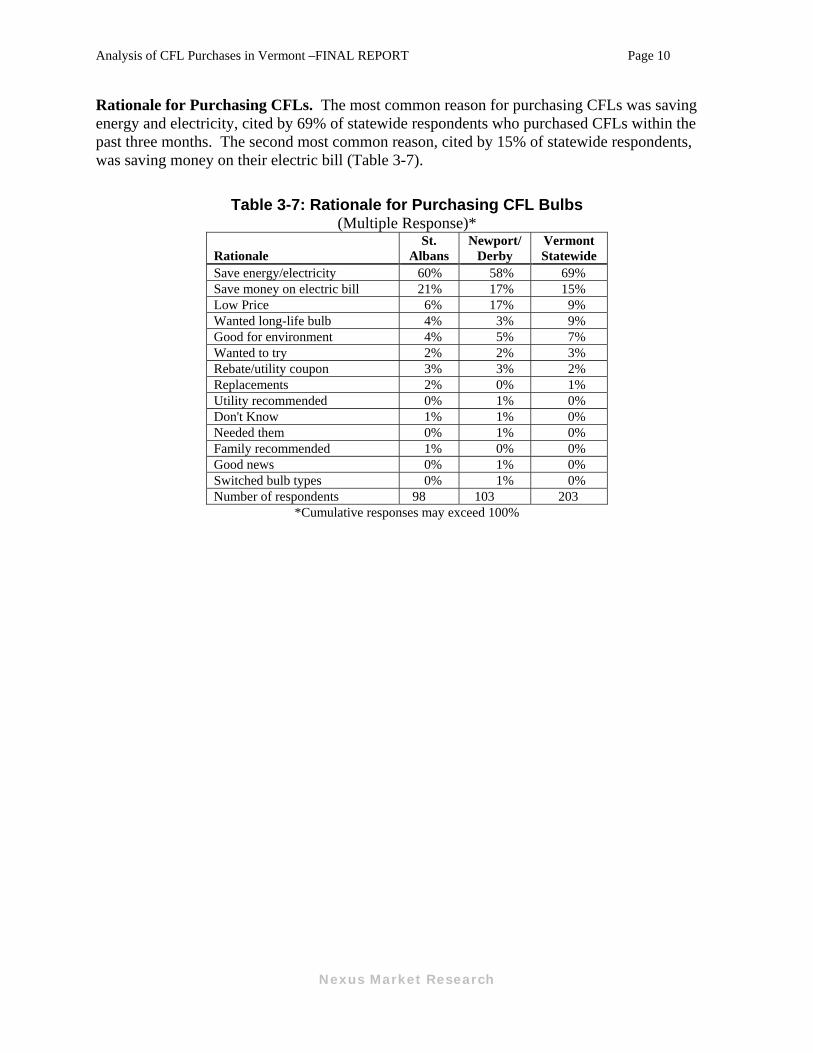
Rationale for Purchasing CFLs. The most common reason for purchasing CFLs was saving energy and electricity, cited by 69% of statewide respondents who purchased CFLs within the past three months. The second most common reason, cited by 15% of statewide respondents, was saving money on their electric bill (Table 3-7).
Table 3-7: Rationale for Purchasing CFL Bulbs (Multiple Response)*
Rationale St.
Albans Newport/
Derby Vermont Statewide
Save energy/electricity 60% 58% 69% Save money on electric bill 21% 17% 15% Low Price 6% 17% 9% Wanted long-life bulb 4% 3% 9% Good for environment 4% 5% 7% Wanted to try 2% 2% 3% Rebate/utility coupon 3% 3% 2% Replacements 2% 0% 1% Utility recommended 0% 1% 0% Don't Know 1% 1% 0% Needed them 0% 1% 0% Family recommended 1% 0% 0% Good news 0% 1% 0% Switched bulb types 0% 1% 0% Number of respondents 98 103 203
*Cumulative responses may exceed 100%
Nexus Market Research
Analysis of CFL Purchases in Vermont –FINAL REPORT Page 11
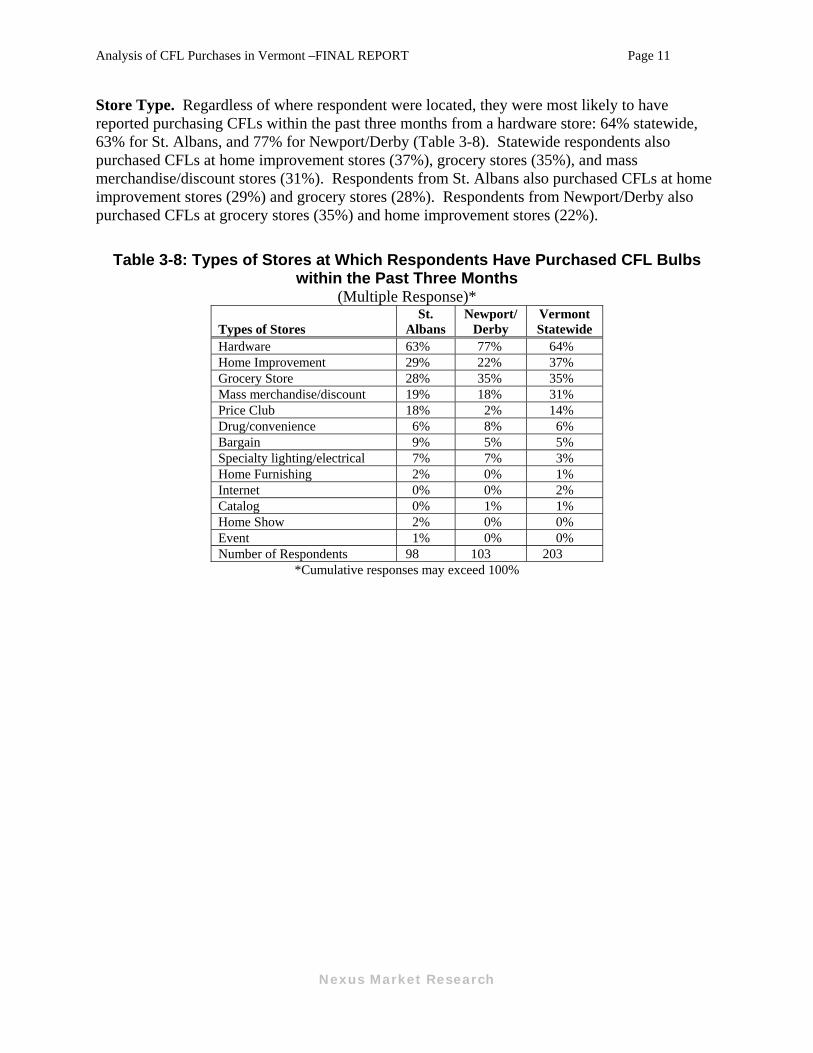
Store Type. Regardless of where respondent were located, they were most likely to have reported purchasing CFLs within the past three months from a hardware store: 64% statewide, 63% for St. Albans, and 77% for Newport/Derby (Table 3-8). Statewide respondents also purchased CFLs at home improvement stores (37%), grocery stores (35%), and mass merchandise/discount stores (31%). Respondents from St. Albans also purchased CFLs at home improvement stores (29%) and grocery stores (28%). Respondents from Newport/Derby also purchased CFLs at grocery stores (35%) and home improvement stores (22%).
Table 3-8: Types of Stores at Which Respondents Have Purchased CFL Bulbs within the Past Three Months
(Multiple Response)*
Types of Stores St.
Albans Newport/
Derby Vermont Statewide
Hardware 63% 77% 64% Home Improvement 29% 22% 37% Grocery Store 28% 35% 35% Mass merchandise/discount 19% 18% 31% Price Club 18% 2% 14% Drug/convenience 6% 8% 6% Bargain 9% 5% 5% Specialty lighting/electrical 7% 7% 3% Home Furnishing 2% 0% 1% Internet 0% 0% 2% Catalog 0% 1% 1% Home Show 2% 0% 0% Event 1% 0% 0% Number of Respondents 98 103 203
*Cumulative responses may exceed 100%
Nexus Market Research
Analysis of CFL Purchases in Vermont –FINAL REPORT Page 12
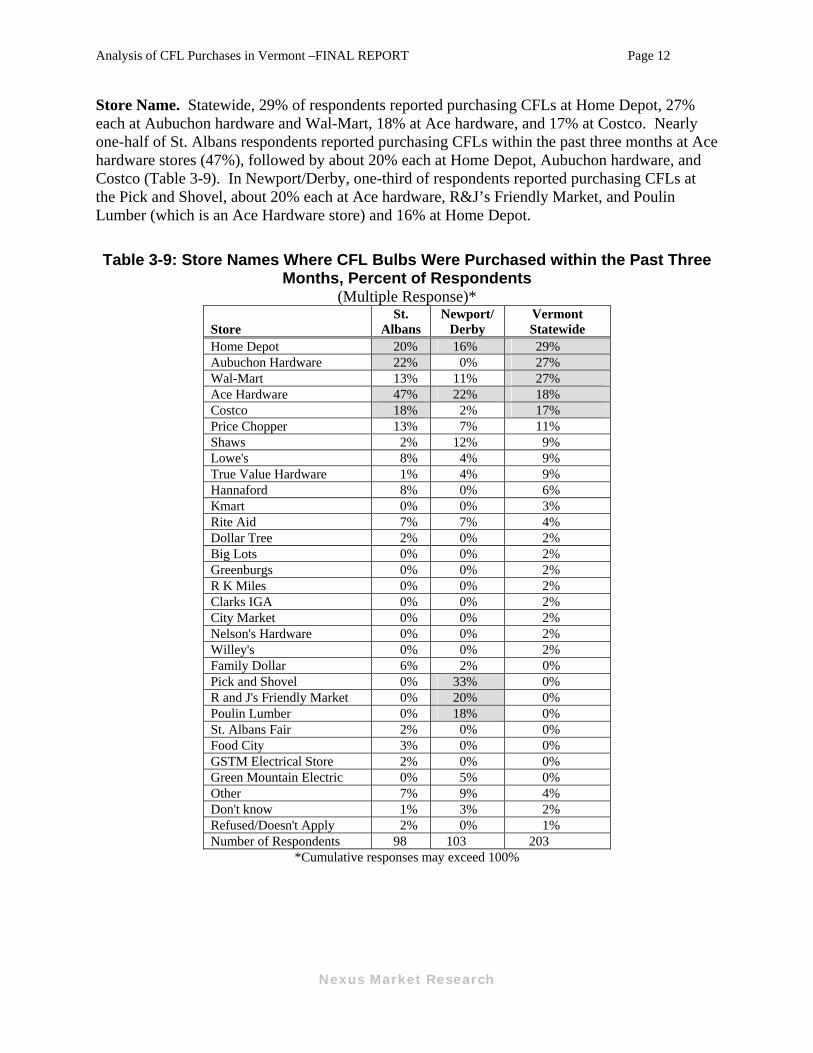
Store Name. Statewide, 29% of respondents reported purchasing CFLs at Home Depot, 27% each at Aubuchon hardware and Wal-Mart, 18% at Ace hardware, and 17% at Costco. Nearly one-half of St. Albans respondents reported purchasing CFLs within the past three months at Ace hardware stores (47%), followed by about 20% each at Home Depot, Aubuchon hardware, and Costco (Table 3-9). In Newport/Derby, one-third of respondents reported purchasing CFLs at the Pick and Shovel, about 20% each at Ace hardware, R&J’s Friendly Market, and Poulin Lumber (which is an Ace Hardware store) and 16% at Home Depot.
Table 3-9: Store Names Where CFL Bulbs Were Purchased within the Past Three Months, Percent of Respondents
(Multiple Response)*
Store St.
Albans Newport/
Derby Vermont Statewide
Home Depot 20% 16% 29% Aubuchon Hardware 22% 0% 27% Wal-Mart 13% 11% 27% Ace Hardware 47% 22% 18% Costco 18% 2% 17% Price Chopper 13% 7% 11% Shaws 2% 12% 9% Lowe's 8% 4% 9% True Value Hardware 1% 4% 9% Hannaford 8% 0% 6% Kmart 0% 0% 3% Rite Aid 7% 7% 4% Dollar Tree 2% 0% 2% Big Lots 0% 0% 2% Greenburgs 0% 0% 2% R K Miles 0% 0% 2% Clarks IGA 0% 0% 2% City Market 0% 0% 2% Nelson's Hardware 0% 0% 2% Willey's 0% 0% 2% Family Dollar 6% 2% 0% Pick and Shovel 0% 33% 0% R and J's Friendly Market 0% 20% 0% Poulin Lumber 0% 18% 0% St. Albans Fair 2% 0% 0% Food City 3% 0% 0% GSTM Electrical Store 2% 0% 0% Green Mountain Electric 0% 5% 0% Other 7% 9% 4% Don't know 1% 3% 2% Refused/Doesn't Apply 2% 0% 1% Number of Respondents 98 103 203
*Cumulative responses may exceed 100%
Nexus Market Research
Analysis of CFL Purchases in Vermont –FINAL REPORT Page 13
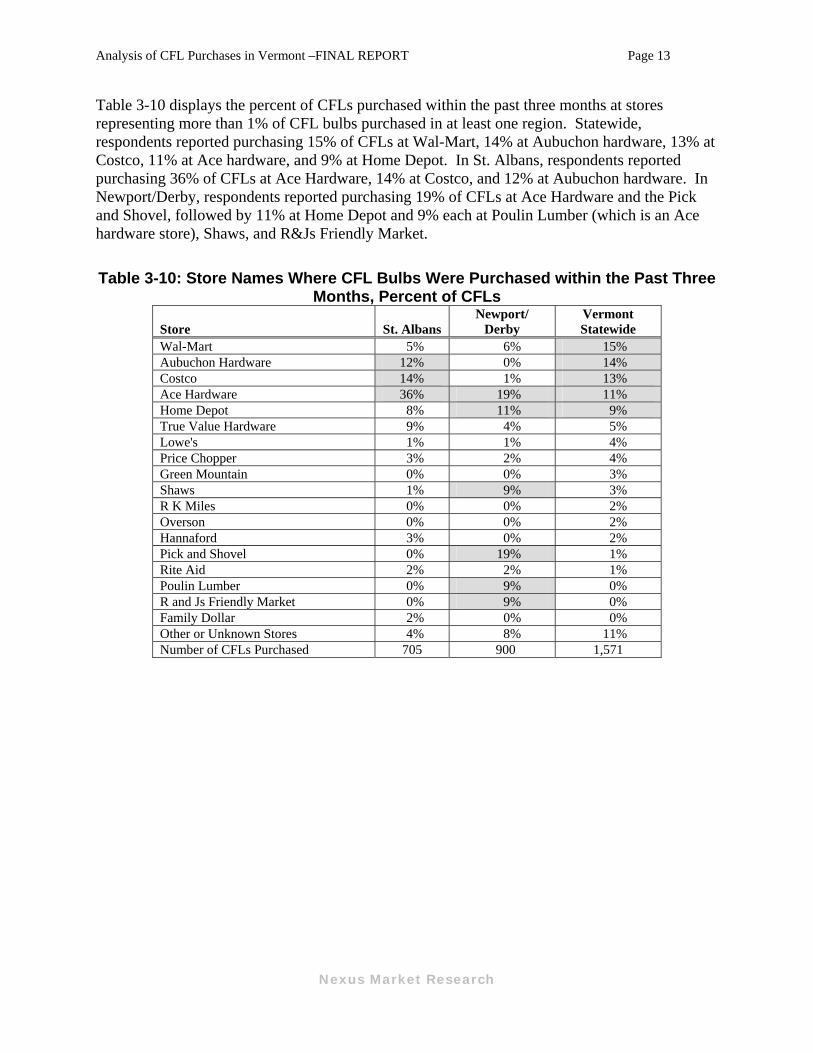
Table 3-10 displays the percent of CFLs purchased within the past three months at stores representing more than 1% of CFL bulbs purchased in at least one region. Statewide, respondents reported purchasing 15% of CFLs at Wal-Mart, 14% at Aubuchon hardware, 13% at Costco, 11% at Ace hardware, and 9% at Home Depot. In St. Albans, respondents reported purchasing 36% of CFLs at Ace Hardware, 14% at Costco, and 12% at Aubuchon hardware. In Newport/Derby, respondents reported purchasing 19% of CFLs at Ace Hardware and the Pick and Shovel, followed by 11% at Home Depot and 9% each at Poulin Lumber (which is an Ace hardware store), Shaws, and R&Js Friendly Market.
Table 3-10: Store Names Where CFL Bulbs Were Purchased within the Past Three Months, Percent of CFLs
Store St. Albans Newport/
Derby Vermont Statewide
Wal-Mart 5% 6% 15% Aubuchon Hardware 12% 0% 14% Costco 14% 1% 13% Ace Hardware 36% 19% 11% Home Depot 8% 11% 9% True Value Hardware 9% 4% 5% Lowe's 1% 1% 4% Price Chopper 3% 2% 4% Green Mountain 0% 0% 3% Shaws 1% 9% 3% R K Miles 0% 0% 2% Overson 0% 0% 2% Hannaford 3% 0% 2% Pick and Shovel 0% 19% 1% Rite Aid 2% 2% 1% Poulin Lumber 0% 9% 0% R and Js Friendly Market 0% 9% 0% Family Dollar 2% 0% 0% Other or Unknown Stores 4% 8% 11% Number of CFLs Purchased 705 900 1,571
Nexus Market Research

Analysis of CFL Purchases in Vermont –FINAL REPORT Page 14
Towns. Statewide, nearly one-third of respondents reported purchasing CFLs in Williston, 20% in Burlington, 17% in Colchester, 15% in Bennington, 12% in South Burlington, and 10% in Rutland. All St. Albans respondents reported purchasing CFLs within the past three months at stores located in St. Albans and 28% reported purchasing CFLs in Williston (Table 3-11). In Newport/Derby, 71% of respondents reported purchasing CFLs in Newport and 65% in Derby.
Table 3-11: Town Where CFLs Were Purchased within the Past Three Months, Percent of Respondents
(Multiple Response)* Town St. Albans Newport/ Derby Vermont Statewide Williston 28% 4% 32% Burlington 9% 7% 20% Colchester 19% 0% 17% Bennington 0% 0% 15% South Burlington 3% 0% 12% Rutland 0% 0% 10% Barre 0% 0% 9% Essex 0% 0% 8% St. Albans 109% 3% 6% St. Johnsbury 0% 1% 5% Brattleboro 0% 0% 4% Middlebury 0% 0% 4% Montpelier 0% 0% 4% Morristown 1% 0% 4% Berlin 0% 0% 4% Morrisville 0% 0% 3% Jericho 1% 0% 2% Enosburg Falls 1% 0% 2% Vermont 0% 0% 2% London Derry 0% 0% 2% Waterbury 0% 0% 2% Richmond 0% 0% 2% Randolph 0% 0% 2% Stowe 0% 0% 2% Georgia 1% 0% 1% Hartford 0% 0% 1% Lyndon 0% 0% 1% Milton 5% 0% 1% Newport 1% 71% 1% Shelburne 0% 0% 1% Winooski 2% 0% 1% Bristol 0% 0% 1% Windsor 0% 0% 1% Pownal 0% 0% 1% Manchester 0% 0% 1% Greensboro 0% 0% 1% Derby 0% 65% 0% Rockingham 0% 1% 0% Orleans 0% 1% 0% Westfield 0% 1% 0% Number of Respondents 98 103 203
*Cumulative responses may exceed 100%
Nexus Market Research
Analysis of CFL Purchases in Vermont –FINAL REPORT Page 15
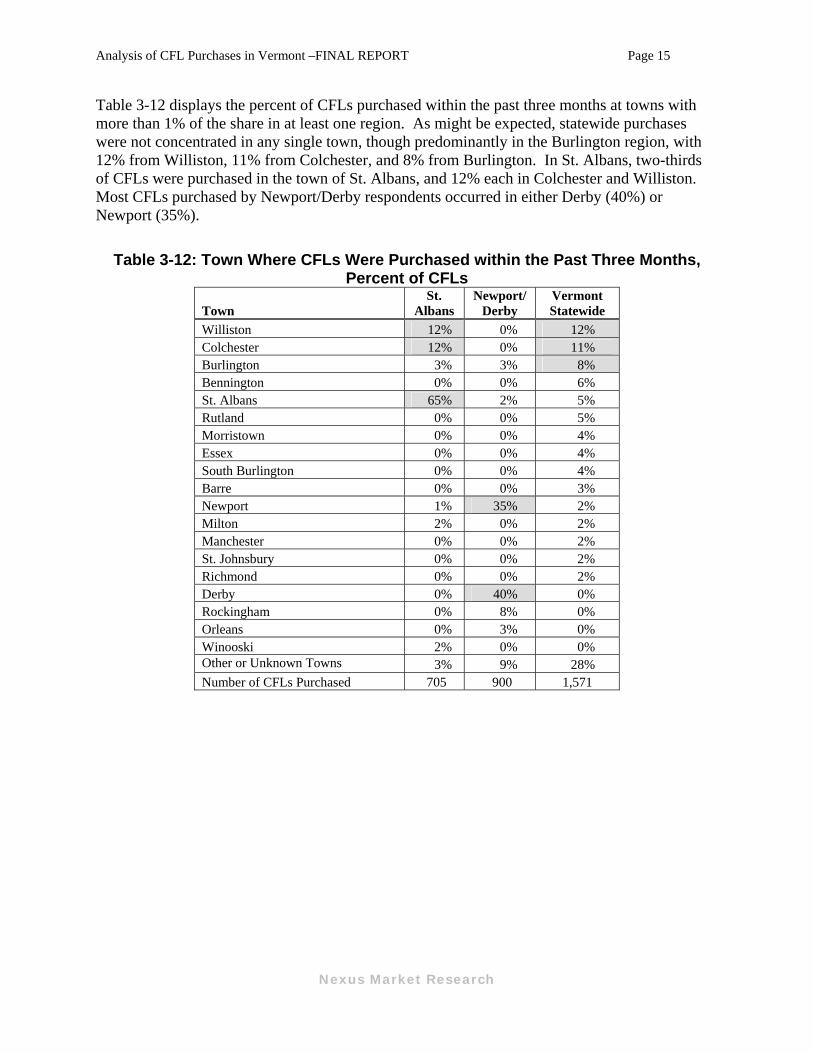
Table 3-12 displays the percent of CFLs purchased within the past three months at towns with more than 1% of the share in at least one region. As might be expected, statewide purchases were not concentrated in any single town, though predominantly in the Burlington region, with 12% from Williston, 11% from Colchester, and 8% from Burlington. In St. Albans, two-thirds of CFLs were purchased in the town of St. Albans, and 12% each in Colchester and Williston. Most CFLs purchased by Newport/Derby respondents occurred in either Derby (40%) or Newport (35%).
Table 3-12: Town Where CFLs Were Purchased within the Past Three Months, Percent of CFLs
Town St.
Albans Newport/
Derby Vermont Statewide
Williston 12% 0% 12% Colchester 12% 0% 11% Burlington 3% 3% 8% Bennington 0% 0% 6% St. Albans 65% 2% 5% Rutland 0% 0% 5% Morristown 0% 0% 4% Essex 0% 0% 4% South Burlington 0% 0% 4% Barre 0% 0% 3% Newport 1% 35% 2% Milton 2% 0% 2% Manchester 0% 0% 2% St. Johnsbury 0% 0% 2% Richmond 0% 0% 2% Derby 0% 40% 0% Rockingham 0% 8% 0% Orleans 0% 3% 0% Winooski 2% 0% 0% Other or Unknown Towns 3% 9% 28% Number of CFLs Purchased 705 900 1,571
Nexus Market Research
Analysis of CFL Purchases in Vermont –FINAL REPORT Page 16
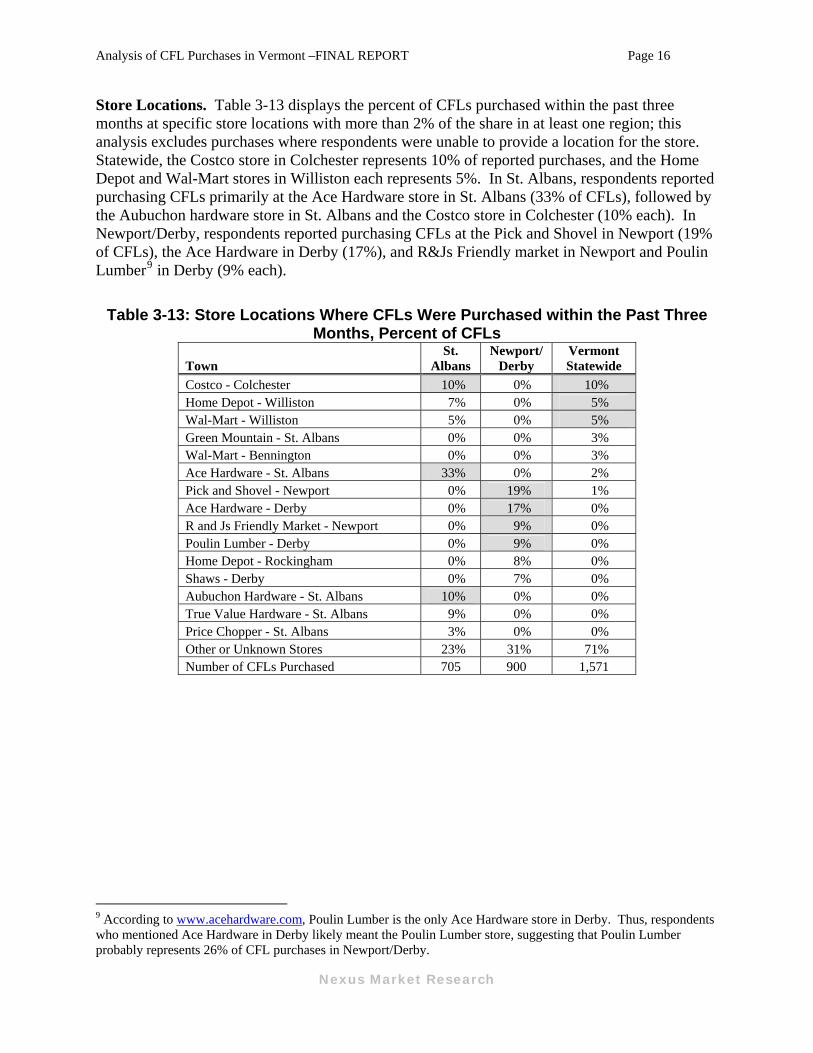
Store Locations. Table 3-13 displays the percent of CFLs purchased within the past three months at specific store locations with more than 2% of the share in at least one region; this analysis excludes purchases where respondents were unable to provide a location for the store. Statewide, the Costco store in Colchester represents 10% of reported purchases, and the Home Depot and Wal-Mart stores in Williston each represents 5%. In St. Albans, respondents reported purchasing CFLs primarily at the Ace Hardware store in St. Albans (33% of CFLs), followed by the Aubuchon hardware store in St. Albans and the Costco store in Colchester (10% each). In Newport/Derby, respondents reported purchasing CFLs at the Pick and Shovel in Newport (19% of CFLs), the Ace Hardware in Derby (17%), and R&Js Friendly market in Newport and Poulin Lumber9 in Derby (9% each).
Table 3-13: Store Locations Where CFLs Were Purchased within the Past Three Months, Percent of CFLs
Town St.
Albans Newport/
Derby Vermont Statewide
Costco - Colchester 10% 0% 10% Home Depot - Williston 7% 0% 5% Wal-Mart - Williston 5% 0% 5% Green Mountain - St. Albans 0% 0% 3% Wal-Mart - Bennington 0% 0% 3% Ace Hardware - St. Albans 33% 0% 2% Pick and Shovel - Newport 0% 19% 1% Ace Hardware - Derby 0% 17% 0% R and Js Friendly Market - Newport 0% 9% 0% Poulin Lumber - Derby 0% 9% 0% Home Depot - Rockingham 0% 8% 0% Shaws - Derby 0% 7% 0% Aubuchon Hardware - St. Albans 10% 0% 0% True Value Hardware - St. Albans 9% 0% 0% Price Chopper - St. Albans 3% 0% 0% Other or Unknown Stores 23% 31% 71% Number of CFLs Purchased 705 900 1,571
9 According to www.acehardware.com, Poulin Lumber is the only Ace Hardware store in Derby. Thus, respondents who mentioned Ace Hardware in Derby likely meant the Poulin Lumber store, suggesting that Poulin Lumber probably represents 26% of CFL purchases in Newport/Derby.
Nexus Market Research
Analysis of CFL Purchases in Vermont –FINAL REPORT Page 17
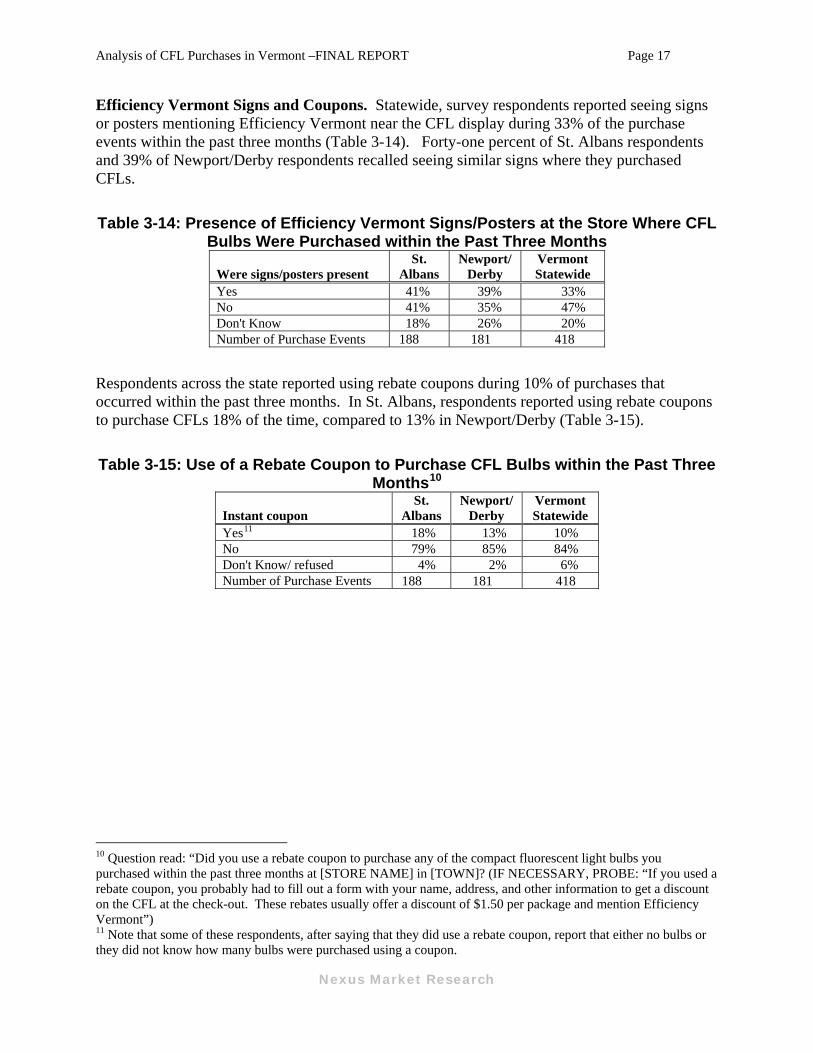
Efficiency Vermont Signs and Coupons. Statewide, survey respondents reported seeing signs or posters mentioning Efficiency Vermont near the CFL display during 33% of the purchase events within the past three months (Table 3-14). Forty-one percent of St. Albans respondents and 39% of Newport/Derby respondents recalled seeing similar signs where they purchased CFLs.
Table 3-14: Presence of Efficiency Vermont Signs/Posters at the Store Where CFL Bulbs Were Purchased within the Past Three Months
Were signs/posters present St.
Albans Newport/
Derby Vermont Statewide
Yes 41% 39% 33% No 41% 35% 47% Don't Know 18% 26% 20% Number of Purchase Events 188 181 418
Respondents across the state reported using rebate coupons during 10% of purchases that occurred within the past three months. In St. Albans, respondents reported using rebate coupons to purchase CFLs 18% of the time, compared to 13% in Newport/Derby (Table 3-15).
Table 3-15: Use of a Rebate Coupon to Purchase CFL Bulbs within the Past Three Months10
Instant coupon St.
Albans Newport/
Derby Vermont Statewide
Yes11 18% 13% 10% No 79% 85% 84% Don't Know/ refused 4% 2% 6% Number of Purchase Events 188 181 418
10 Question read: “Did you use a rebate coupon to purchase any of the compact fluorescent light bulbs you purchased within the past three months at [STORE NAME] in [TOWN]? (IF NECESSARY, PROBE: “If you used a rebate coupon, you probably had to fill out a form with your name, address, and other information to get a discount on the CFL at the check-out. These rebates usually offer a discount of $1.50 per package and mention Efficiency Vermont”) 11 Note that some of these respondents, after saying that they did use a rebate coupon, report that either no bulbs or they did not know how many bulbs were purchased using a coupon.
Nexus Market Research
Analysis of CFL Purchases in Vermont –FINAL REPORT Page 18
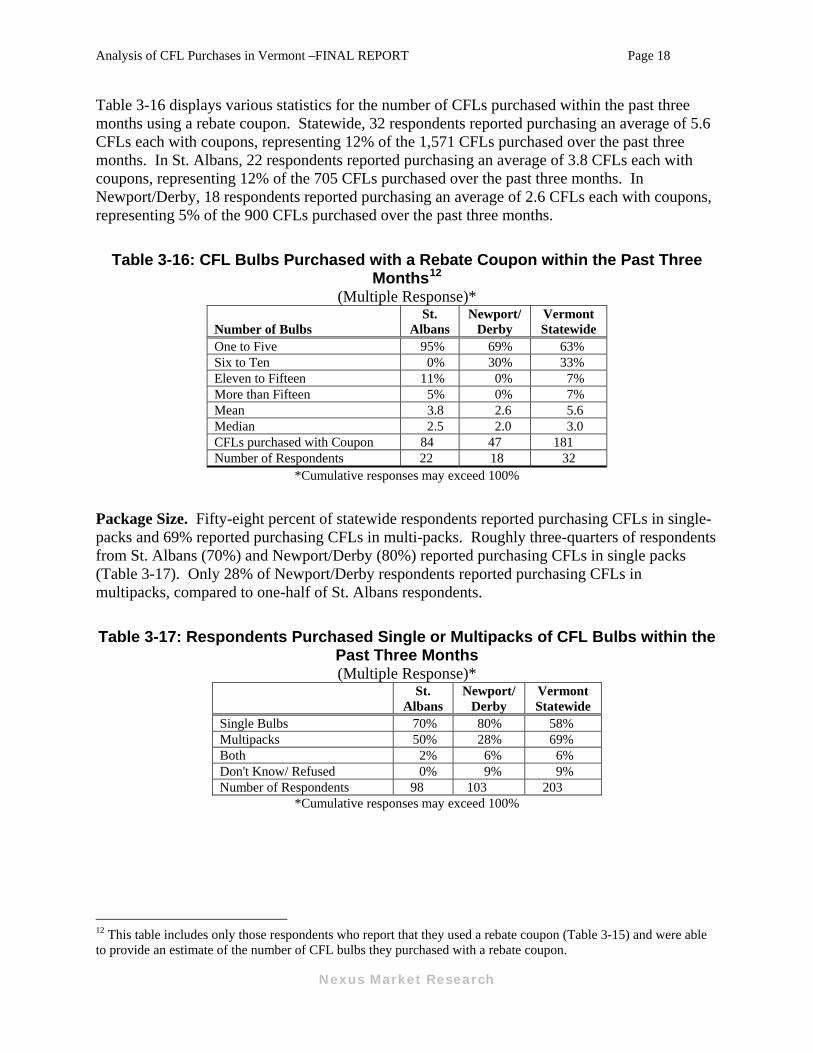
Table 3-16 displays various statistics for the number of CFLs purchased within the past three months using a rebate coupon. Statewide, 32 respondents reported purchasing an average of 5.6 CFLs each with coupons, representing 12% of the 1,571 CFLs purchased over the past three months. In St. Albans, 22 respondents reported purchasing an average of 3.8 CFLs each with coupons, representing 12% of the 705 CFLs purchased over the past three months. In Newport/Derby, 18 respondents reported purchasing an average of 2.6 CFLs each with coupons, representing 5% of the 900 CFLs purchased over the past three months.
Table 3-16: CFL Bulbs Purchased with a Rebate Coupon within the Past Three Months12
(Multiple Response)*
Number of Bulbs St.
Albans Newport/
Derby Vermont Statewide
One to Five 95% 69% 63% Six to Ten 0% 30% 33% Eleven to Fifteen 11% 0% 7% More than Fifteen 5% 0% 7% Mean 3.8 2.6 5.6 Median 2.5 2.0 3.0 CFLs purchased with Coupon 84 47 181 Number of Respondents 22 18 32
*Cumulative responses may exceed 100%
Package Size. Fifty-eight percent of statewide respondents reported purchasing CFLs in single-packs and 69% reported purchasing CFLs in multi-packs. Roughly three-quarters of respondents from St. Albans (70%) and Newport/Derby (80%) reported purchasing CFLs in single packs (Table 3-17). Only 28% of Newport/Derby respondents reported purchasing CFLs in multipacks, compared to one-half of St. Albans respondents.
Table 3-17: Respondents Purchased Single or Multipacks of CFL Bulbs within the Past Three Months (Multiple Response)*
St.
Albans Newport/
Derby Vermont Statewide
Single Bulbs 70% 80% 58% Multipacks 50% 28% 69% Both 2% 6% 6% Don't Know/ Refused 0% 9% 9% Number of Respondents 98 103 203
*Cumulative responses may exceed 100%
12 This table includes only those respondents who report that they used a rebate coupon (Table 3-15) and were able to provide an estimate of the number of CFL bulbs they purchased with a rebate coupon.
Nexus Market Research
Analysis of CFL Purchases in Vermont –FINAL REPORT Page 19
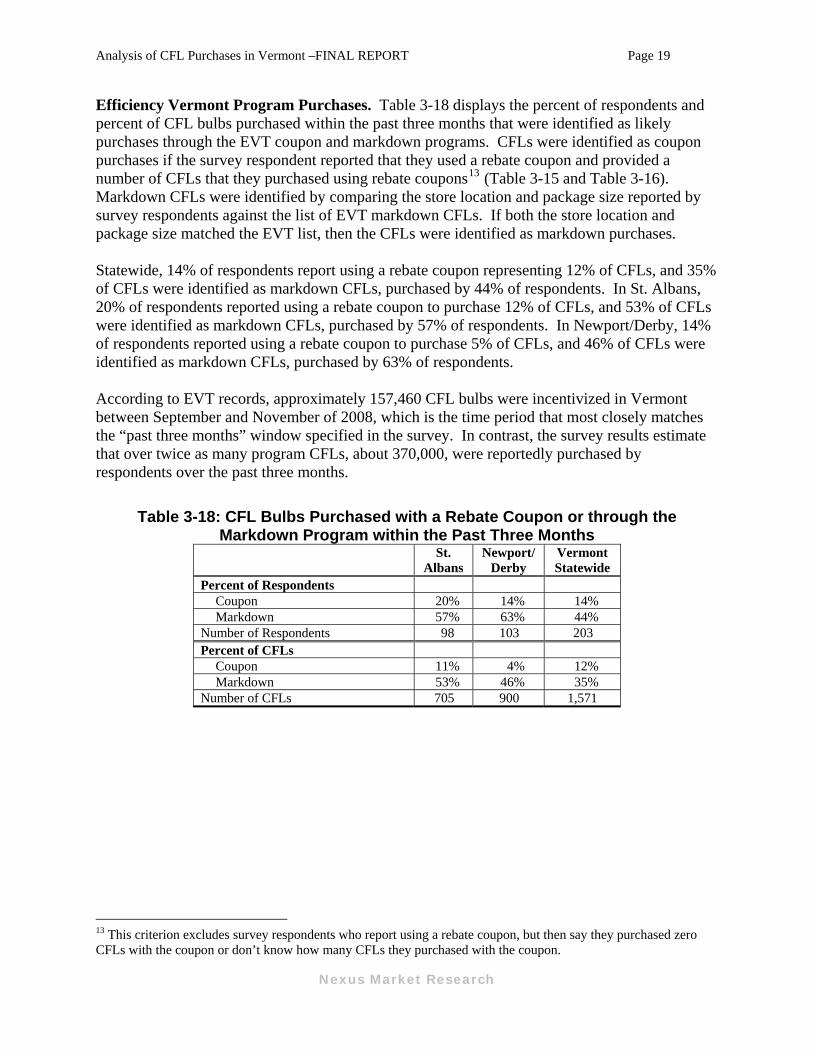
Efficiency Vermont Program Purchases. Table 3-18 displays the percent of respondents and percent of CFL bulbs purchased within the past three months that were identified as likely purchases through the EVT coupon and markdown programs. CFLs were identified as coupon purchases if the survey respondent reported that they used a rebate coupon and provided a number of CFLs that they purchased using rebate coupons13 (Table 3-15 and Table 3-16). Markdown CFLs were identified by comparing the store location and package size reported by survey respondents against the list of EVT markdown CFLs. If both the store location and package size matched the EVT list, then the CFLs were identified as markdown purchases. Statewide, 14% of respondents report using a rebate coupon representing 12% of CFLs, and 35% of CFLs were identified as markdown CFLs, purchased by 44% of respondents. In St. Albans, 20% of respondents reported using a rebate coupon to purchase 12% of CFLs, and 53% of CFLs were identified as markdown CFLs, purchased by 57% of respondents. In Newport/Derby, 14% of respondents reported using a rebate coupon to purchase 5% of CFLs, and 46% of CFLs were identified as markdown CFLs, purchased by 63% of respondents. According to EVT records, approximately 157,460 CFL bulbs were incentivized in Vermont between September and November of 2008, which is the time period that most closely matches the “past three months” window specified in the survey. In contrast, the survey results estimate that over twice as many program CFLs, about 370,000, were reportedly purchased by respondents over the past three months.
Table 3-18: CFL Bulbs Purchased with a Rebate Coupon or through the Markdown Program within the Past Three Months
St.
Albans Newport/
Derby Vermont Statewide
Percent of Respondents Coupon 20% 14% 14% Markdown 57% 63% 44%
Number of Respondents 98 103 203 Percent of CFLs
Coupon 11% 4% 12% Markdown 53% 46% 35%
Number of CFLs 705 900 1,571
13 This criterion excludes survey respondents who report using a rebate coupon, but then say they purchased zero CFLs with the coupon or don’t know how many CFLs they purchased with the coupon.
Nexus Market Research
Analysis of CFL Purchases in Vermont –FINAL REPORT Page 20
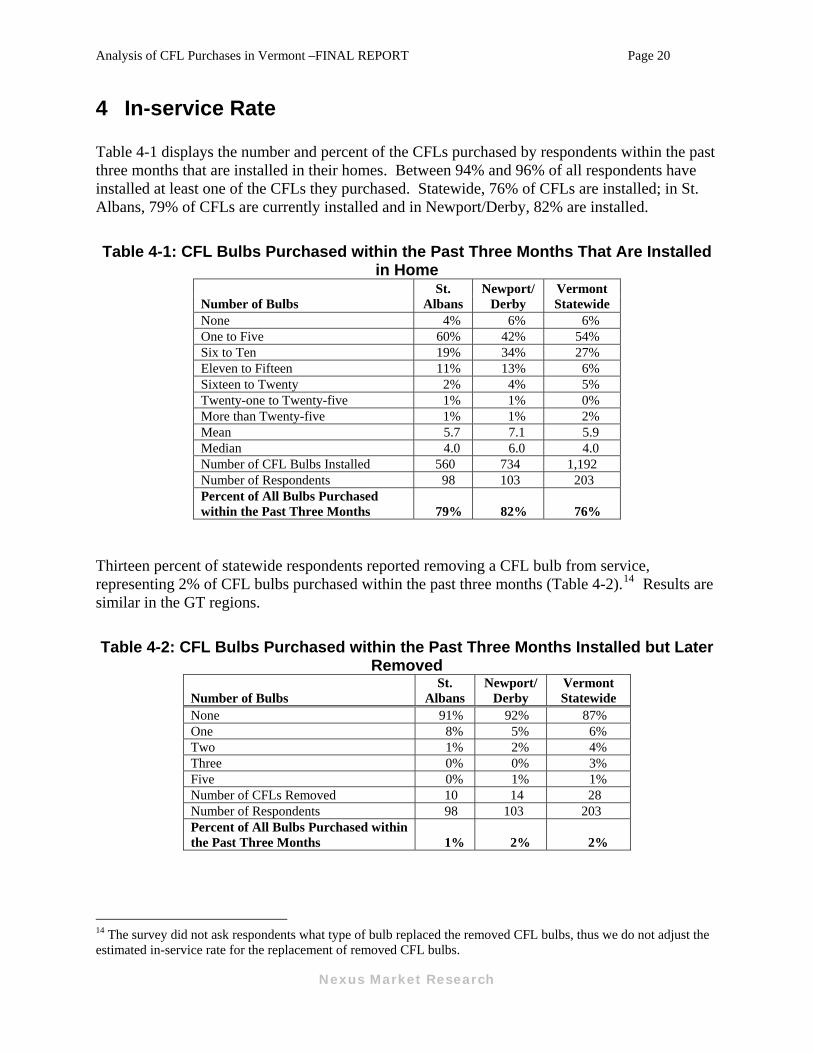
4 In-service Rate Table 4-1 displays the number and percent of the CFLs purchased by respondents within the past three months that are installed in their homes. Between 94% and 96% of all respondents have installed at least one of the CFLs they purchased. Statewide, 76% of CFLs are installed; in St. Albans, 79% of CFLs are currently installed and in Newport/Derby, 82% are installed.
Table 4-1: CFL Bulbs Purchased within the Past Three Months That Are Installed in Home
Number of Bulbs St.
Albans Newport/
Derby Vermont Statewide
None 4% 6% 6% One to Five 60% 42% 54% Six to Ten 19% 34% 27% Eleven to Fifteen 11% 13% 6% Sixteen to Twenty 2% 4% 5% Twenty-one to Twenty-five 1% 1% 0% More than Twenty-five 1% 1% 2% Mean 5.7 7.1 5.9 Median 4.0 6.0 4.0 Number of CFL Bulbs Installed 560 734 1,192 Number of Respondents 98 103 203 Percent of All Bulbs Purchased within the Past Three Months 79% 82% 76%
Thirteen percent of statewide respondents reported removing a CFL bulb from service, representing 2% of CFL bulbs purchased within the past three months (Table 4-2).14 Results are similar in the GT regions.
Table 4-2: CFL Bulbs Purchased within the Past Three Months Installed but Later Removed
Number of Bulbs St.
Albans Newport/
Derby Vermont Statewide
None 91% 92% 87% One 8% 5% 6% Two 1% 2% 4% Three 0% 0% 3% Five 0% 1% 1% Number of CFLs Removed 10 14 28 Number of Respondents 98 103 203 Percent of All Bulbs Purchased within the Past Three Months 1% 2% 2%
14 The survey did not ask respondents what type of bulb replaced the removed CFL bulbs, thus we do not adjust the estimated in-service rate for the replacement of removed CFL bulbs.
Nexus Market Research
Analysis of CFL Purchases in Vermont –FINAL REPORT Page 21
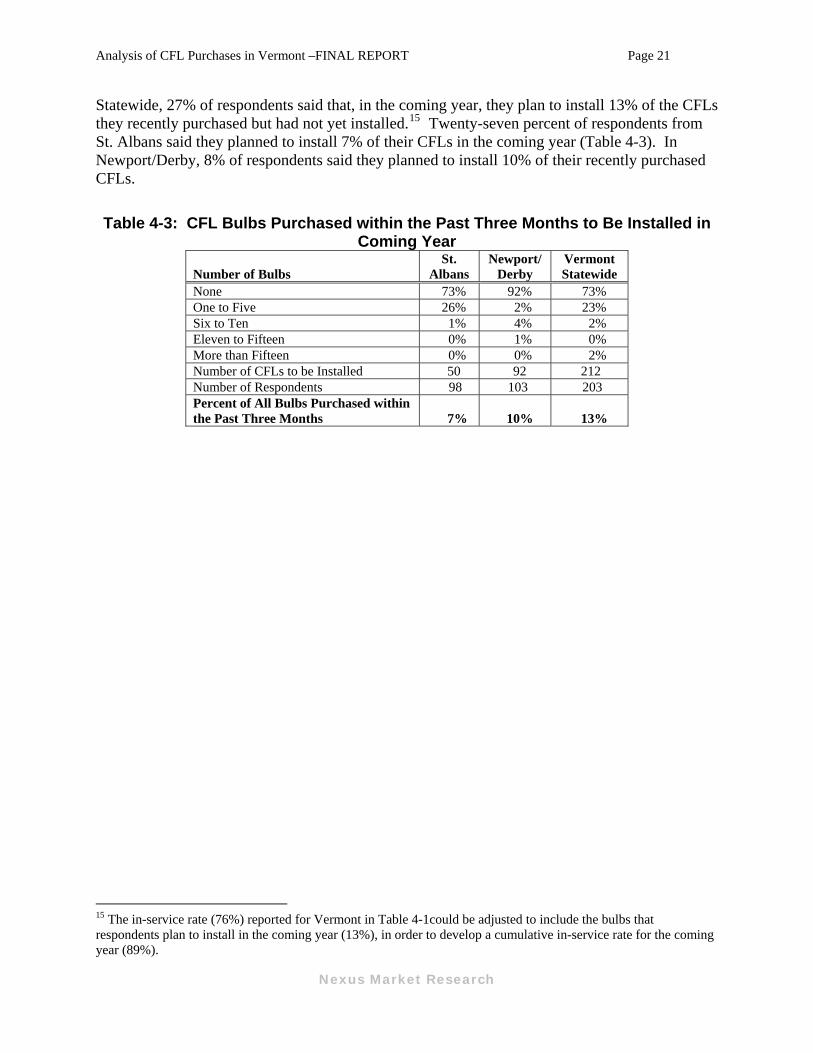
Statewide, 27% of respondents said that, in the coming year, they plan to install 13% of the CFLs they recently purchased but had not yet installed.15 Twenty-seven percent of respondents from St. Albans said they planned to install 7% of their CFLs in the coming year (Table 4-3). In Newport/Derby, 8% of respondents said they planned to install 10% of their recently purchased CFLs.
Table 4-3: CFL Bulbs Purchased within the Past Three Months to Be Installed in Coming Year
Number of Bulbs St.
Albans Newport/
Derby Vermont Statewide
None 73% 92% 73% One to Five 26% 2% 23% Six to Ten 1% 4% 2% Eleven to Fifteen 0% 1% 0% More than Fifteen 0% 0% 2% Number of CFLs to be Installed 50 92 212 Number of Respondents 98 103 203 Percent of All Bulbs Purchased within the Past Three Months 7% 10% 13%
15 The in-service rate (76%) reported for Vermont in Table 4-1could be adjusted to include the bulbs that respondents plan to install in the coming year (13%), in order to develop a cumulative in-service rate for the coming year (89%).
Nexus Market Research
Analysis of CFL Purchases in Vermont –FINAL REPORT Page 22
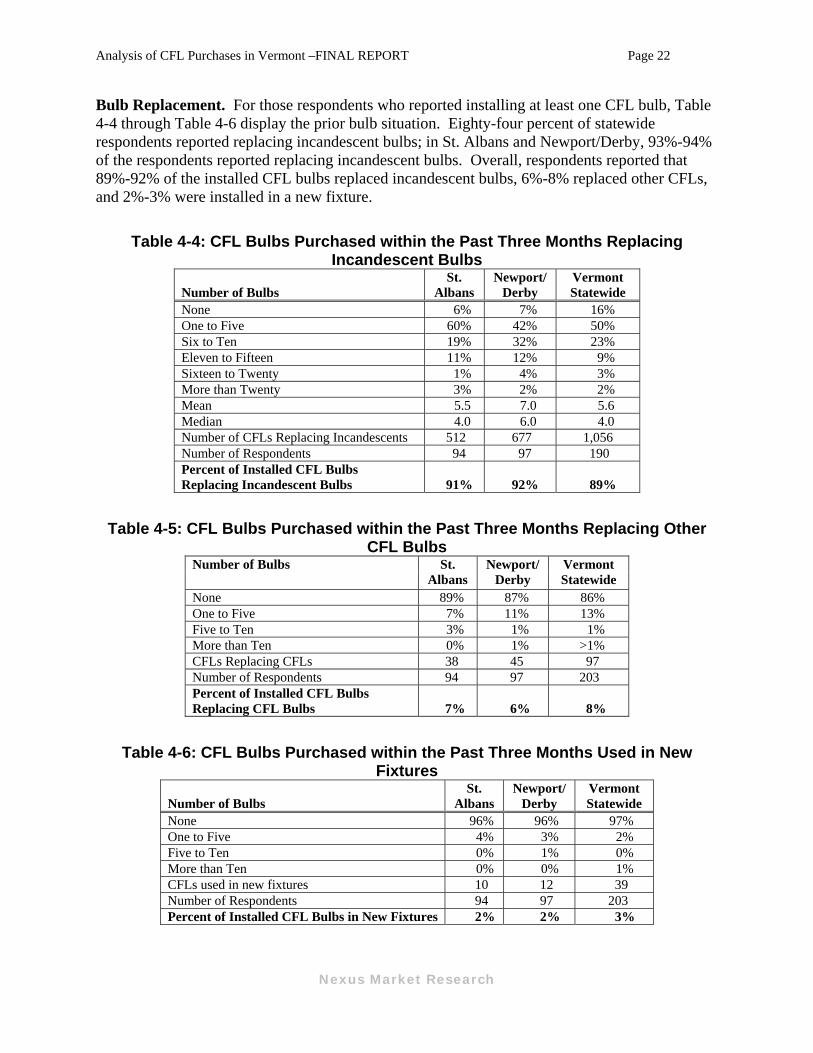
Bulb Replacement. For those respondents who reported installing at least one CFL bulb, Table 4-4 through Table 4-6 display the prior bulb situation. Eighty-four percent of statewide respondents reported replacing incandescent bulbs; in St. Albans and Newport/Derby, 93%-94% of the respondents reported replacing incandescent bulbs. Overall, respondents reported that 89%-92% of the installed CFL bulbs replaced incandescent bulbs, 6%-8% replaced other CFLs, and 2%-3% were installed in a new fixture.
Table 4-4: CFL Bulbs Purchased within the Past Three Months Replacing Incandescent Bulbs
Number of Bulbs St.
Albans Newport/
Derby Vermont Statewide
None 6% 7% 16% One to Five 60% 42% 50% Six to Ten 19% 32% 23% Eleven to Fifteen 11% 12% 9% Sixteen to Twenty 1% 4% 3% More than Twenty 3% 2% 2% Mean 5.5 7.0 5.6 Median 4.0 6.0 4.0 Number of CFLs Replacing Incandescents 512 677 1,056 Number of Respondents 94 97 190 Percent of Installed CFL Bulbs Replacing Incandescent Bulbs 91% 92% 89%
Table 4-5: CFL Bulbs Purchased within the Past Three Months Replacing Other CFL Bulbs
Number of Bulbs St. Albans
Newport/ Derby
Vermont Statewide
None 89% 87% 86% One to Five 7% 11% 13% Five to Ten 3% 1% 1% More than Ten 0% 1% >1% CFLs Replacing CFLs 38 45 97 Number of Respondents 94 97 203 Percent of Installed CFL Bulbs Replacing CFL Bulbs 7% 6% 8%
Table 4-6: CFL Bulbs Purchased within the Past Three Months Used in New Fixtures
Number of Bulbs St.
Albans Newport/
Derby Vermont Statewide
None 96% 96% 97% One to Five 4% 3% 2% Five to Ten 0% 1% 0% More than Ten 0% 0% 1% CFLs used in new fixtures 10 12 39 Number of Respondents 94 97 203 Percent of Installed CFL Bulbs in New Fixtures 2% 2% 3%
Nexus Market Research
Analysis of CFL Purchases in Vermont –FINAL REPORT Page 23
5 Demographics
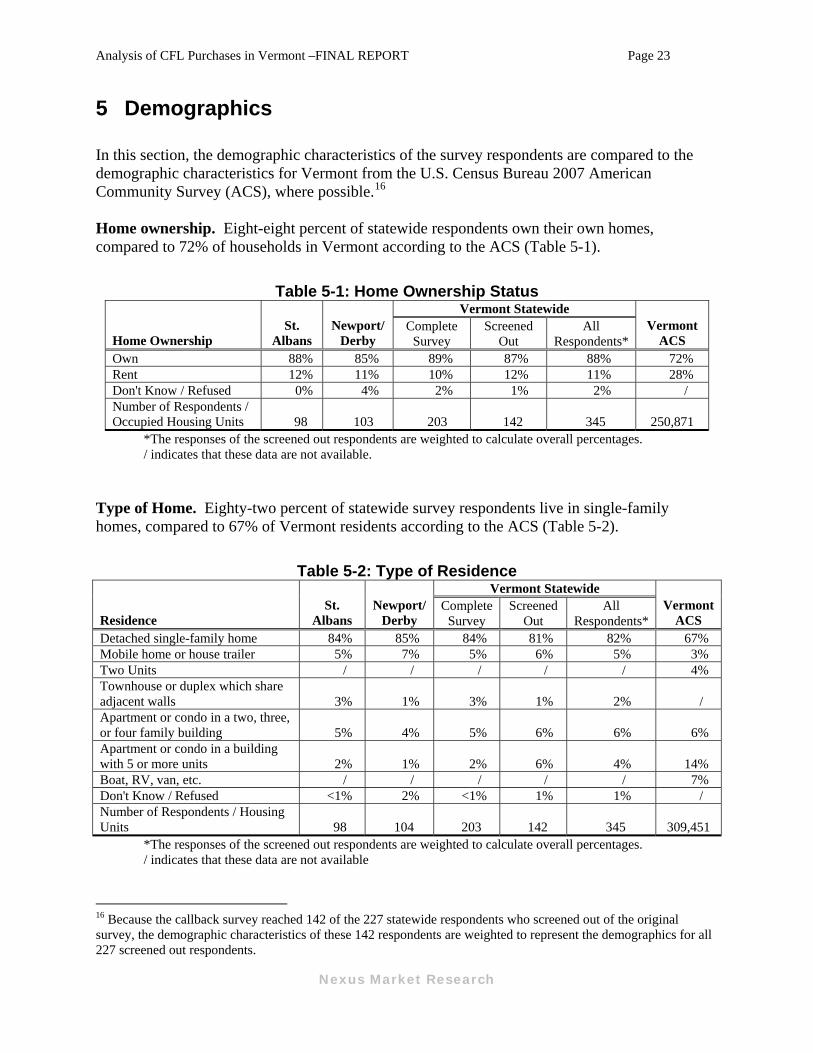
In this section, the demographic characteristics of the survey respondents are compared to the demographic characteristics for Vermont from the U.S. Census Bureau 2007 American Community Survey (ACS), where possible.16 Home ownership. Eight-eight percent of statewide respondents own their own homes, compared to 72% of households in Vermont according to the ACS (Table 5-1).
Table 5-1: Home Ownership Status Vermont Statewide
Home Ownership St.
Albans Newport/
Derby Complete
Survey Screened
Out All
Respondents* Vermont
ACS Own 88% 85% 89% 87% 88% 72% Rent 12% 11% 10% 12% 11% 28% Don't Know / Refused 0% 4% 2% 1% 2% / Number of Respondents / Occupied Housing Units 98 103 203 142 345 250,871
*The responses of the screened out respondents are weighted to calculate overall percentages. / indicates that these data are not available. Type of Home. Eighty-two percent of statewide survey respondents live in single-family homes, compared to 67% of Vermont residents according to the ACS (Table 5-2).
Table 5-2: Type of Residence Vermont Statewide
Residence St.
Albans Newport/
Derby Complete
Survey Screened
Out All
Respondents* Vermont
ACS Detached single-family home 84% 85% 84% 81% 82% 67% Mobile home or house trailer 5% 7% 5% 6% 5% 3% Two Units / / / / / 4% Townhouse or duplex which share adjacent walls 3% 1% 3% 1% 2% / Apartment or condo in a two, three, or four family building 5% 4% 5% 6% 6% 6% Apartment or condo in a building with 5 or more units 2% 1% 2% 6% 4% 14% Boat, RV, van, etc. / / / / / 7% Don't Know / Refused <1% 2% <1% 1% 1% / Number of Respondents / Housing Units 98 104 203 142 345 309,451
*The responses of the screened out respondents are weighted to calculate overall percentages. / indicates that these data are not available
16 Because the callback survey reached 142 of the 227 statewide respondents who screened out of the original survey, the demographic characteristics of these 142 respondents are weighted to represent the demographics for all 227 screened out respondents.
Nexus Market Research
Analysis of CFL Purchases in Vermont –FINAL REPORT Page 24
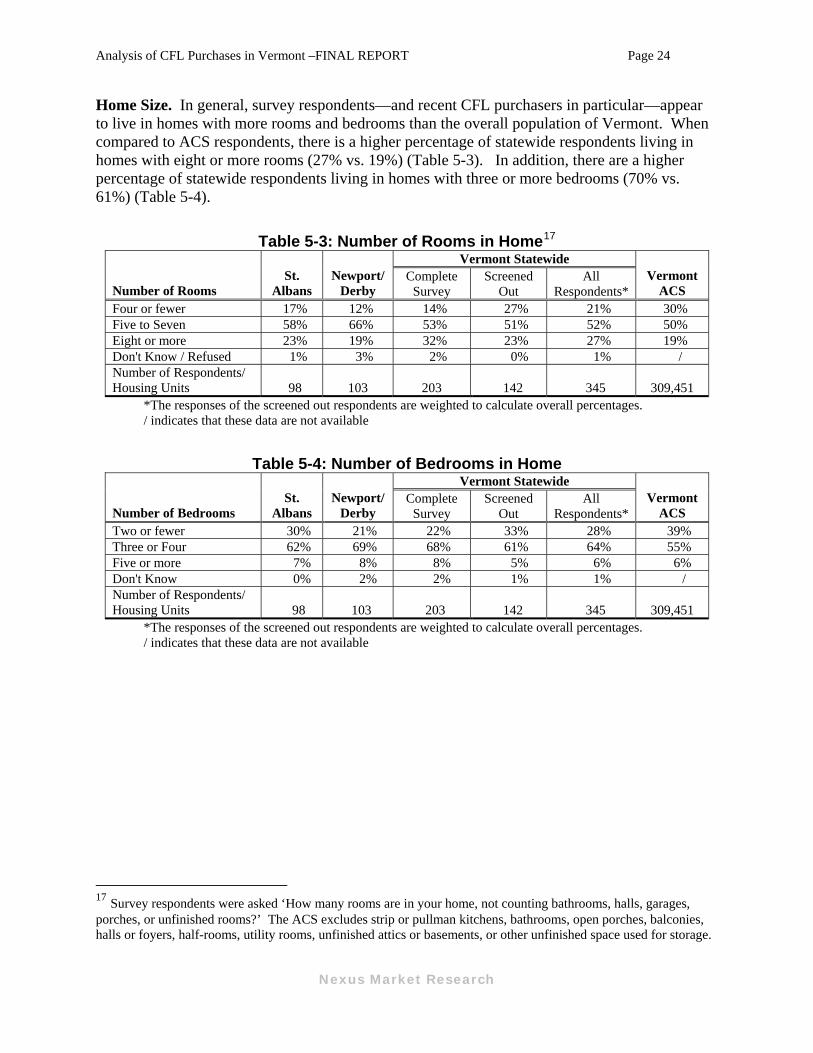
Home Size. In general, survey respondents—and recent CFL purchasers in particular—appear to live in homes with more rooms and bedrooms than the overall population of Vermont. When compared to ACS respondents, there is a higher percentage of statewide respondents living in homes with eight or more rooms (27% vs. 19%) (Table 5-3). In addition, there are a higher percentage of statewide respondents living in homes with three or more bedrooms (70% vs. 61%) (Table 5-4).
Table 5-3: Number of Rooms in Home17 Vermont Statewide
Number of Rooms St.
Albans Newport/
Derby Complete
Survey Screened
Out All
Respondents* Vermont
ACS Four or fewer 17% 12% 14% 27% 21% 30% Five to Seven 58% 66% 53% 51% 52% 50% Eight or more 23% 19% 32% 23% 27% 19% Don't Know / Refused 1% 3% 2% 0% 1% / Number of Respondents/ Housing Units 98 103 203 142 345 309,451
*The responses of the screened out respondents are weighted to calculate overall percentages. / indicates that these data are not available
Table 5-4: Number of Bedrooms in Home Vermont Statewide
Number of Bedrooms St.
Albans Newport/
Derby Complete
Survey Screened
Out All
Respondents* Vermont
ACS Two or fewer 30% 21% 22% 33% 28% 39% Three or Four 62% 69% 68% 61% 64% 55% Five or more 7% 8% 8% 5% 6% 6% Don't Know 0% 2% 2% 1% 1% / Number of Respondents/ Housing Units 98 103 203 142 345 309,451
*The responses of the screened out respondents are weighted to calculate overall percentages. / indicates that these data are not available
17 Survey respondents were asked ‘How many rooms are in your home, not counting bathrooms, halls, garages, porches, or unfinished rooms?’ The ACS excludes strip or pullman kitchens, bathrooms, open porches, balconies, halls or foyers, half-rooms, utility rooms, unfinished attics or basements, or other unfinished space used for storage.
Nexus Market Research
Analysis of CFL Purchases in Vermont –FINAL REPORT Page 25
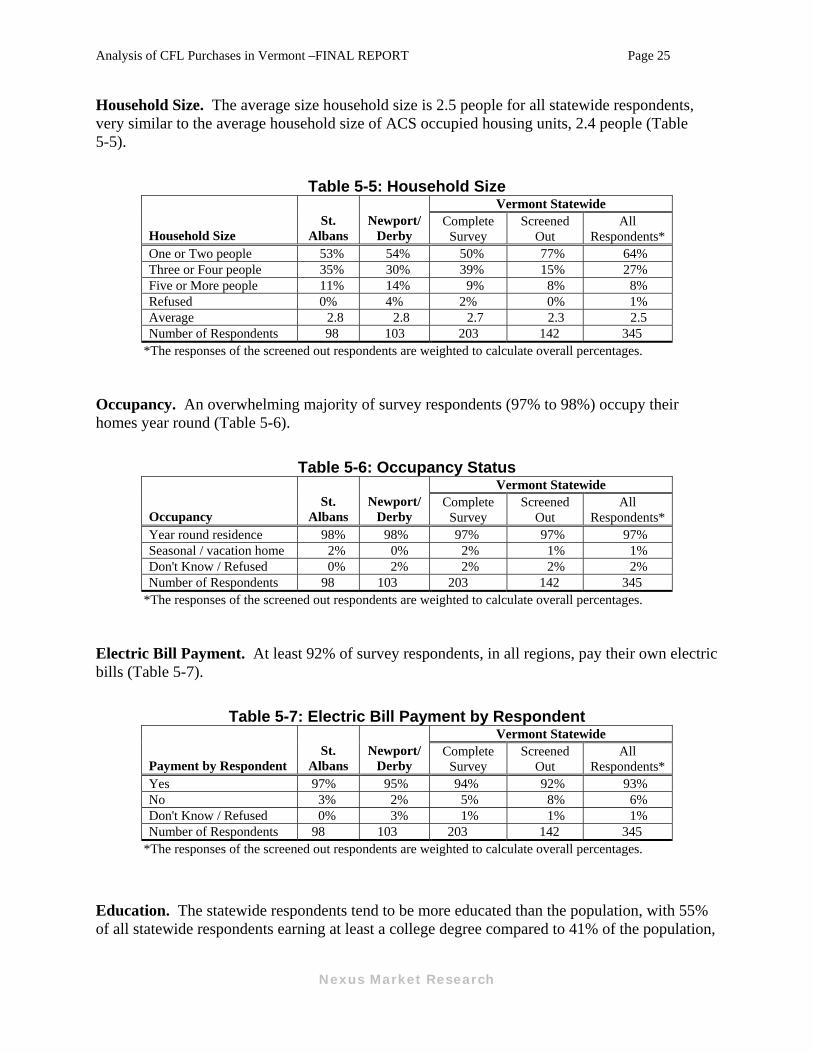
Household Size. The average size household size is 2.5 people for all statewide respondents, very similar to the average household size of ACS occupied housing units, 2.4 people (Table 5-5).
Table 5-5: Household Size Vermont Statewide
Household Size St.
Albans Newport/
Derby Complete
Survey Screened
Out All
Respondents* One or Two people 53% 54% 50% 77% 64% Three or Four people 35% 30% 39% 15% 27% Five or More people 11% 14% 9% 8% 8% Refused 0% 4% 2% 0% 1% Average 2.8 2.8 2.7 2.3 2.5 Number of Respondents 98 103 203 142 345
*The responses of the screened out respondents are weighted to calculate overall percentages. Occupancy. An overwhelming majority of survey respondents (97% to 98%) occupy their homes year round (Table 5-6).
Table 5-6: Occupancy Status Vermont Statewide
Occupancy St.
Albans Newport/
Derby Complete
Survey Screened
Out All
Respondents* Year round residence 98% 98% 97% 97% 97% Seasonal / vacation home 2% 0% 2% 1% 1% Don't Know / Refused 0% 2% 2% 2% 2% Number of Respondents 98 103 203 142 345
*The responses of the screened out respondents are weighted to calculate overall percentages. Electric Bill Payment. At least 92% of survey respondents, in all regions, pay their own electric bills (Table 5-7).
Table 5-7: Electric Bill Payment by Respondent Vermont Statewide
Payment by Respondent St.
Albans Newport/
Derby Complete
Survey Screened
Out All
Respondents* Yes 97% 95% 94% 92% 93% No 3% 2% 5% 8% 6% Don't Know / Refused 0% 3% 1% 1% 1% Number of Respondents 98 103 203 142 345
*The responses of the screened out respondents are weighted to calculate overall percentages.
Education. The statewide respondents tend to be more educated than the population, with 55% of all statewide respondents earning at least a college degree compared to 41% of the population,
Nexus Market Research
Analysis of CFL Purchases in Vermont –FINAL REPORT Page 26
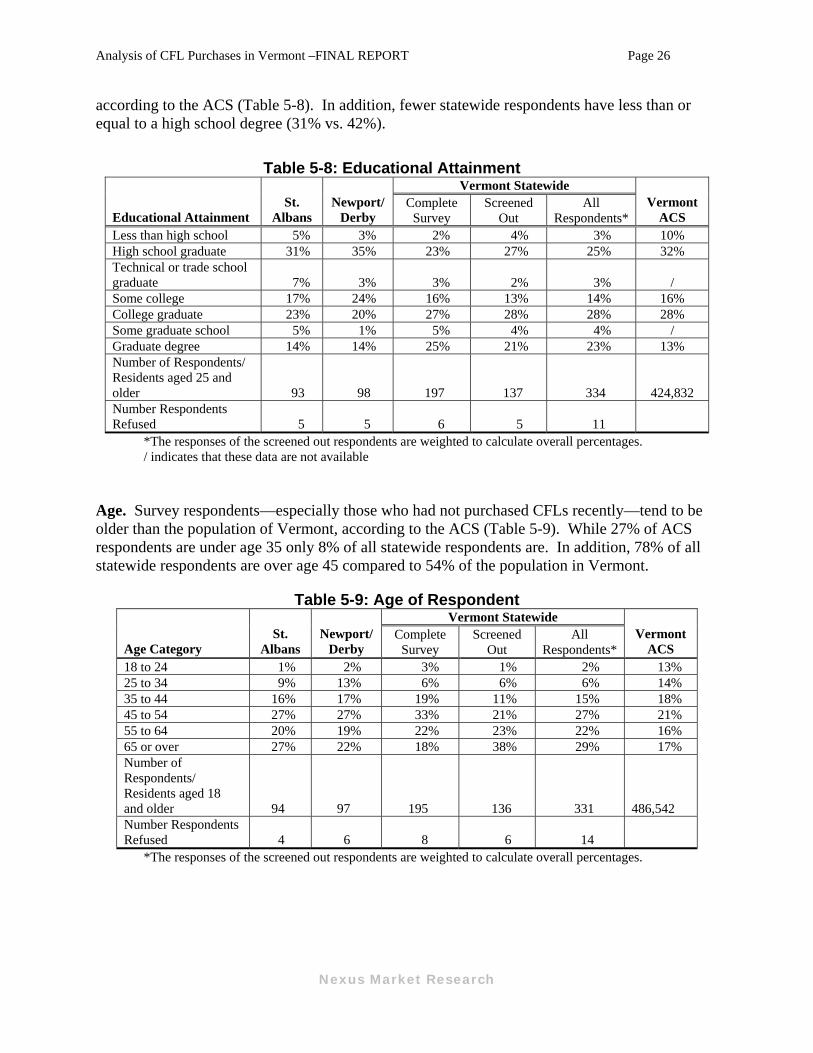
according to the ACS (Table 5-8). In addition, fewer statewide respondents have less than or equal to a high school degree (31% vs. 42%).
Table 5-8: Educational Attainment Vermont Statewide
Educational Attainment St.
Albans Newport/
Derby Complete
Survey Screened
Out All
Respondents* Vermont
ACS Less than high school 5% 3% 2% 4% 3% 10% High school graduate 31% 35% 23% 27% 25% 32% Technical or trade school graduate 7% 3% 3% 2% 3% / Some college 17% 24% 16% 13% 14% 16% College graduate 23% 20% 27% 28% 28% 28% Some graduate school 5% 1% 5% 4% 4% / Graduate degree 14% 14% 25% 21% 23% 13% Number of Respondents/ Residents aged 25 and older 93 98 197 137 334 424,832 Number Respondents Refused 5 5 6 5 11
*The responses of the screened out respondents are weighted to calculate overall percentages. / indicates that these data are not available
Age. Survey respondents—especially those who had not purchased CFLs recently—tend to be older than the population of Vermont, according to the ACS (Table 5-9). While 27% of ACS respondents are under age 35 only 8% of all statewide respondents are. In addition, 78% of all statewide respondents are over age 45 compared to 54% of the population in Vermont.
Table 5-9: Age of Respondent Vermont Statewide
Age Category St.
Albans Newport/
Derby Complete
Survey Screened
Out All
Respondents* Vermont
ACS 18 to 24 1% 2% 3% 1% 2% 13% 25 to 34 9% 13% 6% 6% 6% 14% 35 to 44 16% 17% 19% 11% 15% 18% 45 to 54 27% 27% 33% 21% 27% 21% 55 to 64 20% 19% 22% 23% 22% 16% 65 or over 27% 22% 18% 38% 29% 17% Number of Respondents/ Residents aged 18 and older 94 97 195 136 331 486,542 Number Respondents Refused 4 6 8 6 14
*The responses of the screened out respondents are weighted to calculate overall percentages.
Nexus Market Research
Analysis of CFL Purchases in Vermont –FINAL REPORT Page 27
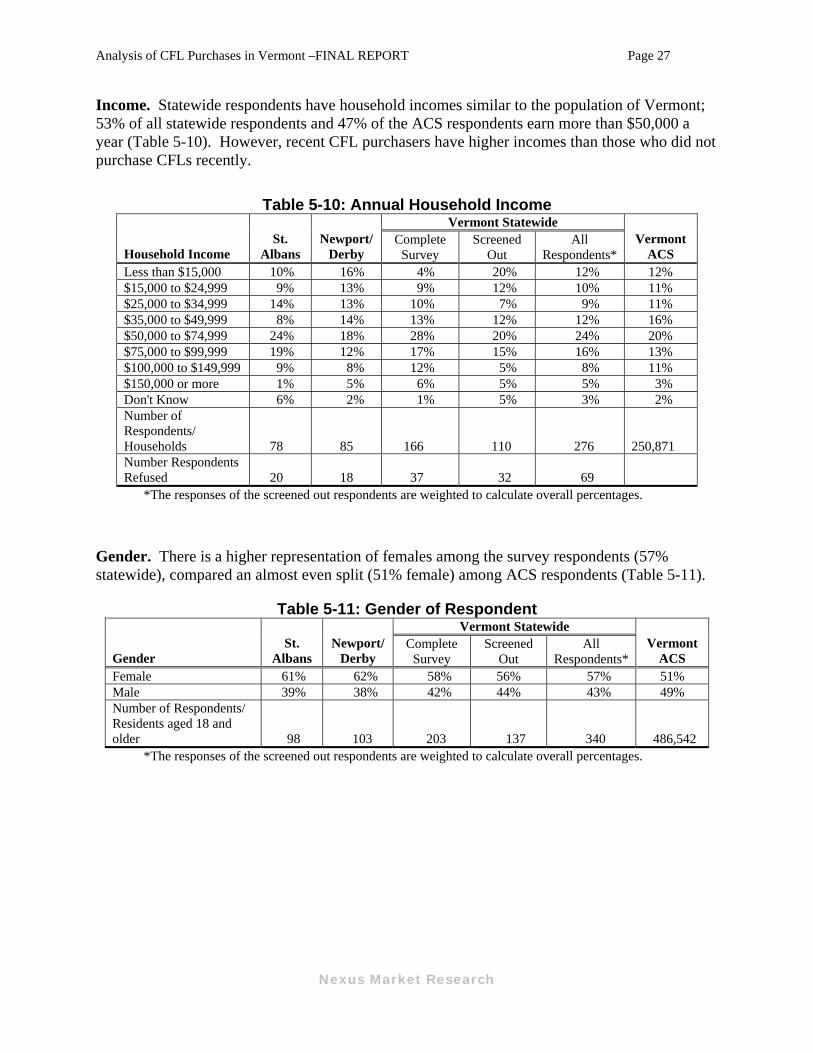
Income. Statewide respondents have household incomes similar to the population of Vermont; 53% of all statewide respondents and 47% of the ACS respondents earn more than $50,000 a year (Table 5-10). However, recent CFL purchasers have higher incomes than those who did not purchase CFLs recently.
Table 5-10: Annual Household Income Vermont Statewide
Household Income St.
Albans Newport/
Derby Complete
Survey Screened
Out All
Respondents* Vermont
ACS Less than $15,000 10% 16% 4% 20% 12% 12% $15,000 to $24,999 9% 13% 9% 12% 10% 11% $25,000 to $34,999 14% 13% 10% 7% 9% 11% $35,000 to $49,999 8% 14% 13% 12% 12% 16% $50,000 to $74,999 24% 18% 28% 20% 24% 20% $75,000 to $99,999 19% 12% 17% 15% 16% 13% $100,000 to $149,999 9% 8% 12% 5% 8% 11% $150,000 or more 1% 5% 6% 5% 5% 3% Don't Know 6% 2% 1% 5% 3% 2% Number of Respondents/ Households 78 85 166 110 276 250,871 Number Respondents Refused 20 18 37 32 69
*The responses of the screened out respondents are weighted to calculate overall percentages.
Gender. There is a higher representation of females among the survey respondents (57% statewide), compared an almost even split (51% female) among ACS respondents (Table 5-11).
Table 5-11: Gender of Respondent Vermont Statewide
Gender St.
Albans Newport/
Derby Complete
Survey Screened
Out All
Respondents* Vermont
ACS Female 61% 62% 58% 56% 57% 51% Male 39% 38% 42% 44% 43% 49% Number of Respondents/ Residents aged 18 and older 98 103 203 137 340 486,542
*The responses of the screened out respondents are weighted to calculate overall percentages.
Nexus Market Research
Analysis of CFL Purchases in Vermont –FINAL REPORT Page 28
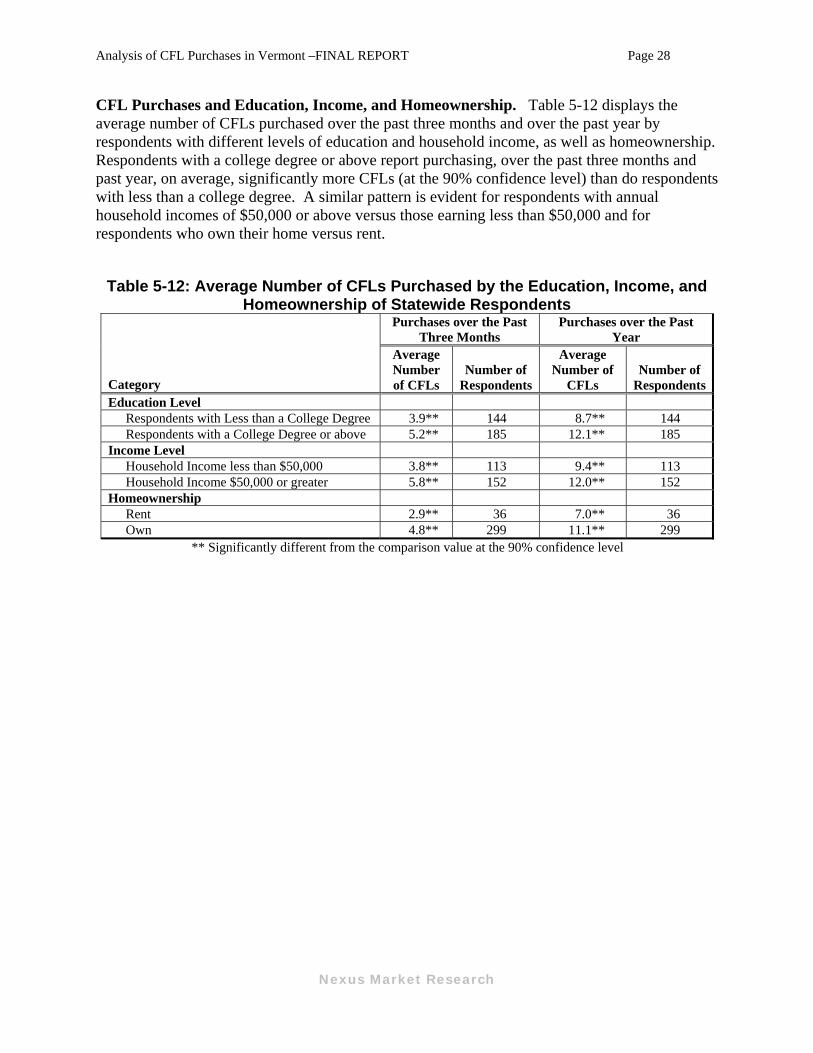
CFL Purchases and Education, Income, and Homeownership. Table 5-12 displays the average number of CFLs purchased over the past three months and over the past year by respondents with different levels of education and household income, as well as homeownership. Respondents with a college degree or above report purchasing, over the past three months and past year, on average, significantly more CFLs (at the 90% confidence level) than do respondents with less than a college degree. A similar pattern is evident for respondents with annual household incomes of $50,000 or above versus those earning less than $50,000 and for respondents who own their home versus rent.
Table 5-12: Average Number of CFLs Purchased by the Education, Income, and Homeownership of Statewide Respondents
Purchases over the Past Three Months
Purchases over the Past Year
Category
Average Number of CFLs
Number of Respondents
Average Number of
CFLs Number of
RespondentsEducation Level
Respondents with Less than a College Degree 3.9** 144 8.7** 144 Respondents with a College Degree or above 5.2** 185 12.1** 185
Income Level Household Income less than $50,000 3.8** 113 9.4** 113 Household Income $50,000 or greater 5.8** 152 12.0** 152
Homeownership Rent 2.9** 36 7.0** 36 Own 4.8** 299 11.1** 299
** Significantly different from the comparison value at the 90% confidence level
Nexus Market Research
Analysis of CFL Purchases in Vermont –FINAL REPORT Page 29
Nexus Market Research
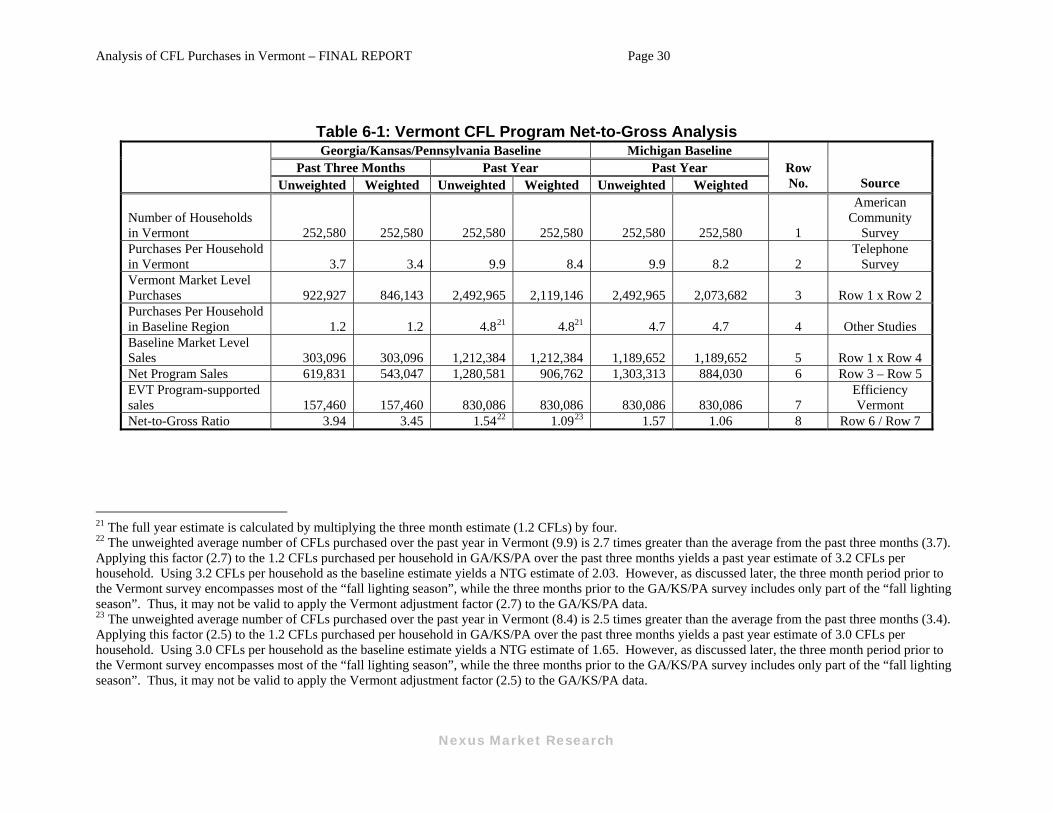
6 Net-to-Gross Analysis Our approach for estimating the baseline, program effects, and net-to-gross ratio (inclusive of market-level freeridership and spillover) for Vermont relies on a comparison area—that is, an area that has similar demographic patterns as Vermont, but no active CFL promotion programs. However, because of limited resources available for this study, we considered two comparison areas with publicly available data: Michigan18 and Georgia/Kansas/Pennsylvania.19 The demographic characteristics of these regions differ from those of Vermont. Thus, we opt to develop multiple scenarios using both Michigan and GA/KS/PA as comparison regions with different time periods and weighting schemes. CFL sales per household in the comparison areas are used to estimate the baseline; the NTG is then calculated as market-level sales in Vermont minus baseline sales, all over program-supported sales. Preliminary results from the California study estimated average baseline purchases in Georgia/Kansas/Pennsylvania of 1.2 CFLs per household over the three months prior to the telephone survey. Michigan households were estimated to have purchased 4.7 CFLs over the previous year. Note that the GA/KS/PA data have been weighted, based on homeownership status and education level, to approximate the demographic characteristics of the customers of the three major investor-owned utilities in California. Compared to the population of Vermont (according to the American Community Survey), the Vermont survey respondents are more likely to own their homes, live in single-family homes, and live in larger-sized homes, as well as be higher educated and older.20 In order to develop a more consistent comparison with the GA/KS/PA results and Michigan results, we present scenarios where we weight the Vermont results to match the education level and the homeownership status of customers of the three major investor-owned utilities in California and Michigan residents. Table 6-1 displays the results of the NTG analysis for five different scenarios. The second and third columns display the results using GA/KS/PA as the comparison region for CFL purchases over the past three months; the second column is the unweighted analysis and the third column is the weighted analysis. The fourth and fifth columns display the results using GA/KS/PA as the comparison region for CFL purchases over the past year; the fourth column is the unweighted analysis and the fifth column is the weighted analysis. The sixth and seventh columns display the results using Michigan as the comparison region for CFL purchases over the past year; the sixth column is the unweighted analysis and the seventh column is the weighted analysis.
18 Glacier Consulting Group, LLC and Prahl Associates, FY08 CFL Customer Research, Final Report, September 30, 2008. 19 Cadmus Group, KEMA, Itron, Nexus Market Research, and A. Goett Consulting. Compact Fluorescent Lamps Market Effects Interim Report – DRAFT. For the California Public Utilities Commission, Energy Division. January 22, 2009. 20 Note that we did not test for statistical significance between the demographic characteristics of the statewide survey sample and the ACS data.
Analysis of CFL Purchases in Vermont – FINAL REPORT Page 30
Table 6-1: Vermont CFL Program Net-to-Gross Analysis Georgia/Kansas/Pennsylvania Baseline Michigan Baseline
Past Three Months Past Year Past Year Unweighted Weighted Unweighted Weighted Unweighted Weighted
Row No. Source
Number of Households in Vermont 252,580 252,580 252,580 252,580 252,580 252,580 1
American Community
Survey Purchases Per Household in Vermont 3.7 3.4 9.9 8.4 9.9 8.2 2
Telephone Survey
Vermont Market Level Purchases 922,927 846,143 2,492,965 2,119,146 2,492,965 2,073,682 3 Row 1 x Row 2 Purchases Per Household in Baseline Region 1.2 1.2 4.821 4.821 4.7 4.7 4 Other Studies Baseline Market Level Sales 303,096 303,096 1,212,384 1,212,384 1,189,652 1,189,652 5 Row 1 x Row 4 Net Program Sales 619,831 543,047 1,280,581 906,762 1,303,313 884,030 6 Row 3 – Row 5 EVT Program-supported sales 157,460 157,460 830,086 830,086 830,086 830,086 7
Efficiency Vermont
Net-to-Gross Ratio 3.94 3.45 1.5422 1.0923 1.57 1.06 8 Row 6 / Row 7
21 The full year estimate is calculated by multiplying the three month estimate (1.2 CFLs) by four. 22 The unweighted average number of CFLs purchased over the past year in Vermont (9.9) is 2.7 times greater than the average from the past three months (3.7). Applying this factor (2.7) to the 1.2 CFLs purchased per household in GA/KS/PA over the past three months yields a past year estimate of 3.2 CFLs per household. Using 3.2 CFLs per household as the baseline estimate yields a NTG estimate of 2.03. However, as discussed later, the three month period prior to the Vermont survey encompasses most of the “fall lighting season”, while the three months prior to the GA/KS/PA survey includes only part of the “fall lighting season”. Thus, it may not be valid to apply the Vermont adjustment factor (2.7) to the GA/KS/PA data. 23 The unweighted average number of CFLs purchased over the past year in Vermont (8.4) is 2.5 times greater than the average from the past three months (3.4). Applying this factor (2.5) to the 1.2 CFLs purchased per household in GA/KS/PA over the past three months yields a past year estimate of 3.0 CFLs per household. Using 3.0 CFLs per household as the baseline estimate yields a NTG estimate of 1.65. However, as discussed later, the three month period prior to the Vermont survey encompasses most of the “fall lighting season”, while the three months prior to the GA/KS/PA survey includes only part of the “fall lighting season”. Thus, it may not be valid to apply the Vermont adjustment factor (2.5) to the GA/KS/PA data.
Nexus Market Research
Analysis of CFL Purchases in Vermont – FINAL REPORT Page 31
There are several factors to consider in deciding which NTG is most appropriate. The Michigan survey data were collected between March 12th and May 8th, 2008; the GA/KS/PA survey data were collected between October 6th and November 23rd, 2008; and the Vermont survey data were collected between December 2nd and 8th, 2008. The timing of the Vermont survey coincides more closely with the fall “lighting season,” which could lead to higher reported sales for Vermont during the prior three months time period. There is some evidence that Vermont survey respondents may have over-reported CFL purchases over the past three months, as the survey-reported purchases of CFLs at Aubuchon stores appears to be higher than actual CFL sales at Aubuchon stores in Vermont. Survey respondents reported purchasing 0.50 CFLs at Aubuchon stores over the past three months; 0.50 multiplied by the 252,580 households in Vermont equals a total of 126,877 CFLs purchased at Aubuchon stores across the state. This three-month estimate represents about one-half of the 251,101 CFLs sold by Aubuchon stores in Vermont in 2008. Because the three-month period specified in the survey overlapped with the fall “lighting season,” the survey-reported purchases likely represent more than one-quarter of annual sales; however, it is unlikely that it equals one-half of annual sales. It is possible that survey respondents may have considered a longer time window than the three month period specified in the survey, or that the survey-reported results should not be generalized to the entire population of Vermont. However, there is no obvious reason to believe that Vermont survey residents over-reported any more than did survey respondents in other states with whom they are being compared. The GA/KS/PA baseline and Michigan each have a lower proportion of both homeowners and higher-educated residents than does the Vermont survey.24 As shown in Table 5-12, Vermont survey respondents who own their homes or are more highly educated report purchasing significantly more CFLs than do renters or those who are less educated. Thus, weighting the Vermont data to reflect the demographic characteristics of GA/KS/PA and Michigan results in lower estimates of market-level CFL purchases in Vermont and, therefore, a lower NTG ratio than do the unweighted analyses. In addition, the estimated NTG ratios in Wisconsin have declined over the past several years: from 1.24 in 2005, to 0.81 in 2006, and to 0.76 in 2007.25 There are several trends contributing to this decline. The market for CFLs has rapidly expanded over the past several years; national shipments of CFLs quadrupled from approximately 93 million in 2004 to nearly 400 million in 2007, before declining somewhat in 2008.26 Because of the rapid growth in CFL sales, many of the non-program regions have also experienced a surge in CFL sales, led by national retailers such as Wal-Mart, Home Depot, and Lowes. In addition, the CFL has become the symbol of the “green” movement, and thus appears more often in the media, leading to greater familiarity. All of these factors will likely result in a smaller difference in sales per household between states
24 In Vermont, homeowners represent 88% of survey respondents, compared to 64% from KS/GA/PA and 75% in Michigan. In Vermont, respondents with college degrees represent 55% of survey respondents, compared to 43% from KS/GA/PA and 26% in Michigan. Michigan demographic data from the 2007 American Community Survey. 25 Glacier Consulting Group, LLC and Prahl Associates, Second Annual Comprehensive CFL Market Effects Study, Final Report, September 30, 2008. 26 U.S. Department of Commerce
Nexus Market Research
Analysis of CFL Purchases in Vermont –FINAL REPORT Page 32
Nexus Market Research
with programs and states without programs. Lastly, Vermont has supported CFLs for several years, helping to establish a mature market in which CFL saturation is relatively high; this may eventually lead to declining demand for CFLs. For all of these reasons, we would expect to see declining NTG ratios in Vermont over the next several years, and therefore recommend using a conservative NTG estimate — 1.09. The NTG estimate of 1.09 was calculated using GA/KS/PA as the baseline area with an analysis that weighted the Vermont data to reflect the demographic characteristics of the baseline area. The GA/KS/PA surveys were conducted just prior to the Vermont surveys, thus we believe the results are more comparable than the Michigan surveys, which were conducted over six months prior. In addition, given the differences in demographics between the Vermont survey respondents and the baseline data, the weighted analysis facilitates a more direct comparison. However, note that the weighted Michigan analysis yields a very similar NTG value — 1.06, which appears to confirm our recommended NTG estimate of 1.09.