annual report 2015 - siltronic story of silicon is a true success story, one that was initiated and...
TRANSCRIPT

THE WORLD OF SILICON WAFERS
Annual Report 2015

Siltronic Group key figures
2015 2014
Statement of profit or loss
Sales EUR mn 931.3 846.0
Gross profit EUR mn 162.9 76.6
Gross margin % 17.5 9.1
EBIT EUR mn 2.7 – 17.1
EBIT margin % 0.3 – 2.0
EBITDA EUR mn 124.0 132.1
EBITDA margin % 13.3 15.6
Financial result EUR mn – 12.2 – 7.7
Income taxes EUR mn – 10.6 – 2.2
Net profit/loss for the period EUR mn – 20.1 – 27.0
Earnings per share EUR – 0.50 – 0.64
Capital expenditure and free cash flow
Capital expenditure in property, plant and equiment, and intangible assets EUR mn – 75.0 – 40.7
Free cash flow EUR mn 37.4 113.5
Adjusted key financial indicators
Adjustment SSW 2014*
Adjusted sales EUR mn 931.3 853.4
Adjusted EBIT EUR mn 2.7 – 31.6
Adjusted EBIT margin % 0.3 – 3.7
Adjusted EBITDA EUR mn 124.0 117.7
Adjusted EBITDA margin % 13.3 13.8
Adjusted capital expenditure in property, plant and equipment and intangible assets EUR mn – 75.0 – 40.7
Adjusted free cash flow EUR mn 37.4 86.3
Statement of financial position
Total assets EUR mn 1,040.8 1,070.5
Equity EUR mn 497.3 311.8
Equity ratio % 47.8 29.1
ROCE % 0.4 – 2.4
Net financial assets (+) / net financial dept (-) EUR mn 155.9 – 24.5
Employees 3,894 4,163
* The adjustment refers to the year 2014 and is based on the assumption that SSW would have been consolidated prior to January 1, 2012. Initial consolidation of SSW into the consolidated financial statements was made as of January 24, 2014. The adjustments are not in compliance with IFRS.

Company profile
Siltronic is a global leader in the market for hyperpure silicon wafers and supplies the world’s leading semiconductor companies. The extensive range of products in the portfolio are thus key components of the increasingly powerful and energy-efficient computer chips that are used in popular products such as smartphones, laptops, and cars. The Company has close to 4,000 employees spread across a network of state-of-the-art production sites in Europe, Asia, and the USA. Technology leadership and a consistent focus on improving efficiency form the bedrock for increasing the Company’s value going forward.
Content
2 Leading in silicon wafers
20 To our shareholders20 Letter to shareholders
23 Supervisory Board report
28 Siltronic on the stock exchange
30 Report and declaration on corporate governance
38 Group management report39 Business and economic conditions
44 Business report
46 Financial position and financial performance
53 Non-financial performance indicators
60 Risk and opportunity report
71 Outlook
73 Events after the reporting period
73 Concluding declaration pursuant to
section 312 (3) AktG
73 Remuneration report
79 Disclosures relevant to acquisitions
81 Consolidated Financial Statements 82 Consolidated Statement of Profit or Loss
83 Consolidated Statement of Financial Position
84 Consolidated Statement of Cash Flows
85 Consolidated Statements of
Comprehensive Income
86 Consolidated Statement of Changes in Equity
88 Notes to the Consolidated Financial Statements
132 Additional information132 Auditor’s report
133 Responsibility statement
134 Further disclosures on offices held
136 Quarterly overview 2015
137 Multi-year overview
138 Glossary
Financial calendar, contact, and
imprint

Leading in silicon wafers After the first silicon wafers for the semiconductor industry were developed in 1962, Siltronic quickly identified the opportunities and excellent prospects offered by the industry and made strategic investments in the technology. Siltronic now supplies all 20 of the leading consumers of silicon wafers.
2
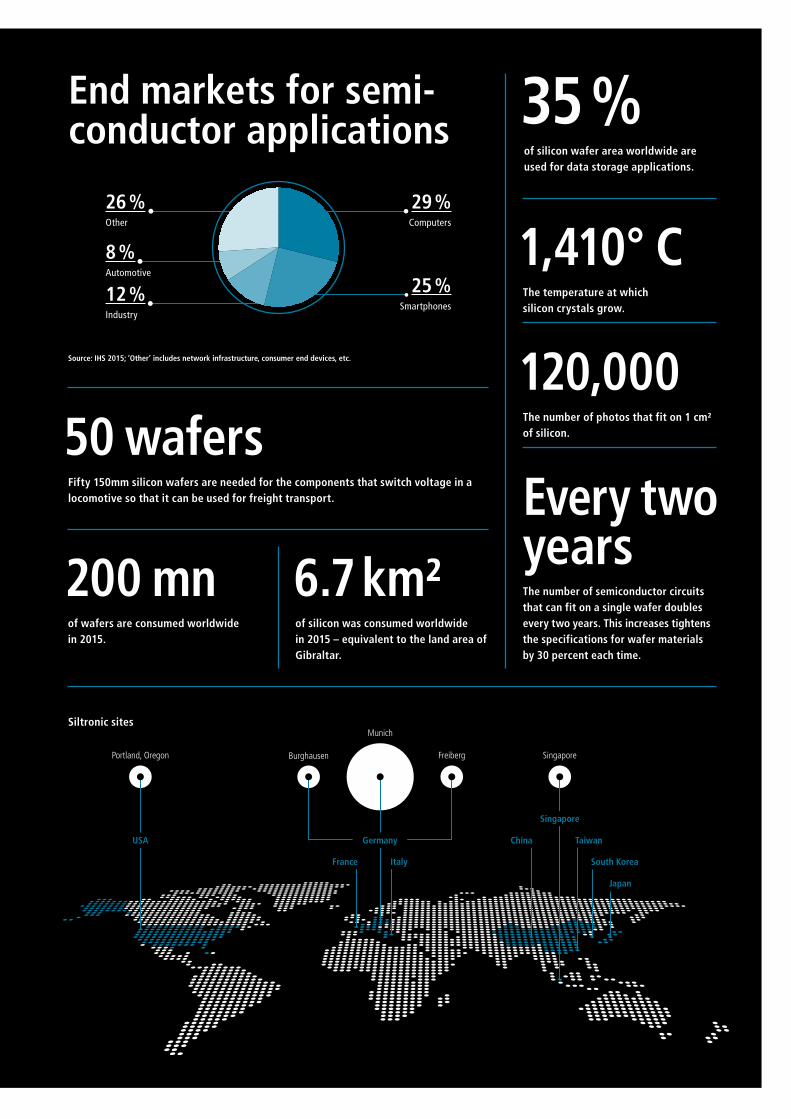
Siltronic sitesMunich
Portland, Oregon
The number of semiconductor circuits that can fit on a single wafer doubles every two years. This increases tightens the specifications for wafer materials by 30 percent each time.
Every two years
35 %of silicon wafer area worldwide are used for data storage applications.
1,410° CThe temperature at which silicon crystals grow.
120,000The number of photos that fit on 1 cm² of silicon.50 wafers
200 mn 6.7 km²
Fifty 150mm silicon wafers are needed for the components that switch voltage in a locomotive so that it can be used for freight transport.
of wafers are consumed worldwide in 2015.
of silicon was consumed worldwide in 2015 – equivalent to the land area of Gibraltar.
End markets for semi-conductor applications
Source: IHS 2015; ‘Other’ includes network infrastructure, consumer end devices, etc.
29 % Computers
25 %Smartphones
26 %Other
8 %Automotive
12 %Industry
SingaporeFreibergBurghausen
USA
France Italy
China
Singapore
South Korea
Japan
Germany Taiwan

Silicon: This chemical element is a true multi-talent – and the
bedrock for a steady stream of technological innovations.
4

SOLID BASE
Siltronic is one of the leading global suppliers to the semiconductor market.
A secure supply of raw materials, competitive production processes,
and an extensive product range are the pillars of its success.
5

Key component of various everyday products. Silicon wafers are thin slices of hyperpure silicon that have an extremely flat surface. They are at the core of Siltronic AG’s business.
The story of silicon is a true success story, one that was initiated and continually driven forward by innovative companies such as Siltronic. Silicon wafers have become an essential component in cutting-edge microtechnology and nanotechnology. As the base material for semiconductors, they are found in virtually all electronic products. We therefore supply one of the key materials in today’s technology-driven societies.
Each wafer has a thickness of around 1 milli-meter and is given an extremely flat surface by means of ultra-high-tech processes. Only around ten years ago, a wafer diameter of 200 millimeters was still the norm. Nowadays, the common wafer size is 300 millimeters, which means that the amount of usable space has doubled.
The pace of change in the electronics industry, however, continually drives demand for new technological advances. Computers, tablets, smartphones, navigation systems – these and countless other everyday objects all have some-thing in common: they are getting smaller, more reliable, more powerful, more energy- efficient and more secure. To meet these in -creas ing demands, new design rules are brought on to the market every two years or so that change the specifications of semiconductor chips.
What sounds simple in fact requires sophisti-cated research and development work as well as investment along the entire manufacturing chain.
Wafers are becoming increasingly high-tech so that they can perform the functions required of them. The addition of high-purity dopants in tiny amounts modifies the electrical proper-ties of the monocrystals from which they are made. The choice of method used to grow the crystals is determined by how the wafers are to be used. In the Czochralski process, for example, the polycrystalline silicon is melted and a seed crystal with the thickness of a pencil is dipped into the molten silicon. This is rotated and slowly drawn up, producing an ingot that weighs several hundred kilograms. These crystals, which are ‘doped’ to customer specifications, are then cut into wafers. After various further production steps, the customer is sent its specified wafers in a special type of packaging that enables them to be used immediately in the production line.
One thing is sure: our industry never stands still. The rapid pace of innovation is both a challenge and an opportunity for us. In order to meet our customers’ needs and maintain our high standards of quality, we are contin-ually fine-tuning our products.
6

> 200 60 cm²5 cm²
70,000 rotations
The average car contains nearly 60 cm² of silicon.
A flash drive needs 5 cm² of silicon to store the content of a Blu-ray disc (50GB HD film).
More than 200 specification parameters are needed to describe a wafer.
Each crystal must be rotated 70,000 times around its own axis.
Wafer sizes
< = 100 mm 125 mm 150 mm 200 mm 300 mm
SILICON WAFERS
5
POLISHING
4
WIRE CUTTING
3
CRYSTAL GROWING
2
POLYSILICON
1
molten silicon wire
ingot
Wafer production (simplified)approximately 50 to 60 production steps
7

Cutting-edge production catering to an international market
So that we can supply our customers around the world quickly and reliably, we sought out locations that offer both strategic and geographical advantages. Our two production sites in Germany are complemented by equi-valents in the USA and Asia. In Singapore, we operate a production facility for 200 and 300 millimeter wafers that is one of the lar-gest and most modern of its kind anywhere in the world. We also have sales offices in Europe, Asia and the USA.
Short lines of communication and the practice of sharing knowledge directly between the production sites ensure that our processes are efficient, and allow us to benefit swiftly and at all levels from the findings of our in-tensive research and development work.
4production sites worldwide
Freiberg: A high-tech site with a long tradition
Back in the 1970s, the production of germa-nium and silicon wafers in the former East Germany centered around the town of Freiberg in Saxony. And to this day, the region around Dresden, Freiberg and Chemnitz is known as Silicon Saxony because of the number of microelectronics and semiconductor compa-nies that are based there.
In 1995, after German reunification, Siltronic took over the Freiberg production facility. In 2004 a new high-volume factory for 300-mil-limeter wafers was opened at the site. In the intervening period we have doubled capacity
and increased productivity more than three times over.
The crystal-pulling plant at Freiberg was ex- ten ded in 2009 and is now the world’s most modern facility for producing 300-millimeter monocrystals. And we are continuing to invest in the site, which provides employment for around 850 people. In order to improve our capabilities, we are adding new state-of-the-art crystal-pulling equipment. And in a sub-sequent phase of improvement we will be driving forward the level of automation at the site.
8

Our customers: the top 20 of the semiconductor industry
The semiconductor industry only ever oper-ates at full throttle. Suppliers have to keep up at all times. Our customers set the pace by providing specifications and parameters. They need the wafers for increasingly smaller struc-tures, known as design rules, in the nanome-ter range, so that they can make ever more powerful and efficient computer chips. De- veloping bespoke products and solutions in accordance with the latest design rules is our specialty. And it requires that we work closely with our customers.
The Siltronic network of ultra-modern sales and production facilities is designed with an international market in mind. This global pres-ence means that we are able to respond to inquiries in less than 24 hours. Our customers
in 40 countries around the world value this as much as they do the fact that we meet our delivery deadlines virtually 100 percent of the time thanks to our seamlessly integrated pro-cesses.
Experience, quality, reliability: all these quali-ties have made us a trusted supplier to all of the top 20 companies in the semiconductor industry. This includes Infineon Technologies, the Intel Corporation, Micron Technology, Samsung Electronics, and Taiwan Semicon-ductor Manufacturing Company (TSMC), to name but a few. Big players – big expecta-tions: and going forward we aim to consoli-date our first-class reputation by ensuring high levels of customer satisfaction through-out the collaborative process.
sales offices
More than 400 engineers worldwide
9
> 400
9

From crystal to wafer: silicon monocrystals provide
the base material for the ultra-thin wafers.
10
HIGH PERFORMANCE
Siltronic is an innovative company. Technological leadership and a strong
focus on costs form the bedrock of our robust cash flow.
11

A passion for innovation. Siltronic AG is at the forefront of its industry, with more than 50 years’ experience in the semiconductor market.
Globally, we are the number three manufacturer of silicon wafers for the semiconductor industry, and number one outside Japan. Our success is built on a number of factors that we combine to optimum effect. We are looking to further strengthen our leading position in the market, and so we need to keep our innovation level high and our costs low.
Siltronic AG has existed in its current form since 2004. However, the origins of our busi-ness go all the way back to the 1950s when research and development in the field of hyperpure silicon was first being conducted. As a subsidiary of the Wacker Group, one of the top companies in the chemicals industry, we have access to a wealth of knowledge and experience.
On the global market we are a driving force in innovation – and we want to stay that way. We invest a lot of time and money in research and development because we see it as one of the major factors behind Siltronic’s outstand-
ing market position. Our 1,700 or so pending and active patents are proof of this commit-ment.
Another major factor in our success are the nearly 4,000 highly skilled, driven people who work for us around the world.
We continually review our internal processes so that we can operate profitably for many years to come. In 2010 we introduced a sys-tematic means of doing this in the form of the cost roadmap. Numerous initiatives and projects have already produced quantifiable results.
12

1953 1962 1990 1998 2004 2006 2014 2015
Siltronic completes a successful IPO
Siltronic acquires a controlling interest in the joint venture in Singapore
The first silicon wafer is developed
Beginning of research and development in the field of hyperpure silicon
The initial expansion of the 300mm pilot production line in Burghausen is brought on stream
First research and development projects for 300mm wafers
Siltronic establishes a joint venture with Samsung in Singapore
Production commences at the production facility for 300mm silicon wafers in Freiberg
The road to success
Well on track thanks to the cost roadmap
Identifying areas for improvement and optimizing them accordingly – that is the objective of the cost roadmap, our long-term program to reduce costs. At its core are projects aimed at raising efficiency. New ideas are being discussed all the time and, where possible, are implemented immediately. One of our targets is to reduce the variable costs involved in making a 300-millimeter wafer by around 10 percent.
100 nm
775 μm
450 / hour
10 particles
is the maximum elevation on the surface of a wafer from the current generation. If you were to make Germany as flat as one of our wafers, the highest elevation would be around three meters.
is the standard thickness of a 300mm wafer.
The air in our clean rooms is completely filtered up to 450 times per hour.
For every 30 liters of air (1 ft³) in our clean rooms, you’ll find no more than ten particulates. An equivalent amount of pure mountain air contains 100,000 particulates.
13

Award-winning-service for our valued customers
The satisfaction of our customers is the greatest recognition of our work. We are always ready to listen to their needs and suggestions. And, of course, we are delighted when they commend us in the form of an award.
In recent years we have received numerous awards from our prestigious customers, in-cluding the “Supplier Award Best Supply Chain Performance 2015” from Infineon. Siltronic has been recognized as one of 26 companies receiving Intel Corporation’s Preferred Quality Supplier (PQS) Award for their performance in 2015.
The company has again demonstrated industry- leading commitment across all critical focus areas on which a supplier is measured: quality, cost, availability, technology, customer service, labor and ethics systems, and environmen - tal sustainability. Siltronic supplies Intel with
polished and epitaxial wafers, deemed essen-tial to Intel’s success.
In 2015 we also won the “2014 Supplier of the Year” Award from Fairchild Semiconductor, the “Supplier Excellence Award 2014” from Texas Instruments, the “Best Supplier in Silicon category for Year 2014” Award from STMicro-electronics and X-FAB’s “Supplier of the Year 2014” Award.
For us, these awards are first and foremost a motivation for maintaining the successful and collaborative working relationships that we have with our customers.
6Siltronic received
Intel’s PQS Award the sixth time
in a row for 2015
14

Reduction of up to 80 percent in the cost of hydrogen consumption
Hydrogen gas instead of liquid hydrogenHydrogen is used in various applications at Siltronic, all of which require this process gas to have the highest level of purity. Previously it was obtained from the liquid hydrogen tanks that were commonplace in the semiconductor industry. Hydrogen liquefies at temperatures below minus 252°C, giving it the highest possible starting purity. Making, transporting and storing hydrogen in liquid form, how-ever, is energy-intensive and expensive and involves complex logistics. At its Burghausen
site, Wacker Chemie uses methane and steam to make large amounts of gaseous hydrogen for its own processes – a method that is significantly cheaper but produces a lower purity. However, a newly installed purification facility enables us to purify the hydrogen available at the Wacker site in Burghausen up to the required quality, reducing the cost of consumption for this excipient by up to 80 percent.
Less is more: reduction in consumption of polishing agents
New recycling system for liquid polishing agentsWafer fabrication requires a level of precision in the nano range, which is why the quality requirements for the polishing agents are especially high. Recycling is not a simple job here. But savings in consumption are possible, as Siltronic demonstrated a number of years ago by successfully diluting the polishing liquid that it uses. In 2015 we built a special recycling facility that has further substantially reduced our consumption of polishing agents.
OHT systems are increasing efficiency
Greater productivity, lower costsThe installation of overhead hoist transport (OHT) systems in our plants played a key role in increasing our competitiveness. These com-puter-controlled systems offer multiple gains in efficiency: the automatic stocking of the production equipment makes the processes involved in loading and unloading of materi-als much faster. The capacity utilization of the equipment – in particular that of very high-value measuring devices – has also increased as there is no longer any need to wait for oper-ators. In comparison with manual transport, OHT systems produce much lower vibrations, which not only improves the wafer quality but also extends the life of the wafer transport cassettes. Another plus point: the automa-tion components are not affected by devel-opments in design rules, so the investment will continue to provide utility for a long time to come.
15

CLEAR STRATEGY
Siltronic is benefiting from the growing demand for silicon wafers. The objective of
our strategy, with its focus on efficiency and growth, is to achieve sustained
success through dependably high quality and improvements in margins.
16

Loaded with intelligence: in microchip production the
wafer is transformed into lots of individual components.
17

Excellent prospects.Siltronic AG pursues a strategy aimed at further strengthening its leading position in the global market for silicon wafers. Technology leadership and a consistent focus on improving efficiency form the bedrock for increasing the Company’s value going forward.
Where will the future take us? Are things just going to get faster and faster? In our dynamic industry the answer is categorically, yes. After all, it works on the principle of Moore’s law, which states that the performance of semiconductor components will double every two years. Demand for silicon wafers continues to be strong – and therefore so are our prospects on the market.
A look at the global megatrends reveals that the prospects for Siltronic’s business and for the semiconductor industry as a whole are encouraging in a number of respects. From mobility to miniaturization and from effi-ciency to connectivity: they are all feeding the expectation that demand for high-tech wafers will continue to grow.
We will do everything to benefit from this development to the greatest possible extent. For this purpose, we have put ourselves into an ideal starting position.
Be it in communications technology, the auto-motive sector or industrial automation: de-mands in terms of power, functionality and efficiency are increasing all the time. And so the technology of silicon wafers, as one of
the most important base materials, has to advance accordingly. Customers are working increasingly closely with manufacturers in order to optimize results. This collaborative approach to making bespoke, high-quality products has long been part of our company’s DNA. And it puts us in an excellent position to achieve further success alongside all the major players in the industry.
Meanwhile, we are pressing ahead with our program focused on operational excellence and sustainable cost reductions. We have put together a solid framework for this in the form of our cost roadmap. The results achieved so far bear out our efforts and we will continue to stay the course and follow the ambitious path that we have taken.
18

Global megatrends are increasing demand for semiconductors
The requirements of customers in the semiconductor industry are changing all the time because of trends in mobility, connectivity, miniaturization and cost efficiency. Semiconductor manufacturers have to continually improve their components in order to keep pace with demands for improved functionality and energy efficiency in applications such as smartphones, driver assistance systems and industrial automation. These developments and others like them are putting increasing demands on silicon wafers.
1 : 1,000,000,000,000 (ppt)
1 wafer per second
Our wafers are so pure that we measure metal inclusions in parts per trillion (ppt). A single fish out of all the oceans of the world would be 1 ppt.
Siltronic makes one wafer a second.
An average PC needs 30 cm² of silicon area.
Amount of silicon substrate contained in a smartphone respectively.
2005 2015
6 cm2
11 cm2
A high-end laptop needs 80 cm² of silicon area.
19
Letter to shareholders
Dear shareholders, customers, and business partners,
We look back on a busy year. The IPO in June marked the start of a new chapter in the history of Siltronic.
Founded in 1968 as Wacker-Chemitronic Gesellschaft für Elektronik-Grundstoffe mbH, part of the Wacker Chemie Group, today we are an international market leader and technology leader for hyperpure silicon wafers for the semiconductor industry. We operate in a fast-paced market. Only a few suppliers have the technological capability to manufacture silicon wafers that meet customers’ high quality requirements. We are the number three worldwide and have been among the leading players for many years.
Siltronic has continued along its path of sustained growth. Despite the inventory corrections at our customers in the second half of the year and a seasonal slowdown at the end of the year, mainly caused by persistently weak unit sales of PCs and smartphones in China, we ended 2015 on a successful note with sales of EUR 931.3 million and EBITDA of EUR 124.0 million. Adjusted for foreign-exchange losses included in other operating income and expense primarily as a result of currency hedging, EBITDA would have risen to EUR 169.7 million and the EBITDA margin would have been 18.2 percent.
We used the proceeds from the IPO to repay all liabilities to Wacker Chemie AG and now have a healthy equity ratio of 47.8 percent. At the end of December, net financial assets stood at EUR 155.9 million and free cash flow at EUR 37.4 million.
Unfortunately, our strong business performance was not reflected in the share price. A weak second half of the year for the semiconductor industry led to the shares of many companies in this sector coming under pressure – including those of Siltronic. Moreover, as a newcomer to the stock exchange, we had to assert ourselves and must continue to do so, and show that we can keep the promises that we have made to the capital markets. Siltronic was included in the TecDAX in December 2015, which means it is one of the 30 largest listed technology companies in Germany.
There are now two main tasks on which we must focus: continue optimizing our operational business and ensure that Siltronic is securely positioned in the capital markets as an attractive company for investors. These two tasks are closely related to each other because the strong profitability that comes from a successful operational business influences how attractive a share is.
20 ANNUAL REPORT 2015
To our shareholders • Letter to shareholders

Dr. Christoph von Plotho.President & Chief Executive Officer
Rainer Irle.Executive Vice President & Chief Financial Officer
21ANNUAL REPORT 2015
To our shareholders • Letter to shareholders

Siltronic offers a range of unique selling propositions for investors. These include our ability – which we have been proving for many years – to continually optimize our processes and technologies. Within our industry, we see ourselves as forerunners in this regard. We are very close to our customers and therefore have an excellent understanding of their needs and requirements. We are ideally equipped to tackle the challenges posed by advancing miniaturization and digitization.
Our current assumption for 2016, based on slight growth in the quantity of silicon wafers sold but a slight reduction in prices, is that sales will just fall short of the 2015 level. We believe we are well positioned to increase our result. Automotive and industrial applications offer new opportunities for the semiconductor industry. Having invested in new crystal- pullers in Freiberg and Singapore, we want to make our wafers even better and, as auto-mation increases, substantially boost our productivity.
Our thanks go to the approximately 4,000 employees worldwide who have made Siltronic what it is today: a global supplier of highly developed silicon wafers for the semiconductor industry.
And of course we would also like to thank you – our shareholders and business partners – for the trust you have shown us. Let us continue to shape the future of Siltronic together as we continue to demonstrate what we can achieve.
Kind regards,
Dr. Christoph von Plotho Rainer IrlePresident & CEO CFO
22 ANNUAL REPORT 2015
To our shareholders • Letter to shareholders

Dear shareholders,
Last year was a special year for us: Siltronic AG successfully made its initial public offering (IPO) on June 11, 2015 and, since then, the Company’s shares have been traded in the Regulated Market (Prime Standard) of the Frankfurt Stock Exchange. The Supervi-sory Board’s work in the year under review therefore focused on preparations for the IPO and the additional duties arising as a result of Siltronic now being a listed company.
Cooperation between the Executive Board and Supervisory Board
The Supervisory Board fulfilled the obligations placed on it by law, the Articles of Association, and its rules of procedure with the greatest degree of care. Furthermore, the Executive Board and Supervisory Board worked together in a spirit of partnership and in the interests of the Company. The Supervisory Board regularly advised the Executive Board on the management of the Company, monitored the Executive Board’s work, and assured itself that the Company is being run lawfully, expedi-ently, and correctly. The Executive Board notified the Supervisory Board and its committees promptly and in detail, both in writing and orally, on the course of business, the Company’s position and strategic development, the risk position, internal audit activ-ities, and compliance matters. The Supervisory Board – or its committees, where appropriate – were involved in all decisions of fundamental significance from an early stage, particularly all of the decisions in connection with Siltronic AG’s IPO. The Super-visory Board always had the opportunity to critically examine the reports and motions submitted by the Executive Board. Where business deviated from the plans and targets, a detailed expla-nation was always provided. Outside the regular schedule of Supervisory Board meetings, the chairman of the Supervisory Board and the chairman of the Audit Committee remained in close contact with the Executive Board and were kept informed of the current situation and significant business transactions.
Focus of the work of the Supervisory Board
The Supervisory Board held four ordinary meetings – two in the first half of the year and two in the second – and one extraor-dinary meeting in the reporting year. Every Supervisory Board member participated in more than half of the Supervisory Board meetings held during his or her term of office.
At the first ordinary meeting of the year under review, which was held on February 23, 2015, the Supervisory Board set the Executive Board’s variable remuneration for the previous year based on a recommendation from the Executive Committee and on the measured target achievement, and established targets for variable remuneration for the current financial year. The Supervisory Board also resolved to extend Mr. Rainer Irle’s appointment to the Executive Board for a further five years. In addition, we discussed the 2014 annual financial statements in great depth – with the external auditor, who was also at the meeting – and approved and thus adopted the separate financial statements of Siltronic AG.
Supervisory Board report
Dr. Tobias Ohler,Chairman of the Supervisory Board, Siltronic AG
23ANNUAL REPORT 2015
To our shareholders • Supervisory Board report

At the extraordinary meeting of the Supervisory Board on May 7, 2015, the consolidated financial statements were discussed and then approved in the presence of the external auditor. The report of the Supervisory Board to the Annual General Meeting was also approved, and the Supervisory Board set itself targets for its composition in accordance with the provisions of the German Corporate Governance Code. At the same time, the Supervisory Board approved the declaration of conformity with the German Corporate Governance Code. In preparation for the IPO, the Supervisory Board resolved to revise the Executive Board’s service contracts, including the structure of their remuneration, and the rules of procedure for the Executive Board and Supervisory Board in order to adapt them to the requirements of the German Cor-porate Governance Code and the German Stock Corporation Act (AktG) for listed companies. In this context, an Audit Com-mittee and a Nomination Committee were established with effect from May 8, 2015. The allocation of responsibilities between the two members of the Executive Board was redefined to incor-porate the new functions arising following the IPO. Finally, the Supervisory Board gave its approval for the Company’s planned IPO and authorized the Audit Committee to make all major decisions on behalf of the Supervisory Board that were required in connection with the IPO, in particular consent for the setting of the price range and the final offer price. The Supervisory Board also decided to grant the two Executive Board members an IPO bonus in the event of a successfully completed IPO. For details, please see the remuneration report on 73.
At its meetings in June and September, the Supervisory Board examined Siltronic’s business performance and its upcoming and ongoing capital investment projects.
During the Supervisory Board meeting on September 11, 2015, the Supervisory Board set amended targets for the Executive Board’s variable remuneration for the current year. This was because of the changes to the structure of the Executive Board’s remuneration, including the variable remuneration system, that took effect on the first day of trading of Siltronic shares. The system is now based solely on Siltronic KPIs measured over a multiple-year period. For details, please see the remuneration
report on 73. Another agenda item was Germany’s Law for the equal participation of women and men in Managerial Posi-tions in the Private and Public Sectors, which came into effect on May 1, 2015. Both the employee representatives and the shareholder representatives on the Supervisory Board resolved to reject the principle of overall fulfillment pursuant to section 96 (2) sentence 3 AktG (new version) in view of the upcoming Supervisory Board elections, which are due after January 1, 2016. This means that when appointments are made to the Supervisory Board after January 1, 2016, the group of employee representatives and the group of shareholder representatives must each satisfy the quota of at least 30 percent for both men and women. The Supervisory Board also discussed the definition of targets for the proportion of women on the Executive Board. There are currently no female members on the Siltronic AG Executive Board. The current terms of office of the two Executive Board members do not end until after June 30, 2017, the latest possible date for the first deadline to be set. In view of the Company’s efforts to monitor and steadily reduce its costs, expanding the Executive Board to three or more members would be counterproductive. For this reason, the Supervisory Board has resolved to maintain the current state of affairs until June 30, 2017.
At its meeting on December 11, 2015, the Supervisory Board examined the Siltronic Group’s planning for 2016 and the medium-term planning for 2016-2020. The budget for 2016 presented by the Executive Board, including the financial and capital expenditure planning, was discussed in detail and approved. The Supervisory Board also reviewed the efficiency of its own work during a general and open discussion and ascertained that it does work efficiently. Other agenda items at the December meeting were the new version of the German Corporate Gov-ernance Code and the issuance of the declaration of conformity pursuant to section 161 AktG.
24 ANNUAL REPORT 2015
To our shareholders • Supervisory Board report

Supervisory Board committees
The Supervisory Board has established four committees to help it perform its tasks efficiently: an Audit Committee, an Executive Committee, a Nomination Committee and, as is mandatory according to section 27 (3) of the German Codetermination Act (MitbestG), a Conciliation Committee. The chairman of the Supervisory Board chairs all of the committees except the Audit Committee, which is chaired by Supervisory Board member Mr. Bernd Jonas. The committee chairmen report on the work of the committees regularly and comprehensively to the Supervisory Board. All committee members participated in all of the meet-ings of the committees to which they belong.
The Executive Committee met four times in the reporting year. It examined personnel matters relating to the Executive Board, in particular its remuneration, the revision of the Executive Board service contracts, and the extension of Rainer Irle’s appointment to the Executive Board for a further five years.
The Audit Committee was formed at the Supervisory Board’s meeting in May in preparation for the imminent IPO. As it was expected that decisions in connection with the planned IPO would need to be made at short notice, the Audit Committee was given authorization at the same time to make important decisions regarding the IPO on behalf of the Supervisory Board. The Executive Board kept the members of the Audit Committee up to date on the progress of the IPO. The Audit Committee met twice in order to discuss the maximum number of shares to be issued as part of the IPO, the price range within which purchase offers could be made, and the offer price. In 2015, it also held two regular meetings at the end of the second and third quarters in order to examine the audit of the interim consolidated finan-cial statements for the first half of the year, the review of the quarterly financial statements for the third quarter of 2015, and issues of risk management, compliance, and internal audit. The Audit Committee engaged the independent auditor for the 2015 financial year, decided on the audit’s focal points, and determined the auditor’s fees. It also monitored the auditor’s independence and suitability.
The Nomination Committee was also established in view of the IPO in May 2015. Its task is to propose suitable candidates for shareholder representative posts on the Supervisory Board whom the Supervisory Board can then include in the nomina-tions it submits to the Annual General Meeting. The Nomination Committee did not meet in the reporting period.
The Conciliation Committee did not need to be convened in 2015.
Corporate governance
To coincide with the IPO, the Supervisory Board and Executive Board issued their first declaration of conformity in May 2015 and made it available to shareholders on the Company’s website. At the December meeting, the Supervisory Board examined the amended German Corporate Governance Code and resolved to implement the Code’s new recommendation to set a standard limit for length of membership of the Supervisory Board. The Supervisory Board adjusted the targets for its composition accordingly, resolving that, as a rule, members should not belong to the Supervisory Board for more than three full terms of appointment. The Executive Board also reports on corporate governance at Siltronic, including on behalf of the Supervisory Board, in the corporate governance report (see 30).
Audit of the separate and consolidated financial statements
The independent auditor, KPMG AG Wirtschaftsprüfungsgesell-schaft, Munich, audited the 2015 separate annual financial statements of Siltronic AG prepared by the Executive Board and the consolidated financial statements as well as the manage-ment reports for both of these (reporting date: December 31, 2015) and issued an unqualified opinion.
The separate financial statements of Siltronic AG, the manage-ment report for Siltronic AG, and the management report for the Siltronic Group were prepared in accordance with German statutory accounting principles. The consolidated financial state-ments were prepared in accordance with International Financial Reporting Standards (IFRS) as adopted by the European Union and in accordance with German statutory requirements, as addi-tionally required by section 315a (1) of the German Commercial Code (HGB).
25ANNUAL REPORT 2015
To our shareholders • Supervisory Board report

The financial statements, the management reports, and the audit reports from the independent auditor were made available to all Supervisory Board members in good time and were dis-cussed and examined in detail, first at the Audit Committee meeting on February 24, 2016 and finally at the Supervisory Board’s accounts review meeting on March 3, 2016, both times in the presence of the auditor (Ms. Christiane Pastor and Mr. Johannes Hanshen, KPMG). The auditor reported on the main results of the audit and was available to the Audit Committee and full Supervisory Board to answer questions and provide addi-tional information. The auditor also audited the system for the early detection of risks pursuant to section 91 AktG and ascer-tained that the risk management system fulfilled the statutory requirements. No risks to the Company’s survival as a going concern were identified.
The Supervisory Board agrees with the results of the audit of the financial statements. Based on the final outcome of the review by the Audit Committee and our own review, there are no objec-tions to be raised in connection with the separate financial state-ments of Siltronic AG and the associated management report, the consolidated financial statements and the associated man-agement report, or the audit reports from the independent audi-tor. We therefore approve the separate financial statements of Siltronic AG prepared by the Executive Board and the consoli-dated financial statements for the year ended December 31, 2015. The separate financial statements of Siltronic AG have thus been adopted.
The declaration of conformity has been made permanently accessible to the public on the website http://www.siltronic.com/int/en/investor_relations/corporate_governance/declaration/ declaration.jsp
Dependency report
The Executive Board has submitted a report to the Supervisory Board on the Company’s relationships with affiliated companies pursuant to section 312 AktG (dependency report). The depen-dency report was audited by the independent auditor, KPMG AG Wirtschaftsprüfungsgesellschaft, Munich, and given the follow-ing auditors’ opinion:
“Having conducted our audit and assessment in accordance with our duties, we hereby confirm that:
1, the actual disclosures in the report are accurate;2, in the legal transactions listed in the report, payments made
by the Company were not unreasonably high and disadvan-tages were compensated;
3, in the activities listed in the report, there is no reason that would give rise to a materially different assessment from that of the Executive Board.”
The audit report was also sent in good time to the members of the Supervisory Board by the independent auditor.
The dependency report and the related audit report prepared by the auditor were discussed and reviewed for completeness and accuracy, first at the meeting of the Audit Committee on Feb-ruary 24, 2016 and finally at the Supervisory Board meeting on March 3, 2016. At that meeting, the Executive Board provided a detailed explanation of the dependency report and was avail-able to answer questions and provide further information. The auditor, which attended both meetings (Ms. Christiane Pastor and Mr. Johannes Hanshen, KPMG), reported on the audit, in particular the focal points of the audit and the main results of the audit. The Audit Committee and Supervisory Board acknowl-edged the audit report and the auditors’ opinion, critically exam-ined them, and discussed them with the auditor. The Audit Committee and Supervisory Board were able to satisfy them-selves of the correctness and completeness of the dependency report, the audit, and the audit report. Nothing was identified that would give rise to concerns about the dependency report or audit report.
26 ANNUAL REPORT 2015
To our shareholders • Supervisory Board report

The Audit Committee therefore recommended to the Supervi-sory Board that it approve the results of the audit by the inde-pendent auditor and, as it did not see any reason to raise any objections to the Executive Board’s dependency report, that it issue a corresponding assessment.
The Supervisory Board followed this recommendation and decided that, based on the final outcome of its own review, there were no reservations to be raised regarding the Executive Board’s declaration at the end of the report on relationships with affiliated companies. Furthermore, the Supervisory Board raised no objections to the auditor’s findings and approved the audit report prepared by the auditor.
Changes on the Executive Board and Supervisory Board
At its meeting on February 23, 2015, the Supervisory Board confirmed, on the recommendation of the Executive Committee, the appointment of Executive Board member Mr. Rainer Irle for a further five years in office with effect from January 1, 2016 and thus extended his service contract until December 31, 2020.
Having stepped down from the Executive Board of Wacker Che-mie AG, the chairman of the Supervisory Board, Dr. Joachim Rauhut, resigned as Supervisory Board chairman and as a mem-ber of the Supervisory Board with effect from December 11, 2015. We would like to thank Dr. Joachim Rauhut for his invalu-able support over the past 15 years, especially his considerable contribution to the successful IPO, and wish him all the best for the future. In a decision dated January 4, 2016, the courts appointed Ms. Angela Wörl, Head of HR/Social Affairs at Wacker Chemie AG, as a member of the Supervisory Board to replace Dr. Joachim Rauhut as a shareholder representative. At its meet-ing on December 11, 2015, the Supervisory Board elected Dr. Tobias Ohler, Chief Financial Officer of Wacker Chemie AG, as the new chairman of the Supervisory Board.
Mr. Walter Ortner, an employee representative on the Supervi-sory Board and the deputy chairman of the Supervisory Board, retired at the end of December 2015 and therefore stepped down from the Company’s Supervisory Board. Our thanks also go to Mr. Ortner for his tireless efforts and cooperative approach, and we wish him all the best for the future. He was replaced by his appointed substitute member, Mr. Gebhard Fraunhofer, with effect from January 1, 2016. Mr. Johann Hautz was elected as the new deputy chairman.
Munich, March 3, 2016The Supervisory Board
Dr. Tobias OhlerChairman of the Supervisory Board of Siltronic AG
27ANNUAL REPORT 2015
To our shareholders • Supervisory Board report

Siltronic’s IPO
Siltronic made its initial public offering (IPO) on June 11, 2015. From the outset, it was clear that we would apply for admission to the Prime Standard because we believe that a high level of transparency for investors helps make a share attractive. On December 21, 2015, our shares were included in the TecDAX index, which consists of 30 technology companies. We believe that this is an important step in further increasing Siltronic’s visibility in the capital markets.
Situation in the stock markets dominated by rapid changes of sentiment
The stock markets experienced various ups and downs in 2015, caused by factors such as the crisis in Greece, the conflict in Ukraine, the crisis in the Middle East, the terrorist attacks in Paris, as well as decisions made by the European Central Bank and the US Federal Reserve. Mixed global economic data and above all the slowdown in China’s economic growth also had an impact. All of this resulted in an inconsistent picture from one quarter to the next.
Siltronic’s share price performance influenced by mar-ket data
The issue price for Siltronic shares at the time of the IPO was EUR 30.00. Having initially risen to over EUR 36 in the weeks that followed, the share price then fell significantly owing to negative market data of the semiconductor industry at the end of the second half of the year and closed on December 30, 2015 at EUR 22.59 on the Xetra trading platform. This equates to a price drop of 32.5 percent. Based on the Xetra closing price, our market capitalization was EUR 677.7 million at the end of 2015.
Compared with June 11, 2015, the DAX fell by 5.2 percent, the Dow Jones by 3.4 percent, the Nikkei 225 Index by 6.6 percent, and the Hang Seng Index by a substantial 18.6 percent. The Philadelphia Semiconductor Sector Index also fell, by 8.0 per-cent. The TecDAX, however, was up by 8.3 percent.
Regionally diversified shareholder structure
The proportion of shares in the free float remains unchanged at 42 percent. Siltronic’s largest shareholder continues to be Wacker Chemie AG. It has held 57.83 percent since the IPO. According to the notifications that we have received, the largest institutional investors as of December 31, 2015 were The Baupost Group Securities, L.L.C. from Boston, USA, with 8.66 percent, MainFirst SICAV from Luxembourg with 5.06 percent, and Wellington Management Company LLP from Boston, USA, with 3.01 percent. As of January 2016, more than half (53 percent) of the free float was held by institutional investors in the USA, followed by Germany with 20 percent and the United Kingdom with 16 percent.
The shareholding of the Executive Board and Supervisory Board was less than 1 percent as of December 30, 2015.
Ongoing investor relations activities
Our investor relations work is aimed at raising the profile of Siltronic AG worldwide and establishing and improving the per-ception of Siltronic shares as an attractive investment. We want to strengthen investors’ confidence in the shares and ensure that the shares are priced realistically and fairly by communicating openly and reliably on Siltronic’s performance and strategy on an ongoing basis.
Shareholder structure of Siltronic AGin %
42free float 58
Wacker Chemie AG
Siltronic on the stock exchange
28 ANNUAL REPORT 2015
To our shareholders • Siltronic on the stock exchange

Since the IPO, the Executive Board and the investor relations team have organized various roadshows in Europe’s financial hubs and in the USA. There were also numerous one-on-one meetings and conference calls during which information was provided on the current course of business and market trends.
Seven analysts from various banks currently report on Siltronic, five of whom recommended the shares as a ‘buy’ as of Decem-ber 30, 2015. Two analysts advised holding the shares. There were no recommendations to sell them. The average target price for the banks was EUR 34 at the end of December. You can find out more on the Siltronic website www.siltronic.com under Investor Relations.
Key share data
First trading day June 11, 2015
Stock exchange Frankfurt
Market segment Regulated Market
Transparency standard Prime Standard
Index TecDAX
ISIN DE000WAF3001
Ticker symbol WAF300
Free float after the IPO in % 42.2
Number of shares 30,000,000
High of 2015* EUR 36.04
Low of 2015* EUR 22.41
2015 closing price* EUR 22.59
Market capitalization as of December 30, 2015 EUR 677.7 mn
* Xetra closing price
SILTRONIC TECDAX SOXX Source: Thomson One
Performance of Siltronic shares (indexed) in %
120
115
110
105
100
95
90
85
80
75
70
65
60
55
June August September October November DecemberJuly
29ANNUAL REPORT 2015
To our shareholders • Siltronic on the stock exchange

The sections below constitute the report on corporate gover-nance by the Executive Board – and on behalf of the Supervisory Board – in accordance with article 3.10 of the German Corpo-rate Governance Code (‘Code’) and section 289a (1) of the Ger-man Commercial Code (HGB). It is essential to gain the confi-dence of our customers, business partners and investors in order to generate long-term growth in enterprise value. A key factor in ensuring this confidence is good corporate governance, that is to say transparent and responsible corporate management, to which we therefore attach huge importance.
Declaration on corporate governance in accordance with section 289a HGBDeclaration of conformity by the Executive Board and the Supervisory Board of Siltronic AG
In 2015, the Executive Board and the Supervisory Board devoted a great deal of time and energy to the corporate governance of the Company and the recommendations of the German Corpo-rate Governance Code as amended on June 24, 2014 and May 5, 2015. On December 11, 2015, the Executive Board and the Supervisory Board issued the declaration of conformity set out below, which is publicly accessible on a permanent basis on the Company’s website (http://www.siltronic.com/int/en/investor_relations/corporate_governance/declaration/declaration.jsp).
“The Executive Board and Supervisory Board of Siltronic AG declare the following with regard to the recommendations of the German Corporate Governance Code (‘Code’) Commission:
1. Forward-looking declaration Siltronic AG will comply with the recommendations of the Code
as amended on May 5, 2015 and published in the German Federal Gazette on June 12, 2015 with the exception of the deviations from the Code set out and explained below:
a. D&O insurance deductible for Supervisory Board members (article 3.8 (3)) The Code recommends that, if a company takes out a D&O
insurance policy for its supervisory board, it should agree a deductible similar to the deductible for its executive board of at least 10 percent of the loss up to at least the amount of one and a half times the fixed annual remuneration. German law and Articles of Association impose clear limits on the powers of a supervisory board to exert influence over the operating activities of a stock corporation. Under section 76 (1) of the German Stock Corporation Act (AktG), an executive
board is independently responsible for managing a stock corpo-ration. While a supervisory board is involved in determining the basic principles of corporate strategy, the opportunities for any further involvement by a supervisory board in the implementa-tion of the strategy or the operating business of the company concerned are limited. This also applies to any measures to pre-vent the company incurring loss or damage. As the members of the Supervisory Board of Siltronic AG also only receive a relatively low fixed remuneration compared with the remuneration granted to the Executive Board, which comprises fixed and variable components, we do not believe that the agreement of a deductible for the members of the Supervisory Board of Siltronic AG is reasonable.
b. Capped remuneration for the members of the Executive Board (article 4.2.3 (2) sentence 6) The Code recommends that the remuneration granted to
members of an executive board be capped, both overall and in terms of variable remuneration components. The contracts of the members of the Executive Board at Siltronic AG include appropriate maximum amounts for both fixed and variable remuneration. The Company has therefore implemented the recommendation of the Code in respect of the bulk of the remuneration. However, it is not possible to specify a cap for the remuneration components related to the current system of pension provision because of the nature of the system. This is because the pension contributions to be made by the Company for the members of the Executive Board depend each year on trends in interest rates. When interest rates are low, a higher level of contributions is necessary. Given the unpredictability of trends in interest rates, it is therefore impossible to specify a cap for pension contributions.
c. Announcement to the shareholders of proposed candidates for the Supervisory Board chair (article 5.4.3) This recommendation specifies that the proposed candidates
for the chair of a supervisory board should be announced to the shareholders even though the supervisory board in ques-tion has generally not yet been elected at that point. Under statutory provisions in Germany, the chair of a supervisory board must be elected by, and from among, the supervisory board members. There are no stipulations under German law requiring the announcement of candidates for supervisory board chair from among supervisory board members who have not even been elected yet. Furthermore, this would constitute de facto predetermination and no such predeter-mination is provided for under German law either. For these reasons, Siltronic AG does not comply with this recommen-dation.
Report and declaration on corporate governance
30 ANNUAL REPORT 2015
To our shareholders • Report and declaration on corporate governance

2. Declaration of past conformity Since the publication of the amended Code on June 12, 2015,
Siltronic AG has complied with the Code’s recommendations with the exception of the deviations set out and explained under 1.a) to 1.c) above and with the exception of the revised article 5.4.1 (2) concerning the fixing of a standard limit for the length of time a person may remain a member of a super-visory board. At its meeting held on December 11, 2015, the Supervisory Board of Siltronic AG updated its objectives relat-ing to the composition of the Supervisory Board and, as part of this process, specified a standard limit for the period of membership of the Supervisory Board. The Company has therefore complied with the revised article 5.4.1 (2) since that date.
From the submission of the last declaration of conformity in May 2015 up to the publication of the amended Code on June 12, 2015, Siltronic AG complied with the recommen-dations of the Code as amended on June 24, 2014 with the following exceptions:
• Article 3.8 (3) for the reasons stated under 1.a above; • Article 4.2.3 (2) sentence 6 for the reasons stated under
1.b above; • Article 5.1.2 sentence 2 relating to appropriate consider-
ation of women when making appointments to the Exec-utive Board because we did not consider it beneficial in the pursuit of our objectives to give appropriate consid-eration of women a greater priority than skills and quali-fications; this recommendation is no longer included in the latest version of the Code because an obligation to specify targets for the appointment of women to execu-tive boards has now been included in statutory provisions; and
• Article 5.4.3 for the reasons stated under 1.c above.”
The Executive Board and the Supervisory Board of the Company issued their first declaration of conformity pursuant to section 161 AktG in May 2015 to coincide with the planned IPO. This declaration can also be accessed on the Company’s website.
Main components of corporate governance practice
Compliance is one of the principal management responsibilities of the Executive Board Compliance with legal requirements and internal policies, and ensuring that all related stipulations are observed within the Group, are among the management and oversight responsibilities at Siltronic. The Supervisory Board, especially the Audit Committee, regularly addresses compliance issues and reviews the compli-ance management system.
The compliance management system in the Group is routinely reviewed and refined. This process is the responsibility of Siltron-ic’s compliance organization. The Company has appointed and trained compliance officers in Germany, the USA, Japan, Singa-pore and Taiwan. These officers hold regular training sessions for employees to provide them with information on relevant statutory provisions and internal policies. The officers act as the point of contact if employees have any questions and can offer advice on compliance issues. Employees may also contact the compliance officers in confidence, including anonymously, if they wish to report breaches of internal policy or legal provisions. In 2015, compliance management continued to focus on a num-ber of areas, notably continuous improvement within the com-pliance organization in relation to information sharing with the international sites and the provision of local training for employees.
EICC Code of Conduct and Global Compact firmly established as part of corporate governance The global initiatives of the Electronic Industry Citizenship Coa-lition (EICC) and UN Global Compact form the basis for sustain-able corporate governance at Siltronic. The EICC is a voluntary tie-up between more than 100 of the world’s leading electron-ics companies to foster awareness of social and environmental responsibility around the globe and promote ethical business practices. EICC members undertake to use the EICC Code of Conduct as the basis for their operating activities, including all parties involved in the supply chain. The EICC Code of Conduct summarizes financially ethical and socially responsible working conditions and the minimum requirements for the electronics industry, and some of these requirements extend far beyond the provisions in local legislation. Siltronic is a supplier to the elec-tronics industry and has declared its willingness to comply with the EICC Code of Conduct; it regularly completes the self-as-sessment questionnaire available to all EICC members. Custom-ers frequently include in their evaluation of Siltronic an assess-ment as to whether the Company is complying with the EICC Code of Conduct. Further information on the EICC and its Code of Conduct is available at http://www.eiccoalition.org/.
31ANNUAL REPORT 2015
To our shareholders • Report and declaration on corporate governance

The objective of the United Nations Global Compact initiative is to reshape globalization so that it improves the quality of life for everyone on the planet. We implement the ten principles of the Global Compact, which aim to protect human rights, set social and environmental standards for business operations and com-bat corruption. Information on the ten principles of the UN Global Compact is available at www.unglobalcompact.org. In addition, we expect our suppliers to adhere to the principles of the Global Compact. When carrying out a risk assessment, we therefore also evaluate our suppliers from this perspective.
Siltronic is a company in the Wacker Chemie AG Group and as such also participates in the global chemical industry’s Respon-sible Care® initiative (https://www.vci.de/nachhaltigkeit/respon-sible-care/uebersichtsseite.jsp). Wacker and its Group companies have been committed to this initiative since 1991. The participants in the initiative undertake to strive for continuous improvement in environmental, health, safety and security performance inde-pendently and regardless of any statutory requirements.
Basic principles of corporate ethicsBusinesses need the trust of society if they are to be economi-cally successful. We therefore manage our business responsibly in compliance with statutory requirements. We have set out the basic principles of our corporate ethics in a code of conduct, which is available on the Company’s website (www.siltronic.com). This code of conduct is binding for the Executive Board and all employees worldwide. Siltronic is a Wacker Group com-pany and is therefore also subject to the Wacker business prin-ciples, which are laid down in five corporate codes:
• Code of Conduct, which sets out the basic principles for interaction with business partners and third parties (confi-dentiality, separation of private and business interests, data protection, prevention of money laundering);
• Code of Safety, which defines the safety culture and sets safety regulations for workplaces, plants, products and transport;
• Code of Innovation, which specifies the principles applicable to research and development, partnerships, patents and innovation management;
• Code of Teamwork & Leadership, which lays down the princi-ples for collaborative teamwork, leadership and management;
• Code of Sustainability, which details the principles for sustain-able corporate governance.
The codes can be found on Wacker Chemie AG’s website (http://www.wacker.com/cms/en/wacker_group/wacker_facts/policy/policy.jsp).
Information on the working methods of the Executive Board and Supervisory Board, and on the composition and working methods of the Supervisory Board’s committees
As required by the German Stock Corporation Act, Siltronic AG has a two-tier governance structure. This structure comprises the Executive Board, which manages the business, and the Supervisory Board, which oversees the executive management. The two bodies are strictly segregated in terms of both mem-bership and their powers.
Executive Board
The Executive Board currently comprises two members: Dr. Christoph von Plotho, President and Chief Executive Officer, and Rainer Irle, Chief Financial Officer. The Executive Board manages the business of the Company in accordance with the law, the Articles of Association and the rules of procedure for the Executive Board. The Executive Board is independently responsible for managing the Company and represents Siltronic AG in all transactions with third parties. Its actions and decisions are determined by the interests of the Company and are geared toward the objective of a sustained increase in enterprise value. To this end, the Executive Board determines the corporate strat-egy of the Siltronic Group and then manages and supervises the implementation of this strategy by allocating financial and other resources, assigning capacity, and by supporting and monitoring the operating units. The Executive Board ensures that the Com-pany complies with statutory provisions and that it maintains an appropriate system of risk management and control.
The members of the Executive Board bear joint responsibility for the executive management of the Company, although each individual member of the Executive Board independently man-ages his own assigned areas of responsibility. The Executive Board comes together regularly in meetings convened and led by the CEO. Meetings of the Executive Board must be held to cover matters affecting the wellbeing of the Company. The Exec-utive Board generally approves decisions by simple majority. For as long as the Executive Board only comprises two people, deci-sions can only be made unanimously and the CEO does not have a casting vote.
32 ANNUAL REPORT 2015
To our shareholders • Report and declaration on corporate governance

Close cooperation between Executive Board and Supervisory Board
The Executive Board and Supervisory Board work in close collab-oration to ensure that the Company performs successfully over the long term. Their common objective is to achieve sustainable growth in the Company and its value. The Executive Board sub-mits regular, prompt, comprehensive reports to the Supervisory Board covering all matters of strategy, planning, business perfor-mance, risk position, risk management and compliance relevant to the Company. Between meetings, the chairman of the Super-visory Board remains in contact with the Executive Board, in particular with the CEO, and they discuss key issues. The Executive Board provides the Supervisory Board with explanations if busi-ness performance deviates from the plans and targets.
The rules of procedure for the Executive Board of Siltronic AG specify that the consent of the Supervisory Board is required for certain transactions or in certain situations. Matters in which consent is required include the approval of the annual planning (encompassing financial and capital expenditure planning), the acquisition or disposal of equity investments, the commence-ment of a new branch of production or line of business, the discontinuation of an existing branch of production or line of business, and the raising of major long-term loans.
Supervisory Board
The Articles of Association specify that the Supervisory Board must comprise twelve members. In accordance with the German Codetermination Act (MitbestG), it has equal numbers of share-holder and employee representatives. The standard period of office for members of the Supervisory Board is five years. They can be re-elected. An overview of the members of the Supervi-sory Board in office during the reporting period and details of other positions that they hold on supervisory boards or similar bodies that are required by law to be formed can be found on 134. With one exception, the normal period of office for all the current members of the Supervisory Board will expire at the end of the Annual General Meeting in 2018. The period of office for Ms. Angela Wörl, who was appointed by the courts on January 4, 2016, will expire at the end of the Annual General Meeting in 2016 in accordance with the recommendation in the German Corporate Governance Code. The Supervisory Board appoints, oversees and advises the Executive Board and is directly involved in decisions of material importance for the Company.
Fundamental decisions about the further development of the Company must be agreed by the Supervisory Board. The Super-visory Board has set its own rules of procedure, which satisfy the requirements specified in the German Corporate Governance Code.
A high degree of independence in the oversight of the Executive Board is already guaranteed by virtue of the two-tier board struc-ture in which the members of the Supervisory Board cannot simultaneously be members of the Executive Board.
If necessary, the Supervisory Board may meet without the pres-ence of the Executive Board, especially if the Supervisory Board is making decisions about personnel.
Committees enhance the efficiency of the Supervisory Board
The Supervisory Board has created four committees with spe-cialist skills to allow it to carry out its responsibilities in the most efficient manner. Reports on the work of the committees are regularly submitted to full meetings of the Supervisory Board.
Executive Committee Chairman:Dr. Tobias Ohler (since December 12, 2015)Dr. Joachim Rauhut (until December 11, 2015)
Members:Dr. Hermann GerlingerJohann Hautz (since January 1, 2016)Walter Ortner (until December 31, 2015)
Responsibilities:The Executive Committee prepares HR decisions for the Super-visory Board, in particular those concerning the appointment or removal of members of the Executive Board and the appoint-ment of the CEO. It also deals with the contracts for the members of the Executive Board and draws up the system of Executive Board remuneration, which the full Supervisory Board then uses as the basis for specifying the remuneration for the Executive Board members.
33ANNUAL REPORT 2015
To our shareholders • Report and declaration on corporate governance

Nomination CommitteeChairman:Dr. Tobias Ohler (since December 12, 2015)Dr. Joachim Rauhut (until December 11, 2015)
Member:Dr. Hermann Gerlinger
Responsibilities:The Nomination Committee was set up in preparation for the IPO in May 2015 and comprises two members. Unless otherwise determined by the Supervisory Board, the members of this com-mittee are those shareholder representatives who are also mem-bers of the Executive Committee. The tasks of the Nomination Committee are to identify suitable candidates for potential election to the Supervisory Board, taking into consideration the objectives for the composition of the Supervisory Board, and to prepare the proposals to be submitted by the Supervisory Board to the Annual General Meeting regarding the election of shareholder representatives.
Audit Committee Chairman:Bernd Jonas
Members:Dr. Tobias Ohler (since December 12, 2015)Harald Sikorski (since January 1, 2016)Walter Ortner (until December 31, 2015)Dr. Joachim Rauhut (until December 11, 2015)
Responsibilities:The Audit Committee was also established in connection with the preparations for the IPO in May 2015. The Audit Committee carries out the preparation for Supervisory Board decisions on the formal adoption of the annual financial statements and the approval of the consolidated financial statements. In addition, it addresses the review of the half-yearly interim consolidated financial statements, discusses the quarterly financial statements and concerns itself with issues related to risk management and compliance. In connection with these tasks, it is responsible for carrying out a preliminary review of the single-entity financial statements, the consolidated financial statements, the manage-ment reports for the Group and the parent company and the
proposal for the appropriation of profit. In particular, it monitors the financial reporting processes, compliance and the effective-ness of the systems for internal control, risk management and internal auditing. It works in close cooperation with the external auditors. The Audit Committee also prepares the engagement agreement with the external auditors and takes suitable action to monitor the independence of the external auditors and the additional services performed by these auditors. On this basis, it submits a recommendation to the Supervisory Board regarding the auditing firm to be proposed by the Supervisory Board to the Annual General Meeting as the independent auditors. The chairman of the Audit Committee, Mr. Bernd Jonas, is a law graduate with particular expertise and experience in accounting and auditing derived from his many years of professional activ-ity in this area, most recently as Executive Vice President and Head of the Taxes & Customs Corporate Center at ThyssenKrupp AG, and from his activities on the Auditor Oversight Commission and on various supervisory bodies of companies in both Ger-many and abroad.
Conciliation CommitteeChairman:Dr. Tobias Ohler (since December 12, 2015)Dr. Joachim Rauhut (until December 11, 2015)
Members:Gebhard Fraunhofer (since January 20, 2016)Johann Hautz (since January 1, 2016)Angela Wörl (since January 20, 2016)Walter Ortner (until December 31, 2015)Harald Sikorski (until December 31, 2015)
Responsibilities:The Conciliation Committee established in accordance with sec-tion 27 (3) MitbestG is responsible for the tasks assigned to this committee by law: if a decision regarding the appointment or the withdrawal of the appointment of an Executive Board member does not have the necessary majority of two thirds of the votes, the Conciliation Committee is then responsible for distributing a proposal.
34 ANNUAL REPORT 2015
To our shareholders • Report and declaration on corporate governance

Specification of targets for the proportion of women in management positions pursuant to section 76 (4) and section 111 (5) AktG
In implementation of the German Act for the Equal Participation of Women and Men in Managerial Positions in the Private and Public Sectors, which came into force on May 1, 2015, the Super-visory Board discussed the issue at its meeting on September 11, 2015 and decided on a target of 0 percent for the proportion of women on the Executive Board of Siltronic AG with an imple-mentation deadline of June 30, 2017. The current situation will therefore remain unchanged. The periods of appointment for the two current members of the Executive Board run until 2018 and 2020 and any expansion of the Executive Board to three or more members would be counterproductive in view of the Com-pany’s efforts to monitor and steadily reduce its costs.
In September 2015, the Executive Board of Siltronic AG decided to increase the number of women in the two management lev-els below the Executive Board to a combined total of four by June 30, 2017, thereby doubling the current number. In the case of the first management level below the Executive Board, the target set by the Executive Board is that, by June 30, 2017, three out of a total of 16 heads of division should be women, equat-ing to a ratio of 18.75 percent. The target decided by the Exec-utive Board for the second management level below the Exec-utive Board, i.e. all employees at reporting level 2 who also have the status of senior manager, is that, by June 30, 2017, one out of a total of 34 employees should be a woman. The target for the first management level represents an increase in the propor-tion of women because there was only one female head of division out of a total of 14 heads of division (equating to a ratio of 7.7 percent) on the target setting reference date (June 30, 2015). The target for the second management level maintains the current situation.
There was no requirement to set a target for the proportion of women on the Supervisory Board. In this case, the statutory minimum gender ratio of 30 percent already applies, i.e. the members of the Supervisory Board must comprise at least 30 percent men and at least 30 percent women. It is mandatory to take this requirement into account when making new appointments from January 1, 2016. The shareholder represen-tatives’ side and the employee representatives’ side have each rejected fulfillment of the gender quota requirement on the basis of the Supervisory Board membership as a whole in accordance
with section 96 (2) sentence 3 AktG, meaning that each side needs to achieve the quota separately. Since the appointment of Ms. Angela Wörl by the courts as a shareholder representative on January 4, 2016, four members of the Supervisory Board of Siltronic AG have been women, two on the shareholder side and two on the employee side. This means that the Supervisory Board has been complying with the statutory minimum gender quota since that date.
Further information on corporate governance
Objective for the composition of the Supervisory Board
Siltronic has always considered it important that the members of its Supervisory Board possess a high level of professional skills and qualifications. At its meeting held on December 11, 2015, the Supervisory Board of Siltronic AG updated its objectives relat-ing to the future composition of the Supervisory Board as required by article 5.4.1 of the German Corporate Governance Code as amended on May 5, 2015. At the same time, it also took into account the new recommendation to fix a standard period of time for membership of the Supervisory Board:
1. The Supervisory Board should have an appropriate number of members with international experience, but in any case at least one such member.
2. The rules of procedure for the Supervisory Board already include comprehensive arrangements for preventing and handling conflicts of interest involving members of the Super-visory Board. Furthermore, the Supervisory Board generally strives to prevent conflicts of interest and will also take this objective into account when submitting its proposals to the Annual General Meeting concerning candidates for election to the Supervisory Board.
3. The members of the Supervisory Board should include at least three independent shareholder representatives.
4. Membership of the Supervisory Board should generally be for no more than three full periods of office. The Supervisory Board may deviate from this rule in justified exceptional cases.
The rules of procedure for the Supervisory Board already include an age limit.
35ANNUAL REPORT 2015
To our shareholders • Report and declaration on corporate governance

The Supervisory Board takes these objectives into consideration when proposing election candidates to the Annual General Meeting. The Executive Board also gave due regard to these objectives in 2015 when it made its application to the courts for the appointment of Ms. Angela Wörl as a member of the Super-visory Board.
The composition of the Supervisory Board of Siltronic AG is con-sistent with the adopted objectives and is in compliance with the age limit specified in the rules of procedure for the Supervi-sory Board.
Transparent information for shareholders and the general public
Siltronic aspires to provide information promptly and on an equal basis for all its target audiences, be they shareholders, share-holder representatives, analysts, media or interested members of the public. We regularly publish key dates for the Company in a financial calendar, which can be found on our website. Capital market players are in close contact with our investor relations team. We offer information on current and future busi-ness performance for investors and analysts in conference calls held in conjunction with the publication of each quarterly report. We regularly take part in roadshows and investor conferences. Once a year, we organize an analysts’ meeting. We also publish information in ad-hoc announcements where required to do so by law. To support this requirement, we have created an ad-hoc team, which includes the two members of the Executive Board, the Head of Legal & Compliance and the Head of Investor Rela-tions & Communications. The team reviews the matters con-cerned to assess any relevance for ad-hoc announcements. In this way, we ensure that possible insider information is handled in compliance with the law. The Company maintains an insider list containing the names of employees who need to have access to insider information as part of their responsibilities.
Key presentations are freely available for inspection on the Com-pany’s website where you will also find all press releases and ad-hoc announcements in German and English, together with the online annual report and all interim reports. Further infor-mation is available at http://www.siltronic.com
Annual General Meeting
The purpose of the Annual General Meeting is to ensure that all shareholders are informed efficiently and comprehensively about the position of the Company. Even before the Annual General Meeting, shareholders receive key information about the imme-diately preceding financial year in the annual report. The notice of the Annual General Meeting provides details of the agenda items and explains the eligibility criteria for participation in the meeting. This notice, together with all the reports and docu-ments required under statutory provisions, including the annual report (which contains the consolidated financial statements and the Group management report among other things) and the separate financial statements of Siltronic AG including the man-agement report, is also accessible on the website. Following the Annual General Meeting, we publish on the website details of the attendance at the meeting and the results of the voting. All these different forms of communication help to ensure that information is regularly shared with our investors. Siltronic makes it easy for its shareholders to exercise their rights in per-son or appoint proxies. The Company makes proxies available to exercise shareholder voting rights in accordance with instruc-tions from the shareholders concerned.
Directors’ dealings
Under section 15a of the German Securities Trading Act (Wert-papierhandelsgesetz, WpHG), individuals with senior manage-ment responsibilities – who at Siltronic AG include the members of the Executive Board and the Supervisory Board – and their family members must report the buying and selling of Siltronic shares and other related rights to the German Federal Financial Supervisory Authority (BaFin) and the Company if the value of these transactions exceeds EUR 5,000 within a calendar year.
In 2015, there was one notifiable deal in which a member of the Supervisory Board acquired Siltronic shares. Details have been published on Siltronic AG’s website.
The two members of the Executive Board received an IPO bonus in return for their services in connection with the successful IPO of Siltronic AG. They were each paid 50 percent of this bonus in Siltronic shares. Details can be found in the remuneration report on 73.
The total of Siltronic shares held by all members of the Executive Board and Supervisory Board does not exceed 1 percent of the shares issued by the Company.
36 ANNUAL REPORT 2015
To our shareholders • Report and declaration on corporate governance

Information on share-based incentive schemes
Of the total annual variable remuneration for the members of the Executive Board, 15 percent is paid in shares in the Company. Details are set out in the remuneration report.
Responsible approach to opportunities and risks
Responsible handling of risk by a company is a key element of good corporate governance. Siltronic takes a systematic man-agement approach in which it regularly identifies and monitors the main opportunities and risks for the Company. With this system, it aims to identify risks at an early stage and then mini-mize such risks by means of rigorous risk management. The Executive Board routinely provides the Supervisory Board with information on existing risks and the changes in these risks. The Audit Committee regularly addresses the financial reporting process and the effectiveness of the systems for internal control, risk management and internal auditing. The opportunity and risk management system is continuously refined and adjusted in line with changing circumstances. Further details can be found in the opportunity and risk report on 60.
Financial reporting and auditing of financial statements
Siltronic’s consolidated financial statements for the year ended December 31, 2015 have been prepared in accordance with the International Financial Reporting Standards (IFRSs), as adopted by the European Union. The annual financial statements of Siltronic AG for the year ended December 31, 2015 have been prepared in accordance with the provisions of the German Com-mercial Code. The financial reporting for the 2015 financial year has been audited by KPMG AG Wirtschaftsprüfungsgesellschaft, Munich. In accordance with the recommendations in the Ger-man Corporate Governance Code, we have agreed with the auditors that the chairman of the Supervisory Board will be informed without delay of any grounds for exclusion or partial-ity arising during the audit. The auditors also report immediately on any material findings or circumstances that affect the respon-sibilities of the Supervisory Board. If, during the audit of financial statements, the auditors identify any factors pointing to a mis-statement in the declaration of conformity with the German Corporate Governance Code pursuant to section 161 AktG made by the Executive Board and the Supervisory Board, the auditors will inform the Supervisory Board accordingly and note the finding in the audit report.
D&O insurance
Siltronic has taken out directors’ and officers’ (D&O) insurance covering the activities of the members of the Executive Board and the Supervisory Board. This insurance includes the statutory deductible for the members of the Executive Board. No deductible is applied in the case of the members of the Supervisory Board for the reasons explained in the declaration of conformity.
Conflicts of interest
The members of the Executive Board and Supervisory Board are subject to an obligation to work solely in the interests of the Company. When making decisions, they must not pursue any personal interests or exploit for personal gain any business opportunities available to the Company. The rules of procedure for both the Executive Board and the Supervisory Board specify that any conflicts of interest must be disclosed without delay. If a conflict of interest is material and likely to be present for more than just a short period, the relevant member of the Supervisory Board must step down. All transactions between the Company on one side and a member of the Executive Board or his family on the other side must be on an arm’s-length basis. Such trans-actions require the consent of the Supervisory Board if the value of the individual transaction concerned exceeds EUR 5,000. No conflicts of interest arose either in the Executive Board or in the Supervisory Board in the year under review.
37ANNUAL REPORT 2015
To our shareholders • Report and declaration on corporate governance

39 Business and economic conditions39 Group structure and business activities
42 Corporate strategy and corporate management
44 Business report44 Macroeconomic situation and sector trends
44 Significant events affecting our business performance
44 Comparison of actual and forecast
business performance
45 Overall statement by the Executive Board on business
performance and the economic position
46 Financial position and financial performance46 Sales and financial performance
49 Financial position
52 Financial management
53 Non-financial performance indicators53 Employees
55 Research and development
56 Production and supply chain management
57 Purchasing and supplier management
58 Sales and marketing
58 Corporate social responsibility (CSR)
60 Opportunity and risk report60 Risk strategy and risk policy
60 Risk management system
61 Internal control system in the
consolidated accounting process
61 Material risks
68 Opportunity report
70 The Executive Board’s assessment of aggregate risk
71 Outlook71 Expected macroeconomic and sectoral trends
71 Siltronic’s future performance
72 Overall statement by the Executive Board on
expected performance
73 Events after the reporting period
73 Concluding declaration pursuant to section 312 (3) AktG
73 Remuneration report73 Executive Board remuneration system
73 Arrangements until June 10, 2015
74 Arrangements since June 11, 2015
76 Total remuneration of the members of
the Executive Board for 2015
77 Remuneration for Supervisory Board members
79 Disclosures relevant to acquisitions
WirtschaftsberichtGroup management report
38

Group structure and business activities
Leading international supplier of hyperpure silicon wafers
We are a global market leader and technology leader for hyper-pure silicon wafers for the semiconductor industry. We have production facilities at four locations in Germany, the USA, and Asia, where we manufacture silicon wafers with diameters of up to 300mm. Our customers include the top 20 consumers of silicon wafers in the semiconductor industry, and we maintain long-term business relationships with all our key customers.
Siltronic is known in the market for its long-standing expertise, customer-specific solutions, and global product availability, as well as assured quality and delivery reliability. Our worldwide presence enables us to respond to inquiries from customers in under 24 hours. This combination gives rise to our high level of customer satisfaction and lays the foundations for the sustained success of our business. Our aim is to supply high-quality wafers with specifications that fulfill or even exceed our customers’ requirements.
Silicon wafers are the basis for modern microelectronics and nanoelectronics and are therefore a key component of countless everyday objects, such as computers, smartphones, flat screens, and navigation systems.
We strive to be a driving force for innovation in silicon wafers for the semiconductor industry.
Legal structure of the Group
Siltronic has had the legal form of a stock corporation (Aktien-gesellschaft) subject to German law since 1996, although at that time it was called Wacker Siltronic Gesellschaft für Halbleiter-materialien AG. In 2004, the Company was renamed Siltronic AG. It is headquartered in Munich, Germany. Since January 1, 2016 Siltronic AG has had direct and indirect equity investments in five companies (2015: six companies). Siltronic Asia Pte. Ltd., Singapore was merged into Siltronic Singapore Pte. Ltd. on January 1, 2016.
In July 2006, Siltronic (through its wholly owned subsidiary Siltronic Holding International B.V., Netherlands) formed a 50/50 joint venture in Singapore with Samsung called Siltronic Silicon Wafer Pte. Ltd. (SSW). We acquired a controlling interest in SSW on January 24, 2014 and now hold 78 percent. Since that time, all companies in which Siltronic AG has direct or indirect equity investments have been fully consolidated in the consolidated financial statements.
Management and control
As required by the German Stock Corporation Act (AktG), Siltronic AG has a two-tier governance structure consisting of the Executive Board and Supervisory Board. The Executive Board has two members; its composition did not change in fiscal 2015. The Supervisory Board consists of twelve members. There were some changes on the Supervisory Board. Information on the Executive Board and Supervisory Board and how their responsi-bilities are allocated can be found in the corporate governance report on 30.
Business and economic conditions
Allocation of responsibilities on the Executive Board
Dr. Christoph von Plotho Rainer Irle
• President & Chief Executive Officer• Marketing & Sales• Technology• Application Technology• Production• Supply Chain Management• Quality Management & Sustainability• Engineering• Legal & Compliance• Investor Relations & Communications• Site Management, Burghausen &
Freiberg• Siltronic Singapore
• Chief Financial Officer• Finance & Tax• Financial Planning & Reporting• Risk Management & Audit• IT• Purchasing• Human Resources• Siltronic USA
ANNUAL REPORT 2015
Group management report • Business and economic conditions
39

Active strategic management holding company, decentralized structure, and proximity to customersThe parent company of the Siltronic Group, Siltronic AG, acts as the Group’s holding company under company law and as its oper-ational holding company. As the parent company, Siltronic AG is in charge of the corporate strategy and generic strategic management as well as communications with the Company’s important stakeholders, particularly the capital markets and shareholders. The operational subsidiaries are managed sepa-rately from a business perspective. The Siltronic AG Executive Board is represented on the executive boards of the subsidiaries. An extended team of senior group managers at Siltronic AG have their performance measured in accordance with agreed targets. Specific targets are defined at groupwide, regional, and operational level and are reviewed on an ongoing basis.
Remuneration of the Executive Board and Supervisory BoardThe Executive Board’s remuneration consists of fixed and variable elements. The main features of the remuneration system for the Executive Board and Supervisory Board are described in the remuneration report on 73 to 78 of the management report.
Declaration on corporate governanceThe declaration on corporate governance, which is required by section 289a of the German Commercial Code (HGB), is con-tained in the corporate governance report on 30 to 37. It includes information on the work of the Executive Board and Supervisory Board, the declaration of conformity pursuant to section 161 AktG, and details on significant corporate manage-ment practices.
The declaration of conformity has been made permanently accessible to the public on the website http://www.siltronic.com/int/en/investor_relations/corporate_governance/declaration/ declaration.jsp
Important products, business processes, and markets
Our experience, technological expertise, and innovative strength provide added value Silicon is the basis for nearly all semiconductor components and thus essentially underpins the entire global electronics industry. The wafers are used for increasingly small structures, known as design rules, which nowadays are just a few nanometers in size. This makes it possible to manufacture ever more powerful and energy-efficient generations of computer chips. Our silicon wafers, with diameters of up to 300mm, support these devel-opments and form the basis for highly complex semiconductor components, such as high-voltage applications, low-resistivity circuit boards for automotive engineering and telecommunica-tions, and highly integrated microprocessors and memory mod-ules for information processing.
We act as a strategic development partner for our industrial customers, to whom we supply solutions tailored specifically to their requirements. In doing so, we draw on our technical exper-tise and deep understanding of what our customers need. Our four production facilities and nine sales offices in Europe, the USA, and Asia serve customers in 40 countries. In 2015, our five largest customers were (in alphabetical order) Infineon Tech-nologies, Intel Corporation, Micron Technology, Samsung Elec-tronics, and Taiwan Semiconductor Manufacturing Company (TSMC). Our local approach to sales enables us to offer high- quality customer service.
Structure of the Siltronic Group
Siltronic AG, Germany
100 % Siltronic Holding International,
Krommenie, Netherlands
100 % Siltronic Singapore Pte. Ltd.,
Singapore
100 % Siltronic Japan Corporation,
Tokyo, Japan
100 % Siltronic Corporation,
Portland, Oregon, USA
78 % Siltronic Silicon Wafer Pte. Ltd.,
Singapore (SSW)
40 ANNUAL REPORT 2015
Group management report • Business and economic conditions

By working closely with our customers, we help them to con-tinuously improve and update their products and solutions. We manufacture specified polished and epitaxial wafers in accor-dance with the latest design rules.
Competitive situation
There is a great deal of global competitive pressure in the market for silicon wafers for the semiconductor industry. Our main com-petitors are the two Japanese manufacturers Shin-Etsu Handotai and SUMCO Corporation plus SunEdison Semiconductor from the USA and LG Siltron from Korea. Market studies show that Siltronic is the third-largest manufacturer of silicon wafers for the semiconductor industry and the largest manufacturer out-side Japan. Our market share is approximately 15 percent.
The market is characterized by a high concentration of wafer suppliers. Together, the five largest manufacturers meet roughly 90 percent of global demand. Customers are working increas-ingly closely with manufacturers on the development of new wafers. We expect to be able to benefit even more from this trend in the future due to our excellent access to customers.
Economic and legal influences
We sell our wafers to customers in the semiconductor industry worldwide. This means we are subjected to the cyclical fluctua-tions that are typical for this industry. However, this volatility varies significantly in terms of when it occurs and to what extent. We take account of expected developments in our business planning at an early stage using selected leading indicators, such as commodity prices, customers’ ordering behavior, our capacity utilization, and production and unit sales forecasts for the semi-conductor industry.
Exchange rate volatility caused by trade relationships between currency areas has an operational impact on our sales and earn-ings because we generate around two-thirds of our sales in US dollars but incur the bulk of our costs in euros. We are trying to reduce the effect of currency movements by relocating the value creation process to Asia and pursuing a proactive hedging policy.
Siltronic’s costs are affected by wage and salary increases and by changes in the cost of materials. Our main raw material is polysilicon, most of which we obtain from Wacker Chemie AG on the basis of long-term supply agreements. We use a large number of auxiliary materials, e.g. polishes and saw wire, in our manufacturing processes. As far as possible, we try to procure our materials from multiple suppliers.
We increase our profitability by taking steps within the Com-pany, such as optimizing processes in all functional units. Back in 2010, we launched the cost roadmap, an ongoing cost-cut-ting program, in order to proactively identify and unlock poten-tial for improvement. All projects aimed at boosting efficiency are included in this program. In one of these projects, we are aiming to reduce the variable costs of a 300mm wafer by around 10 percent per year and increase our production capacity by roughly 2.0 percent each year without the need for new capital expenditure. New ideas are prioritized and their implementation is monitored at regular steering committee meetings.
End markets for semiconductor applicationsin %
Source: IHS 2015; ‘Other’ includes network infrastructure, consumer end devices, etc.
26Other
8Automotive
12Industry
29 Computers
25smartphones
ANNUAL REPORT 2015
Group management report • Business and economic conditions
41

Because we do business worldwide, various legal and tax require-ments apply to us that we have to take into account in our operations. These include product liability legislation, employ-ment regulations, foreign trade laws and patent laws.
Risks for our business arising from the economic and legal situ-ation are presented in the risk report on 60 to 70.
Corporate strategy and corporate management
Our strategic objective is to expand our business activities over the long term in order to consolidate our position as one of the leading manufacturers of semiconductor wafers. To achieve this objective, we want to increase our technology leadership, retain our leading quality position, and continue with our program for operational excellence and cost reductions. We also focus on a high level of profitability and a stable cash flow. There were no major changes to our objectives and strategies compared with the previous year.
Megatrends creating a sustained increase in the use of our high-quality hyperpure silicon wafersCustomer requirements in the semiconductor industry are changing all the time, driven primarily by global megatrends such as travel, connectivity, miniaturization, and cost efficiency. Because of the Internet of Things (IoT), for example, the devices that come on to the market will be increasingly intelligent, and everyday objects will be fitted with processors, sensors and net-working capabilities. The technology will range from app-con-trolled wearables to smart factories. Continuous improvements to functionality and energy efficiency, for example of smart-phones, driver assistance systems in motor vehicles, and indus-trial automation, are based on semiconductor manufacturers constantly enhancing the components needed for these appli-cations. Typically, these developments mean that raw materials have to meet ever more demanding requirements. For example, smaller design rules for components are only possible if the sil-icon wafers have the necessary uniformity.
We therefore expect that demand for highly developed wafers will continue to rise. We want to seize these opportunities for growth by focusing on innovative solutions that add value, thereby proactively helping to meet our customers’ new require-ments.
Synergies from best-in-class production processesWe have many years of experience of manufacturing 300mm wafers and have built state-of-the-art production facilities at our German sites in Freiberg (Saxony) and Burghausen as well as in Singapore that are designed for the mass production of these wafers. Our production facilities in Singapore for 200mm and 300mm wafers are among the biggest and most modern in the world. Standardized processes and largely identical machinery ensure knowledge can be transferred between our production sites. This enables us to quickly and easily improve processes, to simplify the process of quality certification by our customers and, if necessary, to reallocate production orders between our factories.
Our success factors: a global presence and innovative strength We want to offer solutions with enhanced product capabilities or quality that our customers can use in their current and future applications.
The products required in our target markets are highly sophisti-cated. Examples of applications for silicon wafers are computers, tablets, smartphones, solid-state drives, assistance and control systems in the automotive industry, and wearables. We provide our customers worldwide with specified, high-quality products. One of the methods that we use to do so is the float zone technology for wafers with a diameter of up to 200mm (see the chapter on production on 56). We continually strive to improve our innovative strength and attach a high priority to research and development (R&D). Our plan is to invest approximately 7 percent of our sales into R&D each year.
42 ANNUAL REPORT 2015
Group management report • Business and economic conditions

Ongoing optimization of our production processes and cost structuresBetween 2009 and 2014, there was overcapacity in the produc-tion of silicon wafers, putting a lot of pressure on prices in the industry. Our strategic objectives are to improve profitability and strengthen cash flow. We support and steer our efforts to achieve these objectives in a variety of ways. These include cost discipline and continuous improvement of processes in all func-tions and regions. For example, our cost roadmap helped us to reduce our costs by EUR 80 million in 2013 compared with 2012, by EUR 55 million in 2014 compared with 2013, and by EUR 45 million in 2015 compared with 2014. As a result, our loss from operations has declined and our adjusted* EBITDA has remained virtually stable over the past three years, despite pres-sure on prices. On the basis of the plans for improvements that have been identified and initiated, we will continue to focus on achieving the cost benefits arising from this program in the future.
Constant monitoring of selected financial and non-financial key performance indicatorsThe Group’s management team predominantly uses financial key performance indicators (KPIs) to manage Siltronic.
The most important financial KPIs are the EBITDA margin, free cash flow and ROCE (return on capital employed).
A high level of profitability is an important target and metric for the Group’s management team. The measurement basis we use is EBITDA, which enables us to compare ourselves with our com-petitors. EBITDA is defined as earnings before interest, taxes, and depreciation/amortization including impairment losses and reversals thereof. We use this comparison, along with historical trends and planning information, to calculate an EBITDA margin target.
Another important metric is free cash flow. By focusing on this KPI, we are ensuring that Siltronic remains financially solid going forward. Free cash flow shows whether the required investments in property, plant and equipment and intangible assets can be financed from the Company’s own operating activities (cash flow from operating activities). Our goal is to achieve a positive cash flow from operating activities each year. The main influences on this KPI, besides profitability, are effective management of net working capital and the level of capital expenditure. Net working capital is defined as the sum of inventories and trade receivables less trade payables.
ROCE is defined as EBIT (earnings before interest and taxes) divided by capital employed. Capital employed is calculated from non-current assets and working capital, using the average of the respective items at the beginning and end of the reporting period.
Targets for all financial KPIs are set and monitored at the level of the Group and the group companies, with the exception of ROCE. Each month, we measure the discrepancies between the target and actual figures at the level of the Group and in all local companies. KPIs are analyzed monthly and quarterly. We also review the detailed business planning on the basis of the available monthly and quarterly results and draw up a specific forecast for business performance.
The abovementioned KPIs are supplemented by additional financial indicators, including particularly sales, capital expenditure and net financial assets. Non-financial performance indicators mainly refer to human resources, research and development, production and corporate social responsibility, where we use indicators such as productivity, yield and frequency of accidents. We do not use any of these indicators across the board to manage the Company.
* The term “adjusted” presents Siltronic as if SSW would have been consolidated prior to January 1, 2012 and restructuring costs of EUR 16.4 million would not have been incurred. These adjustments do not comply with IFRS.
ANNUAL REPORT 2015
Group management report • Business and economic conditions
43

Macroeconomic situation and sector trends
According to the International Monetary Fund (IMF), global eco-nomic activity was rather weak during 2015, with gross domes-tic product rising by 3.1 percent worldwide (2014: 3.4 percent).
The eurozone economy had been declining for some time, but there were some signs of renewed growth, albeit at only a very moderate level. The low price of oil, the expansionary monetary policy of the European Central Bank, and the depreciation of the euro against other currencies such as the US dollar are help-ing to stimulate growth. The industrialized countries of the euro-zone saw expansion of around 1.5 percent, both in the fourth quarter and in 2015 as a whole (2014: 0.9 percent).
The German economy continued to pursue a moderate upward trajectory in 2015. The German Federal Statistical Office recorded growth of 1.7 percent for the year as a whole (2014: 1.6 percent).
The USA grew by 2.5 percent in 2015 and by 2.1 percent in the fourth quarter. By contrast, Japan’s growth was just 0.6 percent in 2015, although it accelerated in the fourth quarter to 1.5 per-cent. In China, gross domestic product increased by 6.8 percent in the fourth quarter of 2015 and by 6.9 percent for the year as a whole.
There was another year-on-year increase in demand for silicon wafers for the semiconductor industry in 2015. According to data from the SEMI industry association, the quantity of wafers sold worldwide, measured in terms of surface area, was up by 3.3 percent compared with 2014. Record quantities were sold in both the first and the second quarter. However, declining unit sales of semiconductors had an impact as the year progressed, resulting from inventory corrections by semiconductor manufac-turers. Demand for silicon in the second half of the year was thus slightly lower than in the corresponding period of 2014. According to IHS Technology, sales in US dollars were down by 1.3 percent during 2015 as a whole.
Significant events affecting our business performance
IPO of Siltronic AG in June 2015Siltronic successfully floated on the stock exchange on June 11, 2015. Nearly all of the capital of EUR 150 million (gross) raised from the IPO was used to repay financial liabilities to the parent company, Wacker Chemie AG. This significantly improved Sil-tronic’s financing structure. The costs of the IPO did not reduce earnings because they were recognized directly in equity. Due to the generally low level of interest rates, the capital raised to refinance financial liabilities had only a slightly beneficial impact on interest expense from the third quarter of 2015 onward. Since January 1, 2015, following the termination of the profit-and-loss transfer agreement (that had been concluded with Wacker-Chemie Dritte Venture GmbH) with effect from midnight on December 31, 2014, Siltronic AG has no longer formed a single entity with Wacker Chemie AG for tax purposes.
Comparison of actual and forecast business performance
Until the third quarter of 2015, our business fared very well. As a rule, the first half of the year at Siltronic is characterized by an uptrend that extends into the third quarter, and business is nor-mally quieter in the fourth quarter. In contrast to the forecast published in the second quarter of 2015, however, the uptrend flattened out as early as the third quarter. That is why we stated in the interim report on the third quarter of 2015 that unit sales of wafers in the fourth quarter of 2015 were likely to see a further drop of around 10 percent relative to the slightly reduced level in the third quarter. In the second quarter of 2015, we forecasted strong sales growth for the fiscal year 2015. In the third quarter, we issued a more detailed forecast in which we expected sales growth to be in the high single-digit percentage range due to currency effects. We expected the EBITDA margin for the year as a whole to be slightly lower than that for the first three quarters (14.1 percent).
We ended 2015 on a successful note with sales of EUR 931.3 million, equating to a year-on-year increase of 10.1 percent. That means we slightly exceeded our July and October forecasts of percent-age sales growth in the high single digits and were within the range of the strong growth in sales predicted in July. The oper-ating EBITDA margin came to 13.3 percent, which was down
Business report
Sources: World Economic Outlook Update, January 19, 2016.SEMI press releases (http://www.semi.org/en/silicon-manufacturers-group-information)IHS Technology, Semiconductor Silicon Demand Forecast Tool, Q1 2016 (January 21, 2016)
44 ANNUAL REPORT 2015
Group management report • Business report

slightly on the first three quarters of 2015, as had been expected, and was also down on the EBITDA margin for the first half of the year of 15 percent.
Firstly, fluctuations in the US dollar resulted in slightly higher hedging expenses than had been anticipated at the start of the year. Secondly, demand was particularly weak in the second half of 2015 and we were unable to make up for this with cost savings.
Despite the deviation from the EBITDA target, which was also reflected in EBIT, the forecast for ROCE made in October 2015
was slightly exceeded. This stood at 0.4 percent year in the year under review and was therefore within the range of our forecast from July 2015 which is thus confirmed.
Free cash flow was in line with expectations at EUR 37.4 million.
In 2015, we continued to consolidate our technology leadership by investing in our capabilities. We had planned total capital expenditure of around EUR 80 million. Our actual capital spend-ing amounted to EUR 75.0 million in 2015 and was thus slightly lower than the budgeted figure.
Comparison of actual and forecast business performance
2014 actualForecast in the Q2 2015 report
(July 2015)Forecast in the Q3 2015 report
(October 2015) 2015 actual
Sales (EUR mn) 846 n/a n/a 931.3
Sales growth in %
strong sales growth (actual for H1: +19%; H2 above prior-year level,
but much lower than in H1) High single-digit percentage 10.1
EBITDA margin in %
slightly below margin in H1 (actual for H1: 15%)
slightly lower than in the first three quarters (14.1%) 13.3
ROCE in % H2 level similar to that in H1
(actual H1: positive) slightly negative ROCE 0.4
Free cash flow (EUR mn)
increase (actual H1: EUR 47 mn; H2 neutral or slightly positive)
close to the figure for the first three quarters (EUR 48 mn) 37.4
Overall statement by the Executive Board on business performance and the economic position
The 2015 financial year was not quite in line with the Executive Board’s expectations. Unfortunately, the positive trends at the start of the year did not continue through to the end of the year. Despite the economic slowdown in the semiconductor industry, we were able to hit most of the targets that we had set ourselves at the beginning of 2015.
Sales amounted to EUR 931.3 million in 2015, which was within the range of our forecast. Despite the economically difficult sit-uation, we managed to increase our profit from operations while our EBITDA margin, at 13.3 percent, was also within the range of our prediction from the third quarter of 2015.
Our capital expenditure was slightly under the budgeted figure. The number of employees continued to decrease as planned. Staff costs were thus within the budgeted figure. R&D expendi-ture also came in on budget.
Total assets were slightly lower than at December 31, 2014 because of the reduction in non-current assets. We increased our equity ratio to 47.8 percent as a result of the IPO.
In view of the economic situation, especially in the third and fourth quarters of 2015, the Executive Board is satisfied with business in 2015 overall. The development of new products in collaboration with our customers helped to underpin our tech-nology leadership.
The Executive Board considers Siltronic’s economic position to be stable. This assessment is based on the results in the 2015 consolidated financial statements and separate financial state-ments and takes account of the course of business up to the time of preparing the 2015 group management report. At the time of preparing this annual report, business performance at the start of 2016 has been in line with the Executive Board’s expectations.
ANNUAL REPORT 2015
Group management report • Business report
45

Sales and financial performance
Strong sales growth driven by currency effectsWe succesfully finished 2015 with consolidated sales of EUR 931.3 million, representing a year-on-year increase of 10.1 percent (2014: EUR 846.0 million). This sharp rise was predominantly attributable to currency effects. Measured in US dollars, the average selling price (ASP) decreased slightly. In euro terms, however, the selling price increased. Sales climbed also because of higher volume and larger wafer area respectively.
Whereas approximately two-thirds of our costs are incurred in euros, we generate the bulk of our sales in US dollars and Japanese yen. This means that weakness of the euro against the US dollar has a positive impact on sales. The average euro to US dollar exchange rate in 2015 was 1.11, approximately 17 percent below the prior-year figure of 1.33.
Furthermore, sales were higher in 2015 as a result of SSW being consolidated for the full year, whereas it had only been included for just over eleven months in 2014. Initial consolidation took place following acquisition of a controlling interest in the 50/50 joint venture with Samsung on January 24, 2015. If SSW had been consolidated for all of 2014, sales would have been EUR 7.4 million higher and the year-on-year increase in sales would have been 9.1 percent instead of 10.1 percent.
The regional breakdown of sales shows that the percentage of sales attributable to the three large regions, Europe (including Israel), Asia, and the USA, was unchanged compared with 2014. Asia, the largest region, accounted for 67 percent of sales, as it had in the previous year, followed by Europe with 19 percent (2014: also 19 percent). In the USA, we generated 14 percent of sales.
Business at Siltronic is subject to a certain degree of seasonality and is usually characterized by a weak first quarter, stronger second and third quarters, and then a weaker fourth quarter. In 2015, however, the first quarter was relatively strong with sales of EUR 238.7 million followed by a very good second quarter with sales of EUR 246.7 million. We did not quite reach this high level in the third quarter, when sales amounted to EUR 230.6 million. As well as scaling back their inventories, many of our customers displayed greater reticence in their ordering behavior due to growing uncertainty about what would happen in the eco-nomy, particularly in China. In addition, the familiar seasonal weakness was evident in the fourth quarter of 2015 with sales of EUR 215.3 million.
Manufacturing costs at prior-year levelManufacturing costs, at EUR 768.4 million, were on a par the prior year despite an increase in production volume (2014: EUR 769.4 million).
Gross margin higher than in 2014The pronounced increase in sales had a positive influence on gross profit and gross margin. Our gross profit for 2015 came to EUR 162.9 million (2014: EUR 76.6 million), an improvement of EUR 86.3 million or 113 percent. The gross margin advanced from 9.1 percent in 2014 to 17.5 percent in 2015.
The sharp rise in gross profit and gross margin compared with 2014 was attributable, on the one hand, to the weakness of the euro because manufacturing costs are predominantly incurred in EUR and, on the other hand, to the decrease in depreciation, amortization, and impairment and to improved capacity utilization in our factories combined with disciplined cost-cutting measures.
Sales by regionin %
67Asia
19Europe
14USA
Financial position and financial performance
46 ANNUAL REPORT 2015
Group management report • Financial position and financial performance

The fact that SSW was consolidated for nearly one month less in the prior year had virtually no effect on the gross profit or gross margin.
Selling expenses, R&D costs, and general administrative expenses rising slower than salesThe total of marketing and sales expenses, research & develop-ment (R&D) costs, and general administrative expenses increased
year-on-year due to the appreciation of the Singapore dollar and the US dollar against the euro. As SSW was consolidated for almost a month longer in 2015 than in 2014, the total was roughly EUR 1 million higher than in the previous year. Selling expenses, R&D costs, and administrative expenses fell as a per-centage of sales to 12.6 percent (2014: 13.1 percent) due to the growth in sales.
Marketing and sales expenses, R&D costs and general administrative expenses
EUR mn 2015 2014
Change
Amount in %
Selling expenses 34.9 30.5 4.4 14
R&D costs 64.4 64.3 0.1 0
General administrative expenses 18.5 16.0 2.5 16
Total 117.8 110.8 7.0 6
As a percentage of sales 12.6 13.1
Other operating income and expense dominated by currency hedges Other operating income and expense deteriorated significantly in 2015, with a net expense of EUR 42.4 million compared to net income of EUR 20.6 million in 2014. These line items were severely affected by exchange rate gains and losses, particularly in connection with foreign currency hedging. The currency hedges related almost exclusively to the US dollar. In 2014, the acquisition of a controlling interest in SSW of EUR 21.1 million also had a significant positive influence on other operating income and expense.
In 2015 exchange rate effects resulted in an expense of EUR 45.7 million under other operating income / expense. In 2014, by comparison, there had been a gain of EUR 7.3 million. The year-on-year difference in exchange rate effects therefore resulted in a negative impact of EUR 53.0 million on other oper-ating income and expense. As of December 31, 2015, unrealized losses from hedges of only EUR 13.2 million remained in equity. Impairment losses recognized on property, plant and equipment came to EUR 8.9 million in 2014, whereas no impairment losses were recognized in 2015.
Other operating income and expense
EUR mn 2015 2014
Change
Amount in %
Other operating income 88.9 82.4 6.5 8
Other operating expense – 131.3 – 61.8 –69.5 112
Other operating income and expense, net – 42.4 20.6 –63.0 – 306
of which first-time consolidation of SSW – 21.1 – 21.1
of which exchange rate effects – 45.7 7.3 – 53.0
of which impairment losses recognized on property, plant and equipment – – 8.9 8.9
Financial position and financial performance
ANNUAL REPORT 2015
Group management report • Financial position and financial performance
47

SSW no longer accounted for using the equity methodUntil January 24, 2014, SSW had been accounted for using the equity method. Based on an agreement dated January 24, 2014, Siltronic increased its share in SSW from 50 percent to 78 percent and fully consolidated the company from that date. SSW was thus accounted for using the equity method for the last time in January 2014, with a negative contribution of EUR 3.5 million.
Drop in EBITDA due to currency hedgesEBITDA amounted to EUR 124.0 million in the year under review and was thus down by EUR 8.1 million compared with the prior year (2014: EUR 132.1 million).
Taking into account the positive non-recurring item in 2014 in connection with the step acquisition of SSW, EBITDA in 2015 was EUR 6.3 million higher than in the prior year. Excluding the negative exchange rate effects of EUR 45.7 million included in other operating income and expense, EBITDA would have been EUR 169.7 million.
The EBITDA margin for the reporting year was 13.3 percent (2014: 15.6 percent). Excluding the negative exchange rate effects, the EBITDA margin would have been 18.2 percent.
If SSW had been consolidated from January 1, 2014, adjusted EBITDA for 2014 would have been EUR 117.7 million and the adjusted EBITDA margin would have been 13.8 percent. This is lower than the reported figure due to the positive non-recurring item resulting from the step acquisition of SSW and due to SSW being consolidated for almost a month longer.
In 2015 the EBIT figure of EUR 2.7 million was EUR 19.8 million higher than in the previous year, an increase of 116 percent. Gross profit improved by EUR 86.3 million, however. The differ-ence of EUR 66.5 million between the improvement in gross profit and that in EBIT was attributable to effects in other oper-ating income and expense. Firstly, the exchange rate effects recognized under these line items had a negative impact of EUR 53.0 million and, secondly, the prior year included a non- recurring gain from the prior year of EUR 21.1 million resulting from the acquisition of a controlling interest in SSW.
There was a positive effect, however, from the fact that other operating expense in 2014 had included impairment losses of EUR 8.9 million recognized on property, plant and equipment, whereas no impairment losses were recognized in 2015.
Adjusted for the acquisition of SSW, the EBIT figure in 2014 would have been EUR – 31.6 million.
Changes in EBITDA
EUR mn 2015 2014
Change
Amount in %
EBIT 2.7 – 17.1 19.8 116
EBIT margin in % 0.3 – 2.0
Depreciation, amortization and impairment less reversals thereof 121.3 149.2 – 27.9 –19
EBITDA 124.0 132.1 – 8.1 – 6
EBITDA margin in % 13.3 15.6
EBITDA and EBITDA margin EUR mn
150
100
50
0
2014* 2015
124.0117.7
13.3 %13.8 %
* Adjusted for the acquisition of SSW
48 ANNUAL REPORT 2015
Group management report • Financial position and financial performance
Sharp rise in ROCEROCE for 2015 is based on EBIT of EUR 2.7 million (2014: EUR – 17.1 million). In 2015 capital employed fell by EUR 49.5 million to reach EUR 743.6 million (2014: 795.1 million), primarily because of the reduction in non-current assets. The dominant factor in the improvement in ROCE, which advanced from minus 2.1 percent to positive 0.4 percent, was the improvement in EBIT.
Financial result affected by discounting of pensionsIn 2015, our financial result came to EUR – 12.2 million (2014: EUR – 7.7 million). It should be remembered that this line item is dominated by the expense for discounting of pensions, which is included in other net finance costs. This expense was EUR 8.2 million in 2015. (2014: EUR 7.5 million).
The extremely low level of interest rates meant that we gene-rated barely any interest income in 2015 despite a high average level of net financial assets.
Income taxesIncome taxes amounted to EUR 10.6 million in 2015. Income tax expenses resulted from current taxes in the USA for Siltronic Corp. and in Singapore for Siltronic Singapore Pte. Ltd. No sig-nificant income from deferred tax assets was generated in the period under review.
Following the termination of the profit and loss transfer agree-ment with effect from January 1, 2015, Siltronic AG no longer forms a fiscal unity with Wacker Chemie AG for tax purposes.
Net result for the period improvedOur net result for the period improved by 26 percent, from EUR – 27.0 million in 2014 to EUR – 20.1 million in 2015.
Earnings per share improves to EUR – 0.50Earnings per share came to EUR – 0.50, an improvement of 22 percent compared with the earnings per share of EUR – 0.64 in the previous year.
Assets and liabilities
The total assets of Siltronic AG had decreased slightly from EUR 1,070.5 million as of the end of 2014 to EUR 1,040.8 million as of December 31, 2015.
Non-current assets downNon-current assets amounted to EUR 579.1 million as of the end of 2015 and thus made up approximately 56 percent of total assets. They were 5 percent lower than at the end of the previ-ous year (December 31, 2014: EUR 609 million).
This was primarily due to a fall in property, plant and equipment because of depreciation of EUR 118.2 million (December 31, 2014: EUR 137.6 million). Capital expenditure (additions to prop-erty, plant and equipment and to non-current intangible assets) totaled EUR 75.0 million (December 31, 2014: EUR 40.7 million) and mainly related to machinery and equipment.
Capital expenditure mainly serves to meet the needs of our cus-tomers, who demand increasingly challenging technical specifi-cations. We also invested in machinery and equipment to increase production yields.
As of December 31, 2015, one of the main components of other non-current assets was the goodwill resulting from the step acquisition of SSW (EUR 20.5 million). This is not amortized. Another significant asset recognized under this line item is the customer base, which was allocated a value of EUR 6.7 million when the controlling interest was acquired and is amortized using the straight-line method. Furthermore, deferred taxes are recorded with an amount of EUR 6.2 million.
Current assets largely hold steadyCurrent assets stood at EUR 461.7 million as of December 31, 2015, on a par with the level of a year earlier (December 31, 2014: EUR 461.5 million). They thus accounted for roughly 44 percent of total assets.
Other current assets included fixed-term deposits amounting to EUR 40.0 million as of December 31, 2015, whereas Siltronic had not held any fixed-term deposits as of December 31, 2014. Thanks to the issuance proceeds from the IPO and the positive free cash flow, a portion of the cash and cash equivalents remain-ing after repayment of financial liabilities to Wacker Chemie AG was invested in fixed-term deposits.
ANNUAL REPORT 2015
Group management report • Financial position and financial performance
49

Substantial reduction in working capitalWorking capital (inventories and trade receivables minus trade payables) declined from EUR 193.7 million to EUR 171.0 million. Of the total decrease of EUR 22.7 million, EUR 10.7 million was attributable to lower trade receivables and EUR 16.3 million to higher trade payables.
The decrease in trade receivables resulted from customers paying their invoices somewhat earlier than usual. This more than made up for the exchange-rate-related increase caused by the US dollar being around 10 percent stronger relative to the euro at the end of 2015 than it had been at the end of 2014.
The rise in trade payables was connected to investing activities, which were increased at the end of the year and for which there were invoices that were not yet due.
IPO the main factor in the significant strengthening of equityEquity stood at EUR 497.3 million as of December 31, 2015 (December 31, 2014: EUR 311.8 million). This produced an equity ratio of 47.8 percent, compared with 29.1 percent as of December 31, 2014.
The subscribed capital and the capital reserves increased by EUR 143.2 million as a result of the IPO. This amount comprised the capital increase of EUR 150.0 million, which was executed in the course of the IPO, less the issuance costs. The capital increase resulted from the issuance of 5,000,000 new shares at EUR 30.00 each. The issuance costs directly attributable to the IPO of EUR 6.8 million were recognized directly in equity, where they were offset against capital reserves.
In addition, higher discount rates used in the calculation of pro-visions for pensions also had a positive impact on equity, raising it by EUR 47.4 million.
Decline in non-current liabilitiesNon-current liabilities amounted to EUR 396.0 million as of December 31, 2015 and thus made up approximately 38 per-cent of total equity and liabilities. The decrease of 10.2 percent compared with December 31, 2014 (EUR 441.2 million) was primarily due to the lower level of provisions for pensions in the amount of EUR 28.7 million.
This was mainly caused by an increase in the discount rate in Germany. The provisions were discounted at 2.75 percent at the end of December 2015, whereas the discount rate at the end of December 2014 had been 2.3 percent. In response to the discount rate effect, provisions for pensions were therefore EUR 47.4 million lower than at December 31, 2014.
Roughly half of the other non-current liabilities were accounted for by non-current personnel-related obligations, e.g. provisions for early retirement and anniversary, plus advance payments received. The year-on-year decrease was due, in particular, to the incremental reduction of advance payments received.
The non-current financial liabilities of EUR 38.6 million relate to a loan from Samsung to SSW.
Current liabilities halvedAs of December 31, 2015, current liabilities had fallen by EUR 170.0 million or 54 percent to EUR 147.6 million (Decem-ber 31, 2014: EUR 317.5 million) and thus made up around 14 percent of total equity and liabilities.
The proceeds from the IPO were, among other purposes, used to repay the current financial liabilities almost in full.
Other current liabilities related to current personnel liabilities, particularly vacation, overtime, and performance-related pay, negative fair values of currency derivatives, and advance pay-ments received. The negative fair values of currency derivatives stood at EUR 19.0 million as of the reporting date. Positive fair values of EUR 9.9 million are recognized under assets.
Unrecognized intangible assetsWe believe that our customers’ confidence in the quality of existing products and in Siltronic’s ability to adapt existing products to customers’ steadily increasing technical require-ments is a key influencing factor in the success of our business. Our global sales network, which maintains long-standing rela-tionships with customers, is instrumental in helping us to identify customers’ future technical requirements early on and to evalu-ate them correctly.
We also consider the knowledge that we have built up in research and development (R&D) over many years to be one of our competitive advantages.
50 ANNUAL REPORT 2015
Group management report • Financial position and financial performance

Positive free cash flowSiltronic’s management team use free cash flow as an internal performance indicator for operating activities. Our high expec-tations for free cash flow were fulfilled and, at EUR 37.4 million, free cash flow was distinctly positive in 2015. Thus we were able to finance our capital expenditure on property, plant and equip-ment and on non-current intangible assets from the cash flow generated from our operating activities, both in 2015 and in 2014.
Cash flow from operating activities influenced in 2014 by advance payments receivedOur operating activities provided net cash of EUR 96.1 million in 2015, compared with EUR 124.7 million in 2014. This reduc-tion was mainly due to the prior-year figure including advance payments of EUR 53.2 million, whereas there were no inflows from advance payments in 2015.
Increase in cash flow from investing activitiesFor 2015, we show net cash used for investing activities of EUR 98.7 million (2014: EUR 11.2 million). There were two main factors in this rise in 2015. Firstly, there were increased cash payments for capital expenditure in the technology required to meet the increasingly complex specifications of our customers. Secondly, we invested in fixed-term deposits to the value of EUR 40.0 million in 2015 (which resulted in a corresponding increase in our cash flow from investing activities). They will mature in March 2016. In 2014 the net cash used for capital expenditure was affected by the cash and cash equivalents acquired in con-nection with the first-time consolidation of SSW.
Cash flow from financing activities influenced by the IPOIn 2015, cash flow from financing activities amounted to a net cash outflow of EUR 32.2 million compared with a net cash inflow of EUR 58.6 million in 2014. This cash flow had still been influenced by financing activities in connection with Wacker Chemie AG in 2014. In the reporting year, the main factors affecting it were the proceeds from the IPO and the countervail-ing repayment of loans to Wacker Chemie AG.
Structure of assets and equity and liabilities EUR mn
2014
312497609 579
441396274 307
317148187 155
EquityNon-current assets
Non-current liabilities
Current assets
Current liabilities
Cash and cash equivalents
2015 2015 2014
1,070 1,041
Assets
1,041
Equity and liabilities
1,070
ANNUAL REPORT 2015
Group management report • Financial position and financial performance
51

Financial management
Principles and objectives
The aim of financial management at Siltronic is to optimize cash flows and ensure that currency effects are hedged in accordance with our policy. Derivatives are used exclusively to hedge cash inflows and outflows resulting from receivables and liabilities. As of December 31, 2015, 48 percent of assets were financed from equity and 52 percent from liabilities.
As the Group’s parent company, Siltronic AG is significantly involved in the financing of its subsidiaries. Financing is managed from the perspective of the Group.
Financing instruments not reported on the statement of financial positionSiltronic’s use of sources of financing that are not reported on the statement of financial position is negligible (e.g. non-re-course factoring).
Net financial assets of EUR 155.9 millionBecause of the IPO and the positive free cash flow generated in 2015, Siltronic had net financial assets of EUR 155.9 million as of December 31, 2015 (December 31, 2014: net financial debt of EUR 24.5 million).
The financial liabilities are non-current liabilities.
Net financial assets
EUR mnDecember 31,
2015December 31,
2014 Change
Financial liabilities – 38.6 – 211.9 173.3
Cash and cash equivalents 154.5 187.4 – 32.9
Fixed-term deposits 40.0 – 40.0
Net financial assets (+) / net financial debt (–) 155.9 – 24.5 180.4
Liquidity management
Our aim is to pool group companies’ surplus liquidity and, ensuring solvency at all times, to optimally allocate this money within the Group or invest it externally. For this purpose, we use a treasury management system that provides us with an over-view of each subsidiary’s cash status at all times.
Summary of financial position
In 2015, we continued to improve our financial position due to the IPO and a consistently strong free cash flow. We increased our equity ratio to 47.8 percent as of December 31, 2015. Our current financing provides solid foundations for our medium-term growth strategy.
Limitation of financial risk
We reduce our financial risk by pursuing a hedging strategy in which we use forward transactions and options to limit Siltronic’s currency risk. The hedging costs are recognized in accordance with the IFRS rules on hedge accounting.
The core components of our policy for limiting financial risk are the clear definition of process responsibility, multi-level approval processes, and risk assessments.
Analysis of capital expenditure
We mainly invest cash flow from operating activities in existing factories in order to automate and optimize production and to increase yields.
In 2015, our largest items of capital expenditure were new building for pulling machines at our factory in Freiberg and new crystal pullers in Singapore.
52 ANNUAL REPORT 2015
Group management report • Financial position and financial performance
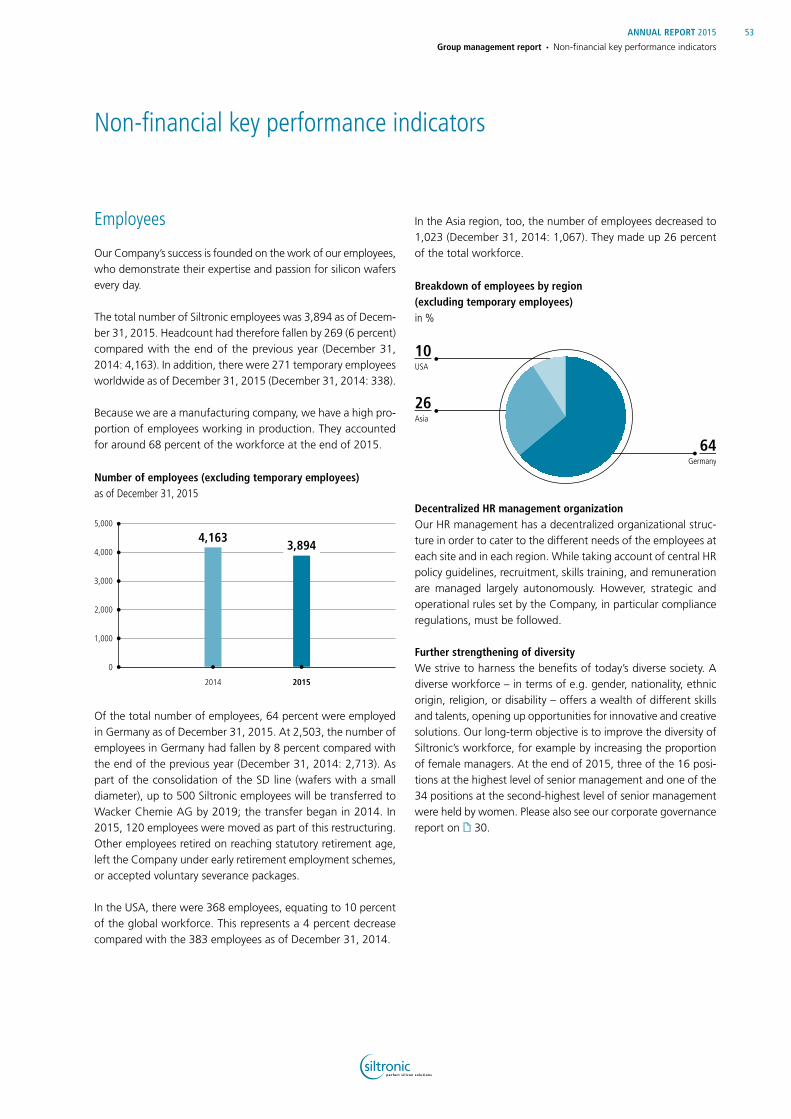
Employees
Our Company’s success is founded on the work of our employees, who demonstrate their expertise and passion for silicon wafers every day.
The total number of Siltronic employees was 3,894 as of Decem-ber 31, 2015. Headcount had therefore fallen by 269 (6 percent) compared with the end of the previous year (December 31, 2014: 4,163). In addition, there were 271 temporary employees worldwide as of December 31, 2015 (December 31, 2014: 338).
Because we are a manufacturing company, we have a high pro-portion of employees working in production. They accounted for around 68 percent of the workforce at the end of 2015.
Of the total number of employees, 64 percent were employed in Germany as of December 31, 2015. At 2,503, the number of employees in Germany had fallen by 8 percent compared with the end of the previous year (December 31, 2014: 2,713). As part of the consolidation of the SD line (wafers with a small diameter), up to 500 Siltronic employees will be transferred to Wacker Chemie AG by 2019; the transfer began in 2014. In 2015, 120 employees were moved as part of this restructuring. Other employees retired on reaching statutory retirement age, left the Company under early retirement employment schemes, or accepted voluntary severance packages.
In the USA, there were 368 employees, equating to 10 percent of the global workforce. This represents a 4 percent decrease compared with the 383 employees as of December 31, 2014.
In the Asia region, too, the number of employees decreased to 1,023 (December 31, 2014: 1,067). They made up 26 percent of the total workforce.
Decentralized HR management organizationOur HR management has a decentralized organizational struc-ture in order to cater to the different needs of the employees at each site and in each region. While taking account of central HR policy guidelines, recruitment, skills training, and remuneration are managed largely autonomously. However, strategic and operational rules set by the Company, in particular compliance regulations, must be followed.
Further strengthening of diversityWe strive to harness the benefits of today’s diverse society. A diverse workforce – in terms of e.g. gender, nationality, ethnic origin, religion, or disability – offers a wealth of different skills and talents, opening up opportunities for innovative and creative solutions. Our long-term objective is to improve the diversity of Siltronic’s workforce, for example by increasing the proportion of female managers. At the end of 2015, three of the 16 posi-tions at the highest level of senior management and one of the 34 positions at the second-highest level of senior management were held by women. Please also see our corporate governance report on 30.
Non-financial key performance indicators
Number of employees (excluding temporary employees) as of December 31, 2015
5,000
4,000
3,000
2,000
1,000
0
2014 2015
3,8944,163
Breakdown of employees by region (excluding temporary employees)in %
10USA
26Asia
64Germany
ANNUAL REPORT 2015
Group management report • Non-financial key performance indicators
53

We reward our workforce’s performance Our employees develop innovations, successfully implement strategies, and give the Company an unmistakable identity. A shared vision and corporate values that are actively fostered provide a sense of unity and offer guidance for our day-to-day work and conduct. We use variable remuneration systems to encourage our employees’ interest in the success of the Group and its performance. We review remuneration by means of reg-ular benchmark studies. This ensures that we offer our employ-ees salaries that reflect their performance and responsibilities and that are commensurate with market rates.
In addition to their fixed base salary, including paid vacation and a Christmas bonus, employees usually also receive variable remu-neration. This benefit is offered to employees irrespective of whether their pay is collectively or non-collectively negotiated. It consists of a profit-sharing scheme and a remuneration com-ponent linked to personal performance. Collective pay agree-ments reached with the German Mining, Chemical and Energy Industrial Union (IG BCE) as well as company-specific collective pay agreements are in place at our German sites. There have not been any strikes or other industrial action at our sites in recent years. IG BCE and employers in the chemical industry signed collective pay agreements with a 17-month term in 2015. Col-lectively agreed pay went up by 2.8 percent. Employees whose salaries are not collectively agreed received a pay rise of 2.5 per-cent in the reporting year.
The company pension is an important part of remuneration and is offered at most sites in Germany and abroad. There are excep-tions where the statutory pension appears sufficient or where there is no adequate legal framework. In Germany, we offer employees a company pension plan through the pension fund of Wacker Chemie VVaG.
Low staff turnover shows employee satisfactionOur employees are highly motivated and demonstrate extraor-dinary dedication to the Company and its success. This can be seen from the small number of employees who choose to leave the Company. In 2015, the rate in Germany was below 1 percent. The rate worldwide was around 8 percent, which is partly due to the higher staff turnover in Asia that is not unusual for that region.
We conducted an employee survey in Germany during 2015 as a way of actively managing change processes. Employees were asked to give their opinion on their daily work and thus to trigger important change processes. The response rate of almost 60 per-cent shows that the workforce is interested in moving Siltronic AG forward. The results were shared with all managers and employees. The departments are now working together on measures for improvements.
High priority given to employee developmentWe launched a talent management process back in 2013 in order to safeguard our long-term success. During the annual talent management cycle, all senior managers and employees whose salaries are not collectively agreed are assessed on the basis of standardized criteria during departmental and then interdepartmental meetings. This provides the basis for the annual staff appraisal interviews, in which employees and their line managers decide on development activities. Our aim in tak-ing this approach is to be able to fill vacancies for high-level positions internally in the medium and long term.
We attach high priority not only to executive development but also to the development of our skilled technical staff and all employees. Employees discuss development activities with their line managers during staff appraisal interviews at least once a year. In 2015, our employees in Germany, at all levels, completed around 14,000 e-learning courses (2014: around 18,000); around 1,900 participants attended seminars, continuing pro-fessional development activities, and conferences or received individual tuition (2014: 1,500).
Graduate program for encouraging the next generation of scientistsIn 2015, we launched our second graduate program. Our aim is to attract talented science graduates to our Company and give them the opportunity to train for a future managerial role. Besides on-the-job training, the program includes seminars on manage-ment topics, communications skills, and teamwork. Participants are supervised by a mentor during the 18-month program.
54 ANNUAL REPORT 2015
Group management report • Non-financial key performance indicators

Health management organization offers employees a range of benefitsTo help us remain innovative and competitive, our employees can access a variety of services through Wacker Chemie’s health management organization. We want to prevent back problems and cardiovascular disease among our employees, strengthen their mental resilience, offer work that is appropriate to their age, and find suitable jobs for employees with health problems.
To this end, the health service has offered check-ups for middle managers aged 45 or older at all German sites since 2012. Besides organ screening, advice on dealing with psychological stress is also available.
Since 2013, Siltronic employees have been taking part in the Fit for your Shift project, which is run in cooperation with the south-ern branch of the German statutory pension insurance scheme. This health program designed especially for shift workers shows participants how they can cope better in the long term with the stresses caused by shift work.
Research and development
Innovation is key to successThe main driving forces in the semiconductor industry are min-iaturization, cost savings, and efficiency increases. The capability of semiconductor components, which follow Moore’s law,
doubles approximately every two years. This is expressed in greater processing power and memory capacity and in lower specific electricity consumption, for example. To achieve these goals, our customers demand the highest possible technological expertise as well as speed in the further development of silicon wafers, which are the most important basic material for the semicon-ductor industry.
Intensive development activities are thus essential if we are to continue offering our customers the added value that they need. Worldwide, we employ more than 400 engineers in the areas of process engineering and systems engineering. They are based at all of our sites. The Burghausen site is Siltronic’s main develop-ment center. Tasks range from product quality assurance and the testing and assessment of new techniques and equipment modifications to continuous improvements, line integration, and the successful certification of wafers for our customers’ latest technologies.
Intellectual property including around 1,700 registered patents and patent applications in around 300 patent families underpins our great innovative strength and secures our leading techno-logical position in the global market.
Research and development (R&D) expenditure totaled EUR 64.4 million in 2015 (2014: EUR 64.3 million). Grants and sub-sidies for R&D were not significant in either 2014 or 2015.
Key figures for R&D
2015 2014 2013 2012
R&D expenditure (EUR mn) 64.4 64.3 58.8 66.8
R&D expenditure as a percentage of sales 6.9 7.6 7.9 7.8
R&D grants and subsidies received (EUR mn) 0.6 0.8 1.6 1.6
Siltronic Inventor AwardWith its Inventor Award, Siltronic regularly honors employees who have come up with technological innovations. In 2015, the prize in the ‘most important invention’ category was awarded for a project to improve the monitoring of defects during crystal growing.
Strategic collaboration with customers and research institutionsMany of our projects require us to work closely with our cus-tomers on an ongoing basis. We also collaborate with research institutions and universities.
ANNUAL REPORT 2015
Group management report • Non-financial key performance indicators
55

Design rules on silicon wafers are a key parameter for increasing capability. They determine how many transistors per square cen-timeter can be accommodated on one component. The common design rules in the semiconductor industry, which are driven by the ‘more Moore’ principle, are currently in the range of 14 to 20 nanometers (nm). This will shrink to around 10nm in the coming years. In the ‘more Moore’ domain, we are currently developing techniques for manufacturing 300mm wafers that will be used for these design rules. The market launch is likely to be in 2016. However, we do not expect larger volumes and thus mass production until 2017.
One of the ‘More than Moore’ projects is the development of alternative materials for use in mobile devices, power electronics, and optoelectronics. These are suitable for controlling power output in the mid-voltage range, e.g. automotive applications at high temperatures, chargers for mobile devices, and high-fre-quency applications.
Production and supply chain management
Production
Our production plants are strategically located close to our cus-tomers and provide us with good access to highly skilled workers.
We make silicon crystals using the Czochralski process and turn them into polished wafers. An additional coating known as an epitaxy is added to some of the production volumes.
Siltronic also makes wafers from crystals produced using the float zone technology. These wafers, which are mainly used in power electronics, come with a range of surface properties and have diameters of up to 200mm.
We use standardized processes and largely identical machinery to ensure knowledge can be transferred between our production sites. This enables us to quickly and easily improve processes and to simplify the process of quality certification by our customers. In addition, we operate our 300mm wafer lines at our German sites in Freiberg and Burghausen as a tightly integrated ‘virtual fab’ with a single cross-site management team.
We optimize our production processes and thus our cost struc-tures on an ongoing basis. This involves using cost roadmaps to organize any major changes to production processes and to the raw and auxiliary materials that we deploy. The program is increasing production capacity in our factories by approximately 2 percent per year and steadily improving staff productivity, with-out the need for any new capital expenditure.
Projects in 2015
Freiberg, Germany New crystal-pulling plant; Automation of the 300mm wafer line
Burghausen, Germany Automation of the 300mm wafer line
Singapore New crystal pullers
Supply Chain Management
Thanks to our fully integrated logistics processes, we offer added value to our customers in the form of rapid reaction times and a high level of delivery reliability. Our electronically supported supply chain ensures every process – from initial contact to manu-facturing to delivery – is transparent and can be monitored.
We are working continuously to reduce delivery times and opti-mize our supply chain in terms of costs, speed, and quality. By reusing and recycling, we try to minimize the impact on the environment, particularly with regard to primary packaging for wafers and secondary packaging used for transportation.
Requirements relating to wafer specifications, volumes, and des-tinations for our exports, both to our customers and to Siltronic sites, are subject to constant changes that we analyze regularly and coordinate with our capacities. Global planning of raw materials, intermediates, finished wafers, and their shipping to customers takes place in real time using customized systems. We thus offer our customers quality and security of supply.
We use extensive e-business solutions to integrate our external partners into our processes so that we can unlock the full poten-tial of these partnerships. One such solution is a collaboration platform (extranet) that enables us to exchange information with individual partners and thus operate lean and integrated admin-istrative processes.
56 ANNUAL REPORT 2015
Group management report • Non-financial key performance indicators

We primarily use the internationally accepted RosettaNet stan-dard for optimum electronic data interchange with our external partners. In some cases, we also rely on third-party service pro-viders, for example to receive or send EDI formats. We have set up rapid B2B connections to many of our customers, one of the benefits being easier invoicing.
Purchasing and supplier management
Specialist teams manage our Company-wide purchasing pro-cesses, such as for the raw materials used in our products, gas and electricity to power our sites around the world, technical materials, and specific services. We aim to optimize our procure-ment costs, delivery times, and supplier quality and to quickly harness additional supply potential. In 2015, we worked con-tinually on competitively extending our supplier base in procure-ment markets worldwide. This included identifying and devel-oping new suppliers in our key product areas and gradually ramping them up to supply for full production. We are thus ensuring that we can obtain materials at internationally com-petitive costs.
Systematic risk observation is an important tool for Siltronic in the proper assessment of supply relationships. This involves using analyses from rating agencies, our own supplier evalua-tions and, increasingly, direct contact with our partners. Our technical procurement team assessed 95 suppliers last year.
At EUR 476 million, the volume of procurement orders in 2015 increased slightly year on year (2014: EUR 466 million). Delivery times were below the prior-year level. Worldwide, Siltronic placed approximately 55,000 purchase orders. In the area of procurement and logistics, 9 percent of our suppliers account for around 90 percent of our procurement volume.
E-procurement is very important to us. We can look at the entire purchasing process, from sending an inquiry to a supplier to paying the invoice. A key metric is the number of purchase orders created automatically. More than 91,000 different pur-chase order items were requested worldwide last year (2014: around 94,000 items). At our German sites, around 35 percent of the total number for 2015 were created automatically.
Variation in material price movementsPrice movements relating to our most important raw materials varied significantly in 2015. Polysilicon prices went down slightly. The base prices for specific input materials either held steady or we were able to agree small reductions.
Security from long-term agreementsWe have secured our supply of polysilicon from Wacker Chemie AG with a long-term supply agreement that runs until 2020. Under this agreement, Wacker will supply a high proportion of the required polysilicon to Siltronic. As part of our multiple sup-plier strategy, we can also use alternative sources of supply. A specific agreement between Wacker and SSW ensures SSW has a stable supply of polysilicon up until 2019.
Suppliers play an important role for SiltronicWe highly value direct contact with suppliers and long-term, constructive working relationships. At the same time, it is impor-tant that we are not dependent on individual suppliers. Our supplier management plays a key role here. Specialist product group teams with different areas of responsibility manage the Company’s purchasing processes. These teams tap into new potential in the market and the latest innovations at existing suppliers and then incorporate this expertise into our processes. We can thus safeguard the quality of our products, productivity, and competitiveness for the long term.
We have more than 3,000 suppliers worldwide.
Our suppliers make a substantial contribution to ensuring that Siltronic can manufacture wafers in the quality required by cus-tomers on the basis of improved processes and a high level of innovation. That is why the theme of the 2015 Siltronic Supplier Day was ‘Together for Success’, highlighting the important role that suppliers have to play. The one-day event, held in Burghausen, Bavaria, was attended by 160 representatives from 100 suppliers. Four suppliers that went the extra mile last year received the 2014 Siltronic Supplier Award in the categories ‘outstanding customer and quality orientation’, ‘excellent proactive joint tech-nology development’, ‘excellent global support and long-term partnership’, and ‘excellence in establishing a new business rela-tionship’.
ANNUAL REPORT 2015
Group management report • Non-financial key performance indicators
57

Sales and marketing
We strive for close and long-term collaboration with our cus-tomers. Overall, we supply customers in around 40 countries. We also run joint development projects with many of our cus-tomers, details of which can be found in the chapter on research and development (R&D) starting on 55. A centralized product management and marketing team is responsible for pricing, opti-mization of the customer mix and product mix, and positioning in the market. This enables us to improve how we plan and manage our production capacities and development activities.
Our own sales staff and application engineers in the five defined sales regions (USA, Europe, Japan, Taiwan, and rest of Asia-Pa-cific) ensure we can serve our customers promptly and locally. We have sales offices in the USA, France, Italy, Germany, South Korea, Japan, China, Taiwan, and Singapore, and we mainly sell our wafers to our customers directly.
Key account teams, composed of employees from sales & mar-keting, application technology, process engineering, quality management, and logistics, maintain close relationships with our key customers. This enables us to respond quickly to chang-ing customer requirements and to manufacture silicon wafers that fulfill these requirements.
The contracts with our customers have different terms, ranging from around three months to more than one year. SSW in Singa-pore has a long-term agreement with Samsung on the purchase of silicon wafers.
We have had close partnerships rooted in trust with many of our customers for many years. This is reflected in the numerous awards that we have received from our customers, including Intel, Fairchild, Samsung, STM, Texas Instruments, and X-FAB.
We continually evaluate market information. The greater trans-parency that this provides enables us to sharpen our focus on our customers and their requirements, deploy our resources optimally, and counter any risks in good time.
Corporate social responsibility (CSR)
We believe one of our core responsibilities is to bring the impact of our business activities into line with the expectations and needs of society. That is why we are guided in our decision making by principles of responsible corporate governance and sustainable business practice.
Sustainability
Siltronic takes sustainability seriously. We want to take economic, environmental, and social factors into account in our actions.
Two voluntary global initiatives form the basis for sustainable corporate governance at Siltronic: the chemical industry’s Responsible Care® initiative and the United Nations Global Compact. By committing to these voluntary undertakings, we go beyond the standards of protection for the environment, employees, and society that are required by law.
An IT system for sustainability reporting (SPIRIT) is used to cap-ture environmental and energy data, incidents with relevance to the environment or safety, and audits as part of the integrated management system (IMS).
Health and safety in the workplace
We invest in workplace health and safety to prevent any dangers to our employees. We therefore manage this area comprehen-sively and systematically.
The occupational health and safety management standard OHSAS 18001 has been adopted as a groupwide standard and is followed at all production facilities. In 2015, the number of industrial accidents involving a loss of working days was 2.1 per million working hours.
58 ANNUAL REPORT 2015
Group management report • Non-financial key performance indicators

The most frequent causes of accidents at work are carelessness during manual activities, tripping, slipping, and falling. We are working continuously to improve workplace safety and are therefore very disciplined in following our safety program, which includes safety inspections, discussions with workers, and emer-gency drills. The aim is to identify and avoid unsafe practices, whether during operation of machinery, handling of chemicals, in the factory, in the office, or on the way to and from work.
Because the accidents in 2015 and the slight increase compared with 2014 were mainly related to behavior, we launched an initiative last year that specifically addresses this issue. We are thus continuing to work toward our goal of a zero-accident workplace.
Our health & safety reporting system ensures groupwide trans-parency at Siltronic. Every relevant industrial accident, plus the corrective action to be taken, is reported to the Executive Board. The total number of industrial accidents per month and the trend over time are monitored using two standardized key per-formance indicators (KPIs). These are included in the monthly reports to the Executive Board.
Healthcare for our employees is also very important to us. Our employees at our headquarters in Munich and the Burghausen site have access to a variety of services aimed at preventing health problems and promoting good health. The Siltronic site in Freiberg can access extensive information online and orga-nizes initiatives and provides information materials on site, as do our sites in other countries.
Energy management system
Siltronic has adopted the strategic energy target, which requires to improve efficiency by 11 percent between 2013 and 2022. Using this target, Siltronic has defined absolute savings targets in MWh for its sites on the basis of the planned level of production output, and has also defined absolute targets for the operational departments based on their individual electricity consumption. From 2013 to 2015, energy consumption per unit of production improved by 15 percent.
Numerous energy efficiency measures helped us to achieve our targets in 2015. Together, they add up to a permanent reduction in energy consumption of 7,600 GWh per year, which equates to EUR 0.4 million. The total energy requirement fell by over 2 percent. However, the average specific annual target savings of 1.5 percent could not be achieved.
We are working continuously to further optimize the efficiency of our production processes and are reducing our energy requirements at the various sites on an ongoing basis by running initiatives aimed at avoiding waste and increasing productivity.
Compliance
Siltronic follows ethical principles of corporate governance that go beyond the statutory requirements. Employees worldwide can send their questions to compliance officers based in Ger-many, the USA, Singapore, Taiwan, and Japan. Compliance issues in countries other than those just mentioned are dealt with by the Group’s compliance officer in Germany.
If employees observe any infringements, they are obliged to notify their line manager, the compliance officer, the works council, or the relevant HR employee. In 2015, the compliance management team consulted with the sites outside Germany to align globally applicable measures with local requirements. Please also see the corporate governance report on 30 – 37.
1.5
Accidents at work 1) Number of accidents per million working hours
4.0
3.0
2.0
1.0
0
2012 2013 2014 2015
2.7
2.1 2.1
1) Loss of one or more working days
ANNUAL REPORT 2015
Group management report • Non-financial key performance indicators
59

Risk strategy and risk policy
Siltronic is exposed to various risks in connection with its busi-ness activities. That is why we believe effective risk management is an important element of corporate governance for us as a global company. It is also part of our wider process of opportu-nity and risk management aimed at unlocking existing and future potential for success. We define risks as internal and external events that have a negative impact on the achievement of our targets and forecasts. Based on the acceptable aggregate risk, the Executive Board decides which risks we will take in order to seize opportunities available to the Company. Our aim is to detect risks as early as possible, assess them appropriately, and take suitable steps to mitigate or avoid them. The Executive Board regularly reviews and updates the risk strategy, which covers all areas of the Company.
Risk management system
From an organizational perspective, the risk management sys-tem is integrated into the existing decentralized organizational and reporting structure. It is complemented by a multi-stage process, whose mandatory procedures and criteria for identify-ing assessing, managing, and reporting risks and for monitoring the system as a whole are defined in a group manual. The risk management system encompasses all fully consolidated entities. The legally independent group companies and the group func-tions oversee day-to-day risk management in their own areas. Each month, the designated risk managers are requested to report to head office with regard to risks at their site or in the group function for which they are responsible. In addition, mate-rial risks and risks to the Company’s survival as a going concern must be reported immediately using an ad-hoc reporting pro-cess. Corporate Auditing & Risk Management, which reports directly to the Executive Board, is responsible for the processes and systems related to the groupwide early-warning system for risk. This head-office department also coordinates the group-wide recording of all material risks, analyzes the overall situation at Group level, and communicates risks. The Executive Board and the Supervisory Board’s Audit Committee are kept informed about the current risk situation in the Group. There is no formal
system for recording opportunities within the risk management process. The Executive Board and other senior managers receive monthly reports from the central Financial Planning & Reporting department on current and expected business performance. The management team then uses this data to discuss, assess, and weigh up the risks and opportunities.
The designated risk managers in our group functions and at the main sites, along with the Group risk manager, regularly exam-ine processes, procedures, and developments for any risks that might exist. Risks are identified and assessed using standardized risk matrices. We assess the relevant risks for probability of occurrence and the degree of impact on our business activities, financial position, financial performance, and cash flow. We use specific terms to describe the probability that the risks that we have identified will occur. This makes it easier to understand our appraisal of the individual risk areas. The terms indicating prob-ability of occurrence correspond to the following percentage ranges:
• Unlikely: less than 25 percent• Possible: 25 percent to 75 percent• Likely: greater than 75 percent.
We also use specific terms to describe what the impact on the Group’s financial position and financial performance would be if the identified risks were to materialize. The terms indicating this impact correspond to the following ranges:
• Low: up to EUR 5 million• Moderate: up to EUR 25 million• High: more than EUR 25 million
Suitable measures are taken to avoid, reduce the probability of, and lessen the possible financial impact of the risks that are recorded each month or on an ad-hoc basis. These risk contain-ment measures and any relevant early warning indicators are regularly updated and documented centrally, as are the identi-fied residual risks.
Opportunity and risk report
60 ANNUAL REPORT 2015
Group management report • Opportunity and risk report

Internal control system in the consolidated accounting process
The internal control system (IKS) comprises checks that serve to control risk and thus ensure that business activities can proceed properly. These checks are integrated into the operating pro-cesses and incorporate adequate separation of functions, veri-fication by a second person, access and approval procedures, and other steps. The internal control system helps us to achieve the objectives of our business policy by ensuring the correct functioning and efficiency of business processes, compliance with laws and regulations, and the protection of our assets.
With regard to the accounting process, our aim with the internal control system is to apply the accounting rules in the Interna-tional Financial Reporting Standards (IFRS) consistently and to comply with other applicable statutory accounting requirements. This prevents misstatements in the consolidated accounts and in external reporting. The control system is designed so that all transactions are consistently and correctly accounted for at the due time and so that reliable data on the Group’s financial posi-tion and financial performance is always available. To this end, we have drawn up one central interpretation of the IFRS stan-dards and an accounting manual, which is supplemented by more detailed information on important individual issues. Orga-nizational responsibility and the processes for accounting-related tasks are specified in internal written procedures. The Group’s Accounting function monitors compliance with reporting obli-gations centrally. Once approved by the local management team, the reporting packages of the individual companies are posted to a centralized consolidation system. This data is auto-matically validated by the system and checked using reports and analyses, thereby ensuring the integrity of the data and adher-ence to the reporting logic. System-based checks are also built into the consolidation process. Finally, we analyze the Group’s statement of profit or loss and statement of financial position in order to identify trends and anomalies. We keep abreast of changes to financial reporting standards and train the employees who work in this area. For particularly complex aspects of accounting, such as pensions, we bring in external specialists. Our financial systems are protected against misuse by suitable authorization concepts, approval concepts, and access restric-tions. We minimize the risk of data loss and of the failure of accounting-relevant IT systems by performing regular system backups and maintenance.
We ensure the effectiveness of the checks by monitoring key performance indicators on an ongoing basis as part of the monthly management reporting. Regular external audits and reviews by the independent auditor also take place for each reporting quarter and at the end of the financial year. Each quarter, the management teams of the subsidiaries confirm that all information relevant to the quarterly and annual financial statements has been reported. Internal Audit, acting on behalf of the Executive Board, audits the processes and, in particular, the internal control systems, in the main areas of the Company. In consultation with the Audit Committee, the Executive Board decides on the topics to be audited, following a risk-oriented approach. If necessary, due to a change in circumstances, these topics can be flexibly amended during the year.
The Supervisory Board is also involved in the control system through the Audit Committee. The main aspects monitored by the Audit Committee are the accounting process, the effective-ness of the control system and risk management system, and the audit of the financial statements. It also reviews the docu-ments pertaining to the separate financial statements of Sil-tronic AG, the consolidated financial statements, and the man-agement reports relating to these financial statements before discussing them with the Executive Board and the auditor. The auditor assesses the early-warning system for risk during the audit of the annual financial statements.
Material risks
The following summary contains our assessment of the proba-bility of occurrence of the material risks and their possible impact on the Group’s financial position, financial performance, cash flow, and reputation. The statements refer to the period covered by the outlook, i.e. the whole of the 2016 financial year. Risks are assessed on the basis of the net principle, which means that the assessment reflects the management and safeguarding mea-sures that we have taken.
ANNUAL REPORT 2015
Group management report • Opportunity and risk report
61

Overall environment
Global economic downturn Our business is heavily dependent on the performance of the global economy. An unexpected slowdown of economic growth, whether globally or in the regions significant to the electronics industry, may mean that our sales do not reach the level we anticipated. Demand for our silicon wafers could decline due to a lack of demand in the market, or we might be forced to lower our prices because of increased competitive pressure. If produc-tion capacity utilization falls, specific manufacturing costs may rise and our earnings would also be adversely affected.
We monitor the economic performance of our main sales mar-kets on an ongoing basis. When economic growth weakens, we make preparations early on in order to flexibly adjust our pro-duction capacities, resources, and inventories in line with cus-tomer demand.
We do not currently see any specific indications that the econo my will perform significantly differently than as described in the outlook. In view of continuing uncertainty caused by the euro-pean sovereign debt crisis, geopolitical situation in the Middle East, and weakened growth prospects, especially in China, it may be the case that the global economy lags behind current expectations in 2016. We therefore assess the probability of occurrence as possible with an high impact on Siltronic’s earnings performance.
External risk Siltronic is a global company with production facilities in Europe, the USA, and Singapore. Possible natural disasters, political crises, and other disruptions in individual countries or regions in which we operate pose a potential risk for our business and production processes, unit sales of our products, our non-current assets, and thus our financial position and financial performance.
If we were no longer able to manufacture the quantities planned at particular sites or to ship our finished products, manufactur-ing could be transferred to other sites, although this would cause delays and additional costs. Most of our customers have certified more than one of our sites. We have drawn up plans
and measures for minimizing the impact of external events on the health of our employees and on our business processes. The financial impact of damage to our production facilities caused by natural disasters is partly covered by insurance.
We believe it is unlikely that Siltronic could be severely affected by risks resulting from pandemics, natural disasters, political unrest, or similar. Our production facilities are located in rela-tively stable and safe regions. Our contingency plans and the global distribution of our production facilities help to mitigate the impact of local and regional incidents on our business pro-cesses. We therefore assume that, even if such incidents were to occur, the impact on the Siltronic Group’s earnings would be moderate.
Industry and market risks
Fierce competition, demand controlled by customers, threat of substitute products, cyclicality of the wafer market The wafer industry is characterized by phases of imbalance between supply and demand resulting from excess production capacities. Such phases regularly have an effect on prices. Fore-casts for unit sales and prices are subject to great uncertainty owing to frequent fluctuations in demand. We may be forced to reduce our unit sales and prices without being able to make any corresponding reduction in our costs. The average selling prices for silicon wafers have generally fallen steadily in recent years because of oversupply and fierce competition. This trend may continue. Our top ten customers account for about two-thirds of our total sales. There has recently been a marked upturn in consolidation activity in the market. Further consoli-dation among our customers could strengthen their control over demand even more and force us to make further price conces-sions. If key customers were to significantly reduce their orders from us, or even terminate them, this may have a considerable impact on our financial position and financial performance.
62 ANNUAL REPORT 2015
Group management report • Opportunity and risk report

We lower the risks by increasing flexibility in production and by managing costs rigorously. We adjust our capacities to market conditions and are continuously improving the efficiency of man-ufacturing and business processes in order to reduce the cost base.
We assume that unit sales in 2016 will be slightly higher than in 2015, and our planning and forecasts are based on this sce-nario. We believe it is possible that unit sales and prices could deviate substantially from our forecast. If unit sales and prices were significantly worse than our current prediction, this would have a high impact on Siltronic’s earnings.
Adaptation of our production facilities to customer requirements and demand Changes in customer demand and/or to the original assumptions about the market might not be reflected in our capital expendi-ture quickly enough or may lead to poor investments. Increased investment costs lead to greater outflows of funds and, in the future, to higher depreciation charges recognized in profit or loss from operations. Delays to production start-up or capital expenditure projects may mean we are unable to fulfill supply agreements, our sales and earnings may fall, and we could cede market share.
Siltronic takes various steps to counter capital expenditure risk. Capital expenditure projects are only approved on a step-by-step basis. Intensive project planning and control serve to minimize and prevent delays. Capital expenditure risk is also closely linked to changes in customers’ technological requirements. Siltronic counters this risk by closely watching the market and by holding discussions with customers in a systematic manner.
Over the past few years, Siltronic has demonstrated that it can complete capital expenditure projects on schedule, on budget, and in accordance with market conditions. We do not expect that the capital expenditure budget will be exceeded. We cur-rently regard the risk of occurrence as unlikely and the impact as low.
Additional costs from closing production lines or sites Changes to the market and to demand may force us to shut departments, production lines, or sites. This could result in the recognition of impairment losses on non-current assets and clo-sure costs, e.g. severance payments for employees.
We have not yet been able to sell our former production facility in Hikari, Japan. We have written off all carrying amounts for this site and engaged a number of realtors to sell it. There is a risk that we will have to demolish the existing buildings at the Hikari site at our own expense in order to sell the plot of land.
We have signed an agreement with Wacker Chemie AG under which Wacker Chemie AG has to take on up to 500 of Siltronic AG’s employees, including all associated obligations, at the Burg-hausen production facility between 2014 and 2019. In 2014, Wacker Chemie AG received a payment of EUR 39 million from Siltronic AG for this transfer.
The yearly transfer of employees from Siltronic to Wacker Che-mie AG has taken place as planned so far. We have not planned any other reductions.
We remain confident that we will sell our production facility in Japan without demolishing the buildings. The risk of an adverse impact from possible closures or sales of former production facil-ities is, in our view, moderate. We consider the probability of occurrence as unlikely.
Product development risk Two of the main characteristics of the semiconductor industry are constant technological progress and ever greater demands, and these are also true of our manufacturing processes. It is possible that we will be unable to respond quickly enough to these changes. We may gauge future market trends incorrectly or customers may not accept our product developments. Our competitors may launch new generations and specifications of wafers faster, at lower prices, or with better capabilities. An incorrect assessment of future market trends might have an impact on our position in the market and on our earnings situ-ation. If we are late in developing new products or they do not reflect what the market wants, our sales and earnings will be adversely affected.
ANNUAL REPORT 2015
Group management report • Opportunity and risk report
63

We minimize the risks arising from our development work by carrying out certain developments in cooperation with custom-ers. At the same time, we keep a close eye on the market and our competitors, meet with customers and suppliers, and regu-larly attend conferences of significance to our business. Siltronic collaborates with universities and research institutions on its R&D projects in order to incorporate the latest trends into the devel-opment of its technologies and projects. We use systematic project management methods for our development projects. Specific project milestones and clear approval processes help us to detect project risks at an early stage and respond appropri-ately.
Siltronic has long-standing experience in the market and carries out detailed planning that it updates as soon as market trends change. We perceive the risk that we will incorrectly assess market trends or not respond to them appropriately as possible. If they were to nevertheless occur in individual application areas, the impact on our financial performance would likely be moderate.
Procurement market risk
Dependency on individual suppliers Raw materials, energy, other secondary materials, machinery, and spare parts are only available from a limited number of suppliers. Complexity and the general pressure on costs will mean increasingly close cooperation and mutual dependencies. Quality defects, delays and failures on the part of suppliers, and unexpected price rises may have a negative impact on produc-tion, unit sales, and financial performance, and the necessary certification for new suppliers can take a long time.
We select our suppliers carefully in order to contain the risk of supplier failures. Siltronic safeguards against supplier risks by applying a strict certification process for suppliers and identifying second source suppliers. We define systematic procurement strategies for strategic raw materials and resources each year – and on an ad-hoc basis if required – that include an assessment of procurement risk. If procurement risk is considered to be sig-nificant, we implement appropriate countermeasures wherever possible, e.g. long-term supply agreements and the establish-ment of alternative suppliers.
Overall, we perceive the risk of supplier failure in respect of the supply of raw materials, other materials, and spare parts to which Siltronic is currently exposed as possible. We regard the potential impact on the Group’s earnings as moderate.
Dependency on related parties We obtain various services and supplies plus a very important raw material for us, polysilicon, from our majority shareholder Wacker Chemie AG. The services and supplies are mainly engi-neering and supply services at the Burghausen site, as well as general group services such as finance, tax, and IT. If we had to build up capacity for these services ourselves or engage alterna-tive suppliers, it might lead to delays and additional costs. Sup-ply bottlenecks can cause delays in manufacturing and a loss of unit sales.
We have secured the supply services from Wacker Chemie AG on the basis of long-term contracts. Suitable notice periods have been agreed. Polysilicon is by far the most important raw mate-rial, and we obtain it from Wacker Chemie AG under a long-term agreement. To minimize failures in the supply of polysilicon, two production facilities of Wacker Chemie AG and other sup-pliers have been certified. We consider the impact on earnings to be low; the risk of services being terminated is, in our opinion, currently unlikely.
Production risk and product liability risk
Errors can occur during production, storage, and transportation, leading to product defects, personal injury, damage to property, or environmental damage. Our manufacturing process is highly complex and requires state-of-the-art facilities that are continu-ally upgraded in order to meet customers’ high demands in relation to specifications, quality (performance, stability, and continuous improvement), and price. The smallest variances in supplier performance can lead to considerable losses for cus-tomers, along with damages claims, a reduction in orders, and even the termination of customer relationships. In addition, they entail expensive product recalls and recertification processes. The possible resulting harm to our reputation may also adversely affect our future business performance.
We have taken out appropriate insurance for those risks that can be insured. Siltronic places particularly high importance on ensuring high quality standards in order to prevent defects in quality. The Company uses the integrated management system (IMS) along with process control and monitoring systems based
64 ANNUAL REPORT 2015
Group management report • Opportunity and risk report

on the IMS in order to manage its processes. It defines the pro-cesses and responsibilities and takes account of productivity, quality, adherence to customer specifications, safety, environ-mental protection, and health in equal measure. The IMS is founded not only on statutory requirements but also on national and international standards, such as ISO TS 16949 (quality), ISO 14001 (environment), OHSAS 18001 (health), Responsible Care®, and the Global Compact, which go far beyond the standards required by law. We try to ensure the maximum possible safety at our production facilities by conducting extensive maintenance checks, regular inspections, and audits. To guarantee the safety of facilities, we carry out wide-ranging safety and risk assess-ments, from the design stage through to start-up, and identify any necessary improvements. If a damage/loss event occurs, each Siltronic site has emergency response plans in place that govern the cooperation with internal and external emergency services and the authorities. To avoid quality risks, we apply Lean Six Sigma methods for prevention, problem-solving, and continuous im- prove ment in our production processes.
There have been no major incidents of loss or damage in recent years. Although it is fundamentally possible for such incidents to occur in connection with production, storage, or transporta-tion of raw materials, products, and waste, we currently believe that the likelihood of a serious loss/damage event is unlikely. However, if such an event did occur, the impact on the Siltronic Group’s earnings could be moderately significant.
Failure to meet efficiency targets and manufacturing cost targets Our budgets are based on expected savings on manufacturing costs and overheads. For example, we are planning various ini-tiatives with which to reduce our use of raw materials and other materials, process costs, and indirect costs (overheads). We have defined the ongoing cost savings for the next few years as part of a cost-cutting program known as the cost roadmap. There is a risk that we will not be able to achieve these cost savings as planned. Firstly, market prices for raw materials and energy fluc-tuate significantly and, secondly, there is a possibility that the initiatives aimed at optimizing manufacturing costs cannot be implemented as planned.
We have already achieved substantial annual cost savings in recent years and are confident that we will continue to do so in the years to come. The cost saving targets were broken down by organizational unit and individually agreed with them. Prog-ress and the degree of target achievement are regularly evalu-ated in our internal monthly cost report, allowing a speedy response to any indications that targets will not be met. We assess the impact of our cost roadmap not being implemented as planned as low and the probability of occurrence as possible.
Legal and regulatory risk
General legal risk Lengthy legal disputes can have a negative impact on our oper-ations, image, and reputation and involve high costs.
In order to counter potential risks that may arise from the many different tax, competition, patent, anti-trust, trade, employ-ment, contractual regulations and laws, Siltronic bases its deci-sions on extensive investigations and legal advice. As a technol-ogy company, Siltronic is particularly reliant on the protection of its intellectual property and thus pursues a patent strategy that supports this. We contain legal risk with centralized contract management and legal checks conducted by our Legal depart-ment. If required, we call in external legal specialists. Our Intel-lectual Property department protects and monitors patents, trademarks, and licenses. Before starting research and develop-ment projects, we investigate whether existing third-party pat-ents and other rights could hamper us in marketing newly devel-oped products, technologies, and methods. We have compli-ance programs for limiting the risk of violating legal require-ments and laws. Our Code of Conduct defines and sets out standards of behavior that are binding for all employees. We raise awareness of such issues in training courses and try to avoid reputational risk.
ANNUAL REPORT 2015
Group management report • Opportunity and risk report
65

Owing to the diversity of our business activities in all of the main regions of the world, it is always conceivable that legal risk will occur, for example in the form of legal disputes. At present, we do not have any specific indications of such occurrences that could have a significant impact on our business, but we currently consider the probability of occurrence as possible. We have not currently identified any legal disputes, patent infringements, or other legal risks that could significantly influence our business. If such risks were to occur, their impact on the earnings of the Siltronic Group would be moderate.
Risk relating to environmental laws Siltronic is bound by a range of local environmental protection laws and requirements, primarily in relation to the storage, handling, disposal, emission, and registration of hazardous substances. This could expose us to liability for polluting the environment or could increase our manufacturing costs and, consequently, our costs for complying with legal requirements. Changes to environmental laws might generate additional costs at our sites, including those where there is no longer any manu-facturing activity.
Siltronic counters this risk by carrying out extensive maintenance routines and regular inspections of its facilities. Siltronic has stated its responsibility regarding health, safety, and the envi-ronment in its mission statement and has communicated prin-ciples and strategies that are binding worldwide. With regard to loss/damage events, it has developed contingency plans that are regularly reviewed and tested and has taken out appropriate insurance cover.
Siltronic Corp., USA is currently a party to administrative pro-ceedings with the Oregon Department of Environmental Quality in connection with an investigation at a site in Portland and its potential shared responsibility for the contamination of sediment in the Willamette river in Portland. Significant costs for environ-mental investigations and remediation work have so far been covered by our insurers. Based on Siltronic’s many years of expe-rience with this matter and its communications with the parties involved, particularly the Department of Environmental Quality, the insurance companies, and other property owners in the industrial park, the resulting risk is regarded as low. Overall, we consider the probability of occurrence for environmental risk as unlikely and the possible impact on the Siltronic Group’s earnings as moderate.
Regulatory riskUnder the German Renewable Energy Sources Act (EEG), there is a limit on the EEG surcharge to be paid by very energy-inten-sive companies like Siltronic. If we were no longer classified as such because improvements to our energy efficiency meant our electricity use fell below the relevant threshold, we would no longer be able to benefit from the equalization arrangements for energy-intensive companies. Moreover, the next evaluation of the EEG surcharge has been announced for 2017. As future price changes (wholesale prices, network charges, supply mar-ket) depend heavily on how the switch to renewable energy sources is influenced by German and European policy, Siltronic may face increased energy costs.
We are monitoring the regulatory situation. Given that ener-gy-intensive companies that face international competition are largely exempt from the EEG surcharge, we do not expect any significant additional energy costs for our business compared with the previous year. Moreover, we are examining and seizing market opportunities, for example those presented by renew-able energies (industrial load management). We continuously monitor the intensity of our electricity costs and anticipate that we will reach the thresholds for the equalization payments in 2016. We believe the probability of our no longer receiving these payments is unlikely and the impact as moderate.
Security of the IT systems; data security
Our IT-supported manufacturing and business processes are exposed to various information security risks. Disruptions, defects, or delays in IT functions and communication systems would therefore have a considerable adverse impact on our work processes, financial position, financial performance, and reputation.
Siltronic checks its IT constantly and does everything to ensure that the IT-supported manufacturing and business processes can run securely. Our IT security and risk management team has the task of controlling threats in a financially viable manner. The basis is provided by the ISO 27001 standard. Using a risk anal-ysis, we define the requirements for our central systems with regard to the availability, confidentiality, and integrity of data. We have specified these requirements in service level agree-ments (SLAs) with our service providers. We monitor and verify compliance with the SLAs on an ongoing basis. We have taken appropriate precautions in case of emergencies. Our service pro-vider has set up a global security team that takes organizational
66 ANNUAL REPORT 2015
Group management report • Opportunity and risk report

and technical measures and runs awareness programs in order to counter problems with the confidentiality, integrity, and avail-ability of data and systems.
There is a general rise in threats to information security. This is particularly true for IT systems used to support business pro-cesses and communications. Disruptions and attacks on IT sys-tems and networks can never be ruled out completely. We regard their probability of occurrence and the resulting risk as unlikely in view of the preventive measures that we have taken. However, if our IT systems suffered a disruption, failure, or attack on a significant scale or for a prolonged period of time, there would be a moderate impact on the Siltronic Group’s earnings.
HR risk
A lack of committed and qualified specialists and managers can have a negative impact on the Company’s further growth and leading technological position.
We limit HR risk using various HR policies. The two main activi-ties in this area are our talent management process and the associated employee development plans. We also offer a wide range of training and development activities, attractive employee benefits, and performance-based pay. Groupwide succession plans are drawn up for key roles in the Company.
We do not currently see any risk that we will be unable to recruit sufficiently qualified staff. The employee survey that we con-ducted in Germany in 2015 revealed a relatively high level of satisfaction with suggestions for improvement. We believe the overall risk to our personnel requirements is unlikely. If this risk were to materialize, the impact on the Group’s earnings would be low.
Pension risk
In some cases, we are obliged to pay our employees a pension once they retire. The longer life expectancy of beneficiaries, additional obligations resulting from salary and pension increases, and falling discount rates are causing defined benefit liabilities to rise. An increase in defined benefit liabilities, a decrease in plan assets, and possible additions to the pension fund and cover assets will affect the Group’s financial position and financial
performance. The bulk of pension entitlements at Siltronic are covered by the pension fund of Wacker Chemie VVaG in Ger-many and by pension funds in the US. Under IAS 19, actuarial gains and losses and other measurement changes have to be recognized in other comprehensive income immediately and in full. This leads to greater volatility in the level of equity.
The investment portfolio covers a diverse range of asset classes and regions to ensure that the funds earn sufficient interest and to limit investment risk. In order to manage the structure of its assets and liabilities, the pension fund controls and optimizes all of the assets it holds with the aim of achieving the required rate of return while remaining within the specified risk limits. As one of the sponsoring undertakings, Siltronic makes financial con-tributions to the pension fund when required.
Beneficiaries are living for longer and longer, while interest rates in the capital markets have fallen steadily in recent years. In the future, the return on the capital employed is unlikely to be suf-ficient to permanently cover the defined benefit liabilities. That is why Siltronic AG’s contribution for defined benefit pension entitlements was increased in 2014 as part of the pension fund’s steps to protect pensions. A further increase is not planned in 2016. The probability of Siltronic having to make larger pay-ments into the pension fund and higher pension payments for the other entitlements is therefore unlikely. We also regard the impact on the Siltronic Group’s earnings as low. However, the probability going forward of our having to make larger pay-ments into the pension fund is higher. More information can be found on 88 onwards in the notes to the consolidated financial statements.
Financial risk
The financial risk to which our operating activities are exposed includes market risk, credit risk, and liquidity risk. Transactions worldwide involving financial instruments and the manage ment of liquidity are carried out centrally by the Corporate Finance & Insurance department.
ANNUAL REPORT 2015
Group management report • Opportunity and risk report
67

Credit riskOwing to the use of financial instruments and our large credit balances with banks, we are exposed to the risk of default on the part of financial institutions. We contain our counterparty risk by entering into financial instruments and investments only with investment-grade counterparties and by limiting the indi-vidual transaction volumes and terms to maturity. Due to our rules on counterparty risk, we assume that our risk concentration with respect to default by financial institutions is unlikely. How-ever, if, contrary to expectations, credit risk were to arise due to default by financial institutions, the impact on Siltronic’s earnings would probably be low.
Market consolidation in the semiconductor industry is leading to increasing concentration on a few major customers. We use various instruments to reduce the risk of default. Our receivables management team regularly assesses customers’ credit standing. Default risk is contained using defined credit limits, hedging instruments such as bank guarantees, and credit insurance. We strive to make our customer base as diversified, balanced, and solid as possible. As in the previous year, there were no signifi-cant cases of default in 2015. The probability of occurrence of defaults is, in our view, unlikely. We regard the overall risk of default as low.
Market risk/currency risk Although we generate the bulk of our sales in US dollars and Japanese yen, most of our costs are incurred in EUR and Singapore dollars. Exchange rate movements thus affect sales, earnings, liquidity, and the measurement of financial assets/liabilities and financial instruments used to hedge currency risk.
We use financial instruments to address and manage the finan-cial requirements and risks that are a necessary part of our oper-ating activities. Siltronic deploys derivatives to hedge its net currency risk above a certain magnitude. Comprehensive rules on their deployment are laid down in the written procedure on currency management. Derivatives are only used if required for an actual or planned underlying operating activity. Hedging is based both on operating activities that have already been posted and on future cash flows. The declining accuracy of forecasts
into the future is taken into account with graduated hedge ratios. Having production facilities outside the Eurozone also helps us to counter currency risk. Translation risk, i.e. measure-ment risk resulting from the translation of line items in foreign currency on the statement of financial position, is not hedged. Generally accepted measurement methods are used to measure open positions. An overview of the derivatives in existence as of the reporting date can be found in the notes to the financial statements under note 19.
From a current perspective, we consider it possible that exchange rate movements will occur in 2016 that deviate substantially from our planning assumptions. If these exchange rate move-ments materialize, they would likely have a high impact on the Group’s earnings.
Liquidity riskLiquidity risk is managed centrally using rolling liquidity planning and efficient cash management systems. Siltronic counters fund-ing risk by holding liquidity reserves. Cash pooling enables cash and cash equivalents to be reallocated within the Group as required.
Despite higher capital expenditure, Siltronic’s liquidity increased considerably compared with the previous year as a result of the IPO and the increase in cash flow. Net financial assets amounted to EUR 155.9 million as of the reporting date. We regard the risk of occurrence of funding risk and liquidity risk as unlikely. If, contrary to expectations, there were shortages of funding or liquidity, their impact on the Group’s earnings would be low.
Opportunity report
Siltronic can see a variety of opportunities for maintaining its path of successful growth over the next few years. We use var-ious market observation and analysis instruments to identify opportunities at an early stage, for example tools for the con-tinuous structured evaluation of market data, industry data, and competitor data. Close contact with our customers also helps us to assess future opportunities. KPIs (rolling forecasts and reporting of actual figures) enable us to ascertain whether, and to what extent, identified opportunities are fulfilled.
68 ANNUAL REPORT 2015
Group management report • Opportunity and risk report

Strategic opportunities of significant importance – such as adjust-ments to the strategy or possible acquisitions, alliances, and partnerships – are dealt with at Executive Board level as part of the annual strategy development and planning process or, in the case of current matters, during the regular Executive Board meetings. Various scenarios and risk/reward profiles are prepared for these opportunities to provide a basis for decision-making.
Macroeconomic and industry-specific opportunities
Further increase in incomeSiltronic believes the prospects for increasing income remain good. The region on which we are concentrating is Asia. Grow-ing prosperity in Asia and the emerging markets of other regions is pushing up demand for higher-quality products in which semi-conductors are used. The main focus is on automotive and industrial applications as well as smartphones, tablets, and con-sumer electronics. We want to tap into this growth with inno-vative products.
As production capacity utilization increases, there is a chance that prices for wafers will rise or at least fall more slowly than they have in the past. Higher prices would be fully reflected in our financial position and financial performance, which means this opportunity is especially important. More favorable exchange rates have a similar effect to price increases. The EUR/US dollar and EUR/Japanese yen exchange rates are crucial to Siltronic. As a rule, silicon wafers are priced in US dollars. The US dollar has appreciated considerably in recent months. This trend increases the value of our sales denominated in US dollars relative to our euro-denominated expenses.
Contact with all wafer consumers The customers that buy the products in our portfolio include all of the top 20 consumers of silicon wafers for the semiconductor industry. Growth in demand for silicon wafers for the semicon-ductor industry has predominantly been driven by the prevalence of mobile devices, such as smartphones, in recent times. In addi-tion to the increase in the number of mobile devices, new mar-kets and applications in the healthcare, automotive, and indus-trial sectors are expected to lead to rising demand for silicon wafers in the future. Thanks to our broad range of products, we are excellently placed to benefit from these future global trends. Owing to the diversification of our products across a growing number of different applications and industries, we anticipate that the semiconductor market will display fewer sudden cyclical fluctuations in demand in the future and will develop into a more stable market.
Strategic and business-performance opportunities
Sound financial positionOur strong financial situation allows us to respond flexibly and quickly to strategic options that open up as a result of develop-ments in the market and the sector. The main areas of capital expenditure are facilities for manufacturing higher-specification wafers and greater automation. In view of current selling prices, there are no plans for significant expansion investment. We are confident of being able to increase our capacity by improving efficiency and eliminating production bottlenecks.
Consolidation of technology leadershipWe firmly believe that we can successfully unlock the further possibilities and opportunities of our industry because we are continually developing new technological solutions for our cus-tomers. The wafers are used for increasingly small structures, known as design rules, which nowadays are just a few nanome-ters in size. For example, we are currently working with our customers on launching the next design rule, commonly referred to as ‘sub 10nm’. We have also already begun developing the subsequent design rule. This will make it possible to manufac-ture ever more powerful and energy-efficient generations of computer chips. The use of new materials, such as gallium nitride, is also expected to bring us further opportunities for growth.
Continuous improvement to cost structuresSiltronic has various opportunities for improving its cost struc-tures, processes, and productivity. We have identified potential for reducing costs in a number of areas and are already taking steps to harness this potential. These areas include specific costs for auxiliary materials, productivity advances in manufacturing, and the search for new suppliers in order to secure better pur-chasing terms. Capital expenditure on increased automation of production is also helping to improve cost structures. Moreover, we are working on making our sites more flexible so that we are better able to respond to changes in the market.
ANNUAL REPORT 2015
Group management report • Opportunity and risk report
69

The Executive Board’s assessment of overall risk
The Group’s risk profile did not change significantly in the year under review. At the time this report was published, the Execu-tive Board of Siltronic had not identified any individual risks or aggregate risks that could seriously jeopardize the Company’s
ability to continue as a going concern. There continues to be market risk, manifested in overcapacity and falling prices. Despite this risk, we believe Siltronic continues to have good prospects for success in this market over the medium to long term. We are confident that Siltronic’s strategic and financial position is strong enough for us to be able to take advantage of any opportunities that may arise.
Risk assessment for 2016
Risk
Probability of occurrence Financial and economic impact
Unlikely Possible Likely Low Moderate High
Overall environment
Economic downturn • •
External risk • •
Industry and market risk
Competition, demand controlled by customers, threat of substitute products, cyclicality of the wafer market • •
Adaptation of production facilities • •
Additional costs from closures • •
Product development risk • •
Procurement market risk
Dependency on individual companies • •
Dependency on related parties • •
Production risk and product liability risk
Product liability risk and production risk • •
Efficiency targets and manufacturing cost targets • •
Legal and regulatory risk
General legal risk • •
Risk relating to environmental laws • •
Regulatory risk • •
Security of IT systems and data • •
HR risk • •
Pension risk • •
Financial risk
Credit risk • •
Market risk/currency risk • •
Liquidity risk • •
Sources: World Economic Outlook Update, January 19, 2016 IHS Technology, Semiconductor Silicon Demand Forecast Tool, Q1 2016 (January 21, 2016)
70 ANNUAL REPORT 2015
Group management report • Opportunity and risk report

Expected macroeconomic and industry trends
The risks and uncertainties relating to the performance of the global economy going forward are increasing. Global growth is expected to accelerate only slightly. A number of economic experts have lowered their forecasts for 2016 over the past few months. For 2016, growth of 3.4 percent worldwide is anticipated. The previous forecast was 3.6 percent.
The outlook for the eurozone remains at moderate growth of 1.7 percent for 2016.
For Germany, the International Monetary Fund (IMF) is forecast-ing growth of 1.7 percent in 2016, just slightly above the 2015 level. Growth of 2.6 percent is expected for the USA in 2016. The IMF anticipates a moderate upturn in Japan, with growth of 1.0 percent. China’s forecast from the IMF is growth of 6.3 percent.
Market research company IHS Technology anticipates that demand for silicon wafers will rise again, by 3.3 percent, in 2016. However, the growth forecast for the silicon-based semiconductor market has weakened in the past few months. The extent to which price pressure persists in this segment will be the decisive factor. The experts from IHS Technology therefore predict that global sales in the semiconductor market will fall by 0.8 percent in 2016.
Siltronic’s future performance
Siltronic is not planning any significant changes to its corporate objectives or strategy. The focus will remain on increasing our technology leadership, retaining our leading quality position, continuing with our program for operational excellence and cost reductions, and ensuring a high level of profitability and a stable cash flow.
The key financial performance indicators for the Siltronic group remain unchanged from the previous year:
• EBITDA margin• ROCE• Free cash flow
These important KPIs show the following trends:
EBITDA margin will continue to increaseWe expect that our EBITDA margin will slightly rise in 2016. In the medium term, we seek to achieve an EBITDA margin target of 20 percent which we do not expect to achieve in 2016.
The forecast for the EBITDA margin is based on the following assumptions which refer to further financial performance indi-cators:
Sales in 2016 slightly below prior-year levelFrom a current perspective (March 2016), the Executive Board of Siltronic anticipates that wafer area will increase slightly over the year as a whole.
We expect the first quarter of 2016 to be roughly on a par with the fourth quarter of 2015. This is due partly to the usual sea-sonal weakness of the first quarter of the financial year and partly to persistently low unit sales of PCs, tablets, and smart-phones. Demand is likely to slowly pick up in the second quarter, in line with the seasonal pattern.
We believe there will be interesting opportunities, particularly in automotive and industrial applications, and we predict further growth here overall.
For 2016, we expect the rise in wafer area to be in the low single- digit percentage range.
We believe the product mix will be roughly the same as in the previous year, although the proportion of 200mm wafers, which are made from float-zone crystals, is likely to continue to increase.
Prices for some product lines with low production capacity uti-lization had already come under pressure in late 2015. We expect this trend to continue, at least in the first six months of 2016. Where products have high production capacity utilization, we are currently seeing relatively stable prices.
Based on the average exchange rates for 2015 and the above assumptions about the wafer area and the average selling prices, we anticipate that sales for 2016 as a whole will be slightly below the level in 2015.
Outlook
ANNUAL REPORT 2015
Group management report • Outlook
71

Research and development (R&D) spending will remain at roughly 7 percent of salesTo remain innovative and competitive over the long term, we intend to continue investing around 7 percent of sales in R&D.
Further optimization of cost structuresWe want to continue with our long-standing cost-saving pro-gram, and our plan is to continue reviewing and optimizing our main cost structures on an ongoing basis. For 2016, we expect to realize potential savings of around EUR 30 million to EUR 35 million.
Collectively agreed pay rises and inflation are likely to reduce earnings by approximately EUR 15 million.
Much smaller currency lossesCurrency losses, which are recognized under other operating income and expense, will be in the range of around EUR 10 million to EUR 15 million, thus substantially lower than in 2015 (EUR 45.7 million). This is based on the US dollar/euro exchange rate averaging out at USD/EUR 1.10 in 2016.
Positive ROCEFor 2016, we predict ROCE in the mid single-digit percentage range. Our medium-term target for ROCE is approximately 11 percent. However, we are unlikely to achieve this target in the next two financial years. Along with the development of the factors influencing EBITDA, the following assumptions particu-larly have an impact on ROCE development.
Depreciation, amortization, and impairment will fall slightlyWe anticipate that depreciation, amortization, and impairment in 2016 will be only slightly lower than in 2015. For 2018, we predict a sharp fall.
Tax expenseThe tax expense is likely to be unchanged at approximately EUR 10 million.
Financial result will remain unchangedThe interest expense will mainly be attributable to the discount-ing of pensions and is likely to be around EUR 10 million.
No change to capital expenditure on automation and our capabilitiesWe are planning on capital expenditure of around EUR 80 million in 2016, most of which will be spent on state-of-the-art crystal pullers and further automation at our sites. The new crystal pullers will enable us to make further improvements to the crystals’ properties, while increased automation will significantly increase our productivity.
Positive free cash flowWe expect the balance of advance payments received from cus-tomers to decline by approximately EUR 20 million in 2016 with a corresponding adverse impact on cash flow. Despite this effect, we anticipate that free cash flow will be well into positive terri-tory in 2016, but below the 2015 figure.
Slightly positive earnings per shareMost probably, earnings per share will be slightly positive in fiscal year 2016.
The actual development of the Group may deviate positively as well as negatively from our assumptions.
Overall statement by the Executive Board on expected performance
At the time of preparing the 2015 group management report, the Executive Board expected Siltronic to continue operating successfully in the market in 2016, despite the volatile economic environment.
We believe our cost roadmap gives us further opportunities for optimizing costs. Currency losses will also be substantially lower, assuming a US dollar exchange rate of 1.10. Provided our sales fall only just short of the previous year’s level and our EBITDA goes up, we predict a stable EBITDA margin for 2016 that is likely to be higher than the margins in previous years.
Forecast for 2016
EBITDA margin Slight improvement
ROCE In the mid single-digit percentage range
Free cash flow Clearly positive, but below the 2015 figure
Sales Slightly below previous year
R&D Unchanged at approximately 7 percent of sales
Cost structures Potential savings of around EUR 30 mn to EUR 35 mn
Currency losses Substantially lower at around EUR 10 mn to EUR 15 mn
Depreciation, amortization, and impairment Small reduction
Tax expense Roughly EUR 10 mn
Financial result Roughly EUR 10 mn
Earnings per share Presumably slightly positive
Capital expenditure Around EUR 80 mn
72 ANNUAL REPORT 2015
Group management report • Outlook

There were no events of particular significance with an influence on Siltronic’s financial position or financial performance after the reporting date.
Concluding declaration pursuant to section 312 (3) AktG
Pursuant to section 312 (3) of the German Stock Corporation Act (AktG), the Executive Board of Siltronic AG has produced a dependency report concerning all the Company’s relationships with affiliated entities. This report contains the following decla-ration: “We hereby declare that Siltronic AG, for the legal trans-actions and measures listed in the dependency report, received
appropriate consideration in accordance with the circumstances of which we were aware at the time when the legal transactions were concluded or the measures were taken or rejected and that it did not suffer any disadvantages as a result of such measures having been taken or rejected.”
Remuneration report
The following remuneration report forms part of the Group management report and the consolidated financial statements, for which an unqualified opinion has been issued.
Executive Board remuneration system
The full Supervisory Board is responsible for determining the individual remuneration of the members of the Executive Board of Siltronic AG on the basis of preparatory work conducted by the Executive Committee.
The main components of the Executive Board remuneration sys-tem are:
Fixed annual salary
The fixed annual salary is paid in equal monthly installments.
Variable salary (success and performance-related bonus)
The amount of the variable bonus, which is paid annually in retrospect, depends on achievement of the standardized targets set by the Supervisory Board for all members of the Executive
Board. These targets are based on four KPIs. These KPIs and the basis of measurement were amended during the year in con-nection with the IPO.
Arrangements until June 10, 2015
Up to and including June 10, 2015, the bonus was based on the following KPIs:
• EBITDA margin of the Siltronic Group • Net operating cash flow of the Siltronic Group • Business value contribution of the Siltronic Group • Return on capital employed (ROCE) of the Wacker Chemie Group
Historical trends, planning information and competitors’ perfor-mance are used to calculate a specific EBITDA margin target. This KPI is oriented to Siltronic’s long-term performance. Our medium-term goal is an EBITDA margin of 20 percent. The tar-get achievement rate depends on the extent to which the EBITDA margin target is attained.
Events after the reporting date
ANNUAL REPORT 2015
Group management report • Remuneration report
Concluding declaration
Remuneration report
73
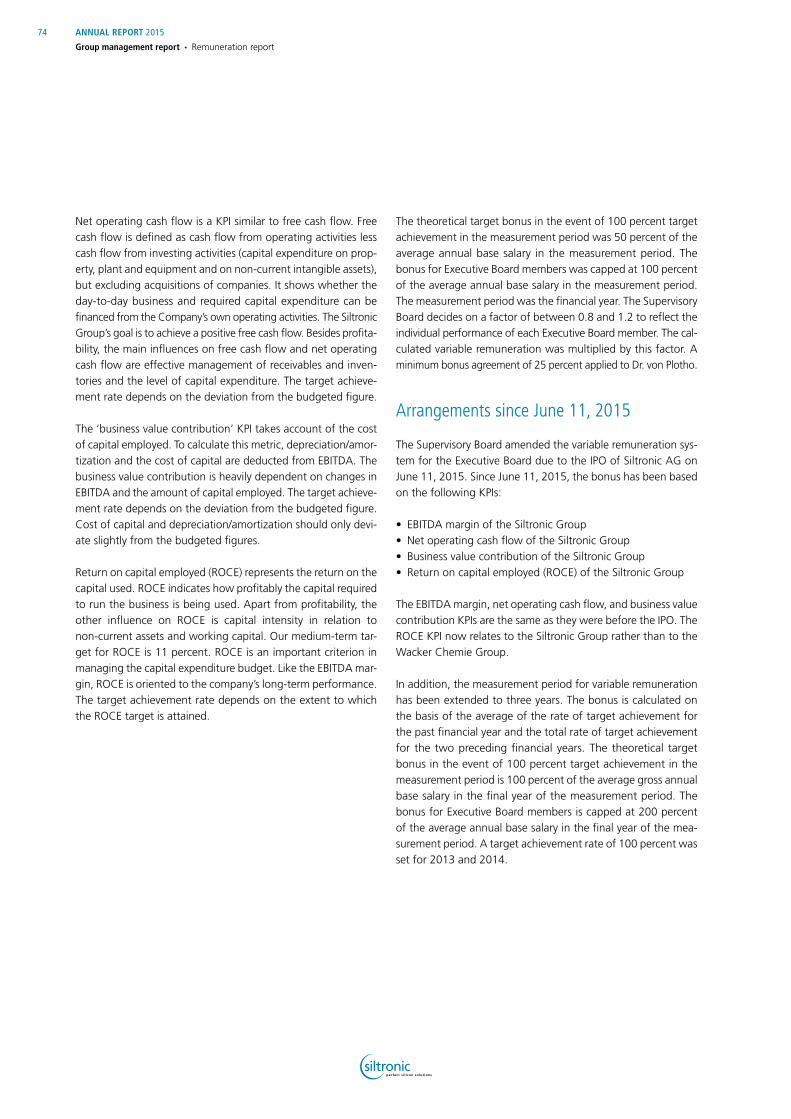
Net operating cash flow is a KPI similar to free cash flow. Free cash flow is defined as cash flow from operating activities less cash flow from investing activities (capital expenditure on prop-erty, plant and equipment and on non-current intangible assets), but excluding acquisitions of companies. It shows whether the day-to-day business and required capital expenditure can be financed from the Company’s own operating activities. The Siltronic Group’s goal is to achieve a positive free cash flow. Besides profita-bility, the main influences on free cash flow and net operating cash flow are effective management of receivables and inven-tories and the level of capital expenditure. The target achieve-ment rate depends on the deviation from the budgeted figure.
The ‘business value contribution’ KPI takes account of the cost of capital employed. To calculate this metric, depreciation/amor-tization and the cost of capital are deducted from EBITDA. The business value contribution is heavily dependent on changes in EBITDA and the amount of capital employed. The target achieve-ment rate depends on the deviation from the budgeted figure. Cost of capital and depreciation/amortization should only devi-ate slightly from the budgeted figures.
Return on capital employed (ROCE) represents the return on the capital used. ROCE indicates how profitably the capital required to run the business is being used. Apart from profitability, the other influence on ROCE is capital intensity in relation to non-current assets and working capital. Our medium-term tar-get for ROCE is 11 percent. ROCE is an important criterion in managing the capital expenditure budget. Like the EBITDA mar-gin, ROCE is oriented to the company’s long-term performance. The target achievement rate depends on the extent to which the ROCE target is attained.
The theoretical target bonus in the event of 100 percent target achievement in the measurement period was 50 percent of the average annual base salary in the measurement period. The bonus for Executive Board members was capped at 100 percent of the average annual base salary in the measurement period. The measurement period was the financial year. The Supervisory Board decides on a factor of between 0.8 and 1.2 to reflect the individual performance of each Executive Board member. The cal-culated variable remuneration was multiplied by this factor. A minimum bonus agreement of 25 percent applied to Dr. von Plotho.
Arrangements since June 11, 2015
The Supervisory Board amended the variable remuneration sys-tem for the Executive Board due to the IPO of Siltronic AG on June 11, 2015. Since June 11, 2015, the bonus has been based on the following KPIs:
• EBITDA margin of the Siltronic Group• Net operating cash flow of the Siltronic Group• Business value contribution of the Siltronic Group• Return on capital employed (ROCE) of the Siltronic Group
The EBITDA margin, net operating cash flow, and business value contribution KPIs are the same as they were before the IPO. The ROCE KPI now relates to the Siltronic Group rather than to the Wacker Chemie Group.
In addition, the measurement period for variable remuneration has been extended to three years. The bonus is calculated on the basis of the average of the rate of target achievement for the past financial year and the total rate of target achievement for the two preceding financial years. The theoretical target bonus in the event of 100 percent target achievement in the measurement period is 100 percent of the average gross annual base salary in the final year of the measurement period. The bonus for Executive Board members is capped at 200 percent of the average annual base salary in the final year of the mea-surement period. A target achievement rate of 100 percent was set for 2013 and 2014.
74 ANNUAL REPORT 2015
Group management report • Remuneration report

The Supervisory Board has the option of increasing or decreasing the calculated theoretical bonus by up to 30 percent in order to take all circumstances and individual performance into account.
The amount of bonus for a particular year is determined by the Company’s Supervisory Board in March of the following year.
Of this bonus, 85 percent is paid with the next fixed salary pay-ment; the remaining 15 percent is paid in the form of Company shares that Siltronic purchases on the stock market in the name of and for the Executive Board member. These shares are subject to a two-year holding period.
Dr. Christoph von Plotho’s minimum bonus agreement no longer applies.
In 2015, Dr. Christoph von Plotho and Mr. Rainer Irle received a special bonus of EUR 120,000 (Dr. Christoph von Plotho) and EUR 84,000 (Mr. Rainer Irle) in recognition of Siltronic AG’s suc-cessful IPO. Of these amounts, 50 percent was paid in shares. These shares are also subject to a two-year holding period.
Pension contributions
The existing pension entitlements via the pension fund of Wacker Chemie VVaG, which provide a basic company pension, are being continued by the Company for the members of the Executive Board. For this purpose, the Company and the Exec-utive Board members make a monthly contribution to the pen-sion fund in accordance with the 1972 general insurance con-ditions of the pension fund of Wacker Chemie VVaG.
In addition, the Executive Board members acquire entitlements from the Company in accordance with the prevailing version of the company supplementary pension scheme regulations. The pensionable income as defined by the regulations is the agreed fixed annual salary. The benefits provided under this company supplementary pension scheme consist of a retirement pension, early retirement pension, incapacity pension, and surviving depen-dants’ pension. The pension expense amounts to 12.25 percent of pensionable annual income between 100 percent and 150 per-cent of the applicable annual income limit for the assessment of
contributions in the German statutory pension insurance scheme and 15 percent of pensionable annual income above 150 percent of the applicable annual income limit for the assessment of con-tributions in the German statutory pension insurance scheme. The annual pension benefits are based on the total pension payments made by the Company until the date of the insured event, applying an annuity rate of 18 percent.
In addition, Executive Board members receive from the Company a monthly amount (gross) in the amount of the employer con-tribution to the statutory pension insurance scheme (currently EUR 565.68 gross per month on the basis of the social insurance legislation in force in 2015) to help them build up a private retirement pension.
Other material agreements
The Company provides the members of the Executive Board with adequate directors’ and officers’ liability insurance (D&O insur-ance), which has a deductible as required by the German Stock Corporation Act (AktG).
If they leave the Company, the members of the Executive Board are bound by a twelve-month non-compete obligation for which they receive compensation. This non-compete compensation is calculated on the basis of 50 percent of the most recent total annual pay (average for the past three years). Any retirement pension is offset against the non-compete compensation.
The Executive Board service contracts provide for a cap on sev-erance pay that limits any compensation payable in the event of the Executive Board appointment being terminated prematurely without good cause to no more than two years’ total annual remuneration.
75ANNUAL REPORT 2015
Group management report • Remuneration report

Total remuneration of the members of the Executive Board for 2015
With effect from June 11, 2015, the fixed annual salary of Dr. Christoph von Plotho was increased from EUR 354,900 to EUR 400,000 gross and the fixed annual salary of Mr. Rainer Irle was increased from EUR 231,800 to EUR 280,000 gross.
In 2013, Siltronic implemented a variety of programs aimed at reducing costs and improving productivity due to the challenging financial situation. To set a good example, the Executive Board temporarily reduced its monthly fixed remuneration by 10 percent in the period from March up to and including November 2013.
In 2014 and 2015, as the financial situation had improved, each member of the Executive Board received partial compensation for the temporary reduction amounting to 50 percent of the individual amount that they had waived in 2013.
The current amount of remuneration for the Executive Board members is shown in the following tables, which are based on the model tables recommended in the German Corporate Gover-nance Code.
The following table shows the value of the benefits granted for 2015. The minimum and maximum achievable values are also shown.
Benefits granted for the reporting year
EUR
Dr. Christoph von PlothoPresident & Chief Executive Officer
Rainer IrleMember of the Executive Board
2015 target
2015 minimum
2015 maximum
2014 target
2015 target
2015 minimum
2015 maximum
2014 target
Fixed remuneration 379,846 379,846 379,846 347,972 258,462 258,462 258,462 227,268
Payment in respect of other accounting periods 1) 12,919 12,919 12,919 12,919 8,021 8,021 8,021 8,021
Fringe benefits 2) 41,244 41,244 41,244 40,230 36,755 36,755 36,755 37,816
Total 434,009 434,009 434,009 401,121 303,238 303,238 303,238 273,105
One-year variable remuneration 3) 79,400 39,700 190,400 177,500 51,900 0 124,400 115,900
IPO 120,000 0 120,000 0 84,000 0 84,000 0
Multi-year variable remuneration 4) 221,212 103,748 382,476 0 154,848 72,624 267,732 0
Total 854,621 577,457 1,126,885 578,621 593,986 375,862 779,370 389,005
Pension expenses 5) 59,320 59,320 59,320 48,849 99,899 99,899 99,899 54,231
Total remuneration 913,941 636,777 1,186,205 627,470 693,885 475,761 879,269 443,236
1) This is partial compensation for having waived salary in 2013. In 2013, the Siltronic Group implemented a variety of programs aimed at reducing costs and improving productivity due to the challenging financial situation. To set a good example, the Executive Board temporarily reduced its monthly fixed remuneration by 10 percent in the period from March up to and including November 2013. In 2014 and 2015, as the financial situation had improved, each member of the Executive Board received 50 percent of the individual amount that they had waived in 2013.
2) Fringe benefits largely comprise the use of a company car and social security contributions.3) Pro-rata one-year bonus for the period from January 1 to June 10, 2015 based on the target bonus.4) Pro-rata multi-year remuneration for the period from June 11 to December 31, 2015. ‘Multi-year’ refers to the measurement basis. For 15 percent of the defined gross annual bonus,
the Executive Board members receive Siltronic AG shares with a two-year holding period; the bonus determined using the three-year measurement basis is not affected by subsequent developments once it has been calculated. The minimum and maximum values were calculated on the basis of 100 percent target achievement for 2013 and 2014 and on the basis of a minimum rate of 0 percent and a maximum rate of 200 percent for 2015. The amounts shown for the theoretical minimum and maximum achievable values also reflect the Supervisory Board’s option of increasing or reducing the remuneration at its discretion.
5) Service cost pursuant to IAS 19 arising on entitlements to pensions and other post-retirement benefits.
76 ANNUAL REPORT 2015
Group management report • Remuneration report

The following table shows the actual remuneration for 2015, comprising fixed remuneration, fringe benefits, variable remu-neration – broken down into one-year and multi-year variable remuneration – and the pension expense.
Actual remuneration for the financial year
EUR
Dr. Christoph von PlothoPresident &
Chief Executive Officer
Rainer IrleMember of the Executive Board
2015 2014 2015 2014
Fixed remuneration 379,846 347,972 258,462 227,268
Payment in respect of other accounting periods 1) 12,919 12,919 8,021 8,021
Fringe benefits 2) 41,244 40,230 36,755 37,816
Total 434,009 401,121 303,238 273,105
One-year variable remuneration 3) 90,630 285,000 59,181 186,700
IPO 120,000 0 84,000 0
Multi-year variable remuneration 4) 238,909 0 167,236 0
Total 883,548 686,921 613,669 459,805
Pension expenses 5) 59,320 48,849 99,899 54,231
Total remuneration 942,868 735,770 713,568 514,036
1) This is partial compensation for having waived salary in 2013. In 2013, the Siltronic Group implemented a variety of programs aimed at reducing costs and improving productivity due to the challenging financial situation. To set a good example, the Executive Board temporarily reduced its monthly fixed remuneration by 10 percent in the period from March up to and including November 2013. In 2014 and 2015, as the financial situation had improved, each member of the Executive Board received 50 percent of the individual amount that they had waived in 2013.
2) Fringe benefits include in particular the use of a company car and social security contributions.
3) Pro-rata one-year remuneration for the period January 1 to June 10, 2015.4) Pro-rata multi-year remuneration for the period from June 11 to December 31, 2015.
‘Multi-year’ refers to the measurement basis. For 15 percent of the defined gross annual bonus, the Executive Board members receive Siltronic AG shares with a two-year holding period; the bonus determined using the three-year measurement basis is not affected by subsequent developments once it has been calculated.
5) Service cost pursuant to IAS 19 arising on entitlements to pensions and other post- retirement benefits; this is not part of the allocation in the financial year.
The remuneration paid to former Executive Board members or their surviving dependants amounted to EUR 260,215 in the reporting year (2014: EUR 131,910).
As of December 31, 2015, the defined benefit liability came to EUR 2,686,036 for active Executive Board members (December 31, 2014: EUR 2,462,078) and to EUR 6,679,034 for former Executive Board members or their surviving dependants (December 31, 2014: EUR 6,660,418).
Remuneration for Supervisory Board members
The remuneration for the members of the Supervisory Board of Siltronic AG is governed by the Articles of Association of Siltronic AG. A new version of the Articles of Association, including the remuneration rules, took effect on May 11, 2015.
Remuneration arrangements up to and including May 10, 2015
Before the Articles of Association were revised in May 2015, the members of the Supervisory Board received fixed annual remu-neration for their work of EUR 15,000, plus applicable VAT. This remuneration was paid after the end of the financial year. Super-visory Board members who joined or stepped down from the Supervisory Board part way through a particular year received the appropriate pro-rata amount.
Due to the additional time and complexity involved in certain functions, the remuneration for the chairman of the Supervisory Board is multiplied by a factor of three. A factor of two applies for the deputy chairman of the Supervisory Board and the chair-men of the committees. The remuneration of committee mem-bers is multiplied by a factor of 1.5, with the exception of mem-bers of the Conciliation Committee, which has to be formed by law. Membership of this committee does not lead to an increase in annual remuneration. Dual functions and membership of mul-tiple committees are also disregarded, which means that the remuneration of the Supervisory Board chairman and his deputy is not multiplied by any further factors for their committee roles, and Supervisory Board members’ committee memberships are counted only once.
Under the version of the Articles of Association valid until May 10, 2015, Supervisory Board members also received a lump sum for expenses of EUR 10,000 per calendar year. As the new ver-sion of the Articles of Association do not provide for a lump sum for expenses, only a pro-rata amount for the period up to May 10 was paid in respect of 2015.
77ANNUAL REPORT 2015
Group management report • Remuneration report

Remuneration arrangements since May 11, 2015
The Articles of Association that have applied since May 11, 2015 stipulate fixed annual remuneration for Supervisory Board mem-bers of EUR 30,000 (plus VAT). The multiplying factors are the same as those described above in respect of the previous version of the Articles of Association. The principle of pro-rata remuner-ation for members joining or stepping down from the Supervi-sory Board during the year also continues to apply.
Instead of the previous lump sum for expenses, since May 11, 2015 Supervisory Board members have received an attendance fee of EUR 2,500 for each physical meeting of the Supervisory Board and its committees that they attend in person. However, the fee is limited to EUR 2,500 per calendar day. Members who attend physical meetings via conference call or video conference or who cast their vote by submitting a written voting form do not receive the attendance fee. If a meeting is only held in the form of a conference call or video conference, the participating members receive a reduced attendance fee of EUR 1,250.
In addition, the Company reimburses Supervisory Board members for their necessary out-of-pocket expenses, plus applicable VAT, provided they have submitted receipts.
The annual remuneration for 2015 was calculated in two parts on a pro-rata basis under the rules of the old and new versions of the Articles of Association. Supervisory Board members only received the attendance fee for meetings held after May 11, 2015.
The shareholder representatives on the Supervisory Board who are also Executive Board members or employees at Wacker Chemie AG (Ms. Sieglinde Feist, Dr. Tobias Ohler, Dr. Joachim Rauhut, and Mr. Auguste Willems) have waived their remuneration. This waiver only applies for as long as they are employed by Wacker Chemie AG.
The Company provides the members of the Supervisory Board with adequate insurance cover. In particular, the Company takes out directors’ and officers’ liability insurance (D&O insurance) for them.
Supervisory Board remuneration for 2015
The remuneration granted to each member of the Supervisory Board for 2015 can be broken down as follows (excluding any additional VAT paid at 19 percent):
Supervisory Board member
Annual remuneration in EUR
(multiplied by the applicable factor for
special functions)Attendance fee
in EUR
Lump sum for expenses in EUR
(pro rata, up to May 10, 2015)
Total remuneration in EUR
Maximilian Baumgartner 24,657.54 7,500.00 3,561.64 35,719.18
Sieglinde Feist* – – – –
Dr. Hermann Gerlinger 36,986.30 7,500.00 3,561.64 48,047.94
Karin Gottschalk 24,657.54 7,500.00 3,561.64 35,719.18
Johann Hautz 24,657.54 7,500.00 3,561.64 35,719.18
Bernd Jonas 38,985.91 15,000.00 – 53,985.91
Gertraud Lauber 24,657.54 7,500.00 3,561.64 35,719.18
Dr. Tobias Ohler* – – – –
Walter Ortner 49,315.07 15,000.00 3,561.64 67,876.71
Dr. Joachim Rauhut** 10,109.59 2,500.00 – 12,609.59
Dr. Franz Richter 24,657.54 7,500.00 3,561.64 35,719.18
Harald Sikorski 24,657.54 7,500.00 3,561.64 35,719.18
Auguste Willems* – – – –
* Waiver of remuneration as member is both Executive Board member and employee of Wacker Chemie AG.** Waiver of remuneration until October 31, 2015, as member was Executive Board member of Wacker Chemie AG until this date.
78 ANNUAL REPORT 2015
Group management report • Remuneration report

Section 315 (4) no. 1 HGBComposition of subscribed capitalThe subscribed capital of Siltronic AG amounts to EUR 120 million and is divided into 30 million no-par-value shares, each with an imputed share of the capital amounting to EUR 4. The shares are registered shares. All the shares are of the same type; each share has the same rights attaching to it and allows one vote at the Annual General Meeting. The Company does not have any treasury shares.
Section 315 (4) no. 2 HGBRestrictions on voting rights or the transfer of sharesWe are not aware of any contractual restrictions on voting rights or the transfer of shares. The Articles of Association of Siltronic AG do not restrict the transferability of shares. However, there may be restrictions on the shares’ voting rights imposed by the German Stock Corporation Act (e.g. section 136 AktG) or as a conse-quence of the disclosure requirements pursuant to the German Securities Trading Act (WpHG) being violated. In accordance with section 67 (2) AktG, the parties deemed to be shareholders of Siltronic AG are those parties entered as such in the share register. Pursuant to section 67 (4) AktG, Siltronic AG is entitled to demand information from the persons entered in the register on whether the shares that are entered as held by them in the register actually belong to them and, if this is not the case, to demand information on who the shares are held for, as required in order to maintain the register. Until this demand is met, the voting rights attaching to the shares are suspended (section 67 (2) sentence 3 AktG).
Section 315 (4) no. 3 HGBShareholdings in the Company that represent more than 10 percent of the voting rightsThe Company has been notified of the following direct and indirect shareholdings in the Company that represent more than 10 percent of the voting rights:
• Wacker-Chemie Dritte Venture Gesellschaft mit beschränkter Haftung: 49.5 percent (direct)• Wacker Chemie AG: 57.83 percent (of which 8.33 percent direct and 49.5 percent held through Wacker-Chemie Dritte Venture Gesellschaft mit beschränkter Haftung)• Dr. Alexander Wacker Familiengesellschaft mit beschränkter
Haftung: 57.83 percent (held through Wacker Chemie AG and Wacker-Chemie Dritte Venture Gesellschaft mit bes-chränkter Haftung)
Section 315 (4) no. 4 HGBShares with special rights that confer authority to exert control over the CompanyNo shares with special rights that confer authority to exert con-trol over the Company have been issued.
Section 315 (4) no. 5 HGBType of voting right controls in cases where employees hold shares in the Company and do not exercise their control rights directlyThe employees who hold shares in Siltronic AG exercise their resulting control rights directly in accordance with the statutory provisions and the Articles of Association.
Section 315 (4) no. 6 HGBAppointment and removal of members of the Executive Board and amendments to the Articles of AssociationPursuant to section 5 of the Articles of Association, the Executive Board of Siltronic AG must consist of a minimum of two persons. In other respects, the Supervisory Board determines the number of Executive Board members. The Supervisory Board appoints one member of the Executive Board as President & Chief Executive Officer. The appointment and removal of members of the Execu-tive Board are governed by section 84 et seq. AktG and section 31 German Codetermination Act (MitbestG). Siltronic AG’s Articles of Association do not contain any additional rules in this regard. Changes to the Articles of Association are governed by section 179 et seq. AktG, which stipulate that all changes to the Articles of Association require a resolution to be adopted by the Annual General Meeting. However, the Supervisory Board is authorized in section 9 (2) of the Articles of Association to make changes that relate solely to the wording. In particular, the Supervisory Board is entitled to amend section 4 of the Articles of Association (share capital and shares) following the utilization of conditional or authorized capital.
Section 315 (4) no. 7 HGBAuthority of the Executive Board to issue and buy back sharesAuthorized capitalThe Annual General Meeting on May 7, 2015 authorized the Executive Board, subject to the consent of the Supervisory Board, to increase the Company’s share capital on one or more occasions by up to a total of EUR 50 million in the period up to May 6, 2020 by issuing new registered shares (Authorized Capital 2015). At the Annual General Meeting on June 8, 2015, the existing Authorized Capital 2015 was increased to EUR 60 million and the authorization was extended until June 7, 2020 in connection
Disclosures relevant to acquisitionspursuant to section 315 (4) of the German Commercial Code (HGB) and explanatory report of the Executive Board pursuant to section 176 (1) sentence 1 of the German Stock Corporation Act (AktG)
79ANNUAL REPORT 2015
Group management report • Disclosures relevant to aquisitions

with the capital increase for the IPO. The distribution of profit for the new shares may be defined in departure from section 60 AktG. The shareholders have a subscription right that, however, may be disapplied by the Executive Board in the cases specified in section 4 (6) of the Articles of Association, subject to the consent of the Supervisory Board.
Section 315 (4) no. 7 HGBConvertible and warrant-linked bondsOn the basis of a resolution of the Annual General Meeting on June 8, 2015, the Executive Board is authorized, subject to the consent of the Supervisory Board, until June 7, 2020 to issue on one or more occasions bearer or registered convertible and/or warrant-linked bonds, profit-sharing rights, and/or income bonds (together: ‘bonds’) in a total amount of up to EUR 750 million and to grant the holders/beneficial owners of these bonds warrants/conversion rights (including with a mandatory conversion requirement or option obligation) to up to 12.5 million new registered shares, with these shares together having an imputed share of the capital of up to EUR 50 million in accordance with the specific bond conditions. The bonds may be issued in return for cash but also for non-cash capital contributions. The bonds may be issued in euros or, limited to the corresponding equiva-lent value in EUR, the legal currency of an OECD country. They may also be issued by Siltronic group companies; in this case, the Executive Board is authorized, subject to the consent of the Supervisory Board, to assume a guarantee for the repayment of the bonds on behalf of the issuing company and to grant shares in Siltronic AG to the holders/beneficial owners of such bonds. The shareholders have a subscription right to the bonds; how-ever, subject to the consent of the Supervisory Board, the Exec-utive Board is authorized to disapply the subscription right, either wholly or in part, in defined cases. The Executive Board is authorized, subject to the consent of the Supervisory Board and complying with the stipulations of the Annual General Meeting’s resolution, to decide on the further details as regards the issu-ance and terms of issue of the bonds and their conditions.
Conditional capitalTo enable the Company to service the aforementioned bonds, the Annual General Meeting of June 8, 2015 conditionally increased the Company’s share capital by up to EUR 50 million through the issue of up to 12.5 million new registered shares. The new shares are issued at the conversion or warrant prices to be determined in accordance with the authorization from the Annual General Meeting.
Purchase of treasury sharesIn accordance with the resolution of the Annual General Meet-ing on May 7, 2015, the Executive Board is authorized pursuant to section 71 (1) no. 8 AktG to purchase treasury shares equat-ing to up to a total of 10 percent of the existing share capital at the time the resolution was adopted or at the time the authori-zation is exercised, whichever is the lower. The share capital at the time the resolution was adopted amounted to EUR 100 million. The authorization is valid until May 6, 2020. At the discretion of the Executive Board, the treasury shares may be purchased through the stock exchange, by way of a public purchase offer made to all shareholders, or by way of a public invitation to shareholders to tender their shares. The Annual General Meet-ing’s authorization sets out different requirements for the indi-vidual purchase types, particularly with regard to the purchase consideration. The authorization may be exercised on one or more occasions, for the entire amount or for partial amounts. Subject to the consent of the Supervisory Board, the Executive Board is permitted to sell the treasury shares purchased in accor-dance with this authorization on the stock exchange, to make an offer to all shareholders in proportion to their shareholding, or to use these treasury shares for any legally permitted purpose. In particular, they may be sold in return for a non-cash capital consideration (in the context of business combinations, to acquire entities or parts of an entity) or for cash. However, the treasury shares may also be used to satisfy or secure purchase rights or obligations attaching to shares in the Company (in connection with convertible or warrant-linked bonds). The trea-sury shares may also be retired. Shareholders’ subscription rights are disapplied in the aforementioned cases, with the exception of retirement.
Section 315 (4) no. 8 HGBMaterial agreements that are conditional upon a change of control resulting from a takeover bidSome contracts of Siltronic AG, including, but not limited to, the service agreements with Wacker Chemie AG, but also a number of purchasing agreements and supply agreements, contain pro-visions that entitle the other party to the agreement to terminate the contract prematurely in the event of a change of control.
Section 315 (4) no. 9 HGBCompensation agreements in the event of a takeover bidThere are no agreements with the Executive Board or employees of the Company that provide for compensation in the event of a takeover bid.
80 ANNUAL REPORT 2015
Group management report • Disclosures relevant to aquisitions

82 Consolidated Statement of Profit or Loss
83 Consolidated Statement of Financial Position
84 Consolidated Statement of Cash Flows
85 Consolidated Statements of Comprehensive Income
86 Consolidated Statement of Changes in Equity
88 Notes to the Consolidated Financial Statements 88 General information
99 Notes to the Statement of Profit or Loss
103 Notes to the Statement of Financial Position
132 Additional information
Consolidated Financial Statements
81

In EUR mn Note 2015 2014
Sales 01 931.3 846.0
Cost of sales 01 – 768.4 – 769.4
Gross profit 162.9 76.6
Selling expenses – 34.9 – 30.5
Research and development expenses – 64.4 – 64.3
General administration expenses – 18.5 – 16.0
Other operating income 01 88.9 82.4
Other operating expenses 01 – 131.3 – 61.8
Operating result 2.7 – 13.6
Loss from investment in joint venture 02 – – 3.5
2.7 – 17.1
Interest income 03 0.6 0.6
Interest expenses 03 – 4.1 – 2.0
Other finance cost, net 03 – 8.7 – 6.3
Financial result – 12.2 – 7.7
Loss before income tax – 9.5 – 24.8
Income taxes 04 – 10.6 – 2.2
Net loss for the year – 20.1 – 27.0
of which
attributable to Siltronic AG shareholders – 14.0 – 16.0
attributable to non-controlling interests – 6.1 – 11.0
Loss per common share in EUR (basic / diluted) 18 – 0.50 – 0.64
Consolidated Statement of Profit or Lossfor the year ended December 31, 2015
82 ANNUAL REPORT 2015
Consolidated Financial Statements • Consolidated Statements of Profit or Losss

In EUR mn Note December 31,
2015December 31,
2014
Intangible assets 05 29.7 29.7
Property, plant and equipment 06 542.9 571.7
Other financial assets 10 0.2 0.3
Income tax receivables 10 0.1 0.2
Deferred tax assets 04 6.2 7.1
Non-current assets 579.1 609.0
Inventories 09 142.7 138.4
Trade receivables 10 100.4 111.1
Fixed-term deposits 19 40.0 –
Other financial assets 10 15.6 20.3
Other non-financial assets 10 7.3 2.9
Income tax receivables 10 1.2 1.4
Cash and cash equivalents 11 154.5 187.4
Current assets 461.7 461.5
Total assets 1,040.8 1,070.5
In EUR mn Note December 31,
2015December 31,
2014
Subscribed capital 120.0 100.0
Capital reserves 997.3 946.8
Accumulated deficit – 489.7 – 548.4
Other equity items – 127.1 – 189.3
500.5 309.1
Non-controlling interests – 3.2 2.7
Equity 12 497.3 311.8
Provision for pensions 13 299.4 328.1
Other provisions 14 30.4 26.2
Provisions for income tax 14 – 0.1
Deferred tax liabilities 04 2.6 1.7
Financial liabilities 16 38.6 35.8
Other financial liabilities 15 0.6 3.8
Other non-financial liabilities 15 24.3 45.5
Non-current liabilities 396.0 441.2
Other provisions 14 6.0 8.0
Provisions and liabilities for income tax 14 5.4 4.0
Trade liabilities 15 72.1 55.8
Financial liabilities 16 – 176.1
Other financial liabilities 15 18.4 29.7
Other non-financial liabilities 15 45.6 43.9
Current liabilities 147.5 317.5
Liabilities 543.5 758.7
Total equity and liabilities 1,040.8 1,070.5
Consolidated Statement of Financial Positionas of December 31, 2015
83ANNUAL REPORT 2015
Consolidated Financial Statements • Consolidated Statement of Financial Position

In EUR mn Note 2015 2014
Net loss for the year – 20.1 – 27.0
Depreciation/amortization of non-currnet assets, including impairment losses and reversals thereof 121.3 149.2
Other non-cash expenses and income – 9.1 – 13.3
Result from disposal of non-current assets 0.8 0.2
Loss from investment in joint venture – 3.5
Changes in inventories – 3.6 – 14.2
Changes in trade receivables 18.6 6.5
Changes in other assets 2.8 – 0.4
Changes in deferred taxes 2.4 – 2.8
Changes in provisions 23.5 5.8
Changes in trade liabilities – 5.9 – 8.5
Changes in other liabilities – 25.6 39.5
Taxes paid – 6.8 – 10.9
Interest paid – 2.8 – 3.0
Interest received 0.6 0.1
Cash flow from operating activities 20 96.1 124.7
Payments for capital expenditures (including intangible assets) – 58.9 – 37.7
Proceeds from the disposal of property, plant and equipment 0.2 0.3
Aquisition of SSW, net of cash acquired – 26.2
Payments for the acquisition of fixed-term deposits – 60.0 –
Proceeds from fixed-term deposits 20.0 –
Cash flow from investing activities 20 – 98.7 – 11.2
Dividends paid – – 269.5
Bank loans repaid – – 196.4
Payment to shareholder – – 39.0
Proceeds from profit and loss transfer agreement – 116.0
Proceeds from the IPO 143.3 –
Utilization of funds in (+) or additions to (-) cash pooling of and loans from Wacker Chemie – 175.5 447.5
Proceeds from other financial liabilities 0.0 0.0
Cash flow from financing activities – 32.2 58.6
Changes due to exchange-rate fluctuations 1.9 2.8
Changes in cash and cash equivalents 11 – 32.9 174.9
at the beginning of the year 187.4 12.5
at the end of the year 154.5 187.4
Consolidated Statement of Cash Flowsfor the year ended December 31, 2015
84 ANNUAL REPORT 2015
Consolidated Financial Statements • Consolidated Statement of Cash Flows

2015 2014
In EUR mn Before tax After tax Before tax After tax
Net loss for the year – 20.1 – 20.1 – 27.0 – 27.0
Item not reclassified to profit or loss: remeasurement of defined benefit plans 47.4 47.4 – 135.5 – 135.5
Items reclassified to profit or loss:
Difference from foreign currency translation 7.1 7.1 – 5.1 – 5.1
thereof recognized in profit or loss – – – 17.6 – 17.6
Changes in market values of the securities available for sale – – – 0.1 – 0.1
Changes in market values of derivative financial instruments (cash flow hedge) 7.9 7.9 – 33.5 – 33.5
thereof recognized in profit or loss 48.0 48.0 – 10.5 – 10.5
Effects of net investments in foreign operations – – 2.6 2.6
thereof recognized in profit or loss – – 2.1 2.1
Share of cash flow hedge in equity-accounted investments – – 0.1 0.1
thereof recognized in profit or loss – – 0.1 0.1
Sum of items reclassified to profit or loss 15.0 15.0 – 36.0 – 36.0
Other comprehensive income / loss 62.4 62.4 – 171.5 – 171.5
Total comprehensive income / loss 42.3 – 198.5
of which
attributable to Siltronic AG shareholders 48.2 – 188.1
attributable to non-controlling interests – 5.9 – 10.4
Consolidated Statement of Comprehensive Income for the year ended December 31, 2015
85ANNUAL REPORT 2015
Consolidated Financial Statements • Consolidated Statements of Comprehensive Income

In EUR mn Subscribed capital Capital reserves
Difference from foreign currency
translation adjustments
Effects of net investments
in foreign operations
Changes in market values
of securities available for sale
Changes in market values of derivative
financial instruments (cash flow hedge)
Remeasurement of defined
benefit plansAccumulated
deficit TotalNon-controlling
interestsTotal
equity
Balance as of January 1, 2014 100.0 970.3 – 1.7 – 2.6 0.1 12.3 – 25.3 – 262.9 790.2 – 790.2
Net result for the year – – – – – – – – 16.0 – 16.0 – 11.0 – 27.0
Other comprehensive income and expense – – – 5.7 2.6 – 0.1 – 33.4 – 135.5 – – 172.1 0.6 – 171.5
Total comprehensive loss – – – 5.7 2.6 – 0.1 – 33.4 – 135.5 – 16.0 – 188.1 – 10.4 – 198.5
Capital increase due to profit and loss transfer agreement – 15.5 – – – – – – 15.5 – 15.5
Dividends – – – – – – – – 269.5 – 269.5 – – 269.5
Capital reduction due to transactions with shareholders – – 39.0 – – – – – – – 39.0 – – 39.0
Total transactions with shareholders – – 23.5 – – – – – – 269.5 – 293.0 – – 293.0
Majority acquisition of SSW – – – – – – – – – 13.1 13.1
Balance as of December 31, 2014 100.0 946.8 – 7.4 – 0.0 – 21.1 – 160.8 – 548.4 309.1 2.7 311.8
Balance as of January 1, 2015 100.0 946.8 – 7.4 – 0.0 – 21.1 – 160.8 – 548.4 309.1 2.7 311.8
Net result for the year – – – – – – – – 14.0 – 14.0 – 6.1 – 20.1
Other comprehensive income – – 6.9 – 0.0 7.9 47.4 – 62.2 0.2 62.4
Total comprehensive income – – 6.9 – 0.0 7.9 47.4 – 14.0 48.2 – 5.9 42.3
Capital increase due to IPO 20.0 123.2 – – – – – – 143.2 – 143.2
Netting of Siltronic AG’s net loss for the year with capital reserves – – 72.7 – – – – – 72.7 0.0 – 0.0
Balance as of December 31, 2015 120.0 997.3 – 0.5 – 0.0 – 13.2 – 113.4 – 489.7 500.5 – 3.2 497.3
Consolidated Statement of Changes in Equityas of December 31, 2015
86 ANNUAL REPORT 2015
Consolidated Financial Statements • Consolidated Statement of Changes in Equity

In EUR mn Subscribed capital Capital reserves
Difference from foreign currency
translation adjustments
Effects of net investments
in foreign operations
Changes in market values
of securities available for sale
Changes in market values of derivative
financial instruments (cash flow hedge)
Remeasurement of defined
benefit plansAccumulated
deficit TotalNon-controlling
interestsTotal
equity
Balance as of January 1, 2014 100.0 970.3 – 1.7 – 2.6 0.1 12.3 – 25.3 – 262.9 790.2 – 790.2
Net result for the year – – – – – – – – 16.0 – 16.0 – 11.0 – 27.0
Other comprehensive income and expense – – – 5.7 2.6 – 0.1 – 33.4 – 135.5 – – 172.1 0.6 – 171.5
Total comprehensive loss – – – 5.7 2.6 – 0.1 – 33.4 – 135.5 – 16.0 – 188.1 – 10.4 – 198.5
Capital increase due to profit and loss transfer agreement – 15.5 – – – – – – 15.5 – 15.5
Dividends – – – – – – – – 269.5 – 269.5 – – 269.5
Capital reduction due to transactions with shareholders – – 39.0 – – – – – – – 39.0 – – 39.0
Total transactions with shareholders – – 23.5 – – – – – – 269.5 – 293.0 – – 293.0
Majority acquisition of SSW – – – – – – – – – 13.1 13.1
Balance as of December 31, 2014 100.0 946.8 – 7.4 – 0.0 – 21.1 – 160.8 – 548.4 309.1 2.7 311.8
Balance as of January 1, 2015 100.0 946.8 – 7.4 – 0.0 – 21.1 – 160.8 – 548.4 309.1 2.7 311.8
Net result for the year – – – – – – – – 14.0 – 14.0 – 6.1 – 20.1
Other comprehensive income – – 6.9 – 0.0 7.9 47.4 – 62.2 0.2 62.4
Total comprehensive income – – 6.9 – 0.0 7.9 47.4 – 14.0 48.2 – 5.9 42.3
Capital increase due to IPO 20.0 123.2 – – – – – – 143.2 – 143.2
Netting of Siltronic AG’s net loss for the year with capital reserves – – 72.7 – – – – – 72.7 0.0 – 0.0
Balance as of December 31, 2015 120.0 997.3 – 0.5 – 0.0 – 13.2 – 113.4 – 489.7 500.5 – 3.2 497.3
87ANNUAL REPORT 2015
Consolidated Financial Statements • Consolidated Statement of Changes in Equity

General information to the Notes
Nature of operations
Siltronic AG (the “Company”), together with its subsidiaries (the “Group”) is a producer of semiconductor silicon wafers made from hyperpure silicon whose customers comprise nearly all major semiconductor companies worldwide. Silicon constitutes the base substrate for most semiconductor devices, and silicon wafers are components of everyday electronics including smart-phones, tablets, PCs, flat screens, and sensors. The Group operates out of wafer facilities in Burghausen and Freiberg, Germany, two wafer facilities in Singapore, and one wafer facility in Portland, Oregon, USA.
Until June 10, 2015, the Company was a wholly-owned subsidiary of Wacker Chemie AG, with 10 percent of its shares held directly by Wacker Chemie AG and 90 percent by Wacker-Chemie Dritte Venture GmbH, which is a wholly-owned subsidiary of Wacker Chemie AG. On June 11, 2015, Siltronic AG successfully com-pleted its IPO. The Company’s shares are listed in the Prime Stan-dard of the Frankfurt Stock Exchange and are included in the TecDAX. However, Wacker Chemie AG still holds a majority stake in the Company.
From January 1, 2009 through December 31, 2014, the Company was part of a German fiscal unity for corporate income and trade tax purposes and was subject to a control and profit and loss transfer agreement (“PLTA”) with Wacker-Chemie Dritte Venture GmbH under which Siltronic AG was obligated to transfer its annual profit to Wacker-Chemie Dritte Venture GmbH, who was obligated to compensate the Company for any annual GAAP losses incurred during the term of the PLTA, determined in accor-dance with German accounting standards. As of January 1, 2015, the PLTA was no longer in effect. Although the company occurred losses in the past and the PLTA has been terminated, the going concern assumption is still appropriate based on positive free cash flows in the past and future cash flow projec-tions of management.
Siltronic AG is located in Munich/Germany, Hanns-Seidel-Platz 4. Wacker Chemie AG and Wacker-Chemie Dritte Venture GmbH are located there, too.
Basis of presentation
The consolidated financial statements have been prepared in accordance with the International Financial Reporting Standards (IFRS) and related interpretations issued by the IFRS Interpreta-tions Committee (IFRIC). The consolidated financial statements comply with IFRS as adopted by the EU. The Group has applied all standards and interpretations that were effective as of Decem-ber 31, 2015 and endorsed by the EU.
The fiscal year corresponds to the calendar year. Assets and liabilities are reported in the statement of financial position in line with their maturities. The Group classifies assets and liabilities as current if it expects to realize or settle them within 12 months. The statement of profit or loss is prepared using the cost of sales method.
The consolidated financial information is presented in euros, which is the Company’s functional currency and the Group’s reporting currency. All amounts are shown in millions of euros (EUR million) unless otherwise stated.
Significant events after the reporting date are presented in the report on subsequent events as part of the Group management report. The Executive Board of Siltronic AG has approved the consolidated financial statements on March 3, 2016. They will be submitted to the Supervisory Board for its meeting on the same day.
The declaration in relation to the German Corporate Governance Code, as prescribed in Section 161 of the German Stock Corpo-ration Act has been issued and was made available to the public on http://www.siltronic.com/int/en/investor_relations/corporate_governance/declaration/declaration.jsp
Financial reporting principles applied for the first time in 2015
IFRIC 21 “Levies” (mandatory application from January 1, 2015): IFRIC 21 “Levies” contains rules for the accounting of liabilities to pay levies imposed by a government that are not levies within the meaning of IAS 12 “Income Taxes.” The changes in connec-tion with IFRIC 21 have no impact on Siltronic’s financial position or financial performance or on the presentation of its financial statements.
Notes to the Consolidated Financial Statements of Siltronic AG and subsidiaries
88 ANNUAL REPORT 2015
Consolidated Financial Statements • Notes

Improvements to IFRS 2010-2012 and 2011-2013 (mandatory application from January 1, 2015, or February 1, 2015): The changes relate to standards IFRS 1, IFRS 2, IFRS 3, IFRS 8, IFRS 13, IAS 16, IAS 24, IAS 38, and IAS 40. The changes have no material impact on Siltronic’s financial position or financial per-formance or on the presentation of its financial statements.
Financial reporting standards and interpretations not yet applied
The following new standards, interpretations, and changes to existing standards were endorsed by the EU but application is not yet mandatory for the period under review. The Group does not apply any of these standards, interpretations, and changes to existing standards earlier than required. The Group continu-ously evaluates new standards, interpretations, and changes to existing standards to determine their impact on the consolidated financial statements.
Mandatory application in the fiscal year 2016Amendments to IFRS 11 “Accounting for acquisition of interests in joint operations” (mandatory application from January 1, 2016): IFRS 11 governs the accounting of arrangements where a company exercises joint control over a joint venture or a joint operation. With the changes of IFRS 11, the IASB defines the accounting for acquisition of interests in a joint operation which represents a business in terms of IFRS 3. In such cases, the acquirer should apply the accounting rules for “Business Com-binations” as stipulated in IFRS 3. The changes have no impact on Siltronic’s financial position or financial performance, or on the presentation of its financial statements.
Amendments to IAS 1 “Disclosure initiative” (mandatory appli-cation from January 1, 2016): The amendments refer to several disclosure matters. The application of the amendments will lead to changes as regards the disclosures, and Siltronic is currently evaluating the effects.
Amendment to IAS 16 and 38 “Clarification of acceptable methods of depreciation and amortization” (mandatory application from January 1, 2016): The amendment provides guidelines regarding the use of acceptable methods for depreciation and amortiza-tion. Methods based on revenue to calculate the depreciation of an item of property, plant and equipment are not appropriate, while revenue-based methods to calculate the amortization for intangible assets are only allowed in specific and restricted cases (the presumption that the method is not appropriate can be rebutted). The changes have no impact on Siltronic’s financial position or financial performance, or on the presentation of its financial statements.
Amendment to IAS 16 and 41 “Financial reporting for bearer plants” (mandatory application from January 1, 2016): IAS 41 currently requires all biological assets related to agricultural activ-ity to be measured at fair value less estimated costs to sell. In accordance with the changes, bearer plants are to be accounted for as property, plant and equipment. The changes have no impact on Siltronic’s financial position or financial performance, or on the presentation of its financial statements.
Amendments to IAS 19 “Defined benefit plans: employee contri-butions” (mandatory application from February 1, 2015): The amendments clarify those regulations that concern the alloca-tion of contributions by employees or third parties to service periods in cases where the contributions are linked to the same period of service. In addition, relief is granted in cases where the contributions are independent of the number of years of service. The amendments have no impact on Siltronic’s financial position or financial performance, or on the presentation of its financial statements.
Amendments to IAS 27 “Equity method in separate financial statements” (mandatory application from January 1, 2016): As a result of the amendment, investments in subsidiaries, joint ventures, and affiliated companies can again be accounted for using the equity method in separate financial statements. The amendments have no impact on Siltronic’s financial position of financial performance, or on the presentation of its financial statements.
Improvements to IFRS 2012-2014 (mandatory application from January 1, 2016): The changes relate to standards IFRS 5, IFRS 7, IAS 19, and IAS 34. The changes have no material impact on Siltronic’s financial position or financial performance or on the presentation of its financial statements.
Amendments to IFRS 10, IFRS 12, and IAS 28 “Investment entities: applying the consolidation exception” (mandatory application from January 1, 2016, not yet endorsed by the EU): The amend-ments help in resolving different questions referring to the appli-cation of exceptions from the consolidation requirement according to IFRS 10 if the parent company meets the definition of an “investment entity.” The amendments have no impact on the Group’s financial position or financial performance, or on the presentation of its financial statements.
ANNUAL REPORT 2015
Consolidated Financial Statements • Notes
89

Mandatory application from January 1, 2018IFRS 9 “Financial instruments” (mandatory application from January 1, 2018; not yet endorsed by the EU): IFRS 9, which was published in July 2014, replaces the existing guidance included in IAS 39 “Financial Instruments: Recognition and Measure-ment.” IFRS 9 comprises revised guidance for the categorization and classification of financial instruments including a new model covering expected credit default in order to calculate the allow-ance for financial assets. In addition, the standard has new basic accounting rules for hedging. The standard also covers the rules for recognition and de-recognition of financial instruments from IAS 39. We expect that IFRS 9 will impact the classification and the measurement of the financial assets of the Group. The deter-mination of the impact on its consolidated financial statements is not yet completed.
IFRS 15 “Revenue from contracts with customers” (mandatory application from January 1, 2018; not yet endorsed by the EU): IFRS 15 Revenue from Contracts with Customers sets out a com-prehensive scope to identify if, when, to what amount and at what date sales are to be recognized. This replaces existing guidelines for revenue recognition, including IAS 18 “Sales Recog-nition,” IAS “Construction Contracts,” and IFRIC 13 “Customer Loyalty Programs”. Siltronic is currently evaluating the effects.
Mandatory application from January 1, 2019IFRS 16 “Leasing” (mandatory application from January 1, 2019; not yet endorsed by the EU): In accordance with IFRS 16, a lia-bility has to be recognized for each lease, and a right-of-use-asset for the leased asset has to be recognized at the same time. This asset is depreciated, while the liability is reduced during its term by redemptions and deferred interest. Siltronic has not analyzed the effects of the new standard. We expect that both financial liabilities and intangible assets will increase.
Mandatory application not yet definedAmendments to IFRS 10 and IAS 28 “Sale or contribution of assets between an investor and its associate or joint venture” (not yet endorsed by the EU): The changes address a known inconsistency between the rules of IFRS 10 and IAS 28 (2011) when a sale of an asset to an affiliated company or to a joint venture is made or a capital increase is executed to an affiliated company or to a joint venture. The amendments have no impact on the Group’s financial position or financial performance, or on the presentation of its financial statements.
Scope of consolidation
SubsidiariesSubsidiaries are defined as companies in which the Company directly or indirectly holds a voting majority or has, in any other way, the power to govern the financial and business policies of an entity in order to benefit from its activities. In assessing con-trol, the Company takes into account potential voting rights that are currently exercisable or convertible. The financial statements of subsidiaries are included in the consolidated financial state-ments from the date when the possibility to control commences until the date that such possibility ceases to exist.
The table below shows the subsidiaries reflected in the scope of consolidation as of December 31 of the respective year. The percentages noted refer to the interest Siltronic has directly or indirectly in the respective companies:
Group holdings
in %December 31,
2015December 31,
2014
Europe
Siltronic Holding International B.V., Krommenie, The Netherlands 100.0 100.0
North America
Siltronic Corp., Portland, Oregon, USA 100.0 100.0
Asia excluding Japan
Siltronic Asia Pte. Ltd., Singapore 100.0 100.0
Siltronic Singapore Pte. Ltd., Singapore 100.0 100.0
Siltronic Silicon Wafer Pte. Ltd., Singapore 77.7 77.7
Japan
Siltronic Japan Corporation, Tokyo, Japan 100.0 100.0
Joint venturesA joint venture is an arrangement in which the Group has joint control whereby the Group has rights to the net assets of the arrangement rather than rights to its assets and obligations for its liabilities. Joint ventures are accounted for in the consolidated financial statements using the equity method.
90 ANNUAL REPORT 2015
Consolidated Financial Statements • Notes

Changes in the scope of consolidation
Siltronic Silicon Wafer Pte. Ltd. (“SSW”) was established in 2006 under the name Siltronic Samsung Wafer Pte. Ltd. as a joint venture company organized under the laws of Singapore. The Dutch subsidiary of the Group called Siltronic Holding Interna-tional B.V. on the one hand and Samsung Electronics (“Samsung”) on the other hand were holding a 50 percent share each in SSW until January 24, 2014. Prior to January 24, 2014, neither share-holder could exercise control over SSW because of the percent-age each held in connection with the Articles of Association. The Company accounted for the investment in SSW using the equity method. The impact on the statement of profit or loss resulting from SSW when accounted for using the equity method was shown in the line item “Loss from investment in joint venture.”
Based on an agreement dated January 24, 2014, the Siltronic Group increased its share in the joint venture from 50 percent to 78 percent by means of a capital increase of SGD 150 million (equivalent to approximately EUR 86 million). In connection with the transaction, the Group made an additional loan to SSW and prepayments for wafers. Samsung also provided prepayments to SSW and SSW used the funds to repay all its bank loans (which resulted from the initial project financing of the joint venture). The repayment of the bank loans amounted to approximately SGD 341 million (equivalent to approximately EUR 196 million).
The acquisition of the additional 28 percent share in SSW was accounted for in accordance with the rules for step acquisitions provided for in IFRS 3. Valuations including a purchase price allocation were completed when preparing the consolidated financial statements for the year 2014.
The acquisition of the majority stake in SSW had a significant impact on the statement of cash flows as regards the compari-son of the reporting year with the year 2014.
Consolidation methods
The consolidated financial statements are based on the separate financial statements of the Company and its consolidated sub-sidiaries for the calendar year.
Investments accounted for using the equity method are initially measured at cost when the acquisition is made. If the cost exceeds the pro rata share of equity, the difference (goodwill) is included in the carrying amount of the investment. If the cost is lower than the share of equity at the time of acquisition, this difference is included in the carrying amount and recorded in the statement of profit or loss as “Result from investments in joint ventures.” The carrying amount increases or decreases annually to reflect pro rata earnings, dividend payouts, or other changes in equity. If it is determined that the value of the invest-ment has been reduced below its carrying amount, an impair-ment is recognized in the statement of profit or loss.
Intragroup balances and transactions and any related unrealized income and expenses are eliminated. Unrealized gains arising from transactions with equity-accounted investees are elimi-nated against the investment to the extent of the Group’s inter-est in the investee. Unrealized losses are eliminated in the same way as unrealized gains, but only to the extent that there is no evidence of impairment.
Acquisitions
The Group accounts for its business combinations using the acquisition method when control is transferred to the Group. The consideration transferred is generally measured at fair value and allocated to the identifiable net assets acquired. Any good-will that arises is tested annually for impairment. Any gain on a bargain purchase is recognized in profit and loss immediately. Transaction costs are expensed as incurred.
The consideration transferred does not include amounts related to the settlement of pre-existing relationships. Such amounts are generally recognized in profit or loss.
Any contingent consideration is measured at fair value at the date of acquisition. If an obligation to pay contingent consider-ation that meets the definition of a financial instrument is clas-sified as equity, then it is not remeasured and settlement is accounted for in equity. Otherwise, subsequent changes in the fair value of the contingent consideration are recognized in profit and loss.
ANNUAL REPORT 2015
Consolidated Financial Statements • Notes
91

Loss of control
When the Group loses control over a subsidiary, it derecognizes the assets and liabilities of the subsidiary and any related non-controlling interest and other components of equity. Any resulting gain or loss is recognized in profit or loss.
Foreign currency translation
The financial statements of consolidated companies are pre-pared using the currency of the primary economic environment in which the entity operates (the functional currency) and trans-lated on the basis of the functional currency principle using the modified closing rate method, in which balances are translated from the functional currency to the reporting currency using the spot rates prevailing on the period end, while amounts in the
statement of profit or loss are translated using the period’s aver-age exchange rates.
The Company and its subsidiaries conduct their business in the respective functional currency, which is the local currency. Any net gains or losses arising from the translation of equity are recognized directly in other comprehensive income. Translation differences on monetary assets and liabilities resulting from fluc-tuating exchange rates are recorded in the statement of profit or loss. If a Group company is removed from consolidation, any translation difference is reclassified from equity to profit or loss.
The table below includes the exchange rates between the most significant currencies reported in these consolidated financial statements and the euro for the reporting periods.
Exchange ratesSpot rate December 31, Average rate for the year
ISO code 2015 2014 2015 2014
US dollar USD 1.09 1.22 1.11 1.33
Japanese yen JPY 131 145 134 140
Singapore dollar SGD 1.54 1.61 1.52 1.68
Estimates and assumptions used in preparing the Consolidated Financial Statements
The preparation of the consolidated financial statements in com-pliance with IFRS requires management to make assumptions and estimates that affect the application of accounting policies and the reported amounts of assets, liabilities, income and expenses, and contingencies. These assumptions and estimates impact the carrying amount of assets and liabilities at period end and the amount of income and expenses for the period. The assumptions on which the estimates are based relate primarily to the uniform determination of useful lives throughout the Group, the determination of fair values of financial instruments, the recognition and measurement of provisions, the probability of realizing future tax benefits, and cash flow projections which were used for impairment test and purchase price allocation purposes.
The actual results may differ from these assumptions and esti-mates. Changes in accounting estimates are recognized as soon as they become apparent and affect the net results for the period in which the estimates have changed and in any future periods affected.
Intangible assets and property, plant and equipmentThe expected useful life of intangible assets and of property, plant and equipment, together with their amortization or depre-ciation schedules, is based on past experience, plans, and esti-mates.
Impairment tests are performed for assets if specific indicators point toward a possible impairment loss or reversal of an impair-ment loss. Goodwill is tested annually for impairment. In the case of an impairment test, an estimate must be made of the recoverable amount of the affected cash-generating unit that corresponds to the higher of the fair value less costs to sell or the value in use. To assess the value in use, the discounted future
92 ANNUAL REPORT 2015
Consolidated Financial Statements • Notes

cash flows of the affected cash-generating unit are to be deter-mined. The estimate of the discounted future cash flows con-tains significant assumptions, in particular relating to future selling prices for and sales volumes of wafers, development of costs and discount rates. Although the Group assumes that the estimates of the relevant expected useful lives and of discounted future cash flows, as well as the assumptions regarding the general economic conditions and the development of the economic sectors are reasonable, a change in the assumptions or circum-stances might require a change in the analysis. This could result in additional impairments or reversals of impairment losses in the future.
The carrying amount of intangible assets and property, plant and equipment as of December 31, 2015 amounted to EUR 572.6 million.
Defined benefit obligationsThe accounting of pensions and similar obligations is in accor-dance with actuarial valuations. These valuations are based on statistical and other factors in order to anticipate future events. The factors include the discount rate, expected salary and pen-sion increases, and the mortality rate. If market and economic conditions change, these assumptions could vary considerably from actual developments, consequently leading to major changes in pension and similar obligations as well as the associated future expenses.
The provision recorded for pension obligations is valued by dis-counting the Group-specific, expected future cash flows. The discount rate is derived from the yield curve of high-grade, fixed interest corporate bonds with maturities matching the pension obligations. The bonds are denominated in the same currency as their underlying pension obligations and have a rating of at least AA from one of the three major rating agencies. This is based on information as of the closing date and on a maturity that approximates the maturity of the pension obligation.
The provision for pensions amounts to EUR 299.4 million as of December 31, 2015.
Deferred tax assetsAt the end of each period, the Group assesses whether the probability of future tax benefits is sufficient to recognize deferred taxes. Among other things, this requires that management evaluates the tax benefits resulting from currently available tax strategies and future taxable income, as well as taking additional positive and negative factors into account.
Deferred tax assets as of December 31, 2015 amount to EUR 6.2 million.
Accounting policies
The Company and its subsidiaries apply uniform methods for the recognition and valuation of assets, liabilities, income, and expense.
Assets and liabilities of the consolidated financial statements are reported based on their historical cost, with the exception of the items reported at fair value. In particular, derivative financial instruments and plan assets used to cover future pension obli-gations are recorded at fair value.
Other accounting policies have been applied consistently.
Intangible assetsIntangible assets acquired are measured at cost and, if their useful lives can be determined, are amortized on a straight-line basis. The useful life is reviewed annually and, if necessary, revised to correspond to new expectations. Amortization of intangible assets (apart from goodwill) is allocated to the functional areas that use the assets. Intangible assets with indefinite useful lives are subject to an annual impairment test. In the year 2014, goodwill was recorded as a result of the step acquisition of SSW.
ANNUAL REPORT 2015
Consolidated Financial Statements • Notes
93

Internally generated intangible assets are capitalized if it is prob-able that a future economic benefit can be associated with the use of the asset and the costs of the asset can be determined reliably. Such assets are recognized at cost and amortized on a straight-line basis. Their stated useful lives correspond to those of the intangible assets acquired against payment. The capital-ization of development costs does not play a role for the Group because development costs refer to existing products and processes respectively or because future cash inflows are too uncertain.
Property, plant and equipmentProperty, plant and equipment is capitalized at cost and depre-ciated on a straight-line basis over its expected economic life. The useful life is reviewed annually and, if necessary, revised to correspond to new expectations. In addition to the purchase price, acquisition costs include incidental acquisition costs as well as any obligation incurred for the demolition and removing of the asset from its location. Property, plant and equipment is not revalued on the basis of the provisions in IAS 16. Day-to-day maintenance and repair costs are expensed as incurred. Costs for replacing parts or carrying out major overhauls of property, plant and equipment are capitalized if future economic benefits are likely to accrue to the Group and if the costs can be mea-sured reliably.
If property, plant and equipment is permanently shut down, sold or given up, the acquisition or production costs are derecognized, along with the corresponding accumulated depreciation. Any resulting gain or loss from the sale of an asset is recognized under other operating income or expenses.
Financing costs that were incurred in connection with particular qualifying assets and which can be attributed directly or indi-rectly to them are capitalized as part of acquisition or production costs until the assets are used for the first time. No borrowing costs were capitalized in the periods presented.
Depreciation and amortizationDepreciation and amortization are recognized using the straight-line method and based on the following useful lives:
Useful lives
Years
Intangible assets 3 to 5
Production buildings 20 to 30
Other buildings 10 to 30
Machinery and equipment 6 to 12
Factory and office equipment 3 to 10
If, having been measured in accordance with the above principles, the carrying amounts of intangible assets or items of property, plant and equipment that were amortized or depreciated are higher than their recoverable amounts as of the reporting date, corresponding impairment losses are recognized as an expense.
The Group reviews regularly the residual value and the useful life of assets.
At the end of every reporting date, the Group checks whether there are triggering events for recognizing (or reversing) impair-ments. An impairment loss is then recognized in the amount by which the carrying amount exceeds the recoverable amount. The recoverable amount is the higher amount of the fair value less costs to sell, and the value in use.
Government grantsGovernment grants that relate to the acquisition of an asset reduce acquisition and production costs and are recognized in profit and loss as the asset is depreciated or amortized. Unless otherwise indicated, these grants (investment incentives) are provided by government bodies.
Grants that are compensation for expenses or losses already incurred are recognized as separate assets if the company is of the opinion that all material obligations have been fulfilled and the necessary application form has been or will be submitted. Such grants are recognized as other operating income.
94 ANNUAL REPORT 2015
Consolidated Financial Statements • Notes

InventoriesInventories are measured at cost using the average cost method. Lower net realizable values or prices are taken into account by means of write-downs to fair value less costs to sell. Cost of sales includes directly attributable costs as well as appropriate portions of indirect material and labor costs, administrative expenses, and depreciation. Due to the short-term production processes, financing costs are not included as part of acquisition or pro-duction costs. The overhead cost allocations are determined on the basis of a specific capacity utilization.
Write-downs are recognized for inventory risks resulting from obsolescence or reduced usability or to reflect other reductions in the recoverable amount.
Unfinished and finished goods are combined for disclosure pur-poses due to the nature of the wafer production process.
Financial instruments and derivativesA financial instrument is a contract that gives rise to a financial asset at one party and a financial liability or equity instrument at another party. Financial instruments are recognized in the consolidated financial statements at the time that the Group becomes a contracting party to the financial instrument.
In general, financial assets and financial liabilities are not offset. A net amount is presented only if the Group currently has a right to offset the recognized amounts and intends to settle on a net basis.
Financial instruments are measured at fair value on initial recog-nition. The transaction costs directly attributable to the acquisi-tion must be taken into account for all financial assets and lia-bilities not subsequently measured at fair value through profit or loss. The fair values recognized in the statement of financial position generally correspond to the market prices of the finan-cial assets and liabilities. The fair value of financial instruments is equal to the amount the Group would receive or pay if it exchanged or settled the financial instruments. If available, quoted market prices are used for financial instruments. Otherwise, fair values are calculated based on the market conditions prevailing on the valuation date, typically interest rates and exchange rates. The fair value is calculated using mathematical models, typically by discounting future cash flows using the market interest rate or by applying standard option-pricing models.
The Group’s financial assets comprise cash and cash equiva-lents, trade receivables, loans granted and other receivables, held-to-maturity financial instruments, and primary and deriva-tive financial assets held for trading. Financial assets must generally be settled in cash or for another asset. This includes trade liabilities, loans received, and derivative financial liabilities. The Group makes no use of its option to measure financial lia-bilities at fair value through profit or loss.
The manner in which financial assets and liabilities are subse-quently measured depends on whether a financial instrument is held for trading or held-to-maturity, whether such a financial instrument is available for sale, or whether the financial assets concerned are loans and receivables granted by the Company.
Loans and receivables are non-derivative financial assets that are not quoted in an active market. They are measured at amortized cost using the effective interest method. All other primary finan-cial assets, which include equity instruments and debt instru-ments not held-to-maturity, are classified as available for sale and reported at fair value if their fair value can be determined reliably.
Derivative financial instruments are generally measured at fair value, irrespective of the purpose or intention for which they were concluded. Positive market values are recognized as a receivable and negative market values as a liability.
Changes in the market value of derivatives used to hedge the risk of future cash flows denominated in a foreign currency (cash flow hedges) are recognized in other comprehensive income. The accumulated amount of other comprehensive income of the hedging instrument is not released to the statement of profit or loss until the hedged item is realized. If such a derivative is sold or the hedging relationship is discontinued, the change in its value continues to be reported under other equity items until the underlying transaction occurs. Steps taken to hedge the risk of changes in the market values of recognized assets or liabilities, or to hedge unrecognized fixed contractual obligations, lead to fair value hedges. Changes in fair values are recorded for both the hedged underlying transaction and the derivative financial instruments used for hedging, and are presented in the state-ment of profit or loss.
ANNUAL REPORT 2015
Consolidated Financial Statements • Notes
95

Derivative financial instruments are used for hedging purposes only to reduce the Group’s exposure to foreign currency exchange rates. The Group does not hedge any net investments in foreign operations.
Contracts concluded in order to receive or deliver non-financial goods for the Group’s own use are not accounted for as deriva-tives, but treated as pending transactions.
For further information see note 19 Financial Instruments.
Receivables and other assets, cash and cash equivalentsTrade receivables and other assets (including tax receivables), with the exception of financial derivatives, are generally recog-nized at cost. Risks are taken into account through appropriate valuation allowances. Allowances for uninsured receivables – or for the deductible in the case of insured receivables – are made at the latest when legal action is taken. If payment of a receivable is no longer expected even though legal action has been taken, the gross receivable is derecognized and any valuation allow-ances made are reversed. Non-current receivables which are non-interest-bearing or low-interest-bearing are discounted.
Generally, cash and cash equivalents comprise cash in hand, demand deposits, and financial assets that can be converted into cash at any time and are only subject to an insignificant risk of changes in value.
Deferred tax assets and liabilitiesDeferred tax assets and liabilities are recognized for temporary differences between tax bases and carrying amounts. The deferred tax assets include existing loss carryforwards, the realization of which is assured with sufficient probability. Deferred taxes are determined on the basis of the tax rates which, under current law, are applicable or anticipated in the individual countries when they are realized. Deferred tax assets and liabilities are offset only to the extent possible under the same tax authority.
The change of deferred tax assets and liabilities is recognized in the statement of profit or loss. In cases where profits or losses are recognized in other comprehensive income, the deferred tax effect is likewise posted under other comprehensive income.
Up to and including December 31, 2014, the Company was part of a fiscal unity in Germany with Wacker Chemie AG. As such, the Company was not a separate taxpayer subject to income tax in Germany. For purposes of these consolidated financial state-ments, the Company reports German income taxes for the year 2014 as if it had been a separate taxpayer.
Provision for pensions - defined benefit plansThe Group’s net obligation in respect of defined benefit plans is calculated separately for each plan by estimating the amount of future benefit that employees have earned in the current and prior periods, discounting that amount and deducting the fair value of any plan assets. The calculation of defined benefit obli-gations is performed annually using the projected unit credit method. When the calculation results in a potential asset for the Group, the recognized asset is limited to the present value of economic benefits available in the form of any future refunds from the plan or reductions in future contribution to the plan.
Remeasurement of the net defined benefit liability, which com-prises actuarial gains and losses, the return on plan assets (excluding interest income), and the effect of the asset ceiling (if any), are recognized immediately in other comprehensive income. Actuarial gains and losses are arising from the difference between the estimate at the start of the period and actual out-come at the end of the period in relation to mortality rates, pension and salary trends, and discount rates.
The Group determines the net interest expense on the net defined liability for the period by applying the discount rate used to measure the defined benefit obligation at the beginning of the annual period to the net defined benefit liability applicable at that date, taking into account any changes in the net defined benefit liability during the period as a result of contributions and benefit payments. Net interest expense and other expenses to defined benefit plans are recognized in profit and loss.
96 ANNUAL REPORT 2015
Consolidated Financial Statements • Notes

If the present value of a defined benefit obligation changes due to a plan modification or curtailment, the Group recognizes the effect as past service cost. This is immediately recognized in profit or loss when it occurs. The profits and losses resulting from settlement are also recognized immediately in the statement of profit or loss when settlement takes place. Administrative expenses that are not related to the management of plan assets are likewise recognized in profit or loss when incurred. The expense incurred in funding the pension provisions (service cost) is allocated to the costs of the functional areas concerned. The interest cost is reported under other financial result.
Provision for pension - defined contribution plansObligations for contributions to defined contribution plans are expensed as the related service is provided. Prepaid contributions are recognized as an asset to the extent that a cash refund or a reduction in future payments is available.
Provisions for early retirement and anniversariesProvisions for early retirement and anniversaries are measured in accordance with actuarial appraisals and belong to other long-term employee benefits. The Group’s net liability is the amount of future benefits that employees have earned in return for their service in the current and prior periods. That benefit is discounted to determine its present value. Remeasurements are recognized in profit or loss in the period in which they arise.
Provisions for early retirement are linked to the rendering of future service.
The provisions are recognized on a pro rata basis over the service period during the work phase. The part of the salary that employees forgo during the work phase is secured with plan assets against default. The provision for early retirement rep-resents the Group’s net liability, i.e. after the plan assets have been offset against the total obligation. The additional compen-sation granted is not completely earned until the required work has been rendered in full by the employees.
Other provisionsProvisions are recognized in the statement of financial position for present legal or constructive obligations toward third parties if an outflow of resources to settle these obligations is probable and its amount can be reliably estimated. The amounts recog-nized are based on what will be required to cover the Group’s future payment obligations, identifiable risks and contingencies. As a rule, cost components that are capitalized under inventories are included in the measurement of other provisions. Significant future price increases are taken into account in the measure-ment.
Non-current provisions are measured at the discounted present value as of the reporting date. The discount rate applied is the current market interest rate for risk-free investments with terms corresponding to the residual term of the obligation to be set-tled. Expected refunds, provided that they are sufficiently certain or legally enforceable, are not offset against provisions. Instead, they are capitalized as separate assets.
Provisions for restructuring costs are recognized if a detailed formal plan for restructuring has been drawn up and conveyed to the affected parties. Termination benefits are expensed at the earlier of when the Group can no longer withdraw the offer of those benefits and when the Group recognizes costs for a restructuring.
Provisions for contingent losses arising from onerous contracts are recognized if the expected benefits to be derived from a contract are lower than the unavoidable costs of meeting the contractual obligations. Provisions for environmental protection are recognized if the future cash outflows for complying with environmental legislation or for cleanup measures are likely, the costs can be estimated with sufficient accuracy and no future acquired benefit can be expected from the measures.
If an amended estimate results in a reversal of a provision, the impact is presented in the same line item of the statement of profit or loss as the original estimate. If the original estimate has been presented in other operating expense the reversal would be presented in other operating income.
ANNUAL REPORT 2015
Consolidated Financial Statements • Notes
97

LiabilitiesTrade liabilities and other liabilities including tax liabilities are measured at amortized cost using the effective interest method. Financial liabilities are measured at fair value on initial recognition. For all financial liabilities not subsequently measured at fair value through profit or loss, the transaction costs directly attributable to the acquisition are included in the recognized liability.
Sales recognitionSales represent the fair value of the consideration received for the goods and services that were sold within the scope of ordinary activities. These are reported without value-added and other taxes incurred in connection with sales and net of discounts and price reductions. Sales from products are recognized when the goods have been delivered and the main risks of ownership have passed to the purchaser. Sales from services are recognized once services are rendered. The Group does not conduct any business that requires using the percentage-of-completion method for recognizing sales of long-term production contracts.
Cost of salesCost of sales comprise the manufacturing costs for products, the purchase price for trade products, the costs incurred for services rendered to a customer. In addition to directly attribut-able costs such as raw materials and supplies, direct labor and energy costs, cost of sales includes depreciation/amortization, appropriate overhead costs allocated to manufacturing activities, and inventory write-downs. Cost for freight-in and freight-out are part of cost of sales.
Selling expenses, research and development costs, and gen-eral administration expensesSelling expenses include costs incurred by the sales organization and the cost of market research, application support on customers’ premises and commission expenses.
Research and development expenses cover costs incurred in the development of products and processes. Research costs in the narrow sense are recognized as expenses when they are incurred, i.e. not capitalized. Development costs are capitalized only if all the prescribed recognition criteria have been met, i.e. the research phase can be separated clearly from the development phase, and the costs incurred can be allocated to the individual project phases without any overlaps. Additionally, there must be sufficient certainty that future cash inflows will be realized.
General administration expenses include the pro rata payroll and material costs of corporate control functions, human resources, and accounting and information technology, unless they have been charged as an internal service to other functional areas.
Timing of recognition of income and expensesOperating expenses are reported as expenses when the service is utilized and interest income is accrued using the effective interest rate.
98 ANNUAL REPORT 2015
Consolidated Financial Statements • Notes

Notes to the Statement of Profit or Loss
01 Sales, cost of sales, other operating income, and other operating expenses
For the year ended
In EUR mnDecember 31,
2015December 31,
2014
Sales
Product sales 923.3 838.4
Services and license fees 8.0 7.6
Total 931.3 846.0
Cost of sales – 768.4 – 769.4
thereof inventory valuation allowance and reversal respectively 6.7 – 0.7
Other operating income
Gains from currency transactions 82.9 74.0
Gain from the re-measurement of assets in the course of the consolidation of SSW – 3.5
Income from reversal of provisions related to restructuring – 1.6
Government grants for research 0.6 0.8
Income from reversal of provisions 2.0 0.6
Income from disposal of property, plant and equipment 0.2 0.3
Income from the reversal of impairment losses on property, plant and equipment 0.5 –
Income from reversal of valuation allowances for receivables 0.0 0.1
Miscellaneous other operating income 2.7 1.5
Total 88.9 82.4
Other operating expenses
Losses from currency transactions – 128.6 – 49.1
Losses from impairment of property, plant and equipment – 0.1 – 8.9
Losses from disposal of property, plant and equipment – 1.0 – 0.5
Losses from additions to valuation allowances for receivables – 0.1 – 0.4
Personnel cost related to restructuring – – 0.2
Miscellaneous other operating expenses – 1.5 – 2.7
Total – 131.3 – 61.8
Gains from currency transactionsThe year 2014 includes gains from currency transactions of EUR 17.6 million resulting from the reclassification of gains which, prior to the consolidation of SSW as of January 24, 2014, had been recorded in other equity items. In addition, income of EUR 3.5 million was recognized as a result of the re-measure-ment of the Group’s previous share in SSW to its fair value.
For more information, please refer to notes 02 and 07. Other operating expenses and income for 2015 include a net loss from currency translation of EUR 45.7 million.
Impairment of property, plant and equipmentIn the year 2014, an impairment of EUR 4.6 million was recorded on an abandoned property. This property was not in a saleable condition until the fiscal year 2014. Based on management expectation the fair value less cost to sell is only an insignificant amount. Furthermore, machinery and equipment with a carrying amount of EUR 4.3 million was impaired in 2014 because cash flows were estimated to be negative.
Depreciation and amortization expense and personnel expenseDepreciation and amortization expense amount to EUR 121.8 million in 2015 (prior year: EUR 140.3 million).
Personnel expenses amount to EUR 284.2 million in 2015 (prior year: EUR 268.8 million).
02 Joint venture
As noted under “Changes in the scope of consolidation,” the Group held a 50 percent interest in SSW until January 24, 2014. SSW is structured as a separate vehicle and the Group has a residual interest in the net assets of SSW. Accordingly, the Group had classified its interest in SSW as a joint venture.
According to a long-term supply agreement between the Group and SSW, the Group purchased a defined volume of wafers manufactured by SSW which the Group then sold to its customers and, as contractually agreed with SSW, kept a margin. This long-term supply agreement has a take-or-pay commitment and ensures capacity utilization at SSW.
ANNUAL REPORT 2015
Consolidated Financial Statements • Notes
99

In addition to the purchase of wafers, the Group realized license fees coming from a license granted to SSW for the production technology.
Moreover, the Group provided interest-bearing shareholder loans to SSW, which also granted the Group the right to convert loans into equity (call option). The exercise periods of the options are December 31, 2016. The fair value of each option was zero at each of the reporting dates.
The loss shown in the statement of profit or loss from invest-ments in joint ventures for the year 2014 represents the Group’s 50 percent share in the loss of SSW while SSW was accounted for using the equity method. The reconciliation of the carrying amounts in the statement of financial position to the loss from investments in joint ventures prior to the Group’s acquisition of the majority in SSW in January 2014 was as follows:
2014
In EUR mnInvestment in joint venture
Loans to joint venture Total
January 1, 2014 – 142.6 142.6
Accounted for using the equity method – – 3.5 – 3.5
Remeasurement – 3.5 3.5
Consolidation – – 142.6 – 142.6
December 31, 2014 – – –
Before acquiring the majority on January 24, 2014, SSW recorded the following income and expenses: sales EUR 12.6 million, opera ting result EUR – 5.9 million, depreciation and amortiza-tion EUR 8.9 million, interest expense EUR 1.2 million, net result EUR – 7.0 million, and comprehensive income EUR – 7.0 million.
The loss from investments in joint ventures recorded in the state-ment of profit or loss for the year 2014 represents the 50 percent share of the Group in the net loss which SSW showed for the period from January 1 to consolidation on January 24.
03 Interest income and expense and other financial expenses
In EUR mn 2015 2014
Net interest income
Interest income 0.6 0.6
thereof from financial instruments held-to-maturity 0.2 0.0
Interest expense – 4.1 – 2.0
Total – 3.5 – 1.4
Other finance cost, net
Interest cost on provisions – 8.7 – 7.5
Other financial income – 1.8
Other financial expenses – – 0.6
Summe – 8.7 – 6.3
Interest income and expense In the years 2015 and 2014, interest income on amounts due from Wacker Chemie AG was EUR 0.0 million and EUR 0.1 million, respectively.
Other finance cost, netThe interest cost on provisions mainly refers to pensions and includes net interest on the net defined benefit liability.
Other financial income and expense mainly result from discounting of other provisions.
04 Income taxes
Income taxes are calculated on the basis of applicable or anti-cipated tax rates according to the tax laws in the individual countries as of the realization date. These tax rates are generally based on the legal statutes valid or adopted as of the reporting date.
In Germany, prevailing tax rates include a corporate income tax, a solidarity surcharge on corporate income tax, and a trade income tax that varies depending on the municipality in which a company is located.
100 ANNUAL REPORT 2015
Consolidated Financial Statements • Notes

Tax rates in Germany
in % 2015 2014
Weighted average trade income tax rate in Germany 12.2 12.3
Corporate income tax rate in Germany 15.0 15.0
Solidarity surcharge on corporate income tax in Germany 5.5 5.5
Income tax rate for Siltronic AG in Germany 28.0 28.2
Due to the PLTA, which was in place from January 1, 2009 to December 31, 2014 with Wacker-Chemie Dritte Venture GmbH, Siltronic AG was part of a fiscal unity with Wacker Chemie AG in Germany. In December 2014, the parties agreed to cancel the PLTA with effect of January 1, 2015.
As a result of being part of a fiscal unity, the Company was not a separate taxpayer and did not retain any tax loss carryforwards. Following the termination of the PLTA, the Company is a separate taxpayer. As mentioned in the significant accounting policies for deferred tax assets, for purposes of these consolidated financial statements, the Company reports German income taxes for the year 2014 as if it had been a separate taxpayer.
Profits generated by foreign subsidiaries are taxed in the respective countries at the relevant local and national tax rates. The income tax rates for the foreign subsidiaries companies are within a range from 0 percent to 38.8 percent.
Deferred taxes on undistributed profits of subsidiaries are recognized only if distribution is planned. The amount of EUR 112.6 million (prior year: EUR 53.9 million) is available for distribution.
The tax expense reported for the fiscal years 2015 and 2014 was EUR 10.6 million and EUR 2.2 million, respectively. Applying the German tax rate on the loss before tax would result in tax benefits of EUR 2.6 million and EUR 7.0 million. The differences between the expected tax benefit and the actual tax expense of EUR 13.2 million and EUR 9.2 million were primarily caused by the impairment of deferred tax benefits at Siltronic AG, Siltronic Japan Corp. and Siltronic Corp. and by effects from non-deductible expenses.
Income tax comprises current income tax for prior years with an amount of EUR 0.2 million in the year 2015 and EUR 0.1 million in the year 2014.
Tax reconciliation
In EUR mn 2015 2014
Current taxes, Germany – 0.4 0.2
Current taxes, foreign – 7.8 – 5.2
Total current taxes – 8.2 – 5.0
Deferred taxes, Germany 0.0 0.0
Deferred taxes, foreign – 2.4 2.8
Total deferred taxes – 2.4 2.8
Total income taxes – 10.6 – 2.2
Reconciliation of effective tax rate
Loss before taxes – 9.5 – 24.8
Income tax rate for Siltronic AG in % 28.0 28.2
Expected tax benefit 2.6 7.0
Variance in tax rate – 2.4 – 5.3
Effect of non-deductible expenses – 1.6 – 1.5
Effect of tax-free income 0.7 4.7
Taxes relating to other periods (current earnings) – 0.1 0.4
Effect due to unrecognized deferred tax assets – 10.0 – 9.2
Other variances 0.2 1.7
Total income taxes – 10.6 – 2.2
Effective tax rate in % – 111.7 – 8.9
ANNUAL REPORT 2015
Consolidated Financial Statements • Notes
101

Deferred tax assets are recognized only if it is assumed that the tax benefits will be realized. The following table shows the allo-cation of deferred taxes to the assets and liabilities:
Allocation of deferred taxes As of December 31, 2015 As of December 31, 2014
In EUR mn Deferred tax
assetsDeferred tax
liabilitiesDeferred tax
assetsDeferred tax
liabilities
Intangible assets 0.0 – 0.5 –
Property, plant and equipment 4.1 2.6 3.5 1.7
Current assets 0.7 2.5 1.8 1.6
Provision for pensions 0.0 – 1.3 –
Other provisions 0.4 – 0.0 –
Liabilities 3.5 – 1.6 –
Total 8.7 5.1 8.7 3.3
Netting – 2.5 – 2.5 – 1.6 – 1.6
Deferred taxes reported in the statement of financial position 6.2 2.6 7.1 1.7
A netting of deferred tax assets and deferred tax liabilities is performed only in the case that future benefits and obligations relate to the same taxable entity and to the same tax authority.
Changes in deferred tax assets and liabilities in the amount of EUR –1.8 million (2014: EUR 3.1 million) were fully taken to profit or loss. The existing tax loss carryforwards can be utilized as follows:
Tax loss carryforwards
For the year ended
In EUR mnDecember 31,
2015December 31,
2014
Within 1 year – –
Within 2 years – –
Within 3 years – –
Within 4 years – –
Within 5 years or later 139.2 66.1
Total 139.2 66.1
of which loss carryforwards expected not to be realizable 139.2 66.1
of which loss carryforwards expected to be realizable 0.0 0.0
As a result of past loss experience, deferred taxes are not recog-nized on loss carryforwards that are not realizable. If deferred taxes had been recognized, an amount of EUR 42.2 million would have resulted from such recognition in the year 2015 and EUR 25.1 million in the year 2014.
As of December 31, 2015, no deferred tax assets were recognized for tax-deductible temporary differences of EUR 352.4 million (prior year: EUR 402.5 million).
102 ANNUAL REPORT 2015
Consolidated Financial Statements • Notes

Notes to the Statement of Financial Position
05 Development of intangible assets
2015
In EUR mn GoodwillCustomer
relationship Other Total
Cost
January 1, 2015 20.5 10.5 40.7 71.7
Additions – – 0.3 0.3
Disposals – – – 0.1 – 0.1
Transfers – – 2.9 2.9
Effect of movements in exchange rates – 0.4 0.9 1.3
December 31, 2015 20.5 10.9 44.7 76.1
Amortization
January 1, 2015 – 1.9 40.1 42.0
Additions – 2.2 1.2 3.4
Disposals – – – 0.1 – 0.1
Effect of movements in exchange rates – 0.1 1.0 1.1
December 31, 2015 – 4.2 42.2 46.4
Carrying amount as of December 31, 2015 20.5 6.7 2.5 29.7
The goodwill and the customer relationship acquired through business combinations are due to the consolidation of SSW. Further information is provided in note 07.
The customer relationship is amortized based on management’s expectation of the term of the relationship. The amortization follows the straight-line method over the expected term of the customer relationship. Other intangible assets primarily comprise industrial property rights and similar rights acquired at cost from third parties, e.g. software licenses.
Amortization of intangible assets are included in the cost of sales.
For the purpose of impairment testing, goodwill has been allo-cated to the Group’s Cash Generating Unit (CGU) “300 mm”. The recoverable amount of this CGU was based on its value in use, determined by discounting the future cash flows to be gene-rated from the continuing use of the CGU. The key assumptions used for the calculation of the recoverable amount are a long-term EBITDA margin in line with medium-term planning, a remaining useful life of the leading asset of the CGU (parts of buildings designed for the wafer production), and a discount rate of 10.4 percent before tax. The determination of the long-term EBITDA margin and the useful life of the leading asset reflect past experience in relation to similar CGUs. The discount rate was derived from a post-tax measure estimated on the historical industry average weighted-average cost of capital, with a possible debt leveraging of 10 percent at a market inter-est premium of 6.8 percent. External information sources in relation to the EBITDA margin of the CGU are only available for some of the EBITDA components.
ANNUAL REPORT 2015
Consolidated Financial Statements • Notes
103

Medium-term planning is based on the assumption of increasing sales and increasing EBITDA margins. The assumption for the following years until the end of the observation period is that average EBITDA set out in the medium-term planning is achieved and that it remains constant. In order that the CGU achieves the EBITDA according to the medium-term planning, the annual EBITDA growth to be achieved in the medium-term planning period must be almost 9 percent. No growth rate was applied. The recoverable amount exceeds the carrying amount by more than EUR 100 million.
The calculation of the recoverable amount is sensitive to its assumptions as follows:
Long-term EBITDA margin: There is a possibility of lower than forecasted EBITDA margins due to an overcapacity of the world-wide wafer supply industry and due to significant exchange rate fluctuations. A drop in EBITDA margin by an average of 15 percent compared to the forecasted margin would result in impairment.
Useful life of the leading asset: There is the possibility of a shorter than forecasted remaining useful life of the leading asset if the manufacturing infrastructure becomes obsolete earlier than anticipated. Assuming a remaining useful life of 17 years instead of 24 years would result in impairment.
Discount rate: There is the possibility of higher than forecasted weighted-average cost of capital. A rise in the discount rate by 2.2 percentage points would result in impairment.
Intangible assets 2014 2014
In EUR mn GoodwillCustomer
relationship Other Total
Cost
January 1, 2014 – – 38.8 38.8
Acquisition through business combination 20.5 9.6 0.2 30.3
Additions – – 0.2 0.2
Disposals – – – 0.1 – 0.1
Transfers – – 0.5 0.5
Effect of movements in exchange rates – 0.9 1.1 2.0
December 31, 2014 20.5 10.5 40.7 71.7
Amortization
January 1, 2014 – – 38.3 38.3
Additions – 1.8 0.8 2.6
Disposals – – – 0.1 – 0.1
Effect of movements in exchange rates – 0.1 1.1 1.2
December 31, 2014 – 1.9 40.1 42.0
Carrying amount as of December 31, 2014 20.5 8.6 0.6 29.7
The goodwill and the customer relationship acquired through business combination result from the consolidation of SSW. Further information is provided in note 07.
104 ANNUAL REPORT 2015
Consolidated Financial Statements • Notes

06 Development of property, plant and equipment
2015
In EUR mnLand, buildings
and similar rights
Machinery and technical
equipment
Other equipment, factory and
office equipmentAssets under construction Total
Cost
January 1, 2015 677.9 2,285.7 128.7 25.8 3,118.1
Additions 0.2 19.3 2.1 53.1 74.7
Disposals – – 30.8 – 3.5 – 0.7 – 35.0
Transfers 0.1 17.1 1.5 – 18.7 0.0
Effect of movements in exchange rates 34.7 60.6 1.3 0.8 97.4
December 31, 2015 712.9 2,351.9 130.1 60.3 3,255.2
Depreciation and impairment losses
January 1, 2015 457.6 1,970.5 118.0 0.3 2,546.4
Additions 12.5 100.7 5.0 – 118.2
Reversals of impairment losses – 0.5 – – – – 0.5
Impairment loss 0.1 – – – 0.1
Disposals – – 30.6 – 3.3 – – 33.9
Transfers – – – – 0.0
Effect of movements in exchange rates 28.3 52.4 1.3 – 82.2
December 31, 2015 498.0 2,093.0 121.0 0.3 2,712.3
Carrying amount as of December 31, 2015 214.9 258.9 9.1 60.0 542.9
2014
In EUR mnLand, buildings
and similar rights
Machinery and technical
equipment
Other equipment, factory and
office equipmentAssets under construction Total
Cost
January 1, 2014 532.5 2,003.3 125.3 11.7 2,672.8
Additions 0.1 15.3 2.8 22.3 40.5
Disposals – 0.2 – 20.6 – 4.2 – 0.2 – 25.2
Transfers 0.1 10.2 1.6 – 12.4 – 0.5
Acquisition through business combination 116.3 194.2 1.6 3.9 316.0
Effect of movements in exchange rates 29.1 83.3 1.6 0.5 114.5
December 31, 2014 677.9 2,285.7 128.7 25.8 3,118.1
Depreciation and impairment losses
January 1, 2014 424.0 1,798.6 115.7 2.2 2,340.5
Additions 12.9 120.2 4.6 – 137.7
Impairment loss 4.6 3.8 0.5 – 8.9
Disposals – 0.2 – 20.4 – 4.1 – – 24.7
Transfers – 1.9 – – 1.9 0.0
Effect of movements in exchange rates 16.3 66.4 1.3 – 84.0
December 31, 2014 457.6 1,970.5 118.0 0.3 2,546.4
Carrying amount as of December 31, 2014 220.3 315.2 10.7 25.5 571.7
ANNUAL REPORT 2015
Consolidated Financial Statements • Notes
105

The acquisition through business combinations relates to the acquisition of the majority share in SSW in the year 2014. As a result of the consolidation, SSW’s assets are reported in the con-solidated statement of financial position. Further information on the consolidation of SSW is provided in note 07.
For information on impairment losses reference is made to note 01.
07 Acquisition of SSW
In 2014, a controlling interest in SSW was acquired using a capital increase of EUR 86.5 million. Before the acquisition, the interest in SSW was accounted for under the equity method. Upon initial consolidation on 24 January 2014, the previously equity-accounted investment was recognized at a value of zero owing to the cumulative net losses of SSW. Further losses totaling EUR 24.2 million from this equity investment were offset against a shareholders’ loan classified as a net investment.
Following the acquisition, the amounts from currency translation that had previously been recognized in other comprehensive income were reclassified to the statement of profit or loss. This resulted in non-cash income of EUR 17.6 million that was rec-ognized under other operating income. The acquisition of SSW was accounted for as a step acquisition in which the transferred assets and liabilities were remeasured at their fair values as of the acquisition date.
The existing contractual relations between the Group and SSW were recognized at fair value. There were trade receivables and other assets of EUR 6.1 million, a shareholders’ loan of EUR 142.6 mil-lion, prepayments of EUR 8.6 million, and trade payables of EUR 5.1 million. In addition, legal costs and similar costs totaling EUR 0.1 million were incurred in connection with the acquisition. These are included in the ‘General administration expenses’ line item.
In the period from January 24, 2014 through December 31, 2014, SSW posted sales of EUR 153.0 million and a net loss of approximately EUR 49.0 million. If SSW had been consolidated starting January 1, 2014, the consolidated revenue for the Group would have amounted to approximately EUR 853 million and the net loss of the Group would have amounted to approxi-mately EUR 34 million.
08 Development of financial assets
2014
In EUR mnLoans to
joint ventures
Cost
January 01, 2014 142.6
Revaluation 3.4
Accounted for using the equity method – 3.5
Change due to consolidation – 142.6
Effect of movement in exchange rates 0.1
December 31, 2014 –
Amortization
January 01, 2014 –
Effect of movement in exchange rates –
December 31, 2014 –
Carrying amount as of December 31, 2014 –
09 Inventories
For the year ended
In EUR mn Dec. 31, 2015 Dec. 31, 2014
Raw materials and supplies 58.7 56.5
Finished and unfinished products 84.0 81.9
Total 142.7 138.4
of which recorded at net realizable value 16.9 49.4
As of December 31, 2015, unfinished products amounted to EUR 34.5 million (2014: EUR 33.6 million).
106 ANNUAL REPORT 2015
Consolidated Financial Statements • Notes

10 Trade receivables, other financial and non-financial assets and income tax receivables
In EUR mn
As of December 31, 2015 As of December 31, 2014
Totalof which
non-currentof which
current Totalof which
non-currentof which
current
Trade receivables 100.4 – 100.4 111.1 – 111.1
Derivative financial instruments 9.9 0.2 9.7 4.2 0.3 3.9
Government grants – – – 3.2 – 3.2
Miscellaneous 5.9 – 5.9 13.2 – 13.2
Other financial assets 15.8 0.2 15.6 20.6 0.3 20.3
Prepaid expenses 1.3 – 1.3 1.8 – 1.8
Other tax receivables 6.0 – 6.0 1.1 – 1.1
Other non-financial assets 7.3 – 7.3 2.9 – 2.9
Other financial and non-financial assets 23.1 0.2 22.9 23.5 0.3 23.2
of which maturity > 5 years – – – – – –
Income tax receivables 1.3 0.1 1.2 1.6 0.2 1.4
of which maturity > 5 years – – – – – –
Receivables are measured at cost which correspond to their mar-ket values. If not covered by insurance or advance payments received, default risks are taken into account with valuation allowances. Sundry other assets include advance payments to
Wacker Chemie AG pension funds of an amount of EUR 9.5 million at year-end 2014.
The following table shows the aging of receivables:
Overdues
In EUR mn
As of December 31, 2015
Carrying amount
Of which neither impaired
nor past due
Of which past due, but not impaired Of which past due and
impaired past due
< 30 dayspast due
31 to 45 dayspast due
> 45 days
Trade receivables 100.4 93.8 6.3 0.0 0.0 0.3
Other financial assets 15.8 15.8 – – – –
Other non-financial assets 7.3 7.3 – – – –
Total 123.5 116.9 6.3 0.0 0.0 0.3
ANNUAL REPORT 2015
Consolidated Financial Statements • Notes
107

In EUR mn
As of December 31, 2014
Carrying amount
Of which neither impaired
nor past due
Of which past due, but not impaired Of which past due and
impaired past due
< 30 dayspast due
31 to 45 dayspast due
> 45 days
Trade receivables 111.1 99.6 11.1 0.1 0.0 0.3
Other financial assets 20.6 20.6 – – – –
Other non-financial assets 2.9 2.9 – – – –
Total 134.6 123.1 11.1 0.1 0.0 0.3
The following table shows the development of valuation allow-ances on trade receivables during the reporting periods (no val-uations allowances have been recorded on other assets):
Valuation allowances
In EUR mn 2015 2014
As of January 1 2.6 7.7
Utilization – 2.6 – 3.4
Additions 1.3 0.1
Reversals – 0.1 – 2.1
Effect of movement in exchange rates 0.2 0.3
As of December 31 1.4 2.6
The maximum default risk is estimated to match the carrying amount of the receivables not covered by a default insurance. The Group provides for default risk based on past experience and on the conditions prevailing as of the period end.
11 Cash and cash equivalents
Deposits and cash on hand are measured at their notional amounts. The development of cash and cash equivalents is shown in the statement of cash flows.
12 Equity
The individual items of equity and its development are shown in the consolidated statement of changes in equity.
Subscribed capitalUntil June 8, 2015, subscribed capital amounted to EUR 100.0 mil-lion. Until May 11, 2015, the share capital was divided into 50,000,000 no-par value bearer shares. Pursuant to a resolution of the General Meeting on May 7, 2015, Siltronic AG’s Articles of Association were changed and, in this context, the number of shares was reduced to 25,000,000 no-par value bearer shares.
The amendment of the Articles became effective upon its regis-tration in the Commercial Register on May 11, 2015. In connec-tion with preparing the IPO, the Company’s share capital was increased by EUR 20.0 million through the issue of 5,000,000 new registered shares, based on a resolution of the General Meeting on June 8, 2015. The capital increase became effective upon registration in the Commercial Register on June 9, 2015. Since that date, the Company’s share capital has amounted to EUR 120.0 million and has been divided into 30,000,000 no-par value bearer shares.
The 5,000,000 new shares were issued at a price of EUR 4.00 per share. Subscribed capital increased accordingly by EUR 20.0 million.
Capital reserveThe capital reserve consists of the premium on the issuance of shares, a benefit in kind and cumulated transfers under the PLTA which were paid by Wacker-Chemie Dritte Venture GmbH. The PLTA was canceled as of January 1, 2015.
In the year 2014, the Company entered into a labor support agreement with Wacker Chemie AG. The respective payment amounting to EUR 39.0 million has been treated as a transaction with shareholders and presented in the capital reserve. For further details reference is made to note 22.
In the course of the IPO the subscribed capital increased by EUR 20.0 million because 5,000,000 new shares were issued. The capital increase takes into account the sales price per share of EUR 30.00 less the issue price of EUR 4.00 per share reported in subscribed capital as well as after a reduction of EUR 6.8 million resulting from issuance costs directly attributable to the IPO.
108 ANNUAL REPORT 2015
Consolidated Financial Statements • Notes

Retained earnings and net profit/lossThis item comprises the Group’s cumulative net profit/loss of prior periods, net of dividend payouts.
At the general meeting of the shareholders on March 5, 2014, the Company declared a dividend of EUR 269.5 million. This amount represents retained earnings from the periods before 2009, i.e. before the PLTA was effective and the company was part of the German fiscal unity with Wacker Chemie AG. Dividend distribu-tions are based on the equity available under German commer-cial law.
Management of capitalThe capital management of the Siltronic Group pursues the objective of ensuring a going concern on a sustainable basis and of generating an appropriate return for the shareholders. Instru-ments of capital management include, amongst others, dividend payments. In managing its capital, Siltronic AG complies with the legal stipulations on capital maintenance. The Company’s Articles of Association do not stipulate any capital requirements. Special terms for capital are not used.
Furthermore, the Executive Board is authorized, subject to the approval of the Supervisory Board, to increase subscribed capital until June 7, 2020, by up to a total amount of EUR 60.0 million through the issue of new no-par value bearer shares on one or more occasions (Authorized Capital).
13 Provision for pensions
There are various post-employment pension plans for Group employees, which depend on the legal, economic and fiscal conditions prevailing in the relevant countries. These pension plans generally take into account employees’ service term and salary levels.
The Group operates both defined contribution and defined ben-efit plans. Defined contribution plans lead to no further obliga-tion on the part of the Group company beyond paying contri-butions. Pension obligations result from defined benefit plans in the form of entitlements to pension benefits for eligible active and former employees of the Siltronic Group and their surviving dependents.
German pension fundIn Germany, the plans are administered by Pensionskasse der Wacker Chemie VVaG – a pension fund in the form of a regu-lated mutual insurance carrier legally separated from the Group (and Wacker Chemie Group, too).
Plan for employees until 2004 – defined benefit planEmployees who joined the Company prior to 2004 receive their pension based on a defined benefit obligation, which is financed by payouts from Pensionskasse der Wacker Chemie VVaG. The Company is ultimately responsible for the pension obligations. The pension is based on a certain percentage of the contribution to the plan by the employer and the employee.
Plan for employees starting 2005 – defined contribution planFor employees in Germany who joined in 2005 or later, a basic pension plan award is granted by Pensionskasse der Wacker Chemie VVaG. Their direct contribution-type benefits are financed by employee and company contributions and comprise pensions, disability, and surviving dependents’ benefits. Additionally, employees in Germany may also make voluntary payments to the “PK+” supplementary insurance fund of Pensionskasse der Wacker Chemie VVaG.
In fiscal year 2015, the accounting treatment of the tariff for voluntary increases in insurance cover for employees having joined the Company between 1972 and 2004 was changed. Until fiscal year 2014, this tariff was treated at Siltronic as a defined contribution plan. Due to the persisting low-interest environment, it cannot be reasonably expected for the future that Pensionskasse will generate the guaranteed interest rate of 4 percent in any case. Therefore, we classify this tariff as a defined benefit plan. The transition results in an increase of the obligation’s present value in 2015 by EUR 20.9 million to be recognized in equity. At the same time, additions to plan assets are recorded in equity in the amount of EUR 15.6 million. The effects are included in the table “Development in the net liabil-ity of defined benefit obligations” in the line item “Gains/losses from the changes in experience-based assumptions.” Employees who joined the Company after 2004 receive a guaranteed inter-est rate for voluntary increases in insurance cover of 2.5 percent (2005-2012) and 1.75 percent (since 2013). These tariffs are not included in the determination of the pension obligations since they have to be classified as defined contribution plans due to their insurance-like structure.
ANNUAL REPORT 2015
Consolidated Financial Statements • Notes
109

Benefits by direct commitments – defined benefit plan in GermanyIn addition to the pension fund commitments, employees in Germany receive direct commitments in the form of an addi-tional pension. The additional pension insures salary elements above and beyond the pension insurance contribution assess-ment ceiling. For employees who joined the company before end of 2004, a pension is granted and depends on the average salary earned during the period of employment with the Group (career average plan).
For employees who joined the plan on or after January 1, 2005, the pension is based on a certain percentage of the salary. It is not dependent on the average salary earned during the period of employment.
The benefits may be drawn as a life-long pension or, in the case of commitments from 2005 onward, as a lump sum. Employees and their surviving dependents are eligible to receive benefits.
Deferred compensation plan – defined benefit plan in GermanyEmployees in Germany may elect to contribute to an employee- financed deferred compensation plan. This plan enables employ-ees to waive their portions of their future salary claims into pen-sion benefits in the form of a guaranteed investment contract. Contributions accrue interest according to the guaranteed rate
at either 7 percent (1996 to 2001), 6 percent (2002 to 2010) or 5 percent (2011 to 2013). Plans bearing 7 percent or 6 percent interest may be drawn in the form of either a pension or a lump sum. Plans bearing 5 percent interest are paid out exclusively in lump-sum form.
United StatesVarious pension plans are available for employees of foreign subsidiaries, subject to the statutory provisions applicable in the respective countries. With the exception of the US pension plans, these pension plans are not significant to the Group.
In the United States, defined benefit plans exist for employees of Siltronic Corporation, Portland who have entered the com-pany before end of 2003. Both plans were closed for new entrants after December 31, 2003. Retirement benefits are paid monthly starting at age 65 and are based on the last average salary paid. Special provisions apply to early retirement at age 55 depending on the employee’s years of service. Post-retirement health care and severance benefits are also provided to eligible employees. Hires after 2003 only receive defined contribution benefits.
The present value of defined benefit obligations reconcile with the provisions recognized on the statement of financial position as follows:
Net liability of defined benefit obligations
As of December 31, 2015 As of December 31, 2014
In EUR mn Germany Foreign Total Germany Foreign Total
Present value of funded defined benefit obligations 483.1 128.0 611.1 498.4 121.6 620.0
Fair value of plan assets 359.7 90.0 449.7 350.3 83.5 433.8
Funded status 123.4 38.0 161.4 148.1 38.1 186.2
Present value of unfunded defined benefit obligations 131.3 6.7 138.0 136.5 5.4 141.9
Provisions for pensions and similar obligations 254.7 44.7 299.4 284.6 43.5 328.1
110 ANNUAL REPORT 2015
Consolidated Financial Statements • Notes

Changes in the net liability of defined benefit obligations in the years 2015 and 2014 were as follows:
Changes in the net liability of defined benefit obligations 2015
In EUR mn
Projected benefit plan
obligationFair value of plan assets Total
As of January 1, 2015 761.9 433.8 328.1
Current service cost 19.8 – 19.8
Interest expense and interest income 19.9 11.7 8.2
Remeasurements
Return on plan assets, excluding amounts recognized in interest expense – – 7.2 7.2
Gains/losses from changes in demographic assumptions – 3.5 – – 3.5
Actuarial gains from changes in financial assumptions – 63.6 – – 63.6
Gains/losses from changes in experience-based assumptions 12.1 – 12.1
Effects of exchange-rate differences 14.3 9.4 4.9
Contributions by employer – 11.6 – 11.6
Contributions by employees 2.4 2.4 –
Pension payments – 14.0 – 11.3 – 2.7
Transfers/settlements/other – 0.2 – 0.7 0.5
As of December 31, 2015 749.1 449.7 299.4
2014
In EUR mn
Projected benefit plan
obligationFair value of plan assets Total
As of January 1, 2014 568.5 383.5 185.0
Current service cost 14.6 – 14.6
Interest expense and interest income 22.7 15.2 7.5
Remeasurements
Return on plan assets, excluding amounts recognized in interest expense – 17.3 – 17.3
Gains/losses from changes in demographic assumptions 4.4 – 4.4
Actuarial gains from changes in financial assumptions 155.3 – 155.3
Gains/losses from changes in experience-based assumptions – 6.9 – – 6.9
Effects of exchange-rate differences 13.8 9.1 4.7
Contributions by employer 0.0 16.3 – 16.3
Contributions by employees 2.3 2.3 –
Pension payments – 12.3 – 9.9 – 2.4
Transfers/settlements/other – 0.5 – – 0.5
As of December 31, 2014 761.9 433.8 328.1
ANNUAL REPORT 2015
Consolidated Financial Statements • Notes
111

AssumptionsThe pension obligations are calculated by taking into account company-specific and country specific biometric calculation prin-ciples and parameters. The calculations are based on actuarial valuations that factor in the following parameters:
Assumptions
in %
2015 2014
Germany USA Germany USA
Discount rate 2.75 4.20 2.30 3.80
Salary growth rate 2.50 2.00 – 3.00 2.50 2.00 – 3.00
Pension growth rate 1.80 – 1.80 –
Sensitivity analysisThe following sensitivity analysis involves an adjustment of only one assumption with the other assumptions remaining un changed so that the sensitivity of each individual assumption can be observed in isolation (ceteris paribus).
The following table shows the estimated changes in the present value of pension obligations resulting from changes in the respec-tive actuarial assumptions:
Sensitivity analysis
As of December 31, 2015 As of December 31, 2014
Effect on defined benefit obligation
Effect on defined benefit obligation
Defined benefit obligation in EUR millions
Change in %
Defined benefit obligation in EUR millions
Change in %
Present value of pension obligations as of the reporting date 749 762
Present value of all pension obligations if
the discount rate increases by 0.5% 686 – 8.4 692 – 9.2
the discount rate decreases by 0.5% 821 9.6 842 10.6
salaries increase by 0.5% 757 1.1 771 1.2
salaries decrease by 0.5% 742 – 0.9 753 – 1.1
future pension increases are 0.25% higher 768 2.5 783 2.8
future pension increases are 0.25% lower 731 – 2.4 742 – 2.7
life expectancy increases by one year 772 3.1 787 3.3
112 ANNUAL REPORT 2015
Consolidated Financial Statements • Notes

Composition of plan assetsIn Germany, the plan assets are comprised of insurance policies issued by Pensionskasse der Wacker Chemie VVaG. The insurance carrier invests in mutual funds holding equity and fixed-income securities, asset-backed notes, real estate, and private equity funds. The remaining part of assets is retained for liquidity pur-poses. The investment strategy follows the investment guideline
provided by the executive board of the pension fund. The plan assets of pension funds in the United States are generally invested in equities and funds in accordance with the applicable investment guidelines.
The composition of plan assets for the Group is:
In EUR mn
As of December 31, 2015 As of December 31, 2014
Market price quoted in an
active market
No market price quoted in an
active market Total
Market price quoted in an
active market
No market price quoted in an
active market Total
Real estate – 61.3 61.3 – 59.9 59.9
Loans and fixed-income securities 173.2 95.0 268.2 158.6 105.6 264.2
Equities and equity funds 69.4 39.2 108.6 62.7 29.4 92.1
Liquidity – 11.6 11.6 – 17.6 17.6
Total plan assets 242.6 207.1 449.7 221.3 212.5 433.8
RisksIn addition to the actuarial risks, the risk connected with the defined benefit obligation relates in particular to financial risks connected with plan assets. In Germany, substantial amounts of the defined benefit obligation are covered by plan assets managed by the pension fund. The current and future relationship between the asset allocation in its portfolio and our pension obligations are analyzed and projected as part of an annual asset-liability study to determine the long-term return on plan assets. On that basis, the pension fund defines a strategic target asset alloca-tion, the required return and company contributions. All capital investments are exposed to market price fluctuation risks. These risks may comprise changes in interest rates, equity prices, or exchange rates.
The pension obligations for German employees are partially financed through the Pensionskasse der Wacker Chemie VVaG, supervised by the German Financial Supervisory Authority (Bundesanstalt für Finanzdienstleistungsaufsicht). The Group is
required to make regular contributions to the fund. Due to the low interest rate environment in recent years, the German Finan-cial Supervisory Authority has required the Pensionskasse der Wacker Chemie VVaG to calculate its pension liabilities using a lower discount rate. This has, in turn, caused the Pensionskasse der Wacker Chemie VVaG to demand higher contributions from the Group and its other members.
Actuarial risks arise in particular with the life expectancy of the beneficiaries and the guaranteed rate of return. The pension obli-gations include partly a guaranteed return on the contributions to the plan. In a low interest rate environment there are risks of achieving these guaranteed returns, which is a major focus of the pensions fund Pensionskasse der Wacker Chemie VVaG.
ANNUAL REPORT 2015
Consolidated Financial Statements • Notes
113

Financing of the pension planIn the years 2015 and 2014, benefits in the amount of EUR 9.7 million and EUR 8.6 million, respectively, were paid into pension plans in Germany, and EUR 4.3 million and EUR 3.7 million, respectively, into pension plans outside of Germany. Employer contributions to plan assets will amount to approximately EUR 8.7 million in the year 2016. The expected term of pension obligations as of December 31, 2015 was 19.6 years in Germany and 15.9 years in the United States.
The following table shows the pensions benefits that the Group expects to pay from 2016 to 2020:
Projected payment periods for pension benefits
In EUR mn 2016 2017 2018 2019 2020
15.5 16.6 17.7 19.7 21.7
Pension expenses
For the year ended
In EUR mn 2015 2014
Expenses due to defined benefit plans 28.0 22.0
Expenses due to defined contribution plans 1.3 1.2
Contributions to public pension schemes 15.0 13.6
Other pension expenses 0.9 0.0
Total retirement benefits 45.2 36.8
14 Other provisions and provisions for income taxes
In EUR mn
As of December 31, 2015 As of December 31, 2014
Totalof which
non-currentof which
current Totalof which
non-currentof which
current
Personnel 33.4 30.3 3.1 29.1 26.1 3.0
Environmental protection 0.6 – 0.6 0.5 – 0.5
Restructuring 0.5 0.1 0.4 1.8 0.1 1.7
Sundry 1.9 – 1.9 2.8 – 2.8
Total 36.4 30.4 6.0 34.2 26.2 8.0
Provision for taxes 5.3 – 5.3 4.1 0.1 4.0
114 ANNUAL REPORT 2015
Consolidated Financial Statements • Notes

Provision for personnelThe provision for personnel primarily represents obligations for anniversary payments and early retirement. The provisions for early retirement plans will be completely paid out in six years. The outflow takes place on a continuous basis. The Group owns bonds and securities that serve as plan assets for early retirement benefits and have been offset against the obligations resulting from early retirement.
Provisions for environmental protectionProvisions for environmental protection include costs for antici-pated obligations resulting from potential contamination of soil and water at the Group’s facility in Portland, Oregon, United States. The property is under investigation of releases of certain contaminants, including trichloroethylene that was formerly used by the subsidiary in the United States. Furthermore, prior
owners of the property in Portland caused releases of manufac-tured gas plant waste, herbicides, pesticides, and petroleum products, and other hazardous substances. The Group has in-surance coverage that has provided reimbursement for the majority of the defense, investigation, and remediation costs that the Group has incurred to date. Although substantial cover-age is in place, future defense, investigation, and remediation costs may not be fully reimbursed by the insurance companies.
Provisions for restructuringThe provisions for restructuring comprise severance payments for departing employees, demolition obligations, and similar charges.
The following table shows the development of other provisions for the years 2015 and 2014:
Development of other provisions
In EUR mnJanuary 1,
2015 Utilization Reversal AdditionInterest and
exchange rate Other 1)December 31,
2015
Personnel 29.1 – 7.6 – 11.8 0.5 – 0.4 33.4
Environmental protection 0.5 – 0.4 – 0.4 0.1 – 0.6
Restructuring 1.8 – 0.7 – 0.6 – 0.0 – 0.5
Sundry 2.8 0.0 – 1.3 0.4 0.0 – 1.9
Total 34.2 – 8.7 – 1.9 12.6 0.6 – 0.4 36.4
1) Provisions for early retirement have been offset against corresponding securities.
Provision for taxesThe provision for taxes comprises amounts for current income tax obligations and risks from tax audits. This line item comprises all expected obligations from domestic and foreign entities.
The actual amount of non-current tax provisions will largely turn into payouts over the next two years.
The following table shows the development of the provision for income taxes:
Provision for taxes
In EUR mnJanuary 1,
2015 Utilization Reversal AdditionInterest and
exchange rateDecember 31,
2015
Taxes 4.1 – 4.1 – 5.2 0.1 5.3
ANNUAL REPORT 2015
Consolidated Financial Statements • Notes
115

15 Trade liabilities, other financial and non financial liabilities, and income tax liabilities
In EUR mn
As of December 31, 2015 As of December 31, 2014
Totalof which
non-currentof which
current Totalof which
non-currentof which
current
Trade liabilities 72.1 – 72.1 55.8 – 55.8
Other liabilities
Derivative financial instruments 19.0 0.6 18.4 33.5 3.8 29.7
of which > 5 years – – – – – –
Other non-financial liabilities
Other tax liabilities 3.3 – 3.3 3.0 – 3.0
Social security 0.8 – 0.8 0.8 – 0.8
Payroll 0.7 – 0.7 1.7 – 1.7
Profit-sharing and bonuses 9.9 – 9.9 5.5 – 5.5
Other personnel liabilities 7.3 – 7.3 10.6 – 10.6
Prepayments received 46.3 24.3 22.0 67.1 45.5 21.6
Sundry 1.6 – 1.6 0.7 – 0.7
Total 69.9 24.3 45.6 89.4 45.5 43.9
of which > 5 years – – – – – –
Income tax liabilities 0.2 – 0.2 – – –
Liabilities relating to social security refer in particular to amounts withheld that have not been paid.
The other payroll liabilities include primarily vacation and flextime credits.
Within the scope of long-term supply agreements with customers, the Group has received prepayments for future shipments of wafers. These prepayments will be reduced due to shipments; the amount of the reduction depends on the level of future sales.
The liability from derivative financial instruments represents the negative fair value of these instruments.
16 Financial liabilities
In EUR mn
As of December 31, 2015 As of December 31, 2014
Totalof which
non-currentof which
current Totalof which
non-currentof which
current
Financial liabilities to Wacker Chemie AG – – – 176.0 – 176.0
Other financial liabilities to the Wacker Group – – – 0.1 – 0.1
Total – – – 176.1 – 176.1
Loan from Samsung 38.6 38.6 – 35.8 35.8 –
Financial liabilities 38.6 38.6 – 211.9 35.8 176.1
116 ANNUAL REPORT 2015
Consolidated Financial Statements • Notes

At the end of 2014, Wacker Chemie AG provided Siltronic AG with a credit facility of EUR 150.0 million, which the Group drew and which increased the cash by the same amount. An addi-tional EUR 26.0 million resulted from a negative balance under the cash pooling with Wacker Chemie AG. Both liabilities were repaid in 2015. Non-current financial liabilities include a share-holder loan (from non-controlling interests) in the amount of EUR 38.6 million (including interest) which is due in 2025. The non-controlling interests refer to SSW with its non-controlling shareholder Samsung.
No collateral exists for financial liabilities. Financial liabilities are not secured through liens or similar rights.
17 Other financial obligations and contingencies
The Group leases property, equipment, vehicles, and IT equipment by way of rental agreements and operating leases. With the exception of the property leases that have terms until the year 2040, the rentals and leases have terms up to five years.
In 2015 and 2014, expenses for lease and rent amounted to EUR 7.6 million and EUR 6.1 million, respectively.
Other financial obligations
In EUR mn
As of December 31,
2015
As of December 31,
2014
Obligations from rental and operating lease agreements
due within one year 3.2 2.5
due between one to five years 9.8 6.2
due after five years and more 25.8 29.3
Total 38.8 38.0
As of December 31, 2015, obligations from purchase commit-ments were EUR 48.8 million (prior year: EUR 6.7 million); the commitments primarily related to property, plant and equip-ment.
The Group enters into long-term purchase agreements with mi nimum commitments. These minimum purchasing obligations amounted to EUR 50.2 million and EUR 7.8 million, respectively, as of December 31, 2015 and 2014.
Other disclosures
18 Earnings per share
2015 2014
Net loss attributable to Siltronic AG shareholders in EUR mn – 14.0 – 16.0
Average number of outstanding common shares 27,794,521 25,000,000
Number of common shares outstanding at the end of the year 30,000,000 25,000,000
Earnings per common share in EUR (average) – 0.50 – 0.64
Dividend payment per common share in EUR 10.78
The average number of common shares results from the fact that, up to and including June 10, 2015 (i.e. the day before the IPO), 25,000,000 shares were outstanding, while 30,000,000 shares were outstanding from the IPO date (June 11, 2015) until year-end.
Siltronic AG’s net loss, which is based on the provisions under German commercial law, was transferred from capital reserves.
19 Financial instruments
The following tables show financial assets and liabilities by measure-ment categories and classes for the years ended December 31, 2015 and 2014, respectively. Also presented are liabilities from derivatives for which hedge accounting is used, even though they do not belong to any of the IAS 39 measurement categories.
The fair value of financial instruments measured at amortized cost is determined based on discounting, taking into account customary market interest rates that are adequate to the specific risk and correspond to the relevant maturity. The carrying amount of current items recognized in the statement of financial position approximate fair value. The categories in accordance with IAS 39 differ between assets and liabilities measured at amortized costs and those measured at fair value as shown in the table below. These categories are sufficient to reflect the classes in accor-dance with IFRS 7 which distinguish at minimum financial instru-ments measured at amortized cost from financial instruments measured at fair value. Those financial instruments which show specific risks are derivative financial instruments only pertaining to foreign currency derivatives, which are presented separately in the table below.
ANNUAL REPORT 2015
Consolidated Financial Statements • Notes
117

Financial assets and liabilities by measurement category and class 2015
In EUR mn
Carrying amount as of December 31,
2015
Measurement according to IAS 39
Fair value as of December 31,
2015(Amortized) costFair value through
profit or loss
Fair value through other
comprehensive income
Trade receivables 100.4 100.4 – – 100.4
Other financial assets 55.7 45.8 9.6 0.3 55.7
Loans and receivables – 40.0 – – 40.0
Held-to-maturity securities – 5.8 – – 5.8
Derivatives for which hedge accounting is not used (assets held for trading) – – 9.6 – 7.5
Derivatives for which hedge accounting is used – – – 0.3 2.4
Cash and cash equivalents 154.5 154.5 – – 154.5
Total financial assets 310.6 310.6
of which pursuant to IAS 39 measurement categories:
Loans and receivables 300.7 300.7 – – 300.7
Derivatives for which hedge accounting is not used (assets held for trading) 9.6 – 9.6 – 9.6
Derivatives for which hedge accounting is used 0.3 – – 0.3 0.3
Loans 38.6 38.6 – – 38.6
Recognized at amortized cost – 38.6 – – 38.6
Trade liabilities 72.1 72.1 – – 72.1
Recognized at amortized cost – 72.1 – – 72.1
Other financial liabilities 39.3 20.3 9.1 9.9 39.3
Recognized at amortized cost – 20.3 – – 20.3
Derivatives for which hedge accounting is not used (liabilities held for trading) – – 9.1 – 9.1
Derivatives for which hedge accounting is used – – – 9.9 9.9
Total financial liabilities 150.0 150.0
of which pursuant to IAS 39 measurement categories:
Financial liabilities recognized at amortized cost 131.0 131.0 – – 131.0
Derivatives for which hedge accounting is not used (assets held for trading) 9.1 – 9.1 – 9.1
Derivatives for which hedge accounting is used 9.9 – – 9.9 9.9
118 ANNUAL REPORT 2015
Consolidated Financial Statements • Notes

Financial assets and liabilities by measurement category and class 2014
In EUR mn
Carrying amount as of December 31,
2014
Measurement according to IAS 39
Fair value as of December 31,
2014(Amortized) costFair value through
profit or loss
Fair value through other
comprehensive income
Trade receivables 111.1 111.1 – – 111.1
Other financial assets 20.5 16.3 1.4 2.8 20.5
Loans and receivables – 16.3 – – 16.3
Derivatives for which hedge accounting is not used (assets held for trading) – – 1.4 – 1.4
Derivatives for which hedge accounting is used – – – 2.8 2.8
Cash and cash equivalents 187.4 187.4 – – 187.4
Total financial assets 319.0 319.0
of which pursuant to IAS 39 measurement categories:
Loans and receivables 314.8 314.8 – – 314.8
Derivatives for which hedge accounting is not used (assets held for trading) 1.4 – 1.4 – 1.4
Derivatives for which hedge accounting is used 2.8 – – 2.8 2.8
Loans 211.9 211.9 – – 211.9
Recognized at amortized cost – 211.9 – – 211.9
Trade liabilities 55.8 55.8 – – 55.8
Recognized at amortized cost – 55.8 – – 55.8
Other financial liabilities 52.8 19.4 9.4 24.0 52.8
Recognized at amortized cost – 19.4 – – 19.4
Derivatives for which hedge accounting is not used (liabilities held for trading) – – 9.4 – 9.4
Derivatives for which hedge accounting is used – – – 24.0 24.0
Total financial liabilities 320.5 320.5
of which pursuant to IAS 39 measurement categories:
Financial liabilities recognized at amortized cost 287.1 287.1 – – 287.1
Derivatives for which hedge accounting is not used (assets held for trading) 9.4 – 9.4 – 9.4
Derivatives for which hedge accounting is used 24.0 – – 24.0 24.0
The loans and receivables reported include trade receivables and other loans, as well as cash and cash equivalents. Cash and cash equivalents in foreign currency are measured at the exchange rate on the reporting date. Their carrying amounts approximate their fair values. The fair value of the loans corresponds to the present value of the expected future cash flows. Discounting is carried out on the basis of the interest rates on the reporting date.
Financial assets include available-for-sale securities and shares in funds for securing obligations resulting from early retirement. The fair values of the securities match their quoted prices.
ANNUAL REPORT 2015
Consolidated Financial Statements • Notes
119

The carrying amounts of trade liabilities and current other lia-bilities approximate their fair values. The fair values of financial liabilities constitute the present value of the expected future cash flows. Discounting is carried out on the basis of the interest rates as of the reporting date.
The following table shows the net gains and losses from financial instruments by measurement category.
Net result by measurement category
In EUR mn 2015 2014
Loans and receivables 7.0 6.6
Available-for-sale financial assets – 0.1 0.0
Financial liabilities recognized at amortized cost – 1.9 – 2.3
Total 5.0 4.3
The net result of the category “Loans and receivables” was pri-marily due to net losses and gains from exchange rate effects, interest income from financial assets, and bank balances (net of valuation allowances).
The category “Available-for-sale financial assets” includes interest income from fixed-interest securities.
Gains and losses from changes in the fair value of foreign exchange rates which do not meet the requirements of IAS 39 for hedge accounting are recorded in the category “fair value through profit or loss.” The effects of fair value hedge accounting are reported here as well.
The interest income from financial assets which are not re - cognized at fair value through profit or loss amounts to EUR 0.2 million in 2015 and EUR 0.1 million in 2014. This inter-est income primarily comes from deposits and loans.
The interest expenses from financial liabilities which are not recog-nized at fair value through profit or loss were EUR 2.1 million in 2015 and EUR 2.0 million in 2014.
The net losses in the category “Financial liabilities recognized at amortized cost” primarily consist of interest expenses on financial liabilities and effects resulting from valuations with different foreign exchange rates.
The financial assets and liabilities measured at fair value in the statement of financial position were allocated to one of three categories in accordance with the fair value hierarchy described in IFRS 13.
The levels of the hierarchy are as follows.
Level I. Financial instruments measured using quoted prices in active markets (markets showing appropriate liquidity) which are representative to the financial instrument being measured.
Level II. Financial instruments measured using valuation methods based on observable market data, the fair value of which can be determined using similar financial instruments traded in active markets or using valuation methods all of whose parameters are observable. These include hedging and non-hedging derivative financial instru-ments and loans.
Level III. Financial instruments measured using valuation methods not based on observable parameters, the fair value of which cannot be determined using observable market data and which require application of different valua-tion methods (typically applied for over-the-counter derivatives and unquoted equity instruments).
The following tables show the categories in the fair value hierarchy to which the financial assets and liabilities measured at fair value in the statement of financial position are allocated. The tables also show financial assets and liabilities measured at cost in the statement of financial position; numbers represent fair values.
120 ANNUAL REPORT 2015
Consolidated Financial Statements • Notes

Fair value hierarchy
In EUR mn
As of December 31, 2015
Level I Level II Level III Total
Financial assets measured at fair value
Fair value through profit or loss
Derivatives for which hedge accounting is not used (assets held for trading) – 9.6 – 9.6
Fair value through other comprehensive income
Derivatives for which hedge accounting is used – 0.3 – 0.3
Total – 9.9 – 9.9
Financial liabilities measured at fair value
Fair value through profit or loss
Derivatives for which hedge accounting is not used (liabilities held for trading) – 9.1 – 9.1
Fair value through other comprehensive income
Derivatives for which hedge accounting is used – 9.9 – 9.9
Total – 19.0 – 19.0
Financial liabilities recognized at amortized cost: – 38.6 – 38.6
In EUR mn
As of December 31, 2014
Level I Level II Level III Total
Financial assets measured at fair value
Fair value through profit or loss
Derivatives for which hedge accounting is not used (assets held for trading) – 1.4 – 1.4
Fair value through other comprehensive income
Derivatives for which hedge accounting is used – 2.8 – 2.8
Total – 4.2 – 4.2
Financial liabilities measured at fair value
Fair value through profit or loss
Derivatives for which hedge accounting is not used (liabilities held for trading) – 9.4 – 9.4
Fair value through other comprehensive income
Derivatives for which hedge accounting is used – 24.0 – 24.0
Total – 33.4 – 33.4
Financial liabilities recognized at amortized cost: – 211.9 – 211.9
Market values are calculated using information available on the reporting date and based on counterparties’ quoted prices or via appropriate valuation methods (discounted cash-flow or well-established actuarial methodologies, such as the par method).
Derivative financial instruments are recognized at fair value and are thus subject to a recurring fair value assessment. They are categorized as Level II fair values.
ANNUAL REPORT 2015
Consolidated Financial Statements • Notes
121
The fair value of a derivative financial instrument is calculated based on market data such as exchange rates or yield curves in accordance with market-specific valuation methods. The calcu-lation of the fair value reflects our and the counterparty’s default risk, using maturity-matching and market-observable CDS values.
As of December 31, 2014, financial liabilities measured at amor-tized cost include a credit facility with Wacker Chemie AG, a loan from Samsung, SSW’s non-controlling shareholder, and a negative balance under the treasury management arrangement with Wacker Chemie AG. Their fair value is determined using the net present value method and is based on standard market interest rates. As of December 31, 2015, the line item only includes the loan from Samsung.
Disclosures on derivative financial instrumentsIn cases where the Group hedges against foreign currency risks, it uses derivative financial instruments which comprise currency forward exchange contracts, currency option contracts, and currency foreign exchange swaps. Derivatives are used only if they are offset by scheduled transactions arising from operations (underlying transactions). The scheduled transactions also include expected transactions. The derivatives relate to three areas which are called “strategic hedging,” “operational hedging,” and “hedging of specific intra-group matters.”
Strategic hedging comprises expected sales transactions in foreign currency which are not yet invoiced. The time horizon for strategic hedging is between three and a maximum of 21 months. The hedged cash flows influence the statement of profit or loss at the time when sales are realized. The cash inflows are usually recorded shortly afterward, depending on the due date. Strategic hedging is carried out using currency forward exchange contracts and currency option contracts.
Operational hedging relates to recognized trade receivables and trade liabilities and generally covers time horizons of between one and three months. Hedges are executed with currency for-ward exchange contracts.
Hedging of specific intra-group matters, especially intra-group-loans, are usually covered by currency swap contracts.
Foreign exchange hedging is carried out mainly for the US dollar, Japanese yen and Singapore dollar.The market values refer to the repurchase values (redemption values) of the financial derivatives and are calculated using recog-nized actuarial methods.
The derivatives are recognized at their market values, irrespective of their stated purpose. They are reported in the statement of financial position under other assets or other liabilities. Where eligible, cash flow hedge accounting is applied for the strategic hedging of currency exchange risks from future foreign exchange cash flows. In such cases, changes in the market values of for-eign exchange contracts and changes in the intrinsic values of currency options are recognized in other comprehensive income until the underlying transaction takes place, insofar as the hedge is effective. When future transactions are realized, the effects accumulated in other equity items are reversed through profit or loss.
For strategic hedging purposes, staggered hedging ratios of between 30 percent and 50 percent are used in relation to the expected net exposure in US dollars (where applicable, taking into account currencies showing a high correlation with the US dollar). The expected net exposure on US dollar basis for 2016 is approximately 50 percent hedged, with the expected addi-tional net exposure for 2017 amounting to approximately 20 percent hedged.
The accumulated unrealized gains and losses recorded directly in other equity items at December 31 included unrealized gains and losses from cash flow hedges of EUR – 13.2 million in 2015 and losses of EUR – 21.2 million in 2014. In the loss for the period, gains or losses from hedge ineffectiveness were insignif-icant, as the hedging relationships were almost entirely effective.
Depending on the nature of the underlying transaction, cash flow hedges are posted in the statement of profit or loss under the operating result or, if financial liabilities are being hedged, under net interest income or other financial result.
122 ANNUAL REPORT 2015
Consolidated Financial Statements • Notes

Nominal values and market values
In EUR mn
As of December 31, 2015 As of December 31, 2014
Nominal values Market values Nominal values Market values
Foreign currency derivatives 754.4 – 9.2 734.1 – 29.3
Market values for derivative financial instruments within hedge accounting – – 7.6 – – 21.2
The foreign exchange derivatives contain forward exchange contracts and currency options with nominal amounts of USD 360.0 million, JPY 17.4 billion, and SGD 469.7 million as of December 31, 2015. Derivatives with market values of EUR – 9.5 million are due in 2016 and of EUR 0.3 million due in 2017.
The following table provides information on the netting of finan-cial assets and liabilities in the consolidated statement of financial position. It also shows the financial effects of a possible setting off of financial instruments from netting agreements, enforce-able global netting agreements, or similar agreements.
Netting of financial assets and liabilities
As of December 31, 2015
In EUR mn
I
Gross amounts of recognized
financial assets / liabilities
II Gross amounts
of recognized financial assets /
liabilities set off in the statement of financial position
I – II Net amounts of
financial assets / liabilities
presented in the statement of
financial position
Related amounts not set off in the statement of financial position
Net amountFinancial
instruments
Cash collateral received
Derivatives with a positive market value 10.0 0.1 9.9 4.0 – 5.9
Derivatives with a negative market value – 19.1 – 0.1 – 19.0 – 4.0 – – 15.0
As of December 31, 2014
In EUR mn
I
Gross amounts of recognized
financial assets / liabilities
II Gross amounts
of recognized financial assets /
liabilities set off in the statement of financial position
I – II Net amounts of
financial assets / liabilities
presented in the statement of
financial position
Related amounts not set off in the statement of financial position
Net amount
Financial instruments
Cash collateral received
Derivatives with a positive market value 5.4 1.2 4.2 3.9 – 0.3
Derivatives with a negative market value – 34.6 – 1.2 – 33.4 – 3.9 – – 29.5
In addition to the amounts offset under the provisions on netting pursuant to IAS 32, the table also includes those amounts that may not be netted pursuant to IAS 32.
ANNUAL REPORT 2015
Consolidated Financial Statements • Notes
123

As a part of strategic hedging of foreign currency cash flows, the Group closes out forward-exchange contracts prior to matu-rity by offsetting transactions. The strategic forward exchange contract and the corresponding offsetting forward exchange transaction are recognized as a net amount in accordance with IAS 32. In addition, general offsetting agreements, which apply only in cases of insolvency, have been concluded with a number of banks.
The Group has not received any pledged cash security for posi-tive market values of derivatives nor pledged any cash security for negative market values.
Management of financial risksThe following disclosures explain the management of the finan-cial risks of the Group. Other parts of these notes include more quantitative information to financial assets and financial liabilities or contingencies.
In the normal course of business, the Group is exposed to credit, liquidity, and market risks from financial instruments. The goal of financial risk management is to limit risks from operating business and the resultant financing requirements by using cer-tain derivative and non-derivative hedging instruments.
In terms of assets, liabilities, and planned transactions, the Group faces risks resulting from the fluctuation of foreign exchange rates. Changes in interest rates and equity prices do not play a significant role for the Group.
Generally, only those risks which have an impact on the cash flow of the Group are hedged. To mitigate default risks, hedging instruments are only entered with counterparties of high credit rating.
The basic rules of financial management are determined by the Executive Board and monitored by the Supervisory Board of the Group. The Executive Board has the overall responsibility for the implementation and monitoring of the risk management of the Group. Part of this system is the management of financial risks. Among other things, the system for managing financial risks has a guideline defining the usage and the extent of derivative financial instruments and committees supervising the application of the guideline, evaluating the efficiency of the derivative finan-cial instruments entered and defining additional risk limits when necessary.
The Group mitigates financial risks through the risk manage-ment system it has in place. This system is monitored by the Supervisory Board. The fundamental purpose of the risk manage-ment system is to identify, analyze, coordinate, monitor, and communicate risks in a timely manner. The Executive Board of the Group receives regular analyses on the extent of those risks. The analyses focus on market risks, in particular on the potential impact of raw-material price risks, foreign-currency exchange risks, and interest rate risks on net interest income.
Foreign currency risksForeign currency risks generally result from investments, financing measures, and operating business. The Group hedges foreign currency risks as far as it can influence the cash flow of the Group. Foreign currencies which do not influence the cash flow of the Group result from the translation of assets and liabilities of foreign subsidiaries (or the investment in SSW before the company was consolidated into the Group) into euro. Such risks are not hedged because they refer to long-term investments.
Since it is very common in the semiconductor industry to transact in US dollar and the proceeds for the Group from the sale of products (operating business) significantly exceed the cash-out-flows in US dollar (operating business and investments), the Group faces a US dollar foreign exchange risk. The Group also faces foreign exchange risk related to the Japanese yen and the Singapore dollar.
The net exposure for foreign currency, i.e. the amount in the same foreign currencies (or currencies put together because of high correlations) remaining after eliminating cash inflows and cash outflows, is hedged according to the Group policy.
In the finance area, the Group is exposed to currency risks from a loan denominated in foreign currency which exists for the Group’s financing purposes in relation to a company. This loan was provided by a non-controlling shareholder in foreign cur-rency. When material, these risks are hedged against currency exchange rates and swaps are used as hedging instruments.
124 ANNUAL REPORT 2015
Consolidated Financial Statements • Notes

To record market risks, IFRS 7 requires sensitivity analyses which show the results from hypothetical changes of relevant risk vari-ables on profit or loss and on equity. The periodical changes are calculated by applying the hypothetical changes of the risk vari-ables on all existing financial instruments as of the reporting date. The sensitivity analyses regarding foreign exchange have the following presumptions:
The existing primary monetary financial instruments (cash and cash equivalents, receivables, interest bearing, and non-interest bearing liabilities) as of the reporting date represent a normal level. In the future, approximately 70 percent of consolidated sales, which is the current level, will be invoiced in US dollar. Payouts in foreign currency remain on the current level which is dependent on the production level. Thus, the Group is only opposed to foreign currency exchange risks coming from trade receivables not hedged and the change in fair value of existing derivative financial instruments.
If the US dollar had increased or decreased by 10 percent against the euro as of December 31, 2015, the fair value of the hedging instruments would have been approximately EUR 13.0 million lower or approximately EUR 19.2 million higher, respectively. The corresponding change in fair value as of December 31, 2014 would have been EUR 25.5 million. The change would have been recorded in other comprehensive income. If the Yen had increased or decreased by 10 percent against the euro as of December 31, 2015, the fair value of the hedging instruments would have changed by EUR 7.6 million. The corresponding change in fair value at December 31, 2014 would have been EUR 6.7 million.
Interest rate riskSince the Group had no material interest bearing net liabilities at the reporting date and does not expect to face major net liabilities, interest rate risks are not hedged. Further, due to the fact that the derivatives related to foreign currencies are not subject to significant changes in interest rates, no interest rate risk arises thereof.
Other price risksThe Group does not face any material other market price risks, which generally result from stock market prices.
Credit risk (risk of default)In terms of financial instruments, the Group is exposed to a default risk should a contractual party fail to fulfill its commit-ments. The maximum risk is therefore the amount of the respec-tive financial instrument’s positive fair value. To limit the risk of default, transactions are conducted only within defined limits and with partners of very high credit standing. To make efficient risk management possible, the market risks within the Group are controlled centrally. The conclusion and handling of trans-actions comply with internal guidelines and are subject to mon-itoring procedures that take account of the separation of duties. As for operations, outstanding receivables and default risks are continually monitored and partly hedged against by means of trade credit insurance. Receivables from major customers are not so high as to represent an extraordinary concentration of risks. The Group has implemented rules to monitor receivables including dunning and stop of shipments. Default risks are accounted for by impairment, taking advance payments received into account.
To minimize the credit risk resulting from all base transactions related to the original financial instruments, collateral (e.g. retention of title) is requested or credit information and refer-ences respectively are obtained or historical data from prior business relationships, especially payment behavior, is used to avoid payment default. The measure depends on the type and amount of transaction. As far as default risk can be recognized for individual financial assets, such risks are covered by specific reserves for bad debt.
In the last three years the expense for default was on average less than 0.2 percent of sales.
ANNUAL REPORT 2015
Consolidated Financial Statements • Notes
125

Liquidity riskA liquidity risk means that a company may not be able to meet its existing or future financial obligations because of insufficient funds. The Group ensures continuous liquidity and financial flex-ibility by holding enough funds as cash and cash equivalents. Financing through loans plays a minor role.
The liquidity status of the Group is monitored by comparing cash outflows for each of the next three months with the cash pro-ceeds. In addition, actual cash flows are compared to forecasted cash flows to detect unplanned developments early. Moreover, a cash flow forecast on a monthly rolling basis is in place cover-ing the period to the end of the year. This forecast is in accor-dance with the monthly forecasts of statement of profit or loss and statement of financial position which are also covering the period to the end of the year. By these means the Company ensures that it will meet financial liabilities without negatively affecting its reputation.
According to the policy of the Group, guarantees are generally issued only to fully-owned subsidiaries. No guarantees had been issued as of the years ended December 31, 2015 or 2014.
Market riskMarket risk describes the risk that the fair value or future cash flows of an original or derivative financial asset will change due to the volatility of the market.
Term depositsTerm deposits are investments held at banks. The terms of the deposits run until March 2016.
20 Notes to the Statement of Cash Flows
Before the IPO, the Group was primarily financed by the cash pooling system with Wacker Chemie AG and a loan granted by Wacker Chemie AG. In the course of the IPO, the loan was repaid to Wacker and cash pooling has been performed at Siltronic AG level since that date.
Cash and cash equivalents shown in the statement of cash flows comprise cash and credit balances at banks if the maturity is within three months.
21 Segment reporting
The Group has only one reportable segment, which includes the development, production, and marketing of semiconductor wafers with a wide variety of features satisfying numerous product specifications to meet customers’ precise technical specifications, which are utilized in the manufacture of semiconductor devices. Based on the fact that in the wafer industry the allocation of resources is derived from a wide variety of specifications, the Group operates only in one segment. The products can differ between diameters, between polished and epitaxial wafer, between different pulling technologies and other features.
The geographical information during the reporting periods was as follows:
Segment information by region
In EUR mn
2015
Germany
Europe excluding Germany,
plus Israel United States Taiwan Japan
Asia excluding
Taiwan and Japan
Consoli- dation
Siltronic Group
External sales by customer location 56.8 118.4 133.2 179.9 77.0 366.0 – 931.3
Additions to property, plant and equipment and intangible assets 49.2 – 2.2 – – 23.6 – 75.0
Non-current assets (December 31) 226.8 – 9.9 – 0.1 319.5 16.3 572.6
126 ANNUAL REPORT 2015
Consolidated Financial Statements • Notes

In EUR mn
2014
Germany
Europe excluding Germany,
plus Israel United States Taiwan Japan
Asia excluding
Taiwan and Japan
Consoli- dation
Siltronic Group
External sales by customer location 56.8 100.0 121.9 192.2 62.6 312.5 – 846.0
Additions to property, plant and equipment and intangible assets 27.2 – 0.9 – – 12.6 – 40.7
Non-current assets (December 31) 229.8 – 8.7 – 0.1 346.2 16.6 601.4
The sales in the region Asia excluding Taiwan and Japan primarily relate to South Korea, China, and Singapore.
In 2015, the Group realized sales with two customers with a share of 15 percent and 13 percent, respectively, in consolidated sales. In 2014, sales with two customers constituted 13 percent each of consolidated sales.
22 Related party disclosures
The disclosure requirements according to IAS 24 refer to trans-actions (i) with its controlling parent Wacker Chemie AG and the ultimate controlling shareholder of Wacker Chemie AG, which is Dr. Alexander Wacker Familiengesellschaft mbH (hold-ing more than 50 percent of the voting shares in Wacker Chemie AG), (ii) with SSW before consolidation, (iii) between SSW and Samsung, the non-controlling shareholder of SSW (after consol-idation), (iv) with Wacker Pensionskasse, and (v) with members of the Executive Board and Supervisory Board of the Company.
The amounts recorded in the statement of profit or loss resulting from transactions with related parties were as follows:
Related party disclosures
For the year ended
In EUR mn Dec. 31, 2015 Dec. 31, 2014
Sales 148.3 119.3
Purchased material and services (primarily cost of sales) 162.8 178.8
Interest income 0.0 0.6
Interest expense 1.9 0.0
In 2015 and 2014, sales include research and development services for EUR 3.8 million and EUR 2.0 million, respectively, to Wacker Chemie AG. The Group recognized sales with SSW of EUR 0.8 million in 2014 before acquisition on January 24, 2014. Sales were generated by license fees, services, and the sale of some intermediate products. Sales with related parties include sales with Samsung of EUR 140.8 million in 2015 and EUR 113.2 million in 2014. Interest expense due to Samsung amounted to EUR 1.3 million in 2015 and EUR 1.1 million in 2014.
The cost of sales primarily relates to (i) the purchase of the major raw material polysilicon from Wacker Chemie AG, (ii) a services framework agreement the Company has entered into with Wacker Chemie AG covering technical engineering, materials management and procurement, site services at the production facility in Burghausen, and corporate administrative services, and (iii) to wafers purchased from SSW for trade purposes (before consolidation).
ANNUAL REPORT 2015
Consolidated Financial Statements • Notes
127

The following table shows inventories, receivables from and liabilities to related parties recorded in the statement of financial position for the years ended December 31, 2015 and 2014:
Inventories, receivables from and liabilities to related parties
For the year ended
In EUR mn Dec. 31, 2015 Dec. 31, 2014
Inventories 10.4 12.3
of which Wacker Chemie 10.4 12.3
Trade receivables 5.7 10.6
of which Samsung und SSW 5.7 10.6
Other assets 1.8 9.8
of which advance payment to Wacker Pensionskasse 0.2 9.5
Financial liability to Wacker Chemie AG 0.0 176.0
Financial liability to Samsung 38.6 35.8
Trade liabilities 13.8 9.6
of which Wacker Chemie 13.8 9.6
Other liabilities 39.4 54.1
of which prepayment from Samsung 38.8 54.1
The inventories relate to shipments of raw materials supplied by Wacker Chemie AG.
Samsung’s prepayment represented a cash inflow for the year 2014 amounting to EUR 54.6 million. As of December 31, 2014, the prepayments due to Samsung resulting from the prepay-ments SSW received in 2014 and earlier amounted to EUR 54.1 million. Due to shipments, prepayments went down to EUR 38.8 million as of December 31, 2015.
In December 2014, the Company entered into a labor support agreement (the “Labor Support Agreement”) with Wacker Chemie AG pursuant to which the Company agreed that Wacker Chemie AG will hire up to 500 of the Company’s employees by the end of 2019. Pursuant to the Labor Support Agreement, Wacker Chemie AG agreed to hire these employees, establish new employment agreements with them, and to assume all compensation obligations resulting from their employment by the Company (including agreed benefits, deferred compensation and bonuses) other than any compensation which has already vested at the time of employment by Wacker Chemie AG.
In return, the Company agreed to a payment of EUR 78,000 to Wacker Chemie AG for each of the up to 500 employees to be transferred to Wacker Chemie AG for a total of EUR 39.0 million, which the Company paid to Wacker Chemie AG in December 2014. In addition, the Company agreed to compensate Wacker Chemie AG for compensation obligations resulting from such employees’ employment with us (including agreed benefits, deferred compensation and bonuses), calculated on the basis of provisions the Company made with respect to such compensa-tion obligations in accordance with IFRS.
Under the PLTA, Wacker-Chemie Dritte Venture GmbH absorbed losses of EUR 15.5 million for the year 2014. This was recognized as transfers to the capital reserve.
23 Other information
The following table shows the personnel employed on average during the year.
Average number of employees
Number 2015 2014
Non-production staff 1,252 1,324
Production staff 2,752 2,937
Total 4,004 4,261
Costs for auditors are separated into audit and other advisory services. The latter mainly relate to costs for special services, especially provided for the IPO.
Audit fees
In EUR mn 2015 2014
Audit of financial statements 0.6 0.6
Other audit services 0.3 0.0
Total 0.9 0.6
The Wacker Group reimbursed Siltronic AG an amount of EUR 0.4 million for the audit of financial statements (of which EUR 0.3 million relate to the prior year) and EUR 0.2 million for other non-audit services.
128 ANNUAL REPORT 2015
Consolidated Financial Statements • Notes

Disclosures for remuneration of members of the Executive Board and the Supervisory Board
Remuneration of members of the Executive Board and Supervisory Board
EUR Fixed
remunerationVariable
remuneration Pensions Total
Remuneration for Executive Board members 2015 737,247 759,935 159,219 1,656,401
2014 674,226 472,500 103,080 1,249,806
Provisions for pensions for active Executive Board members 2015 2,686,036 2,686,036
2014 2,462,078 2,462,078
Remuneration for former Executive Board members and their surviving dependants
2015 260,215 260,215
2014 131,910 131,910
Remuneration for former Supervisory Board members and their surviving dependants
2015 6,679,034 6,679,034
2014 6,660,418 6,660,418
Supervisory Board remuneration 2015 396,809 396,809
2014 222,500 222,500
Remuneration for pensions consists of service costs and interest costs.
Detailed information on the remuneration of the Executive Board members are included in the remuneration report. The remu-neration report is part of the management report and includes
disclosures which are part of the notes under German commercial law.
The list of shareholdings in affiliated companies as of December 31, 2015 is as follows (IFRS amounts):
List of shareholdings
2015
Share capital in
kEURNet income in
kEUREquity share
in %
Siltronic Holding International B.V., Krommenie, The Netherlands 1) 318,255 37,585 100.0
Siltronic Singapore Pte. Ltd., Singapore 2) 127,417 43,707 100.0
Siltronic Silicon Wafer Pte. Ltd., Singapore 2) – 29,252 – 22,850 77.7
Siltronic Asia Pte. Ltd., Singapore 2) 846 805 100.0
Siltronic Corp., Portland, Oregon, USA 2) 23,557 6,696 100.0
Siltronic Japan Corp., Tokyo, Japan 2) – 13,569 26 100.0
1) Held directly by Siltronic AG 2) Held indirectly by Siltronic AG
ANNUAL REPORT 2015
Consolidated Financial Statements • Notes
129

Non-controlling interestsAfter obtaining control of SSW on January 24, 2014, the non- controlling interests (NCI) of 22.3 percent in SSW are held by Samsung. The proportion of ownership equals the voting rights.
The summarized financial information of SSW is as follows:
Summarized financial information of SSW
In EUR mn 2015 2014
As of December 31
Non-current assets 268.0 292.1
Current assets 82.2 75.6
Non-current liabilities – 310.0 – 310.0
Current liabilities – 54.7 – 45.5
Net assets – 14.5 12.2
NCI percentage 22.3 22.3
Carrying amount of NCI 3.2 2.7
For the periodJanuary 01 to December 31
January 24 to December 31
Sales 176.1 153.0
Net loss – 27.7 – 48.9
Other comprehensive income – –
Total comprehensive loss – 27.7 – 48.9
Net loss allocated to NCI – 6.2 – 10.8
For the periodJanuary 01 to December 31
January 24 to December 31
Cash flow from operating activities 25.0 79.3
Cash flow from investing activities – 21.1 – 10.8
Cash flow from financing activities 0.1 – 75.6
Net increase/decrease in cash and cash equivalents 4.0 – 7.1
There were no dividends paid to non-controlling interests.
24 Subsequent events
Subsequent to December 31, 2015, there were no adjusting events.
These consolidated financial statements were authorized for issue by the Executive Board on March 3, 2016.
Dr. Christoph von Plotho Rainer Irle(CEO) (CFO)
130 ANNUAL REPORT 2015
Consolidated Financial Statements • Notes

Appendix to the Notes to the Consolidated Financial Statements
Major shareholder notifications
Shareholder
Date on which the reporting threshold
for voting shares was reached Notification
Wacker-Chemie Dritte Venture GmbH, Munich June 10, 2015 Shareholding, at 75.00 percent, has reached the reporting threshold of 75.0 percent
Wacker Chemie AG, Munich June 10, 2015 Shareholding stands at 83.33 percent, of which 75.00 percent is attributable to Wacker-Chemie Dritte Venture GmbH
Dr. Alexander Wacker Familiengesellschaft mbH, Munich June 10, 2015 Shareholding stands at 83.33 percent; all shares held through Wacker Chemie AG and Wacker-Chemie Dritte Venture GmbH
Citigroup Inc., Wilmington, Delaware, USA
June 10, 2015
Shareholding of 16.67 percent reached; all shares held through Citigroup Financial Products Inc, Wilmington, Delaware, USA,
Citigroup Global Markets Limited, Wilmington, Delaware, USA, Citigroup Global Markets Europe Limited, London, United Kingdom,
and Citigroup Global Markets Holdings Inc., New York, New York, USA
Dr. Alexander Wacker Familiengesellschaft mbH, Munich
June 15, 2015
Shareholding, at 57.83 percent, has fallen below the reporting threshold of 75.0 percent; all shares held through
Wacker Chemie AG and Wacker-Chemie Dritte Venture GmbH
Wacker Chemie AG, Munich June 15, 2015
Shareholding, at 57.83 percent, has fallen below the reporting threshold of 75.0 percent; 49.50 percent of the
shares are held through Wacker Chemie Dritte Venture GmbH
Wacker-Chemie Dritte Venture GmbH, Munich June 15, 2015 Shareholding, at 49.50 percent, has fallen below the reporting thresholds of 75.0 percent and 50.0 percent
Citigroup Global Markets Holdings Inc., New York, USA, Citigroup Financial Products Inc, Wilmington, Delaware, USA, Citigroup Global Markets Europe Limited, London, United Kingdom, Citigroup Global Markets Limited, London, United Kingdom, Citigroup Global Markets Limited, Wilmington, Delaware, USA
June 15, 2015
Shareholding, at 0.00 percent, has fallen below the reporting thresholds of 15.0 percent,
10.0 percent, 5.0 percent and 3.0 percent
MainFirst SICV, Senningerberg, Luxembourg June 15, 2015 Shareholding, at 4.17 percent, has exceeded the reporting threshold of 3.0 percent
Baupost Group Securities LLC, Boston, Massachusetts, USA
June 15, 2015
Shareholding, at 8.66 percent, has exceeded the reporting thresholds of 3.0 percent and 5.0 percent; held through
Baupost Group Securities, LLC, Boston, Massachusetts, USA
Wellington Management Group LLP, Boston, Massachusetts, USA
June 17, 2015
Shareholding, at 3.01 percent, has exceeded the reporting threshold of 3.0 percent; held through
Wellington Group Holdings LLP, Wellington Investment Advisors Holdings LLP,
Wellington Management Company LLP, all in Wilmington, Delaware, USA
MainFirst SICV, Senningerberg, Luxembourg June 15, 2015 Shareholding, at 5.06 percent, has exceeded the reporting threshold of 5.0 percent
Baupost Value Partners, L.P.-IV, Wilmington, Delaware, USA
August 14, 2015
Shareholding, at 3.01 percent, has exceeded the reporting threshold of 3.0 percent;
held through Baupost Group Securities, LLC, Boston, USA
Wellington Management Group LLP, Boston, Massachusetts,USA and subsidiaries Wellington Group Holdings LLP, Wellington Investment Advisors Holdings LLP, Wellington Management Company LLP
February 02, 2016
Shareholding, at 2.84 percent, has fallen below the reporting threshold of 3.0 percent
Morgan Stanley, Wilmington, Delaware, USA
February 22, 2016
Shareholding, at 6.46 percent, has exceeded the reporting thresholds of 3.0 percent and 5.0 percent; held through
Morgan Stanley & Co. International plc, London, United Kingdom
Morgan Stanley, Wilmington, Delaware, USA February 24, 2016 Shareholding, at 1.87 percent, has fallen below the reporting thresholds of 3.0 percent and 5.0 percent
ANNUAL REPORT 2015
Consolidated Financial Statements • Notes
131

Additional information
Auditor’s report
We have audited the consolidated financial statements prepared by Siltronic AG, Wiesbaden, Germany – comprising the consol-idated statement of financial position, consolidated statement of profit and loss, consolidated statement of comprehensive income, consolidated statement of changes in equity, consoli-dated statement of cash flows, and the notes to the consolidated financial statements – and the group management report for the financial year from January 1 to December 31, 2015. The preparation of the consolidated financial statements and the group management report in accordance with International Financial Reporting Standards (IFRS), as adopted by the EU, and the additional provisions under German commercial law pursuant to section 315a (1) of the German Commercial Code (HGB) is the responsibility of the Company’s Executive Board. Our res-pon sibility is to express an opinion on the consolidated financial statements and the group management report based on our audit.
We conducted our audit of the consolidated financial statements in accordance with section 317 HGB and German generally accepted standards for the audit of financial statements promul-gated by the Institute of Public Auditors in Germany (IDW). Those standards require that we plan and perform the audit such that misstatements materially affecting the presentation of the assets, liabilities, financial position and profit or loss of the Group in the consolidated financial statements in accordance with the applicable accounting principles and in the group management report are detected with reasonable assurance. Knowledge of
the business activities and the economic and legal environment of the Group and expectations as to possible misstatements are taken into account in the determination of audit procedures. The effectiveness of the accounting-related internal control system and the evidence supporting the disclosures in the consolidated financial statements and the group management report are examined primarily on a test basis within the framework of the audit. The audit includes assessing the annual financial statements of the entities included in consolidation, the scope of consoli-dation, the accounting and consolidation principles used and significant estimates made by the Executive Board, as well as evaluating the overall presentation of the consolidated financial statements and group management report. We believe that our audit provides a reasonable basis for our opinion.
Our audit has not led to any reservations.
In our opinion, based on the findings of our audit, the consoli-dated financial statements of Siltronic AG, Wiesbaden, Ger-many, comply with IFRS, as adopted by the EU, and the addi-tional provisions under German commercial law pursuant to section 315a (1) HGB and give a fair presentation of the assets, liabilities, financial position and profit or loss of the Group in accordance with these requirements. The group management report is consistent with the consolidated financial statements and as a whole provides a suitable view of the Group’s position and suitably presents the opportunities and risks of future devel-opment.
Munich, March 3, 2016KPMG AG Wirtschaftsprüfungsgesellschaft
Pastor HanshenWirtschaftsprüfer Wirtschaftsprüfer(German public auditor) (German public auditor)
132 ANNUAL REPORT 2015
Additional information • Auditor’s report

Responsibility statement
To the best of our knowledge, and in accordance with the appli-cable reporting principles, the consolidated financial statements give a true and fair view of the assets, liabilities, financial position and profit or loss of the Group, and the management report of the Group includes a fair review of the development and perfor-mance of the business and the position of the Group, together with a description of the principal opportunities and risks asso-ciated with the expected development of the Group.
Munich, March 3, 2016The Executive Board of Siltronic AG
Dr. Christoph von Plotho Rainer Irle(CEO) (CFO)
133ANNUAL REPORT 2015
Additional information • Responsibility statement

Further disclosures on offices held
Supervisory Board
Dr. Tobias OhlerChairman (since December 12, 2015)MunichMember of the Executive Board of Wacker Chemie AG
Member of the Supervisory Board– Pensionskasse
Wacker Chemie VVaG (since December 1, 2015)
Johann Hautz*Deputy chairman (since January 1, 2016)BurghausenChairman of the works council of Siltronic AG, Burghausen plant
Maximilian Baumgartner*MarktlHead of Operation Processes, Siltronic AG
Sieglinde FeistGrasbrunnHead of Corporate Development, Wacker Chemie AG
Gebhard Fraunhofer*(since January 1, 2016)Simbach am InnChairman of the general works council of Siltronic AG
Walter Ortner*(until December 31, 2015)Deputy chairman (until December 31, 2015)Former chairman of the general works council of Siltronic AG
Dr. Joachim Rauhut(until December 11, 2015)Chairman (until December 11, 2015)Munich Member of the Executive Board of Wacker Chemie AG (until October 31, 2015)
Member of the Supervisory Board– MTU Aero Engines Holding AG– B. Braun Melsungen AG– Stabilus S.A. (since May 12, 2015)– Pension fund
of Wacker Chemie VVaG (until October 31, 2015)
Member of the Advisory Board– J. Heinrich Kramer Holding GmbH
Member of the Regional Advisory Committee South– Commerzbank AG
Dr. Franz RichterEichenauManaging Director of Thin Materials GmbH
Chairman of the Board of Directors– Scint-X AB
Member of the Board of Directors– Meyer Burger AG
* Employee representative
Dr. Hermann GerlingerAalenMember of the Executive Board of Carl Zeiss AG,Chief Executive Officer of Carl Zeiss SMT GmbH
Karin Gottschalk*Brand-ErbisdorfDeputy chairman of the works council of Siltronic AG, Freiberg plant
Bernd Jonas(since May 7, 2015) Essen Attorney
Chairman of the Supervisory Board– Hoesch AG
Member of the Supervisory Board– ThyssenKrupp Elevator AG– ThyssenKrupp Industrial
Solutions AG
Member of the Board of Directors– ThyssenKrupp Canada, Inc.
Gertraud Lauber*Bad Münder Secretary of the Mining, Chemical and Energy Industrial Union (IG BCE), Energy Transition/ Sustainability Department
Member of the Advisory Board– Labor and Environmental Foundation
of the IG BCE
134 ANNUAL REPORT 2015
Additional information • Further disclosures on offices held

Harald Sikorski*Munich District manager at IG BCE, Altötting
Member of the Supervisory Board– Wacker Chemie AG
Auguste Willems(until May 7, 2015) Munich Member of the Executive Board of Wacker Chemie AG
Member of the Advisory Board for Bavaria– TÜV Süd AG
Angela Wörl(since January 4, 2016) Munich Head of HR/Social Affairs, Wacker Chemie AG
Member of the Supervisory Board– Pensionskasse Wacker Chemie VVaG (since December 1, 2015)
Supervisory Board committeesConciliation CommitteeDr. Tobias Ohler (since December 12, 2015, chairman)Johann Hautz* (since January 1, 2016) Angela Wörl (since January 20, 2016) Gebhard Fraunhofer* (since January 20, 2016)
Dr. Joachim Rauhut (until December 11, 2015) Walter Ortner* (until December 31, 2015) Harald Sikorski* (until December 31, 2015)
Audit Committee (since May 8, 2015)Bernd Jonas (chairman) Harald Sikorski* (since January 1, 2016) Dr. Tobias Ohler (since December 12, 2015)
Dr. Joachim Rauhut (until December 11, 2015) Walter Ortner* (until December 31, 2015)
Executive CommitteeDr. Tobias Ohler (chairman) (since December 12, 2015) Johann Hautz* (since January 1, 2016) Dr. Hermann Gerlinger
Dr. Joachim Rauhut (until December 11, 2015) Walter Ortner* (until December 31, 2015)
Nomination Committee (since May 8, 2015) Dr. Tobias Ohler (chairman) (since December 12, 2015)Dr. Hermann Gerlinger
Dr. Joachim Rauhut (until December 11, 2015)
Executive Board
Dr. Christoph von PlothoPresident & Chief Executive OfficerMarketing & SalesTechnologyApplication TechnologyOperationsSupply ChainQualityEngineeringSite Management, Burghausen & FreibergSiltronic SingaporeLegal & ComplianceInvestor Relations & CommunicationsCorporate Development
Member of the Board of Directors of the following affiliated companies:– Siltronic Silicon Wafer Pte. Ltd.– Siltronic Singapore Pte. Ltd.– Siltronic Asia Pte. Ltd.– Siltronic Corporation– Siltronic Japan Corporation
Rainer IrleChief Financial Officer & Labor Relations DirectorFinance & TaxFinancial Planning & ReportingRisk Management & AuditITPurchasingHuman ResourcesSiltronic USA
Member of the Board of Directors of the following affiliated companies:– Siltronic Corporation– Siltronic Japan Corporation
* Employee representative
135ANNUAL REPORT 2015
Additional information • Further disclosures on offices held

Quarterly overview 2015
Q4 2015 Q3 2015 Q2 2015 Q1 2015
Statement of profit or loss
Sales EUR mn 215.3 230.6 246.7 238.7
EBITDA EUR mn 23.2 29.3 31.4 40.1
EBITDA margin % 10.8 12.7 12.7 16.8
EBIT EUR mn – 6.1 0.3 0.2 8.3
EBIT margin % – 2.8 0.1 0.1 3.5
Net profit/loss for the period EUR mn – 8.8 – 6.2 – 7.0 1.9
Earnings per share EUR – 0.25 – 0.15 – 0.20 0.13
Capital expenditure and free cash flow
Capital expenditure in property, plant and equiment, and intangible assets EUR mn – 34.4 – 27.2 – 9.1 – 4.3
Free cash flow EUR mn – 10.5 1.2 7.1 39.6
Statement of financial position
Total assets EUR mn 1,040.8 1,037.8 1,071.9 1,103.5
Equity EUR mn 497.3 501.7 500.9 197.5
Equity ratio % 47.8 48.3 46.7 17.9
ROCE % – 3.3 0.2 0.1 4.2
Net financial debt (+) / liabilities (-) EUR mn 155.9 166.2 166.1 16.1
136 ANNUAL REPORT 2015
Additional information • Quarterly overview 2015

Multi-year overview
2015 2014 2013 2012
Statement of profit or loss
Sales EUR mn 931.3 846.0 743.0 868.0
Gross profit EUR mn 162.9 76.6 84.2 81.1
Gross margin % 17.5 9.1 11.3 9.3
EBIT EUR mn 2.7 – 17.1 – 95.7 – 84.0
EBIT margin % 0.3 – 2.0 – 12.9 – 9.7
EBITDA EUR mn 124.0 132.1 26.4 8.8
EBITDA margin % 13.3 15.6 3.6 1.0
Financial result EUR mn – 12.2 – 7.7 – 3.4 – 0.4
Income taxes EUR mn – 10.6 – 2.2 – 10.2 – 6.2
Net profit/loss for the period EUR mn – 20.1 – 27.0 – 109.3 – 90.6
Earnings per share EUR – 0.50 – 0.64 – 4.37 – 3.93
Capital expenditure and free cash flow
Capital expenditure on property, plant and equiment, and intangible assets EUR mn – 75.0 – 40.7 – 30.5 – 72.7
Free cash flow EUR mn 37.4 113.5 16.4 – 121.7
Adjusted key financial indicators*
Adjusted sales EUR mn 931.3 853.4 875.5 1,030.0
Adjusted EBIT EUR mn 2.7 – 31.6 – 87.3 – 75.5
Adjusted EBIT margin % 0.3 – 3.7 – 10.0 – 7.3
Adjusted EBITDA EUR mn 124.0 117.7 112.6 122.5
Adjusted EBITDA margin % 13.3 13.8 12.9 11.9
Adjusted capital expenditure in property, plant and equipment and intangible assets EUR mn – 75.0 – 40.7 – 39.7 – 144.3
Adjusted free cash flow EUR mn 37.4 86.3 64.7 – 134.4
Statement of financial position
Total assets EUR mn 1,040.8 1,070.5 1,093.0 1,133.9
Equity EUR mn 497.3 311.8 790.2 748.3
Equity ratio % 47.8 29.1 72.3 66.0
ROCE % 0.4 – 2.4 – 13.8 – 11.0
Net financial debt (+) / liabilities (-) EUR mn 155.9 – 24.5 12.5 11.5
Employees** 3,894 4,163 3,744 3,975
* The adjustments relate to the years 2012-2014 and are based on the assumption that SSW would have been consolidated prior to January 1, 2012. Initial consolidation of SSW into the consolidated financial statements was made as of January 24, 2014. In addition, restructuring costs for the year 2012 in the amount of €16.4 million were excluded. The adjustments are not in compliance with IFRS.** Increase in 2014 mainly attributable to consolidation of SSW
137ANNUAL REPORT 2015
Additional information • Multi-year overview

Glossary
Cash flowA financial metric representing the net amount of cash and cash equivalents flowing into and out of a business during a period. Net cash flow is the sum of cash flow from operating activities (excluding the change in advance payments received) and cash flow from current investing activities (excluding securities but including additions from finance leases).
EBITEarnings before interest and tax. This standardized metric is used by many companies, making it useful for comparing profit.
EBITDAEarnings before interest, taxes, depreciation and amortization = EBIT + depreciation and amortization.
Equity ratioA company’s equity expressed as a percentage of its total assets. This metric provides an indication of a company’s economic and financial stability.
IFRSInternational Financial Reporting Standards (until 2001: In ternational Accounting Standards, IAS). These standards are developed and published by the International Accounting Standards Board (IASB), which is based in London, UK. Under the IAS Regulation, adoption of IFRS has been mandatory for listed companies headquartered in the European Union since 2005.
SemiconductorA substance whose electrical conductivity is much lower than that of a metal but increases rapidly as the temperature rises. Semiconductors can be changed by deliberately introducing impurities in order to adapt them for a particular purpose.
ROCEReturn on capital employed. This metric is calculated from a company’s profit relative to the amount of capital it has used.
PolysiliconHyperpure silicon used to manufacture silicon wafers for the electronics and solar industries. Raw silicon is added to liquid trichlorosilane and extensively distilled before being separated again in a hyperpure form at a temperature of 1,000 degrees Celsius.
ppt = parts per trillion10 –12 = one part per trillionThe unit ‘ppm’ (parts per million) is frequently used in mass spectrometry, for example to measure impurities in a pure substance.
SiliconThe second most abundant element on Earth after oxygen. In nature, silicon can only be found in the form of compounds, predominantly silicon dioxide and silicates. Silicon is obtained in an energy-intensive reaction between quartz sand and carbon. It is the most important raw material for the electronics industry.
Silicon waferA round disk with a thickness of approximately 200 to 800μm. Silicon wafers are used by the semiconductor industry to man-ufacture semiconductor components, i.e. integrated circuits and individual components (known as discrete components).
138 ANNUAL REPORT 2015
Additional information • Glossary

Financial calendar
March 16, 2016 Annual Report 2015April 28, 2016 Interim Reporting Q1 2016May 12, 2016 Annual General MeetingJuly 28, 2016 Interim Report Q2 2016October 27, 2016 Interim Reporting Q3 2016
Contact Petra Müller Director Investor Relations & CommunicationsPhone +49 89 8564 3133Fax +49 89 8564 [email protected]
Imprint
This annual report is published bySiltronic AGHanns-Seidel-Platz 481737 Munich, GermanyPhone +49 89 8564 3000Fax +49 89 8564 [email protected]
Annual report concept, design and realizationHGB Hamburger Geschäftsberichte GmbH & Co, KG, Hamburg
Note on the Annual ReportThis Annual Report is also available in German. If there are differences between the two, the German version takes priority. The Annual Report is available as pdf document. Note on roundingPlease note that slight differences may arise as a result of the use of rounded amounts and percentages.
DisclaimerThis annual report contains forward-looking statements based on assumptions and estimates made by Siltronic’s Executive Board. Although we assume that the expectations in these forward looking statements are realistic, we cannot guarantee they will prove to be correct. The assumptions may harbor risks and uncertainties that may cause the actual figures to differ considerably from the forward-looking statements. Factors that may cause such discre-pancies include, among other things, changes in the economic and business environment, variations in exchange and interest rates, the introduction of competing products, lack of acceptance for new products or services, and changes in corporate strategy. Siltronic does not plan to update the forward looking statements, nor does it assume the obligation to do so. Due to rounding, it is possible that individual figures in this report and other reports do not exactly add up to the total stated and that percentages shown may not exactly reflect the absolute values to which they refer.

Siltronic AGHanns-Seidel-Platz 481737 Munich, GermanyPhone +49 89 8564 3000Fax +49 89 8564 [email protected]