author(s) 内山, 進 citation issue date text versionetd ...«–文.pdf · determination of the...
TRANSCRIPT
Title Study on the thermal transition of collagenmodel peptides in solution
Author(s) 内山, 進
Citation
Issue Date
Text Version ETD
URL https://doi.org/10.11501/3155321
DOI 10.11501/3155321
rights
Study on The Thermal Transition of Collagen
Model Peptides in Solution
Susumu Uchiyama
Faculty of Pharmaceuical Sciences
Osaka University
1999
Study on the thermal transition of collagen model peptides in solution
A Doctoral Thesis Submitted to the Graduate School of Pharmaceutical Sciences
Osaka University
Susumu Uchiyama
1999
Contents
General Introduction 1
Chapter I
Phase transition of collagen model peptides observed by microcalorimetry
I-1. Introduction
1-2. Experimental 5 Sample preparations
Differential scanning calorimetric (DSC) measurements UV absorption measurements
1-3. Results and discussion 6
Chapter II
Measurement of thermodynamic quantities of thermal transitions of collagen model peptides
II-1. Introduction 11 11-2. Experimental
Sample preparations Differential scanning calorimetric (DSC) measurements
UV absorption and circular dichroism (CD) measurements 11-3. Results and discussion 12
Heating rate dependence a fthe transition temperatures Determination of the equilibrium thermodynamic quantities of the transition
Linear relationship between enthalpy change and entropy changes a fthe transition Relation to the extended phase transition
Chapter III
NMR observation of the thermal transition of (Pro-Pro-Gly)10
III-1. Introduction 111-2. Experimental 18
Sample preparations NMR measurements
111-3. Results and discussion 19 Assainments of 1H and13C-111MR spectra of (Pro-Pro-Gly)io
Temperature dependence of1H chemical shifts The phase transition observed by NMR spectra
Chapter IV
The partial molar volume of collagen model peptides
IV-1 Introduction 26 Partial molar volume
Partial molar volume of proteins and peptides IV-2 Experimental 30
Sample preparations
Concentrations of the protein and peptide solutions
Density measurements
IV-3 Results and discussion 31 Water content of collagen model peptides
Partial specific volume of collagen model peptides
Conclusion 38
References 39
List of publications 42
Acknowledgments 43
General Introduction
The collagens are a family of the fibrous proteins that are widely distributed
throughout multicellular animals [1]. They are the major proteins of the extracellu-
lar matrix, such as skin and bone, and form higher order structures unique to the
location in which they are expressed. Recently, collagens have been applied to in-
dustrial uses as useful biomaterials and thus have received much attention.
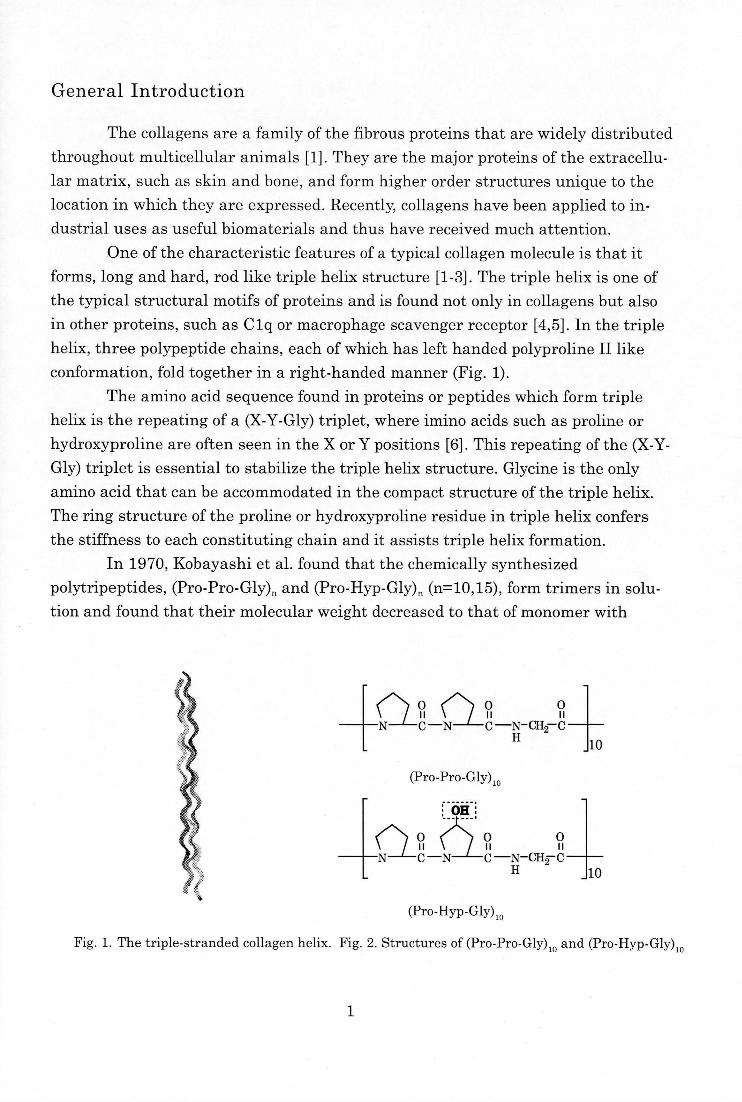
One of the characteristic features of a typical collagen molecule is that it
forms, long and hard, rod like triple helix structure [1-3]. The triple helix is one of
the typical structural motifs of proteins and is found not only in collagens but also
in other proteins, such as C lq or macrophage scavenger receptor [4,5]. In the triple
helix, three polypeptide chains, each of which has left handed polyproline II like
conformation, fold together in a right-handed manner (Fig. 1).
The amino acid sequence found in proteins or peptides which form triple
helix is the repeating of a (X-Y-Gly) triplet, where imino acids such as proline or
hydroxyproline are often seen in the X or Y positions [6]. This repeating of the (X-Y-
Gly) triplet is essential to stabilize the triple helix structure. Glycine is the only
amino acid that can be accommodated in the compact structure of the triple helix.
The ring structure of the proline or hydroxyproline residue in triple helix confers
the stiffness to each constituting chain and it assists triple helix formation.
In 1970, Kobayashi et al. found that the chemically synthesized
polytripeptides, (Pro-Pro-Gly)„ and (Pro-Hyp-Gly)„ (n=10,15), form trimers in solu-tion and found that their molecular weight decreased to that of monomer with
Fig. 1. The triple-stranded collagen helix. Fig. 2. Structures of (Pro-Pro-Gly)th and (Pro-Hyp-Gly)io
1
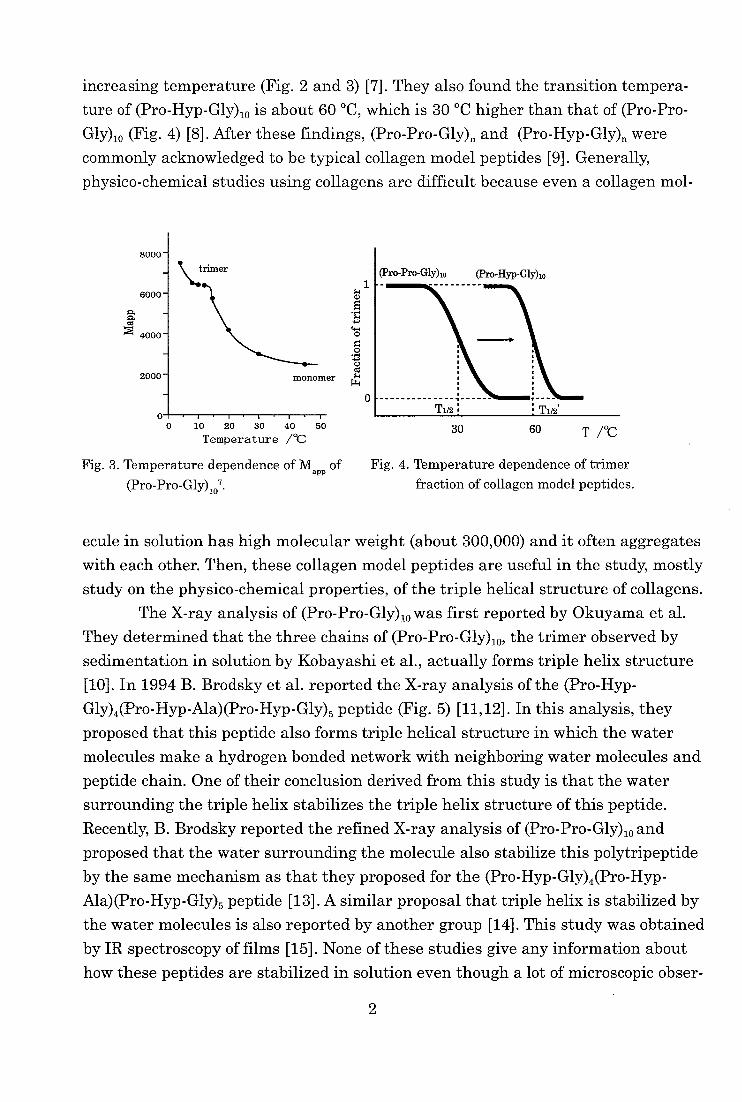
increasing temperature (Fig. 2 and 3) [7]. They also found the transition tempera-
ture of (Pro-Hyp-Gly),0 is about 60 °C, which is 30 °C higher than that of (Pro-Pro-
Gly)io (Fig. 4) [8]. After these findings, (Pro-Pro-Gly)n and (Pro-Hyp-Gly)„ were
commonly acknowledged to be typical collagen model peptides [9]. Generally,
physico-chemical studies using collagens are difficult because even a collagen mol-
8000
6000
sm. sm.
4000
2000
0 10 20 30 40 50 Temperature /°C
Fig. 3. Temperature dependence of Mapp of
(Pro-Pro-Gly)107.
i-i CI)
• § 7-I -1,
0 0 0
• . .4. C.) et i-1
fr—i
1
0
30 60 T 1°C
Fig. 4. Temperature dependence of trimer
fraction of collagen model peptides.
ecule in solution has high molecular weight (about 300,000) and it often aggregates
with each other. Then, these collagen model peptides are useful in the study, mostly
study on the physico-chemical properties, of the triple helical structure of collagens.
The X-ray analysis of (Pro-Pro-Gly)iowas first reported by Okuyama et al.
They determined that the three chains of (Pro-Pro-Gly)10, the trimer observed by
sedimentation in solution by Kobayashi et al., actually forms triple helix structure
[10]. In 1994 B. Brodsky et al. reported the X-ray analysis of the (Pro-Hyp-Gly)4(Pro-Hyp-Ala)(Pro-Hyp-Gly)5 peptide (Fig. 5) [11,12]. In this analysis, they
proposed that this peptide also forms triple helical structure in which the water molecules make a hydrogen bonded network with neighboring water molecules and
peptide chain. One of their conclusion derived from this study is that the water surrounding the triple helix stabilizes the triple helix structure of this peptide.
Recently, B. Brodsky reported the refined X-ray analysis of (Pro-Pro-Gly)10 and
proposed that the water surrounding the molecule also stabilize this polytripeptide by the same mechanism as that they proposed for the (Pro-Hyp-Gly)4(Pro-Hyp-
Ala)(Pro-Hyp-Gly)5 peptide [13]. A similar proposal that triple helix is stabilized by
the water molecules is also reported by another group [14]. This study was obtained
by IR spectroscopy of films [15]. None of these studies give any information about
how these peptides are stabilized in solution even though a lot of microscopic obser-
2
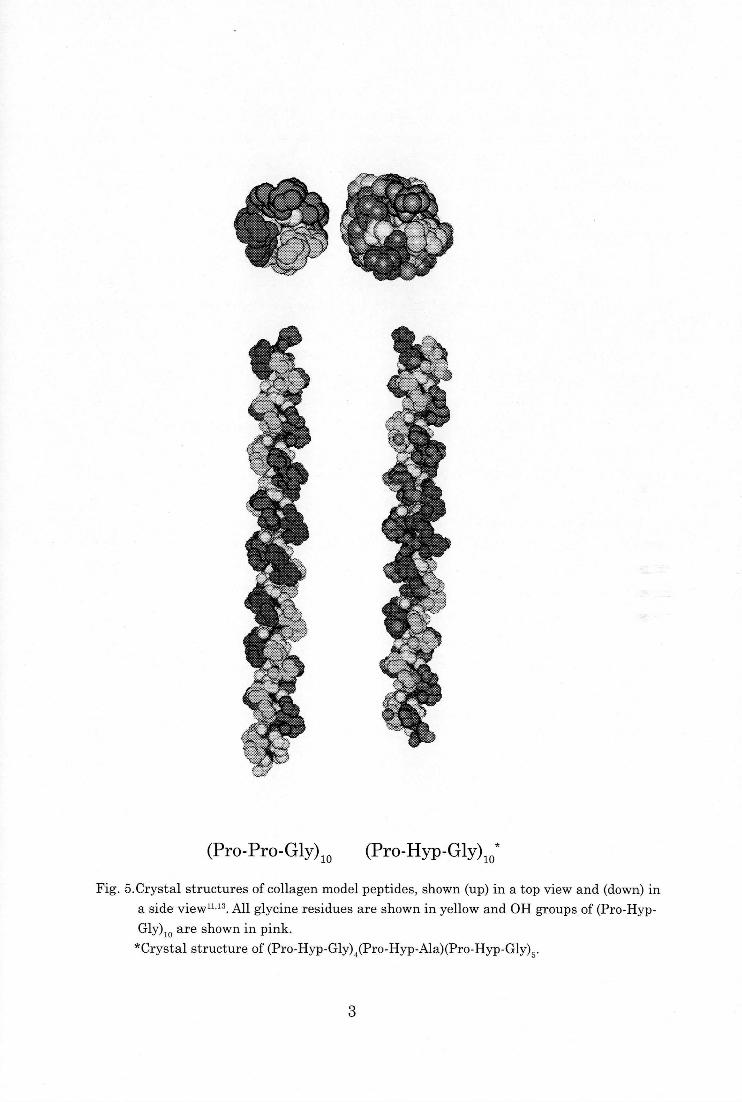
(Pro-Pro-Gly)10 (Pro-Hyp-Gly),0*
Fig. 5.Crystal structures of collagen model peptides, shown (up) in a top view and (down) in
a side viewu ". All glycine residues are shown in yellow and OH groups of (Pro-Hyp-
Gly),0 are shown in pink. *Crystal structure of (Pro -Hyp-Gly)
,(Pro-Hyp-Ala)(Pro-Hyp-Gly),.
3
vations using ORD, CD and NMR spectroscopy have already been done [15-20]. In
additions, theoretical analyses of the mechanism of the forming triple helix struc-
ture have also been made [21-23]. Owing to the lack of sufficient information on
macroscopic quantities of the transition of these polypeptides, the mechanism of
stabilization of triple helix structure in solution is still not known.
The author studied collagen model peptides in solutions, in order to deduce
the mechanism of transition in solution, especially on formation of trimer (three
stranded triple helix) and on transition of the three stranded triple helix to a single
chains in solution by using various detailed physico-chemical methods systemati-
cally. The author studied both (ProProGly),„ and (Pro-Hyp-Gly)10, and also (Pro-Pro-
Gly)5 and (Pro-Hyp-Gly)5 which all exist in solution as single chains at room tem-
perature, thereby expecting to obtain information on the single chains in solution. Sedimentation analysis, differential scanning calorimetry and densitometry of the
solution were performed to clarify the macroscopic properties. From a microscopic
point of view, the circular dichroism and ultra violet spectroscopy as well as nuclear magnetic resonance spectroscopy were made.
In Chapter I, the author provides a thermodynamic interpretation of the
transition from the three stranded triple helix to a single chain for the collagen
model peptides and suggests that the transition can be understood as a phase tran-
sition. In chapter II, the author estimates the thermodynamic quantities of the -
transition from the three stranded triple helix to single chains for the collagen
model peptides. In chapter III, the author describes the NMR studies of the transi-
tion of collagen model peptides. New transition at a lower temperature was ob-
served. This transition depicts a transition of a triple helix at low temperature to a
triple helix at higher temperature before the transition to single chains. In Chapter
IV, the transition from the three stranded triple helix to single chains is found
experimentally, in the first time, to accompany by discrete increases in the partial
molar volume which is important to interpreting the nature of the transition.
4
Chapter I
Phase transition of collagen model peptides observed by microcalorimetry
I-1 Introduction
In the last four decades, many experimental [17,18,24-26] and theoretical
[27-32] studies have been made on the transition of proteins in solution. Most of these works have focused on the transition of the proteins under equilibrium
conditions or on the processes to attain equilibrium states. Studies of non-sta-
tionary states [33-35] should equally be important, because the system of inter-
est often exists as a non-stationary states, but the lack of experimental evidence
has so far limited a detailed discussion on the physical significance of the transi-
tion dynamics in non-stationary states.
In this chapter, the author has investigated the non-stationary states ob-
served in the transition of the sequenced polytripeptides, (Pro-Pro-Gly)lo and
(Pro-Hyp-Gly)10, as a model of fibrous protein by two complementary methods: microcalorimetry and ultraviolet (UV) absorption spectrometry.
To investigate non-stationary states, thermal transitions of these sequenced
polytripeptides were measured by a Privalov type microcalorimeter together with an UV spectrometer at various scanning rates in temperature.
We have observed a shift of peaks caused by changing in the scanning rates
in the Cp-temperature measurements on the transition of the polytripeptides.
The observation of a distinguished peak shift in microcalorimetry is of special
importance, because it is indicative of a general extension of the definition of the
first-order phase transition.
1-2 Experimental
Sample preparations
The samples of (Pro-Pro-Gly)10 and (Pro-Hyp-Gly)lo synthesized by the
Merrifield methods were purchased from Peptide Institute Inc., Japan. These
samples were first dissolved in hot water at 80°C. After keeping the solution for
1 hour at this temperature, the solution was gradually cooled in a room at 22°C
and then kept at 10 °C for further measurements. The concentration of each
solution was determined by precise amino acid analysis.
Differential scanning calorimetric (DSC) measurements
A Privalov type adiabatic differential scanning microcalorimeter (DASM-
5
4M) [36,37] was used to determine the excess heat capacity at constant pressure,
Cp. An active compensation without delay was achieved by controlled heating with
rectangular constant-frequency impulses of regulated duration so that no calibra-
tion at each heating rate was necessary [24]. The temperature at the cell was cali-
brated by the boiling temperatures of ethanol and methanol.
UV absorption measurements
The temperature dependence of the UV absorption spectra of (Pro-Pro-Gly)io
was also measured by an ultraviolet spectrometer (Shimadzu UV2200). The accu-
racy of the optical density measurements was ±0.001 °C. The temperature at the
cell was controlled by circulating water from a programmable regulating tempera-
ture controlling bath.
1-3 Results and discussion
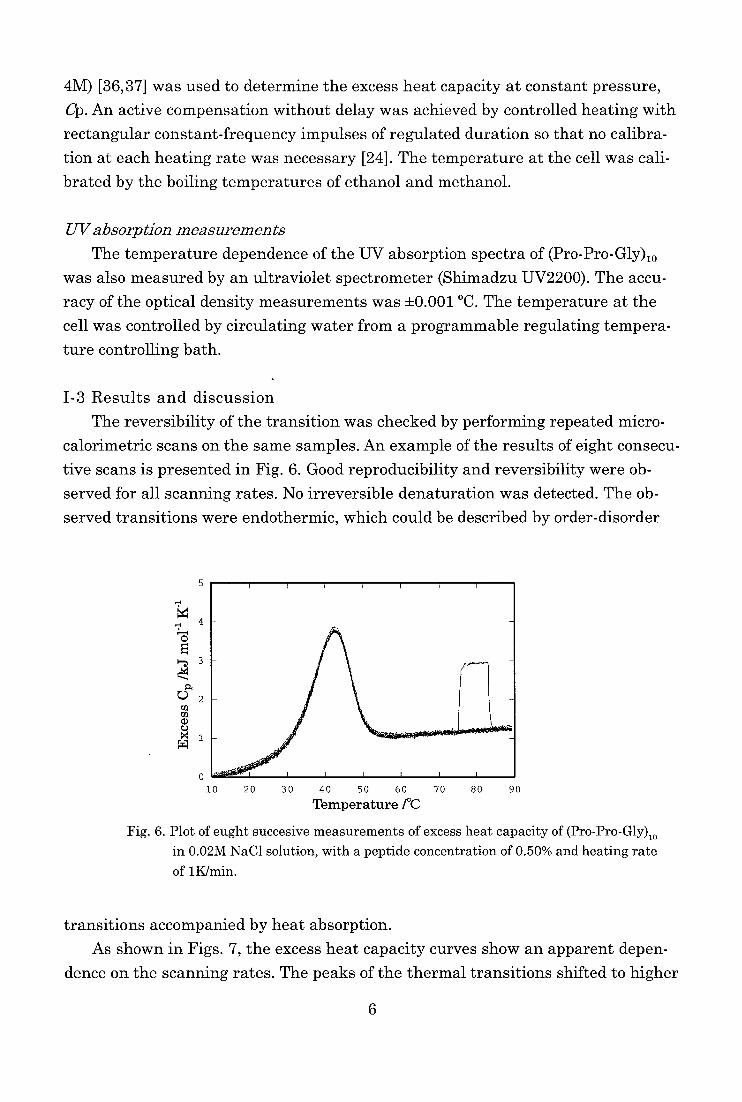
The reversibility of the transition was checked by performing repeated micro-
calorimetric scans on the same samples. An example of the results of eight consecu-
tive scans is presented in Fig. 6. Good reproducibility and reversibility were ob-
served for all scanning rates. No irreversible denaturation was detected. The ob-
served transitions were endothermic, which could be described by order-disorder
O
E 1-D
O U
SC
5
4
3
2
1
I I I ^ I I 1 0 .......-- , 10 20 30 40 50 60 70 80 90
Temperature 1°C
Fig. 6. Plot of eught succesive measurements of excess heat capacity of (Pro-Pro-Gly)io
in 0.02M NaC1 solution, with a peptide concentration of 0.50% and heating rate
of 1K/min.
transitions accompanied by heat absorption.
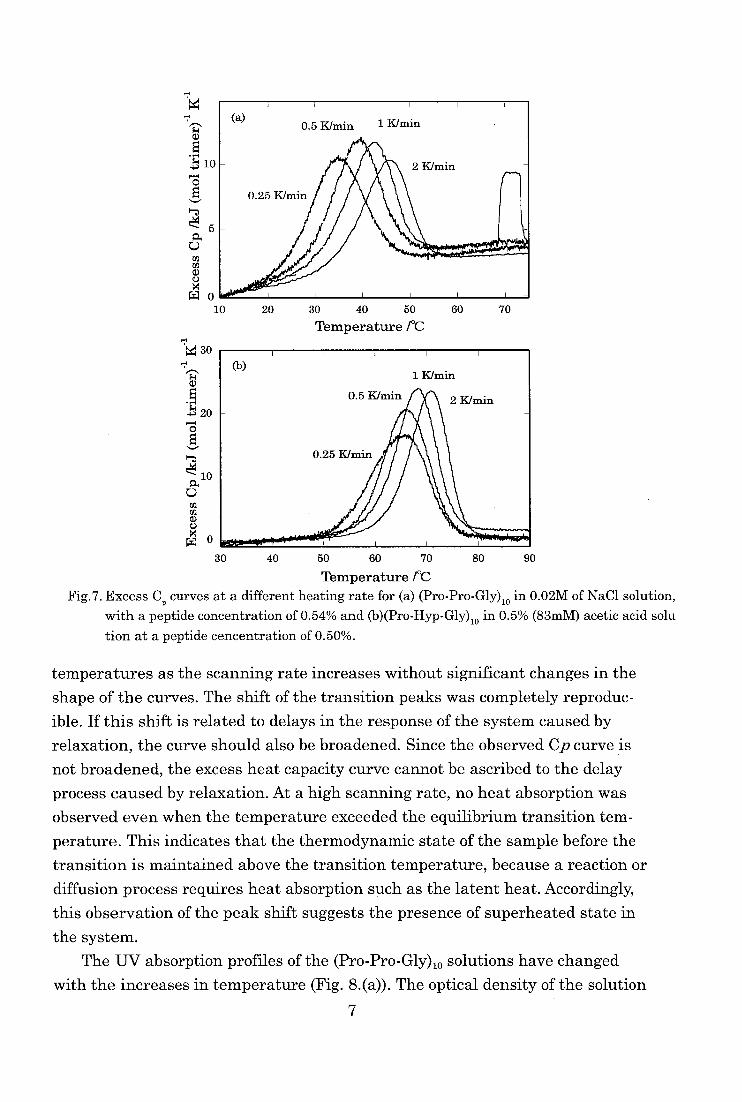
As shown in Figs. 7, the excess heat capacity curves show an apparent depen-
dence on the scanning rates. The peaks of the thermal transitions shifted to higher
6
a)
10
5 S:24
C—) ti)
a)
W 0
30
20
0
5
(/)
0
10 20 30 40 50
Temperature /°C
60 70
30 40 50 60 70 80 90
Temperature 1°C
Fig.7. Excess C,, curves at a different heating rate for (a) (Pro-Pro-Gly)io in 0.02M of NaC1 solution, with a peptide concentration of 0.54% and (b)(Pro-Hyp-Gly)io in 0.5% (83mM) acetic acid solu
tion at a peptide cencentration of 0.50%.
temperatures as the scanning rate increases without significant changes in the
shape of the curves. The shift of the transition peaks was completely reproduc-
ible. If this shift is related to delays in the response of the system caused by
relaxation, the curve should also be broadened. Since the observed Cp curve is
not broadened, the excess heat capacity curve cannot be ascribed to the delay
process caused by relaxation. At a high scanning rate, no heat absorption was observed even when the temperature exceeded the equilibrium transition tem-
perature. This indicates that the thermodynamic state of the sample before the transition is maintained above the transition temperature, because a reaction or
diffusion process requires heat absorption such as the latent heat. Accordingly,
this observation of the peak shift suggests the presence of superheated state in
the system.
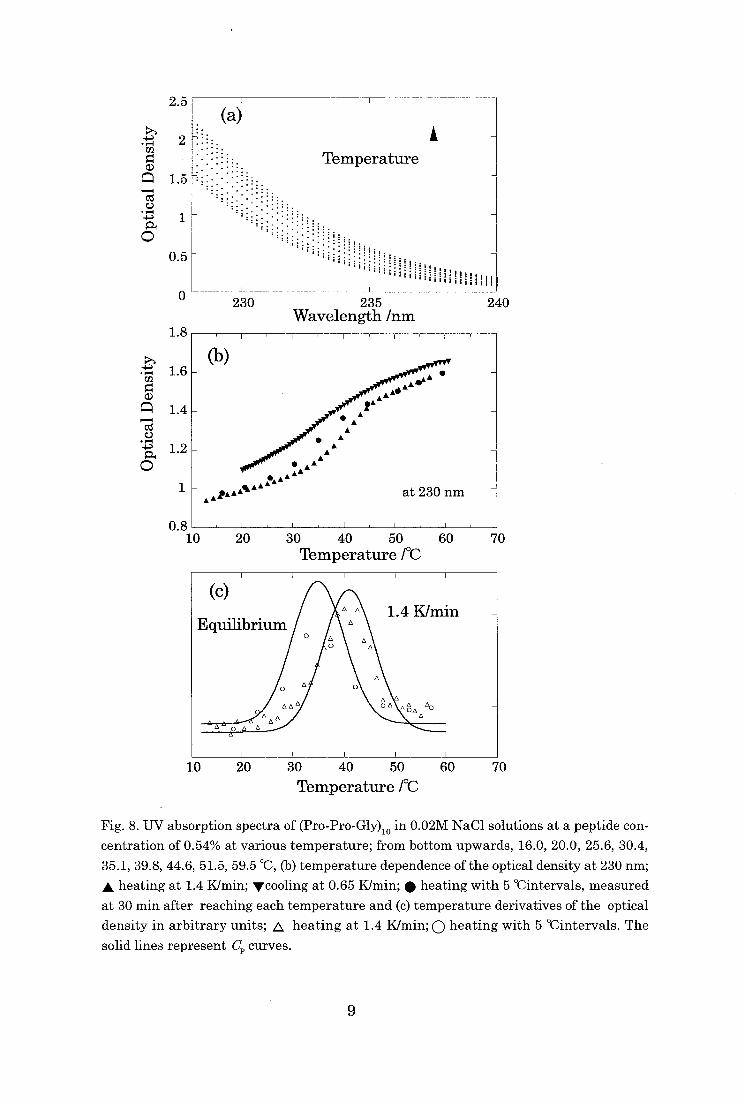
The UV absorption profiles of the (Pro-Pro-Gly)10 solutions have changed
with the increases in temperature (Fig. 8.(a)). The optical density of the solution
7
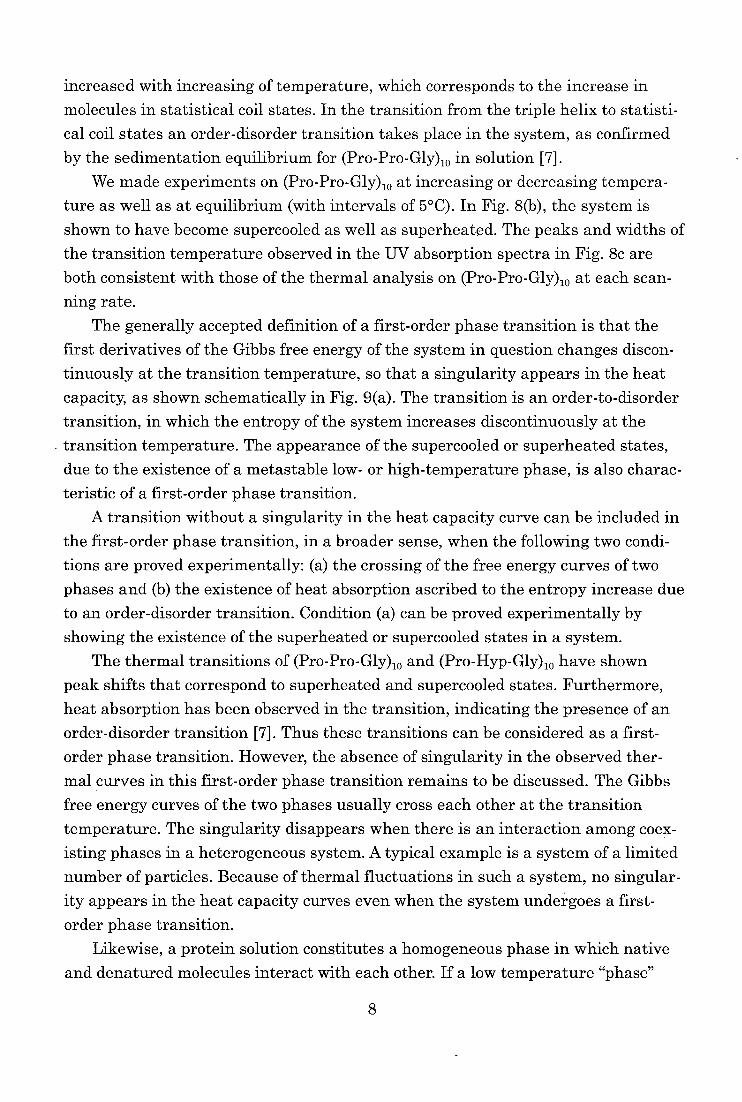
increased with increasing of temperature, which corresponds to the increase in
molecules in statistical coil states. In the transition from the triple helix to statisti-
cal coil states an order-disorder transition takes place in the system, as confirmed
by the sedimentation equilibrium for (Pro-Pro-Gly)10 in solution [7].
We made experiments on (Pro-Pro-Gly)10 at increasing or decreasing tempera-
ture as well as at equilibrium (with intervals of 5°C). In Fig. 8(b), the system is
shown to have become supercooled as well as superheated. The peaks and widths of
the transition temperature observed in the UV absorption spectra in Fig. 8c are
both consistent with those of the thermal analysis on (Pro-Pro-Gly)10 at each scan-
ning rate.
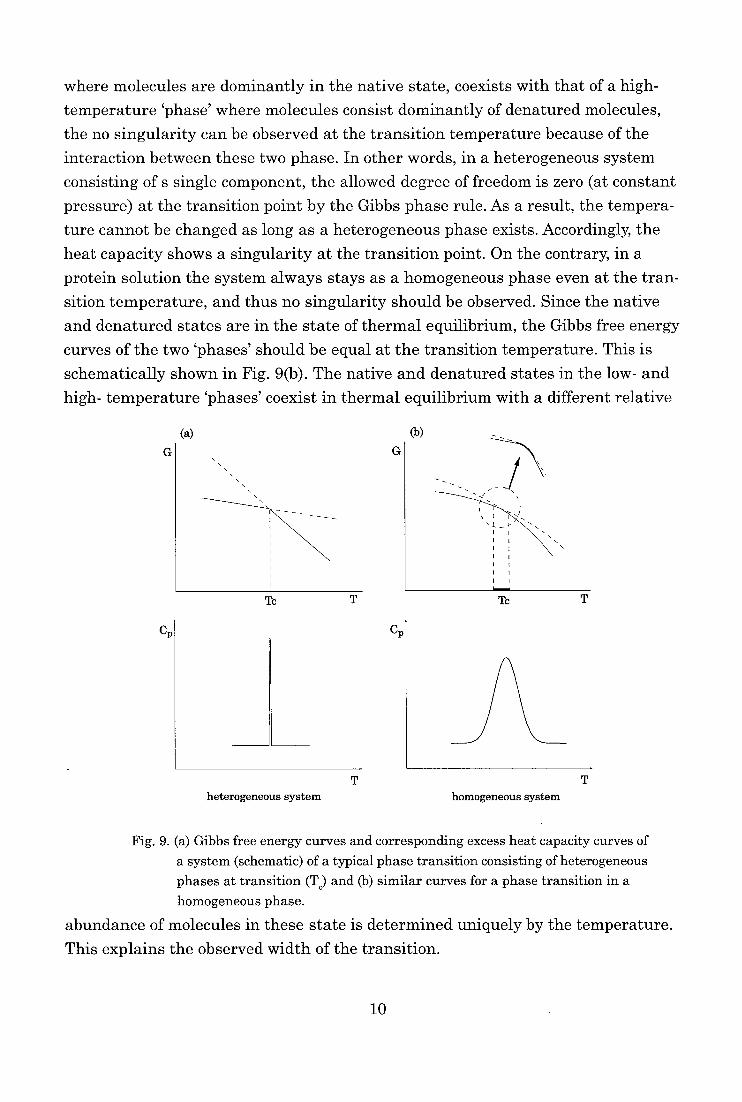
The generally accepted definition of a first-order phase transition is that the
first derivatives of the Gibbs free energy of the system in question changes discon-
tinuously at the transition temperature, so that a singularity appears in the heat
capacity, as shown schematically in Fig. 9(a). The transition is an order-to-disorder
transition, in which the entropy of the system increases discontinuously at the
. transition temperature. The appearance of the supercooled or superheated states,
due to the existence of a metastable low- or high-temperature phase, is also charac-
teristic of a first-order phase transition.
A transition without a singularity in the heat capacity curve can be included in
the first-order phase transition, in a broader sense, when the following two condi-
tions are proved experimentally: (a) the crossing of the free energy curves of two
phases and (b) the existence of heat absorption ascribed to the entropy increase due to an order-disorder transition. Condition (a) can be proved experimentally by
showing the existence of the superheated or supercooled states in a system.
The thermal transitions of (Pro-Pro-Gly)10 and (Pro-Hyp-Gly)10 have shown
peak shifts that correspond to superheated and supercooled states. Furthermore, heat absorption has been observed in the transition, indicating the presence of an
order-disorder transition [7]. Thus these transitions can be considered as a first-
order phase transition. However, the absence of singularity in the observed ther-
mal curves in this first-order phase transition remains to be discussed. The Gibbs
free energy curves of the two phases usually cross each other at the transition
temperature. The singularity disappears when there is an interaction among coex-
isting phases in a heterogeneous system. A typical example is a system of a limited
number of particles. Because of thermal fluctuations in such a system, no singular-
ity appears in the heat capacity curves even when the system undergoes a first-
order phase transition.
Likewise, a protein solution constitutes a homogeneous phase in which native
and denatured molecules interact with each other. If a low temperature "phase"
8
2.5
(a) 2
ci)
a) 1.5
Tivs
V
1
O
0.5
a)
-cvd C.)
O
0
1.8
1.6
1.4
1.2
1
0.8 I-- 10
230 235 Wavelength him
240
20 30 40 50 Temperature 1°C
60 70
10 20 30 40 50
Temperature 1°C
60 70
Fig. 8. UV absorption spectra of (Pro-Pro-Gly)io in 0.02M NaC1 solutions at a peptide con-
centration of 0.54% at various temperature; from bottom upwards, 16.0, 20.0, 25.6, 30.4,
35.1, 39.8, 44.6, 51.5, 59.5 °C, (b) temperature dependence of the optical density at 230 nm;
A heating at 1.4 K/min; ''cooling at 0.65 K/min; • heating with 5 °Cintervals, measured
at 30 min after reaching each temperature and (c) temperature derivatives of the optical
density in arbitrary units; A heating at 1.4 K/min; 0 heating with 5 °Cintervals. The
solid lines represent C. curves.
9
where molecules are dominantly in the native state, coexists with that of a high-
temperature 'phase' where molecules consist dominantly of denatured molecules,
the no singularity can be observed at the transition temperature because of the
interaction between these two phase. In other words, in a heterogeneous system
consisting of s single component, the allowed degree of freedom is zero (at constant
pressure) at the transition point by the Gibbs phase rule. As a result, the tempera-ture cannot be changed as long as a heterogeneous phase exists. Accordingly, the
heat capacity shows a singularity at the transition point. On the contrary, in a
protein solution the system always stays as a homogeneous phase even at the tran-sition temperature, and thus no singularity should be observed. Since the native
and denatured states are in the state of thermal equilibrium, the Gibbs free energy
curves of the two 'phases' should be equal at the transition temperature. This is
schematically shown in Fig. 9(b). The native and denatured states in the low- and
high- temperature 'phases' coexist in thermal equilibrium with a different relative
G
cp
(a)
Tc T
heterogeneous system
T
G
Cp
Tc T
homogeneous system
T
Fig. 9. (a) Gibbs free energy curves and corresponding excess heat capacity curves of
a system (schematic) of a typical phase transition consisting of heterogeneous
phases at transition (T) and (b) similar curves for a phase transition in a homogeneous phase.
abundance of molecules in these state is determined uniquely by the temperature.
This explains the observed width of the transition.
10
Chapter II
Measurement of thermodynamic quantities of thermal transitions of col-
lagen model peptides
II-1 Introduction
Thermal transitions of collagen model peptides, (Pro-Pro-Gly)lo and (Pro-
Hyp-Gly)10 these peptides show a sharp transition peak unlike all the other
synthetic polypeptides [38].
Nevertheless, no extensive study has yet been made using calorimetry on the
thermal transition of these polytripeptides [9,16]. Calorimetry is, undoubtedly,
the only method by which thermal changes of a solution as a whole can be inves-
tigated. The heat detected by calorimetry is ascribed to the partial specific heat
capacity of solutes or solvents, both related to the solvent-solute interactions. For
simplicity, spectroscopic methods are often chosen as tools to investigate transi-
tion temperature changes in enthalpy and entropy. Such information based on
microscopic states of a molecule undergoing transition is related indirectly to the
thermal transition.
In previous studies including those by spectrometry, the enthalpy or entropy
changes were never evaluated under the same solvent conditions nor were the
studies made systematically. In addition, the purity of the samples or the solu-
tion systems often differed so much that no critical comparisons could be made.
In chapter I, the author observed a distinct shift in peaks which we ascribed
to a change in the heating rate in the rate-dependent heat capacity (Cp) mea- surements on the transitions of sequenced polytripeptides, (Pro-Pro-Gly)10 and
(Pro-Hyp-Gly)10. This finding indicated of the first-order phase transition. In this chapter, the author have investigated the dependence of thermody-
namic behaviors of (Pro-Pro-Gly)10 and (Pro-Hyp-Gly)10 on the heating rate using
microcalorimetry, ultraviolet (UV) absorption spectroscopy and circular dichro-
ism (CD) spectroscopy. The author have obtained the equilibrium thermody-
namic quantities of transitions, transition temperatures (Teq), enthalpy changes
(AH) and entropy changes (%S), in various solution. The observed linear rela- tionship between the enthalpy and entropy changes is discussed, using our pre-
vious extended definition of the first-order phase transition, as a transition of
the solution from a system rich in triple helix to that rich in statistical coil.
11
11-2 Experimental
Sample preparations
The samples of (Pro-Pro-Gly)10 and (Pro-Hyp-Gly)10 were dissolved in water and
dialyzed in Spectra/Pore CE dialysis tubing with a molecular weight cut off of 100
against deionized water (0.2 mS) for four days at 4 °C. After equilibration with the
water, the samples were freeze dried before use. The purity of the samples was
greater than 98 % by using reverse-phase high performance liquid chromatography on a Nakarai C-18 column. The solutions of polytripeptides were then prepared as
described in chapter I. The concentration of the solutions is 0.5 % (2 mM
polytripeptide concentration) for each experiment unless otherwise indicated.
Differential scanning calorimetric (DSC) measurements
Differential scanning calorimetry (DSC) experiments were performed with a
Privalov-type adiabatic differential scanning microcalorimeter (DASM-4M). The
- operational cell volume was 514 R1 determined by the methods proposed by
Privalov [39-41]. The DSC experiments were performed at heating rates of 0.25,
0.5, 1 and 2 K/min.
UV absorption and Circular dichroism measurements
The heating rate dependence of the UV absorption spectra at 230 nm of (Pro-
Pro-Gly)10 was recorded on a Shimadzu double beam UV spectrometer controlling
the temperature by circulating water. The heating rate dependence of the residual
molar ellipticity at 227 nm was recorded on a Jasco Model J720 CD spectrometer
equipped with a programmable Peltier thermoelectric temperature controller. For
CD measurements, ellipticity of the solution was measured at heating rates of 0.1,
0.25, 0.5, 1 and 2 K/min as well as at equilibrium condition. For the equilibrium
experiment, the temperature in the cell was increased at a rate of 0.1 K/min and
equilibrating for 20 min at each temperature before collecting data. Data were
recorded at every 5° C. Both for the CD and UV experiments, the pathlength of the
cell was 1 mm .
11-3 Results and discussion
Heating rate dependence of the transition temperatures
The Cp curves of (Pro-Pro-Gly)10 and (Pro-Hyp-Gly)10showed a distinct depen-
dence on the heating rate as shown in Fig.10 for (Pro-Pro-Gly)10. The peak of the ther-
mal transition shifted to higher temperature as the heating rate was increased. The
12

290 300 310 320 330
Temperature /K
Fig. 10. Apparent excess heat capacity of (Pro-Pro-Gly)io at different heating rates. Experiments were performed in 20mM sodium chrolide. Heating rates are from
left to right 0.25, 0.5, 1 and 2 K/min.
transition temperatures of solutions with the same apparent composition condition
are different from those previously obtained using samples without dialysis against
deionized water. This is not unreasonable since small amounts of residuals should
change the two Gibbs free energies, which correspond to the solution before and
after transition. The transition temperature of a system is expected to correspond to
the crossing temperature of these two Gibbs free energies and be changed by the
addition of a small amount of molecules.
Thermal curves are shown with baselines in Fig. 10. The heat capacities in the
high temperature regions after transition were found to depend sparingly on tem-
perature for all solutions measured, as in protein solutions. In contrast, in the re-
gion before the transition a distinct linear dependence on temperature of apparent
heat capacities were observed in each solution, unlike those generally observed in
protein solutions. The dCp/dT before the transition was found to increase with a
decrease in the heating rate for all solutions measured. It is thus anticipated that
in an equilibrium condition this dependence is more distinct.
The excess heat capacity curve after correction for the baseline was employed
in the estimation of the transition enthalpy. The baseline was drawn by interpolat-
ing two Cp curves before and after the transition, as is usually performed in the
calorimetry of systems undergoing phase transitions
13
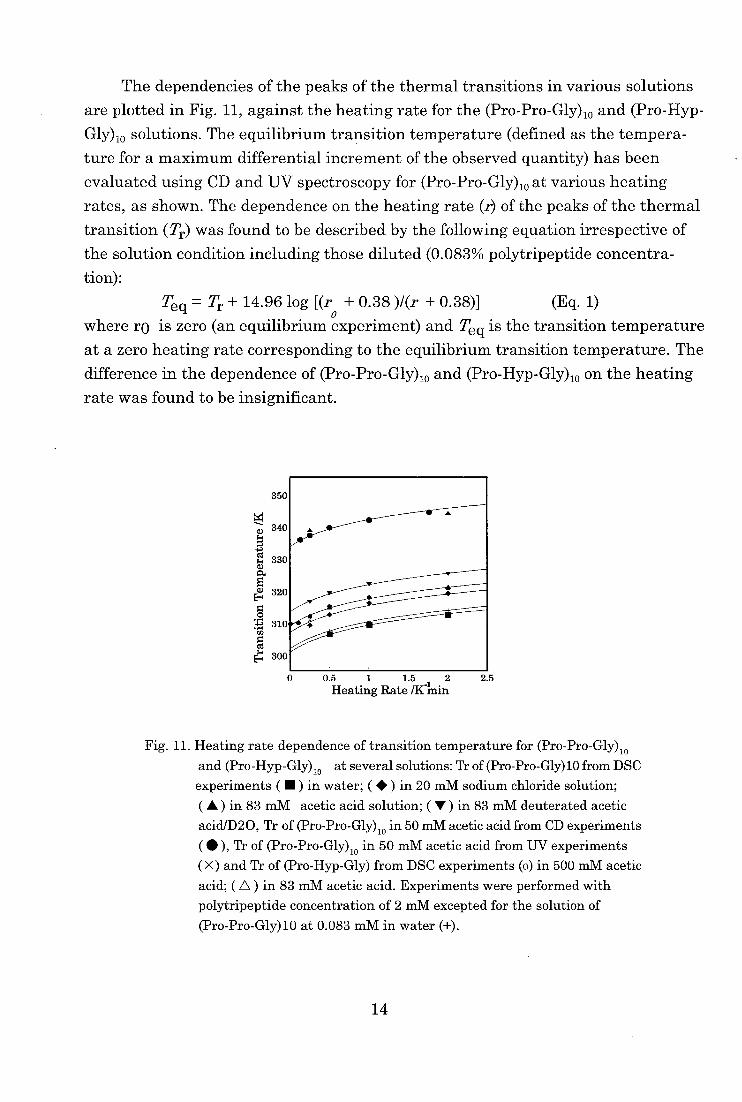
The dependencies of the peaks of the thermal transitions in various solutions
are plotted in Fig. 11, against the heating rate for the (Pro-Pro-Gly)io and (Pro-Hyp-
Gly)io solutions. The equilibrium transition temperature (defined as the tempera-
ture for a maximum differential increment of the observed quantity) has been
evaluated using CD and UV spectroscopy for (Pro-Pro-Gly)ioat various heating
rates, as shown. The dependence on the heating rate (r) of the peaks of the thermal
transition (Tr) was found to be described by the following equation irrespective of
the solution condition including those diluted (0.083% polytripeptide concentra-
tion):
Teq = Tr + 14.96 log [(r + 0.38 )1(r + 0.38)] (Eq. 1)
where ro is zero (an equilibrium experiment) and Teq is the transition temperature
at a zero heating rate corresponding to the equilibrium transition temperature. The
difference in the dependence of (Pro-Pro-Gly)10 and (Pro-Hyp-Gly)10 on the heating
rate was found to be insignificant.
350
O 340
•330
a)
cl) 320
-I..' •310
as
F, 300
0 0.5 1 1.512
Heating Rate /1c-min
2.5
Fig. 11. Heating rate dependence of transition temperature for (Pro-Pro-Gly).
and (Pro-Hyp-Gly)10 at several solutions: Tr of (Pro-Pro-Gly)10 from DSC
experiments ( M ) in water; ( • ) in 20 mM sodium chloride solution;
( A ) in 83 mM acetic acid solution; ( V ) in 83 mM deuterated acetic acid/D20, Tr of (Pro-Pro-Gly)io in 50 mM acetic acid from CD experiments
( • ), Tr of (Pro-Pro-Gly)io in 50 mM acetic acid from UV experiments
( X) and Tr of (Pro-Hyp-Gly) from DSC experiments (o) in 500 mM acetic
acid; ( A ) in 83 mM acetic acid. Experiments were performed with
polytripeptide concentration of 2 mM excepted for the solution of
(Pro-Pro-Gly)10 at 0.083 mM in water (+).
14
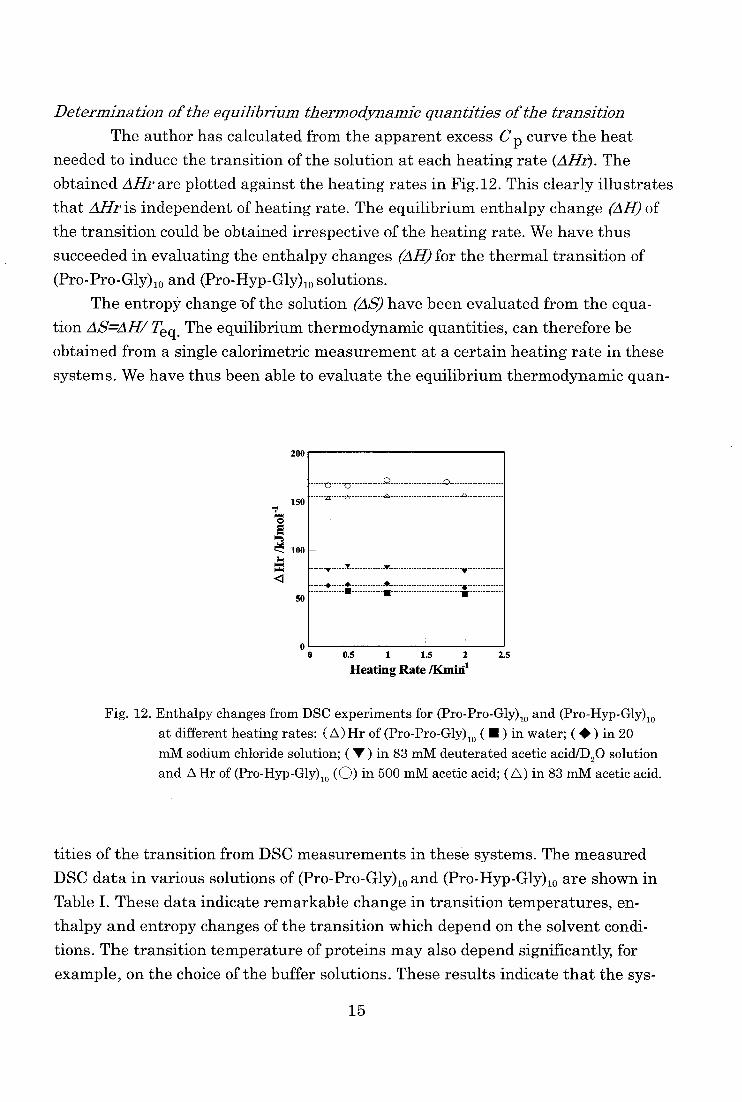
Determination of the equilibrium thermodynamic quantities of the transition
The author has calculated from the apparent excess Cp curve the heat
needed to induce the transition of the solution at each heating rate (AHr). The
obtained AHr are plotted against the heating rates in Fig.12. This clearly illustrates
that AHr is independent of heating rate. The equilibrium enthalpy change (AH) of
the transition could be obtained irrespective of the heating rate. We have thus
succeeded in evaluating the enthalpy changes (AH) for the thermal transition of
(Pro-Pro-Gly)10 and (Pro-Hyp-Gly)losolutions. The entropy change of the solution (AS) have been evaluated from the equa-
tion AS=AH/ Teq . The equilibrium thermodynamic quantities, can therefore be obtained from a single calorimetric measurement at a certain heating rate in these
systems. We have thus been able to evaluate the equilibrium thermodynamic quan-
200
150
a E
ti 100
50
00 0.5 1 1.5 2
Heating Rate /Kmiiil
2.5
Fig. 12. Enthalpy changes from DSC experiments for (Pro-Pro-Gly)io and (Pro-Hyp-Gly)io
at different heating rates: ( A) Hr of (Pro-Pro-Gly)th ( • ) in water; ( • ) in 20
mM sodium chloride solution; ( V ) in 83 mM deuterated acetic acid/D20 solution
and A Hr of (Pro-Hyp-Gly)10 (0) in 500 mM acetic acid; (A) in 83 mM acetic acid.
tities of the transition from DSC measurements in these systems. The measured
DSC data in various solutions of (Pro-Pro-Gly)10 and (Pro-Hyp-Gly)10 are shown in
Table I. These data indicate remarkable change in transition temperatures, en-
thalpy and entropy changes of the transition which depend on the solvent condi-
tions. The transition temperature of proteins may also depend significantly, for
example, on the choice of the buffer solutions. These results indicate that the sys-
15
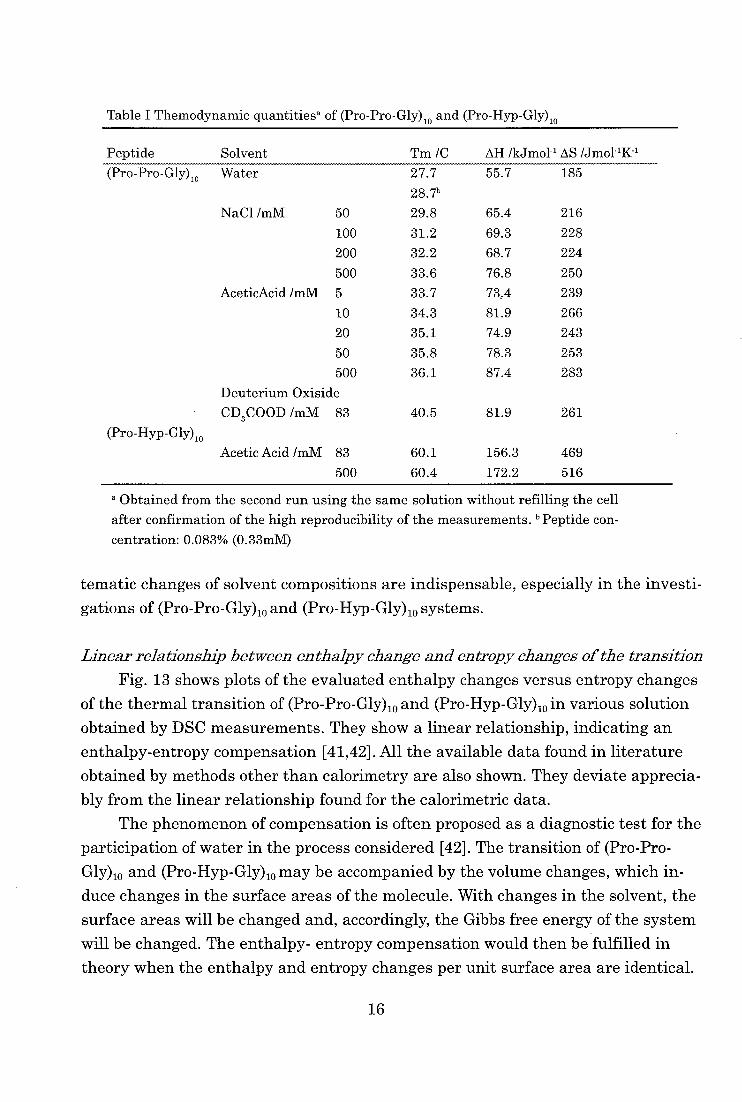
Table I Themodynamic quantitiesa of (Pro-Pro-Gly)10 and (Pro-Hyp-Gly)10
Peptide Solvent Tm /C AH /kJmo1-1 AS Mmo1-11(-1
(Pro-Pro-Gly),0
(Pro-Hyp-Gly)10
Water
NaC1 /mM 50
100
200
500
AceticAcid /mM 5
10
20
50
500
Deuterium Oxiside
CD3COOD /mM 83
Acetic Acid /mM 83
500
27.7
28.7'
29.8
31.2
32.2
33.6
33.7
34.3
35.1
35.8
36.1
40.5
60.1
60.4
55.7
65.4
69.3
68.7
76.8
73A
81.9
74.9
78.3
87.4
81.9
156.3
172.2
185
216
228
224
250
239
266
243
253
283
261
469
516
a Obtained from the second run using the same solution without refilling the cell
after confirmation of the high reproducibility of the measurements. "Peptide con-
centration: 0.083% (0.33mM)
tematic changes of solvent compositions are indispensable, especially in the investi-
gations of (Pro-Pro-Gly)„ and (Pro-Hyp-Gly)„ systems.
Linear relationship between enthalpy change and entropy changes of the transition
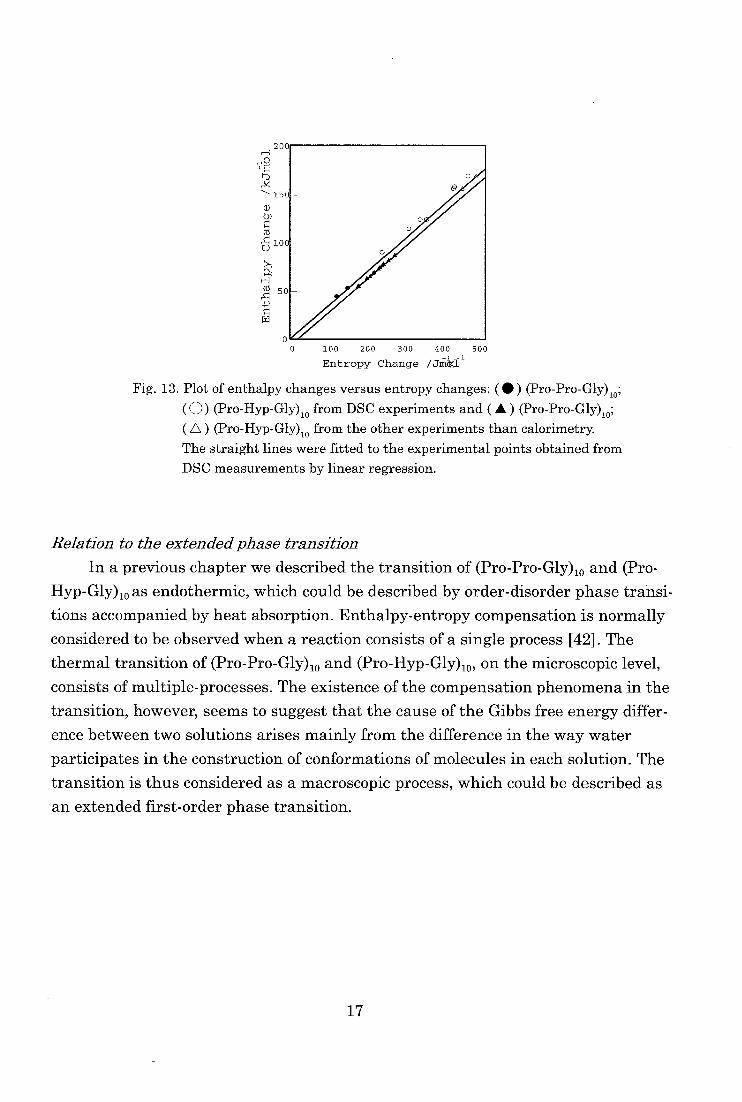
Fig. 13 shows plots of the evaluated enthalpy changes versus entropy changes
of the thermal transition of (Pro-Pro-Gly)„ and (Pro-Hyp-Gly)„ in various solution
obtained by DSC measurements. They show a linear relationship, indicating an
enthalpy-entropy compensation [41,42]. All the available data found in literature
obtained by methods other than calorimetry are also shown. They deviate apprecia-
bly from the linear relationship found for the calorimetric data.
The phenomenon of compensation is often proposed as a diagnostic test for the
participation of water in the process considered [42]. The transition of (Pro-Pro-Gly)„ and (Pro-Hyp-Gly)„ may be accompanied by the volume changes, which in-
duce changes in the surface areas of the molecule. With changes in the solvent, the
surface areas will be changed and, accordingly, the Gibbs free energy of the system
will be changed. The enthalpy- entropy compensation would then be fulfilled in
theory when the enthalpy and entropy changes per unit surface area are identical.
16
200
150
C Z3)
100
Qa
g5 50
0 100 200 300 400 500
Entropy Change /J1461
Fig. 13. Plot of enthalpy changes versus entropy changes: ( • ) (Pro-Pro-Gly)10;
(0) (Pro-Hyp-Gly)io from DSC experiments and ( A ) (Pro-Pro-Gly),0;
( A ) (Pro-Hyp-Gly)10 from the other experiments than calorimetry. The straight lines were fitted to the experimental points obtained from
DSC measurements by linear regression.
Relation to the extended phase transition
In a previous chapter we described the transition of (Pro-Pro-Gly)10 and (Pro-
Hyp-Gly)10 as endothermic, which could be described by order-disorder phase transi-
tions accompanied by heat absorption. Enthalpy-entropy compensation is normally
considered to be observed when a reaction consists of a single process [42]. The
thermal transition of (Pro-Pro-Gly)10 and (Pro-Hyp-Gly)10, on the microscopic level,
consists of multiple-processes. The existence of the compensation phenomena in the
transition, however, seems to suggest that the cause of the Gibbs free energy differ-
ence between two solutions arises mainly from the difference in the way water
participates in the construction of conformations of molecules in each solution. The transition is thus considered as a macroscopic process, which could be described as
an extended first-order phase transition.
17
Chapter III
NMR observation of the thermal transition of (Pro-Pro-Gly),0
III-1 Introduction
Spatial structure determinations of ordered states in solution using NMR
techniques have now become common procedure in the investigation of biopoly-
mers. For small proteins and peptides, one can determine the structure of a
specific active site in a molecule [43]. Studies of the denatured states of proteins
induced by urea, acids and alcohols and induced by elevation of temperature
have recently been made, by which the relevance of the residual structure in the
denatured states of proteins to the mechanism of protein folding have been in-
vestigated [44]. Studies of transitions by NMR should be equally important, but
the lack of experimental evidence indicating the coexistence of natured and
denatured states of proteins in solution has so far limited the discussion on the
microscopic changes of molecules accompanied by thermal transition. Collagen
model polypeptides, make solutions consisting of natured and denatured mol-
ecules over a wide temperature range.
The thermal transition of (Pro-Pro-Gly)n (n=10.15) was first studied using
NMR by Kobayashi and Kyogoku [45]. The thermal transition of collagen model
polytripeptides has recently been studied by NMR [17, 46], but no detailed analysis of the thermal transition has yet been reported based on the assign-
ments of the NMR spectra at each temperature.
In this chapter, the author investigated the transitions of (Pro-Pro-Gly)10 by
observing the 'II and '3C-NMR spectra. The results provide evidence for the exist-
ence of the structural changes in the triple helix at low temperature, before the
start of a drastic transition of the triple helix to the statistical coil. The relationship
between results obtained by NMR and those by microcalorimetry is also discussed
111-2 Experimental
Sample preparations
The samples of (Pro-Pro-Gly)10 were repeatedly freeze-dried and finally re-
dissolved in 0.5% (85mM) CD3COOD-D20 solution using 99.96% deuterated
CD3COOD and D20. In the DQF COSY experiment, 1.5% (6mM) (Pro-Pro-Gly)10
solution was used. Saturated (Pro-Pro-Gly)10 solutions were used in all other
experiments.
The chemical shifts of HDO and the methyl signal of CD3COOD at each tern-
18
perature in 11-1 and '3C spectra were determined by 3-(trimethyl-sily1)-1-
propanesulfonic acid (DSS). The chemical shifts in the NMR spectra were cali-brated using these values.
NMR measurements
All the NMR measurements were made using a JEOL JNM-A600 spectrom-
eter; 'H and '3C -NMR measurements were carried out at 600 MHz and at 150
MHz, respectively.
Assignments were made using two-dimensional phase-sensitive double quantum
filtered correlation spectroscopy (DQF COSY) [47], heteronuclear multiple quan-
tum coherence spectroscopy (HMQC) using gradients [48] and rotating frame
Overhauser effect spectroscopy (ROESY) measurements [49].
The excess heat capacity at constant pressure Cp, of the D90 solution was
measured using a Privalov-type adiabatic differential scanning microcalorimeter
(DASM-4M).
111-3 Results and discussion
Assignments of W and 13C-N1141? spectra of (Pro-Pro-OA°
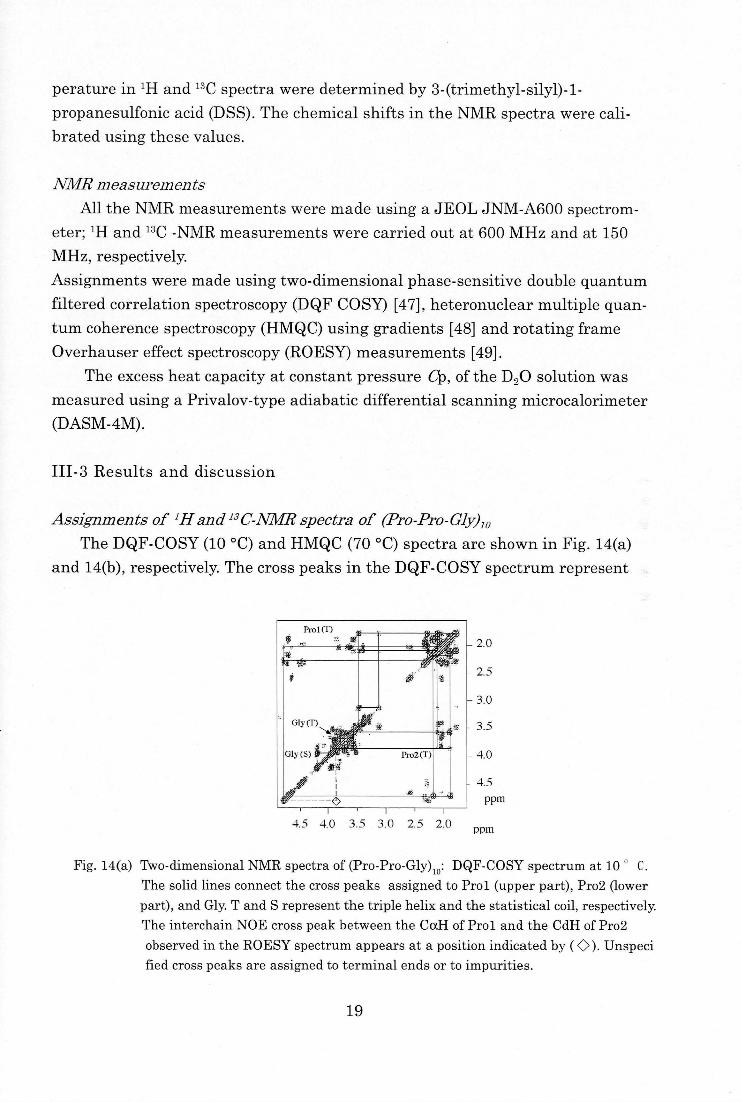
The DQF-COSY (10 °C) and HMQC (70 °C) spectra are shown in Fig. 14(a)
and 14(b), respectively. The cross peaks in the DQF-COSY spectrum represent
4.5 40 3.5 3.0 2.5 2.0
2.0
2.5
3.0
3.5
4.0
4.5
ppm
ppm
Fig. 14(a) Two-dimensional NMR spectra of (Pro-Pro-Gly)10: DQF-COSY spectrum at 10 C.
The solid lines connect the cross peaks assigned to Prol (upper part), Pro2 (lower
part), and Gly. T and S represent the triple helix and the statistical coil, respectively. The interchain NOE cross peak between the CaH of Prol and the CdH of Pro2
observed in the ROESY spectrum appears at a position indicated by ( 0). Unspeci
fied cross peaks are assigned to terminal ends or to impurities.
19
the existing 1H-1H J- couplings of the nuclear spins in the system [47]. Each cross
peak in the HMQC spectrum is derived from the correlation of the protons and carbons that are directly bonded [49].
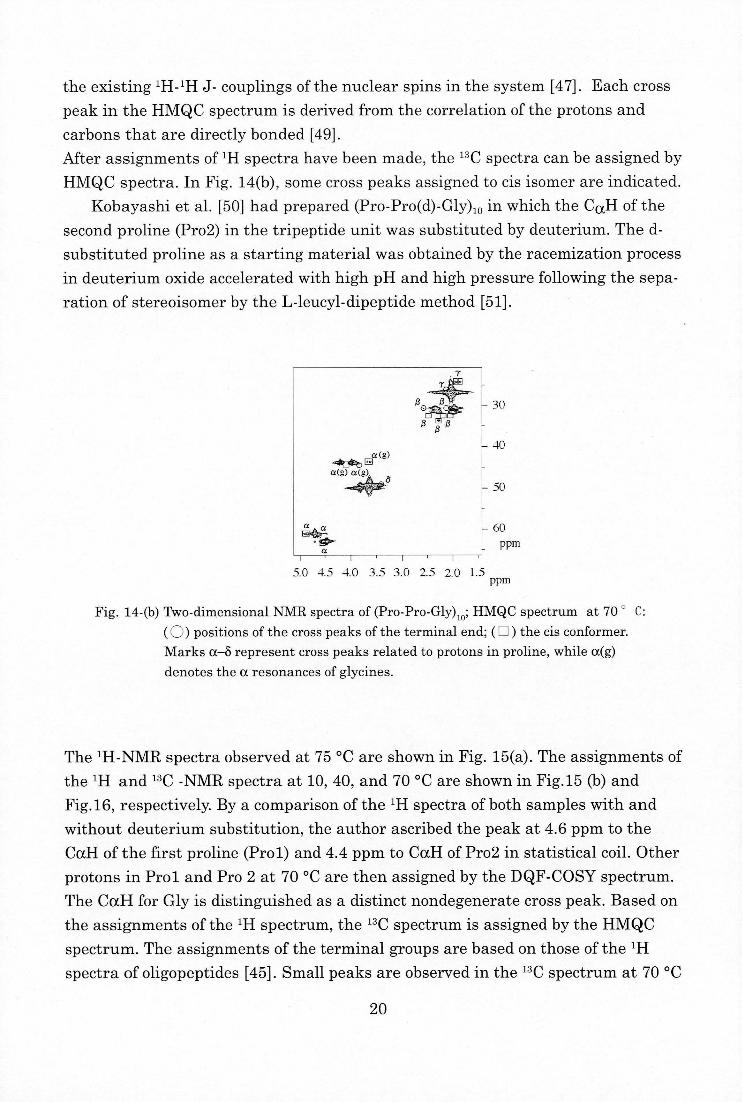
After assignments of 1H spectra have been made, the '3C spectra can be assigned by
HMQC spectra. In Fig. 14(b), some cross peaks assigned to cis isomer are indicated.
Kobayashi et al. [50] had prepared (Pro-Pro(d)-Gly)io in which the CaH of the
second proline (Pro2) in the tripeptide unit was substituted by deuterium. The d-
substituted proline as a starting material was obtained by the racemization process
in deuterium oxide accelerated with high pH and high pressure following the sepa-
ration of stereoisomer by the L-leucyl-dipeptide method [51].
Fig. 14-(b) Two-dimensional NMR spectra of (Pro-Pro-Gly)th; HMQC spectrum at 70 ' C:
(0) positions of the cross peaks of the terminal end; (^) the cis conformer. Marks a-5 represent cross peaks related to protons in proline, while a(g)
denotes the a resonances of glycines.
The '11-NMR spectra observed at 75 °C are shown in Fig. 15(a). The assignments of
the 'El and 13C -NMR spectra at 10, 40, and 70 °C are shown in Fig.15 (b) and
Fig.16, respectively. By a comparison of the 1H spectra of both samples with and
without deuterium substitution, the author ascribed the peak at 4.6 ppm to the
CaH of the first proline (Pro1) and 4.4 ppm to CaH of Pro2 in statistical coil. Other
protons in Prol and Pro 2 at 70 °C are then assigned by the DQF-COSY spectrum. The CaH for Gly is distinguished as a distinct nondegenerate cross peak. Based on
the assignments of the 111 spectrum, the 13C spectrum is assigned by the HMQC
spectrum. The assignments of the terminal groups are based on those of the 111
spectra of oligopeptides [45]. Small peaks are observed in the 13C spectrum at 70 °C
20
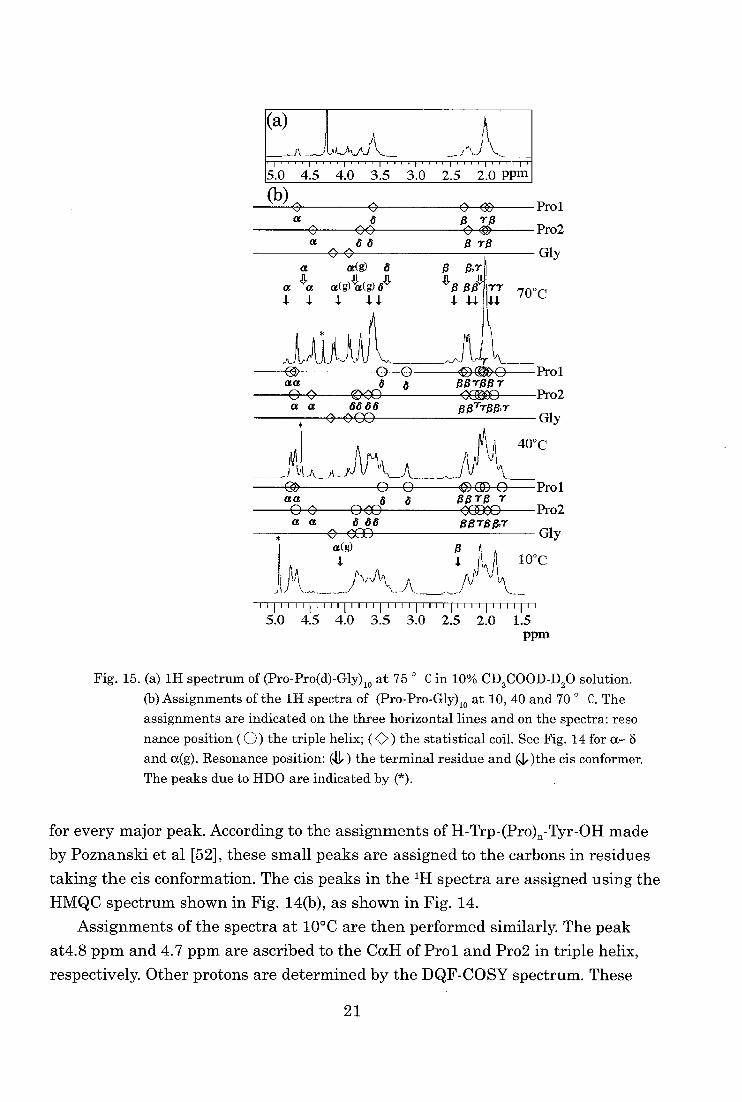
Fig. 15. (a) 1H spectrum of (Pro-Pro(d)-Gly)io at 75 ° C in 10% CD3COOD-D20 solution.
(b) Assignments of the 1H spectra of (Pro-Pro-Gly)io at 10, 40 and 70 ° C. The assignments are indicated on the three horizontal lines and on the spectra: reso
nance position (0) the triple helix; ( C.) the statistical coil. See Fig. 14 for a— 8 and a(g). Resonance position: (41.) the terminal residue and (14the cis conformer.
The peaks due to HDO are indicated by (*).
for every major peak. According to the assignments of H-Trp-(Pro)„-Tyr-OH made
by Poznanski et al [52], these small peaks are assigned to the carbons in residues
taking the cis conformation. The cis peaks in the 1H spectra are assigned using the
HMQC spectrum shown in Fig. 14(b), as shown in Fig. 14.
Assignments of the spectra at 10°C are then performed similarly. The peak
at4.8 pprn and 4.7 ppm are ascribed to the CocH of Prol and Prot in triple helix,
respectively. Other protons are determined by the DQF-COSY spectrum. These
21

assignments are further confirmed by the ROESY spectrum [49] (see legend of
Fig. 14(A)). The '3C spectrum at 10 °C is also assigned using the HMQC spec-
trum.
Fig. 16. Assignments of '3C spectra of (Pro-Pro-Gly)io at 10,40,and 70 ° C.
See Fig. 14 for the marks. The peak at 22 ppm is assigned to the
methyl group in CD3COOD.
The cis peaks at 10 °C are assigned by inspection of the temperature-depen-
dent changes of the 1C spectra. The existence of the resonance for the cis con-
former at 10 °C can be regarded as experimental evidence for the existence of
peptides in the statistical coil in solution below 10 °C. Evaluation of the area of
each peak at each temperature shows that the ratio of the cis conformer in the
22
statistical coil is always slightly higher than 20 % and that the ratio is independent
of temperature, similar to the case of proline derivative [53].
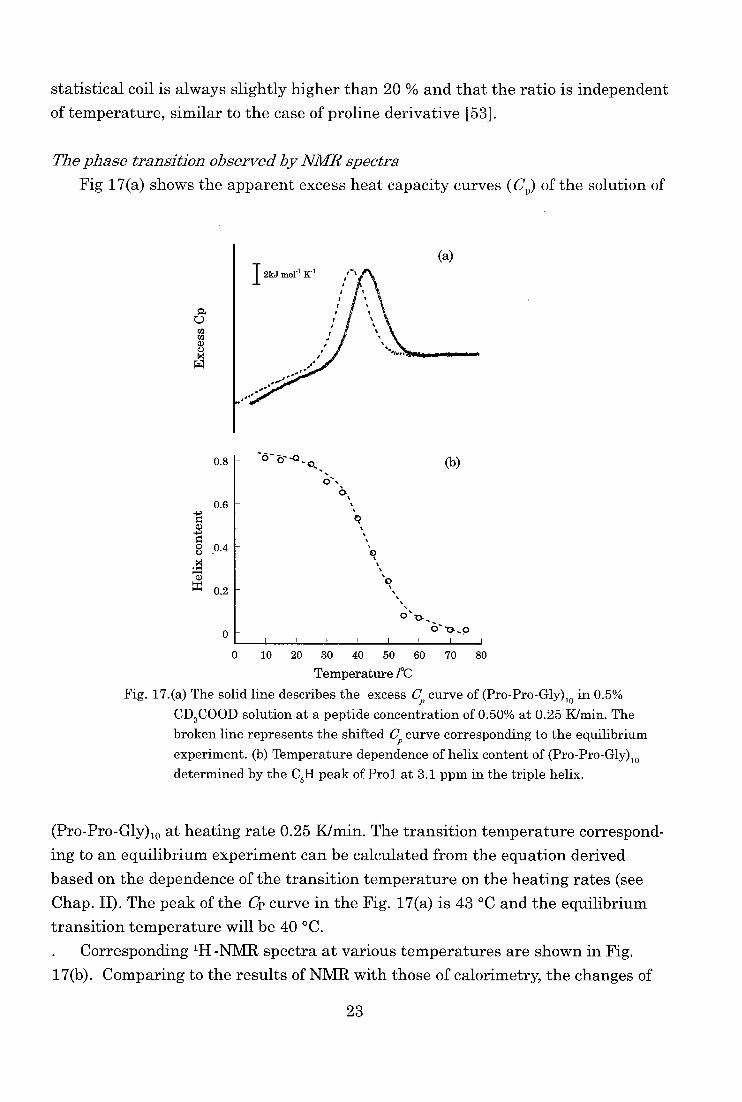
The phase transition observed by NMR spectra
Fig 17(a) shows the apparent excess heat capacity curves (Cr) of the solution of
a 0 ca ca a) U m W
(a)
0.8
0.6
ct)
0.4 .t1
0.2
0
0 10 20 30 40 50 60 70 80
Temperature /°C
Fig. 17.(a) The solid line describes the excess C, curve of (Pro-Pro-Gly)10 in 0.5% CD3COOD solution at a peptide concentration of 0.50% at 0.25 K/min. The
broken line represents the shifted Cp curve corresponding to the equilibrium experiment. (b) Temperature dependence of helix content of (Pro-Pro-Gly)10
determined by the C81-1 peak of Prol at 3.1 ppm in the triple helix.
(Pro-Pro-Gly)10 at heating rate 0.25 K/min. The transition temperature correspond-ing to an equilibrium experiment can be calculated from the equation derived
based on the dependence of the transition temperature on the heating rates (see
Chap. II). The peak of the Cp curve in the Fig. 17(a) is 43 °C and the equilibrium
transition temperature will be 40 °C.
. Corresponding 1H -NMR spectra at various temperatures are shown in Fig.
17(b). Comparing to the results of NMR with those of calorimetry, the changes of
23
spectra accompanied transition is observed in more extended region. Actually, by
observing the peak areas of C51-1 proton of Pro 1 in the triple helix at 3.1 ppm and
C,(1-1 proton of Gly in the statistical coil at 4.2 ppm, the transition region as ob-
served by NMR is from 20 to 70.
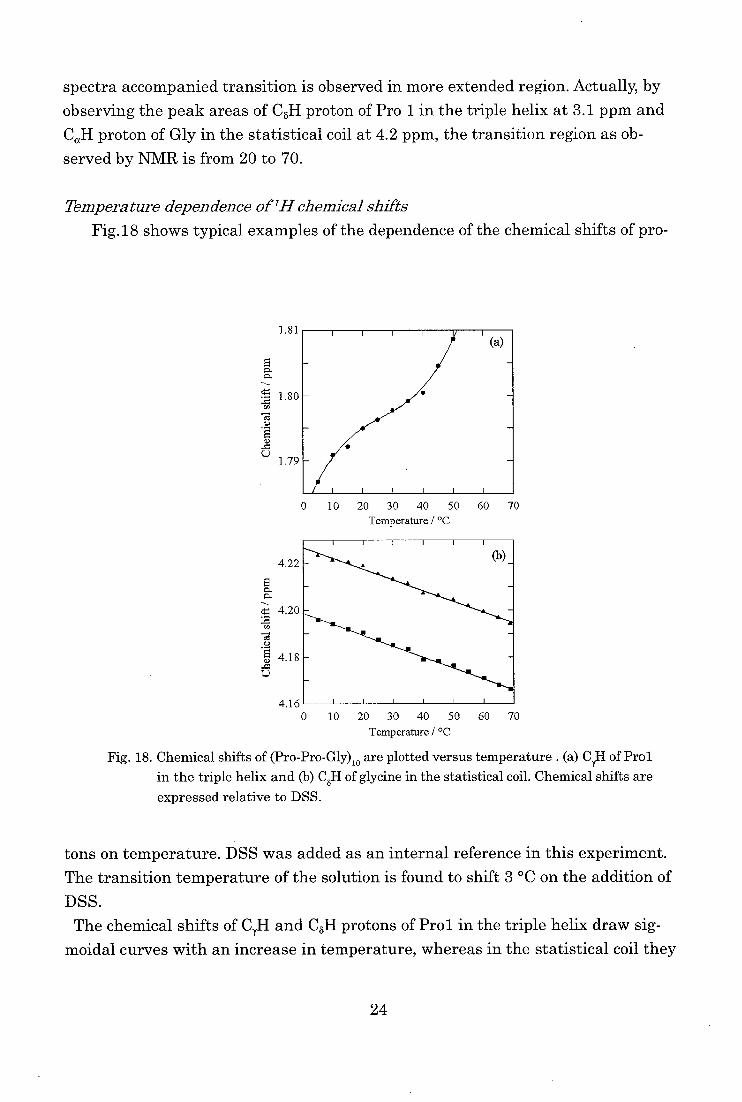
Temperature dependence of1H chemical shifts
Fig.18 shows typical examples of the dependence of the chemical shifts of pro-
1)
L.)
1.81
1.80
1.79
4.22
g. a.
4.20
Te's
'4 4.18
0 10 20 30 40 50 60 70
Temperature / °C
4.16' " 0 10 20 30 40 50 60 70
Temperature / °C
Fig. 18. Chemical shifts of (Pro-Pro-Gly)10 are plotted versus temperature . (a) CI,H of Pro1
in the triple helix and (b) C6H of glycine in the statistical coil. Chemical shifts are
expressed relative to DSS.
tons on temperature. DSS was added as an internal reference in this experiment.
The transition temperature of the solution is found to shift 3 °C on the addition of
DSS.
The chemical shifts of C7H and CoH protons of Prol in the triple helix draw sig-
moidal curves with an increase in temperature, whereas in the statistical coil they
24
depend linearly on temperature. Our experimental results indicate that the triple
helix consists of two distinct states; one corresponds to a lower temperature state
(LT) and the other to a higher temperature state (HT). They undergo a fast ex-change transition with only small changes in chemical shifts of protons, about
0.015 ppm for CyH and 0.006 ppm for C8H. The chemical shifts in DNAs, where
similarly fast but overall structural transitions are performed, depend on tempera-
ture with distinct changes in chemical shifts by as much as 0.55 ppm [54].
As shown in Fig. 18, the LT to HT transition takes place in the region of 10-40 °C,
while the transition from triple helix to the statistical coil takes place in the region
of 20-70 °C. At the transition temperature, about 40 °C from the thermal curve, all
the molecules in the triple helix are considered to be in HT. The transition of the
triple helix (LT) to a preparatory state of the transition (HT) is probably accompa-
nied by an exchange in the positions of water interacting with the triple helix,
because they occur without heat absorption and with small changes in the chemical
shifts. The findings if this transition is important since such a preparative transi-
tion should also be found in proteins and play an important role in the kinetics.
25
Chapter IV
The partial molar volume of collagen model peptides
IV-1 Introduction
Partial molar volume
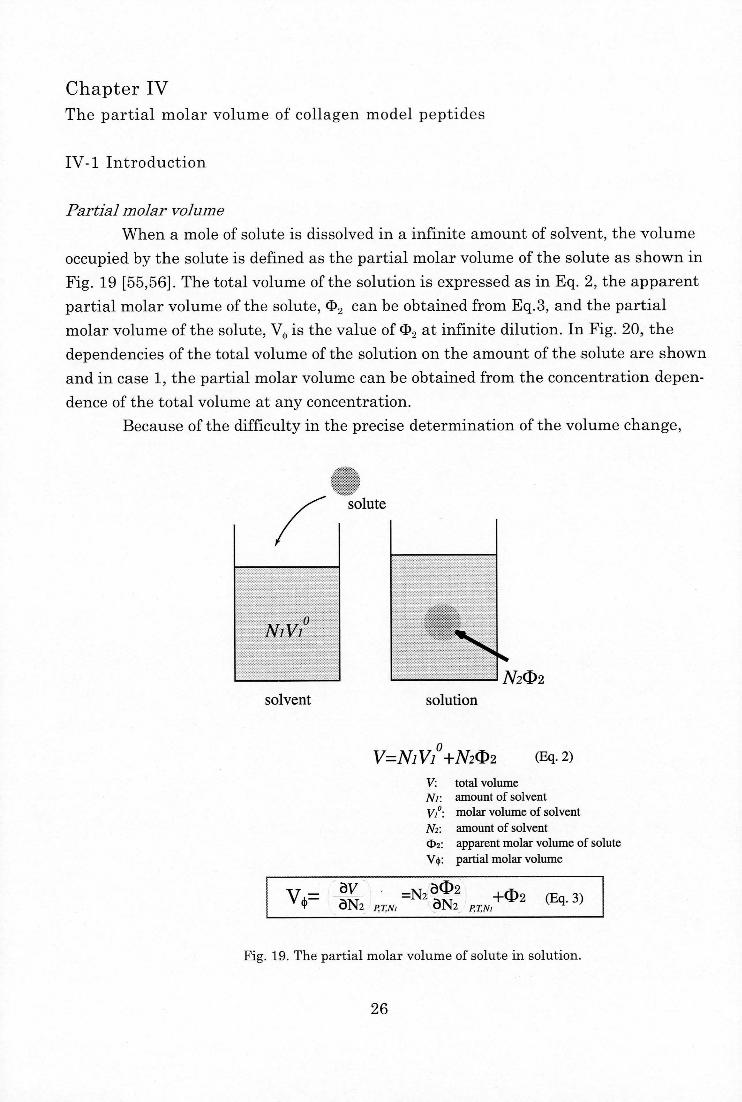
When a mole of solute is dissolved in a infinite amount of solvent, the volume
occupied by the solute is defined as the partial molar volume of the solute as shown in
Fig. 19 [55,56]. The total volume of the solution is expressed as in Eq. 2, the apparent
partial molar volume of the solute, (139 can be obtained from Eq.3, and the partial molar volume of the solute, VQ is the value of 02 at infinite dilution. In Fig. 20, the
dependencies of the total volume of the solution on the amount of the solute are shown
and in case 1, the partial molar volume can be obtained from the concentration depen-
dence of the total volume at any concentration.
Because of the difficulty in the precise determination of the volume change,
solute
NiVi°
solvent solution
,0 V=N1V1+N202 (Eq. 2)
V: total volume
Ni: amount of solvent
Vi°: molar volume of solvent
N2: amount of solvent
c1)2: apparent molar volume of solute
V4: partial molar volume
V4=av
aN2=N2 a12
aN2 +02 (Eq. 3)
Fig. 19. The partial molar volume of solute in solution.
26
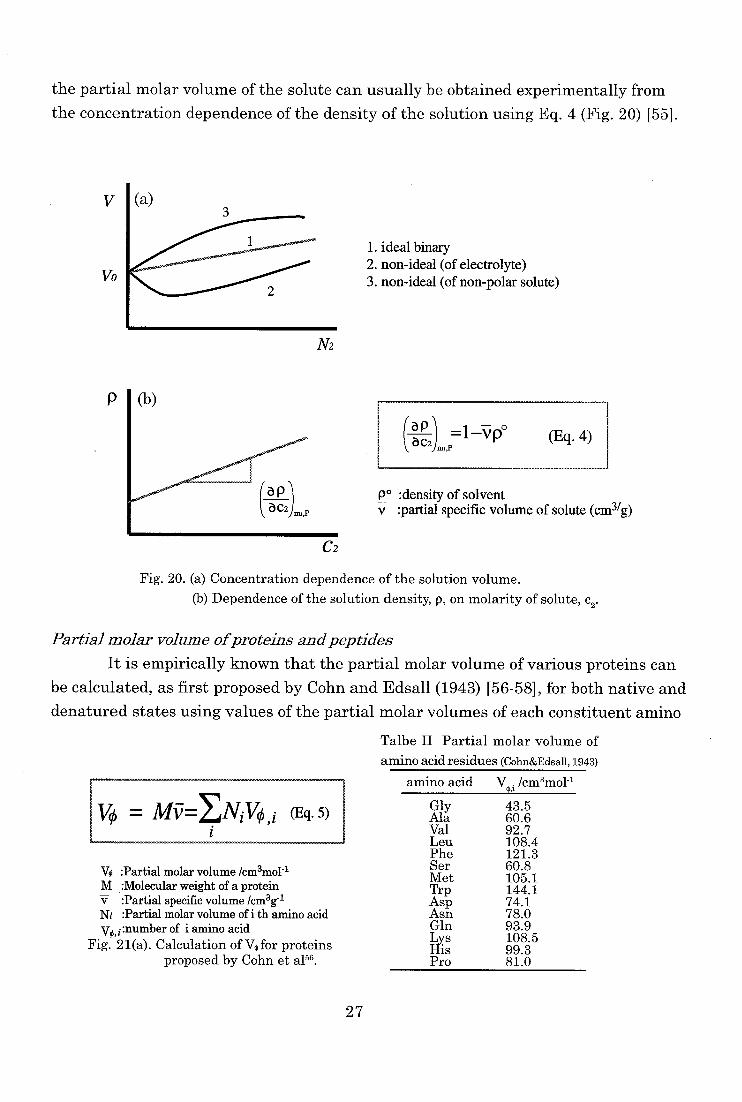
the partial molar volume of the solute can usually be obtained experimentally from
the concentration dependence of the density of the solution using Eq. 4 (Fig. 20) 1551.
V I (a)
Vo
1. ideal binary 2. non-ideal (of electrolyte) 3. non-ideal (of non-polar solute)
N2
P
(ap (Eq. 4)
po :density of solvent v :partial specific volume of solute (cm3/g)
C2
Fig. 20. (a) Concentration dependence of the solution volume.
(b) Dependence of the solution density, p, on molarity of solute, c2.
Partial molar volume of proteins and peptides
It is empirically known that the partial molar volume of various proteins can
be calculated, as first proposed by Cohn and Edsall (1943) [56-58], for both native and
denatured states using values of the partial molar volumes of each constituent amino
Talbe II Partial molar volume of
amino acid residues (Cohn&Edsall, 1943)
= My = ENi V0 ,i (Eq. 5)
V0 :Partial molar volume /cm3mo1-1 M :Molecular weight of a protein V :Partial specific volume /cm3g-1 Ni :Partial molar volume of i th amino acid
vo,i:number of i amino acid Fig. 21(a). Calculation of Vo for proteins
proposed by Cohn et al5s.
amino acid V Icm3mo1-1
Gly Ala Val Leu Phe Ser Met Trp Asp Asn Gln Lys His Pro
43.5 60.6 92.7 108.4 121.3 60.8 105.1 144.1 74.1 78.0 93.9 108.5 99.3 81.0
27
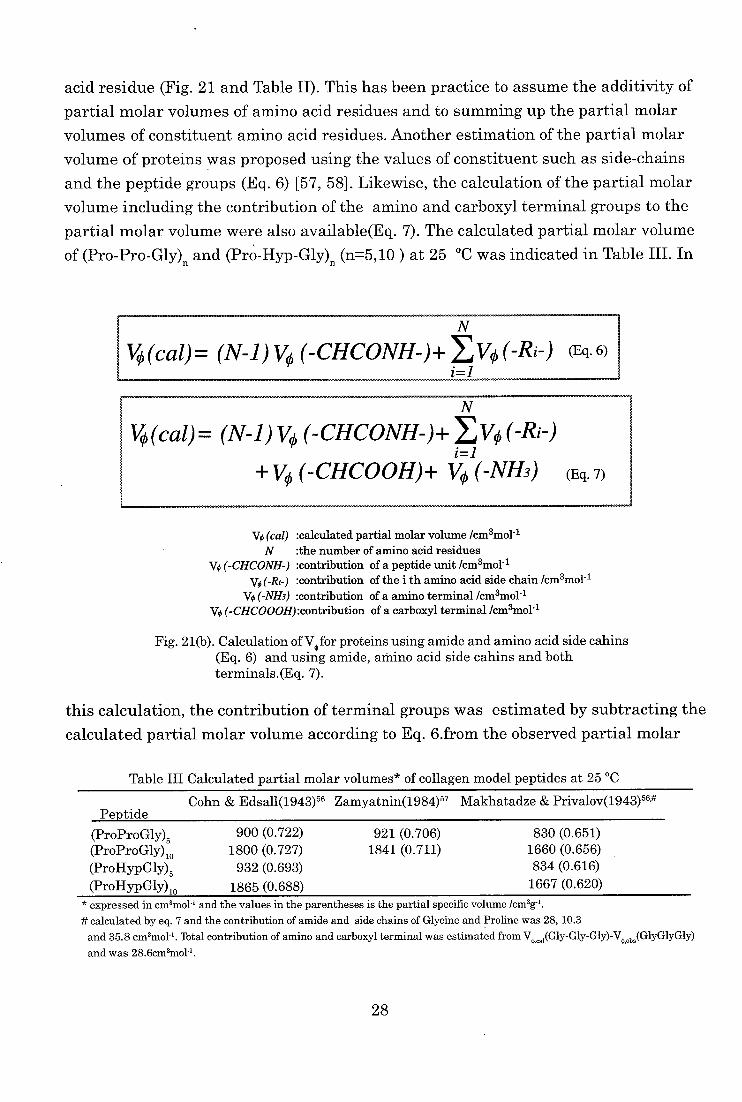
acid residue (Fig. 21 and Table II). This has been practice to assume the additivity of
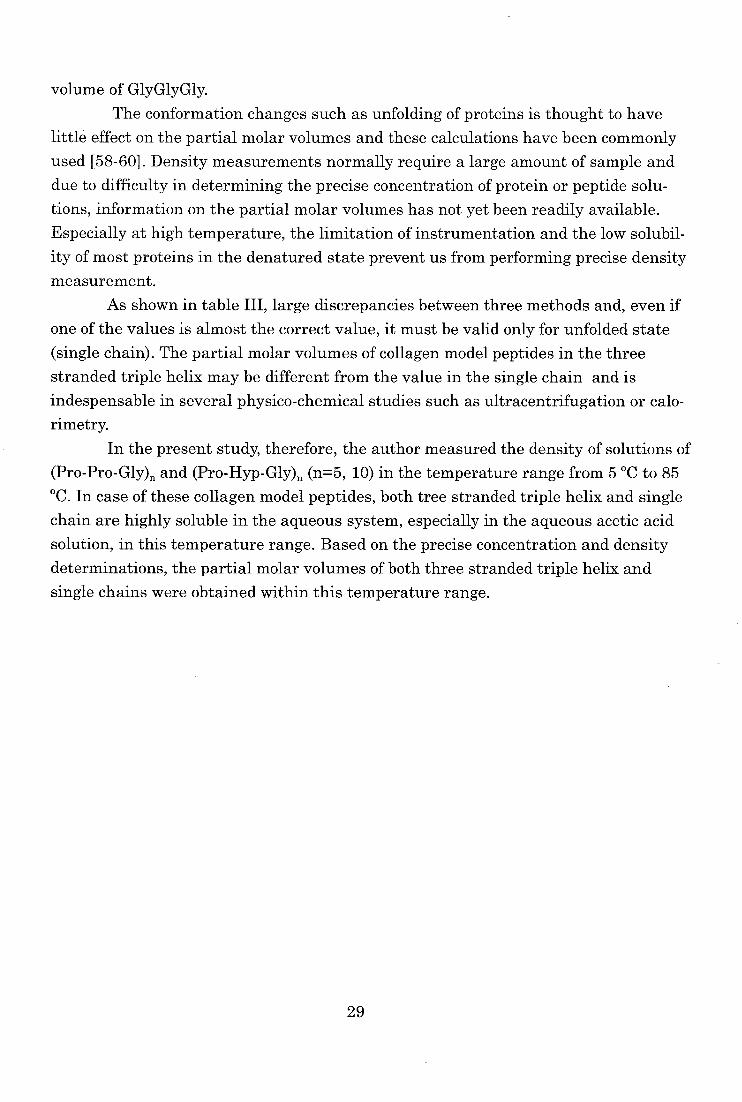
partial molar volumes of amino acid residues and to summing up the partial molar volumes of constituent amino acid residues. Another estimation of the partial molar volume of proteins was proposed using the values of constituent such as side-chains
and the peptide groups (Eq. 6) [57, 58]. Likewise, the calculation of the partial molar volume including the contribution of the amino and carboxyl terminal groups to the
partial molar volume were also available(Eq. 7). The calculated partial molar volume of (Pro-Pro-Gly)n and (PrO-Hyp-Gly)r, (n=5,10 ) at 25 °C was indicated in Table III. In
V (cal)= (N-1) V0 (-CHCONH-)+ EV95(-Ri-) (Eq. 6) i=/
Vo(cal)= (N-1) V (-CHCONH-)+ 170 (-Ri-) i=i
+14 (-CHCOOH)+ V0 (-NH3) (Eq. 7)
V0 (cal) :calculated partial molar volume /cm3mo1-1 N :the number of amino acid residues
V0 (-CHCONH-) :contribution of a peptide unit /cm3mo1-1 Vo(-R,-) :contribution of the i th amino acid side chain /cm3mo1-1
Vo (-NH3) :contribution of a amino terminal /cm3mo1-1 (-CHCOOOH):contribution of a carboxyl terminal km3m01-1
Fig. 21(b). Calculation of V4,for proteins using amide and amino acid side cahins (Eq. 6) and using amide, amino acid side cahins and both
terminals.(Eq. 7).
this calculation, the contribution of terminal groups was estimated by subtracting the
calculated partial molar volume according to Eq. 6.from the observed partial molar
Table III Calculated partial molar volumes* of collagen model peptides at 25 °C
Cohn & Edsall(1943)56 Zamyatnin(1984)57 Makhatadze & Privalov(1943)5" Peptide
(ProProGly)5 (ProProGly)io (ProHypGly)5
(ProHypGly)io
900 (0.722) 1800 (0.727)
932 (0.693)
1865 (0.688)
921 (0.706) 1841 (0.711)
830 (0.651) 1660 (0.656) 834 (0.616)
1667 (0.620)* expressed in cm3mol-1 and the values in the parentheses is the partial specific volume /cm3g-1.
# calculated by eq. 7 and the contribution of amide and side chains of Glycine and Proline was 28, 10.3
and 35.8 cm3mol'. Total contribution of amino and carboxyl terminal was estimated from 174,.,(Gly-Gly-Gly)-Vobs(GlyGlyGly)
and was 28.6cm3noP.
28
volume of GlyGlyGly.
The conformation changes such as unfolding of proteins is thought to have
little effect on the partial molar volumes and these calculations have been commonly
used [58-60]. Density measurements normally require a large amount of sample and
due to difficulty in determining the precise concentration of protein or peptide solu-
tions, information on the partial molar volumes has not yet been readily available.
Especially at high temperature, the limitation of instrumentation and the low solubil-
ity of most proteins in the denatured state prevent us from performing precise density
measurement.
As shown in table III, large discrepancies between three methods and, even if
one of the values is almost the correct value, it must be valid only for unfolded state
(single chain). The partial molar volumes of collagen model peptides in the three stranded triple helix may be different from the value in the single chain and is
indespensable in several physico-chemical studies such as ultracentrifugation or calo-
rimetry.
In the present study, therefore, the author measured the density of solutions of
(Pro-Pro-Gly)„ and (Pro-Hyp-Gly)„ (n=5, 10) in the temperature range from 5 °C to 85 °C. In case of these collagen model peptides, both tree stranded triple helix and single
chain are highly soluble in the aqueous system, especially in the aqueous acetic acid
solution, in this temperature range. Based on the precise concentration and density
determinations, the partial molar volumes of both three stranded triple helix and
single chains were obtained within this temperature range.
29
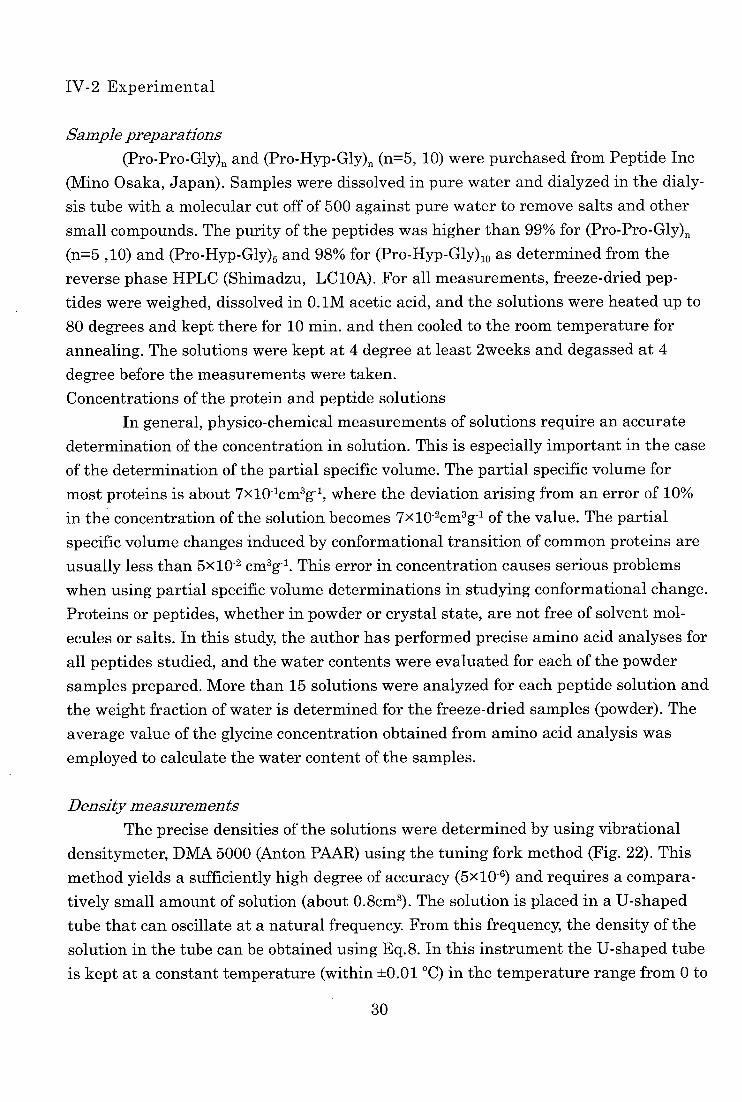
IV-2 Experimental
Sample preparations
(Pro-Pro-Gly),1 and (Pro-Hyp-Gly)n (n=5, 10) were purchased from Peptide Inc
(Mino Osaka, Japan). Samples were dissolved in pure water and dialyzed in the dialy-sis tube with a molecular cut off of 500 against pure water to remove salts and other
small compounds. The purity of the peptides was higher than 99% for (Pro-Pro-Gly)„
(n=5 ,10) and (Pro-Hyp-Gly)5 and 98% for (Pro-Hyp-Gly)10 as determined from the reverse phase HPLC (Shimadzu, LC10A). For all measurements, freeze-dried pep-
tides were weighed, dissolved in 0.1M acetic acid, and the solutions were heated up to
80 degrees and kept there for 10 min.. and then cooled to the room temperature for
annealing. The solutions were kept at 4 degree at least 2weeks and degassed at 4
degree before the measurements were taken.
Concentrations of the protein and peptide solutions
In general, physico-chemical measurements of solutions require an accurate
determination of the concentration in solution. This is especially important in the case
of the determination of the partial specific volume. The partial specific volume for
most proteins is about 7x10⁻¹-cm3g-1, where the deviation arising from an error of 10%
in the concentration of the solution becomes 7x10⁻²cm3g-1 of the value. The partial
specific volume changes induced by conformational transition of common proteins are
usually less than 5x102 cm3g4. This error in concentration causes serious problems
when using partial specific volume determinations in studying conformational change.
Proteins or peptides, whether in powder or crystal state, are not free of solvent mol-
ecules or salts. In this study, the author has performed precise amino acid analyses for
all peptides studied, and the water contents were evaluated for each of the powder
samples prepared. More than 15 solutions were analyzed for each peptide solution and
the weight fraction of water is determined for the freeze-dried samples (powder). The
average value of the glycine concentration obtained from amino acid analysis was
employed to calculate the water content of the samples.
Density measurements
The precise densities of the solutions were determined by using vibrational
densitymeter, DMA 5000 (Anton PAAR) using the tuning fork method (Fig. 22). This
method yields a sufficiently high degree of accuracy (5x10⁻⁶) and requires a compara-
tively small amount of solution (about 0.8cm3). The solution is placed in a U-shaped
tube that can oscillate at a natural frequency. From this frequency, the density of the
solution in the tube can be obtained using Eq.8. In this instrument the U-shaped tube
is kept at a constant temperature (within ±0.01 °C) in the temperature range from 0 to
30
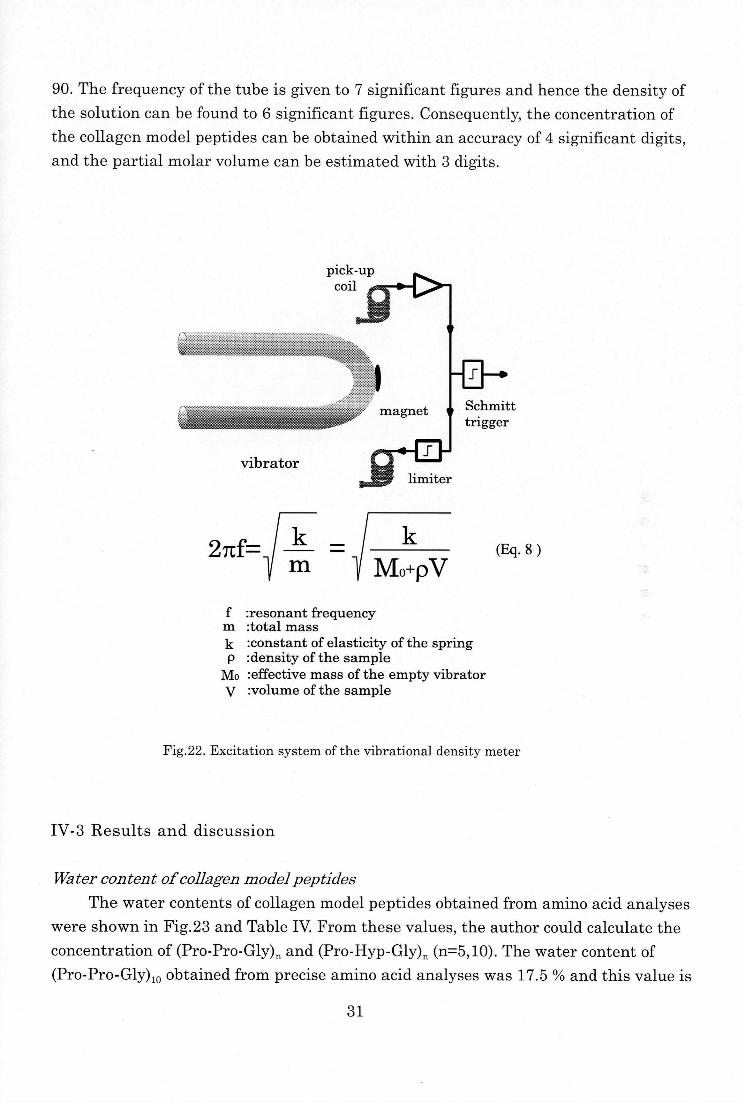
90. The frequency of the tube is given to 7 significant figures and hence the density of
the solution can be found to 6 significant figures. Consequently, the concentration of
the collagen model peptides can be obtained within an accuracy of 4 significant digits,
and the partial molar volume can be estimated with 3 digits.
27tf=k
m
k
Mo+pV(Eq. 8 )
f :resonant frequency m :total mass
k :constant of elasticity of the spring p :density of the sample
Mo :effective mass of the empty vibrator
V :volume of the sample
Fig.22. Excitation system of the vibrational density meter
IV-3 Results and discussion
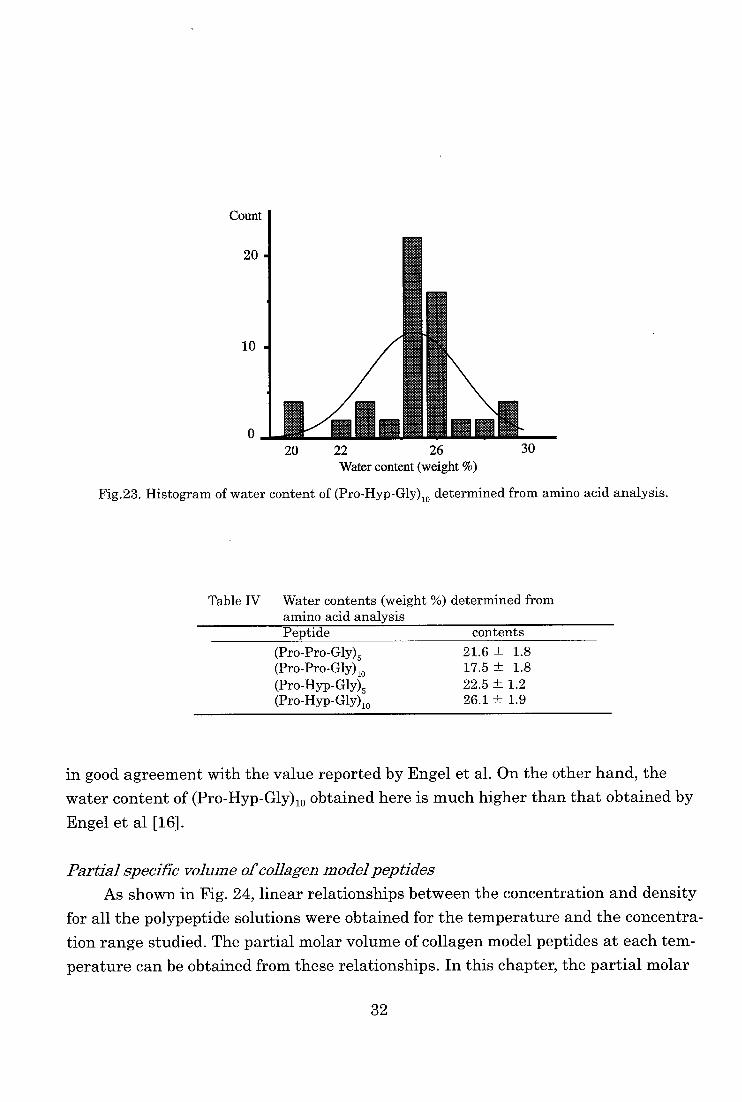
Water content of collagen model peptides
The water contents of collagen model peptides obtained from amino acid analyses
were shown in Fig.23 and Table IV. From these values, the author could calculate the
concentration of (Pro-Pro-Gly)„ and (Pro-Hyp-Gly)„ (n=5,10). The water content of
(Pro-Pro-Gly),0 obtained from precise amino acid analyses was 17.5 % and this value is
31
Count
20
10
0 OM 20 22 26 30
Water content (weight %)
Fig.23. Histogram of water content of (Pro-Hyp-Gly)10 determined from amino acid analysis.
Table IV Water contents (weight %) determined from amino acid analysisPeptide contents
(Pro-Pro-Gly)5 (Pro-Pro-Gly)„ (Pro-Hyp-Gly)5 (Pro-Hyp-Gly)10
21.6 ±
17.5 ±
22.5± 26.1 ±
1.8
1.8
1.2
1.9
in good agreement with the value reported by Engel et al. On the other hand, the
water content of (Pro-Hyp-Gly)lo obtained here is much higher than that obtained by
Engel et al [16].
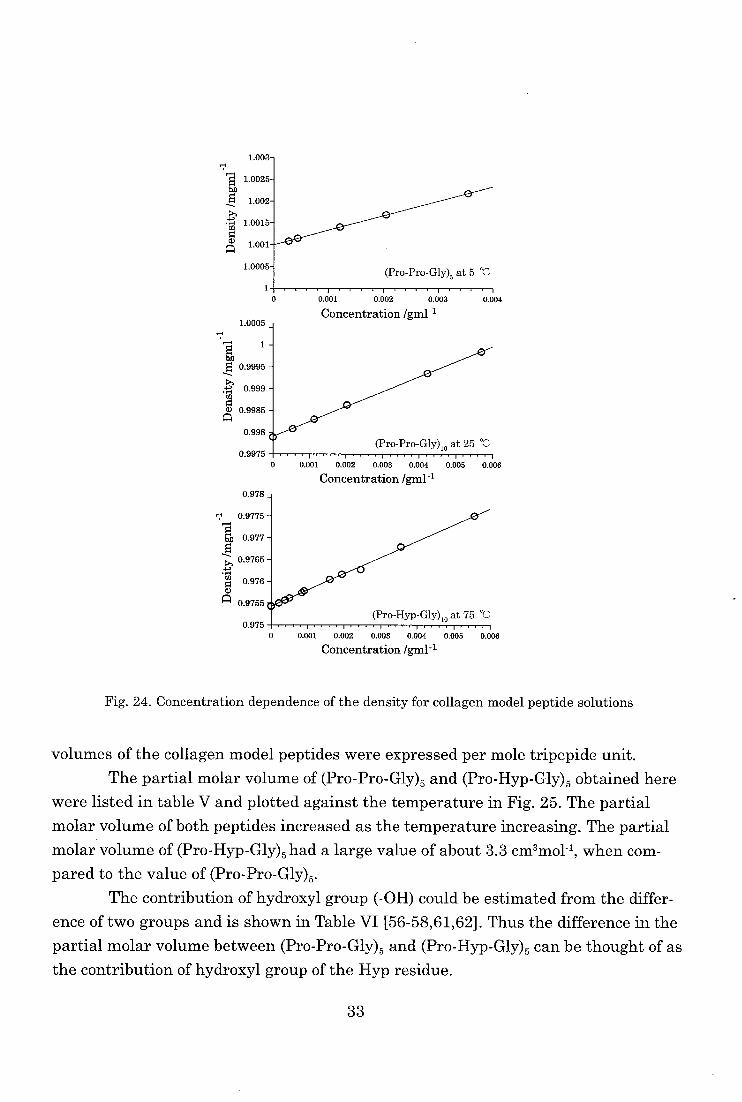
Partial specific volume of collagen model peptides
As shown in Fig. 24, linear relationships between the concentration and density
for all the polypeptide solutions were obtained for the temperature and the concentra-
tion range studied. The partial molar volume of collagen model peptides at each tem-
perature can be obtained from these relationships. In this chapter, the partial molar
32
bA
co
a.)
UA
• I
(1.)
1.003
1.0025
1.002
1.0015
1.001
1.0005
1.0005
1
0.9995
0.999
0.9985
0.998
0.9975
0.978
0.9775
b.0 0.977 5 0.9765
.E8
*
0976 a)
'MI 0.9755
0.975
0 0.001 0.002 0.003
Concentration /gm1-1
0.009
0 0.001 0.002 0.003 0.004 0.005 0.006
Concentration /gml-1
0 0.001 0.002 0.003 0.004 0.005 0.006
Concentration /gm1-1
Fig. 24. Concentration dependence of the density for collagen model peptide solutions
volumes of the collagen model peptides were expressed per mole tripepide unit.
The partial molar volume of (Pro-Pro-Gly)5 and (Pro-Hyp-Gly)5 obtained here
were listed in table V and plotted against the temperature in Fig. 25. The partial
molar volume of both peptides increased as the temperature increasing. The partial
molar volume of (Pro-Hyp-Gly)5 had a large value of about 3.3 cm3mol-1, when com-
pared to the value of (Pro-Pro-Gly)5. The contribution of hydroxyl group (-OH) could be estimated from the differ-
ence of two groups and is shown in Table VI [56-58,61,62]. Thus the difference in the
partial molar volume between (Pro-Pro-Gly)5 and (Pro-Hyp-Gly)5 can be thought of as the contribution of hydroxyl group of the Hyp residue.
33
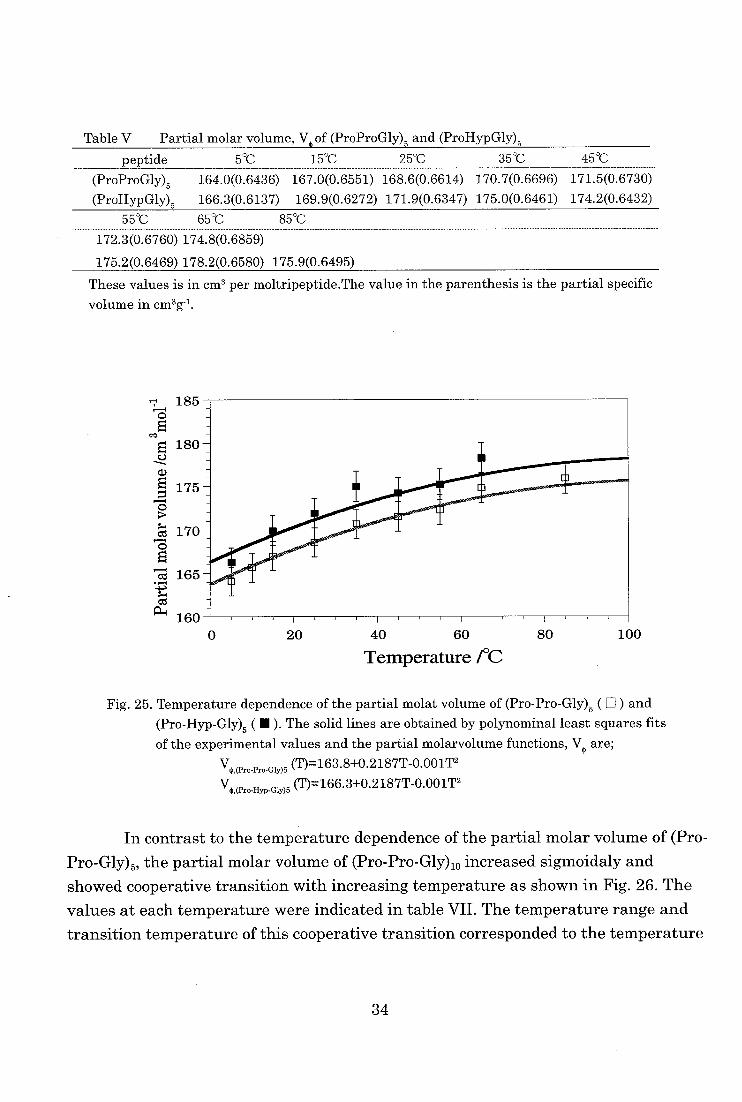
Table V Partial molar volume, V of (ProProGly)5 and (ProHypGly)5
peptide 5'C 15°C 25°C 35°C 45'C
(ProProGly)5 164.0(0.6436)
(ProHypGly)5 166.3(0.6137)
167.0(0.6551) 168.6(0.6614) 170.7(0.6696) 171.5(0.6730)
169.9(0.6272) 171.9(0.6347) 175.0(0.6461) 174.2(0.6432)
55"C 65°C 85C
172.3(0.6760) 174.8(0.6859)
175.2(0.6469) 178.2(0.6580) 175.9(0.6495)
These values is in cm' per moltripeptide.The value in the parenthesis is the partial specific
volume in cm3g-1.
E
as
cd
as
185
180
175
170
165
160
0 20 40 60
Temperature 1°C
80 100
Fig. 25. Temperature dependence of the partial molat volume of (Pro-Pro-Gly)5 ( ) and
(Pro-Hyp-Gly)5 ( • ). The solid lines are obtained by polynominal least squares fits
of the experimental values and the partial molarvolume functions, V4, are;
V4:^,(Pro-Pro Gly)5 (T)=163.8+0.2187T-0.001T2 VC(Pro-Hyp-Gly)5 (T)=166.3+0.2187T-0.001T2
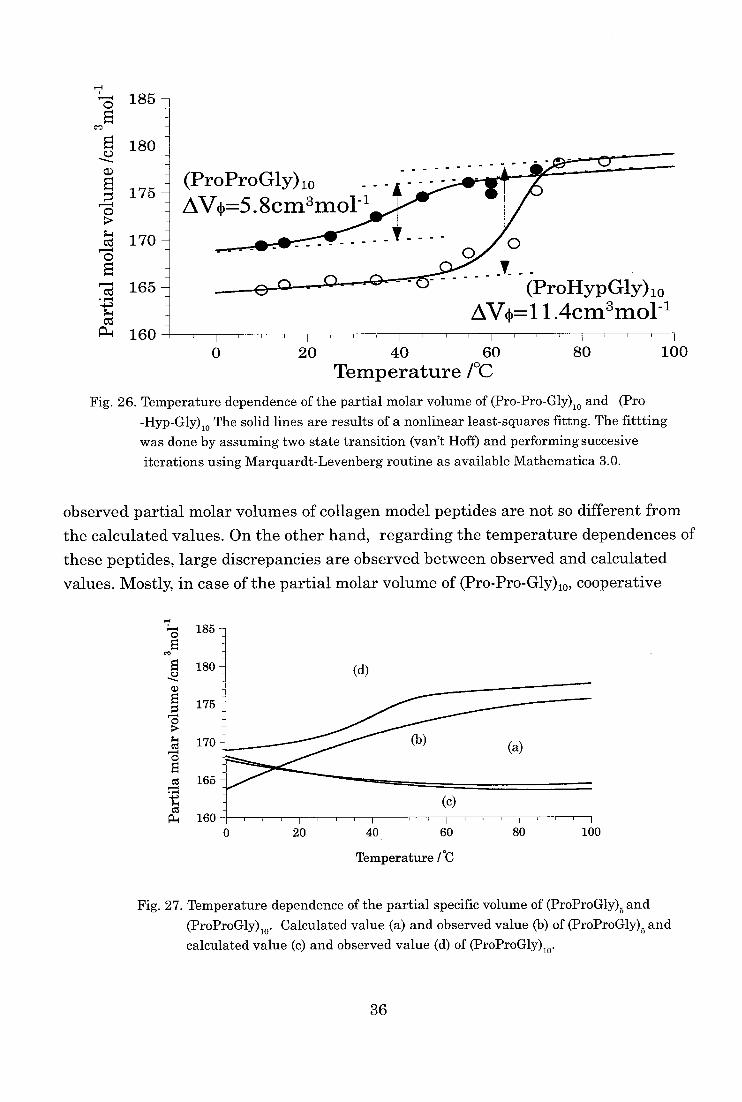
In contrast to the temperature dependence of the partial molar volume of (Pro-
Pro-Gly)5, the partial molar volume of (Pro-Pro-Gly)lo increased sigmoidaly and
showed cooperative transition with increasing temperature as shown in Fig. 26. The
values at each temperature were indicated in table VII. The temperature range and
transition temperature of this cooperative transition corresponded to the temperature
34
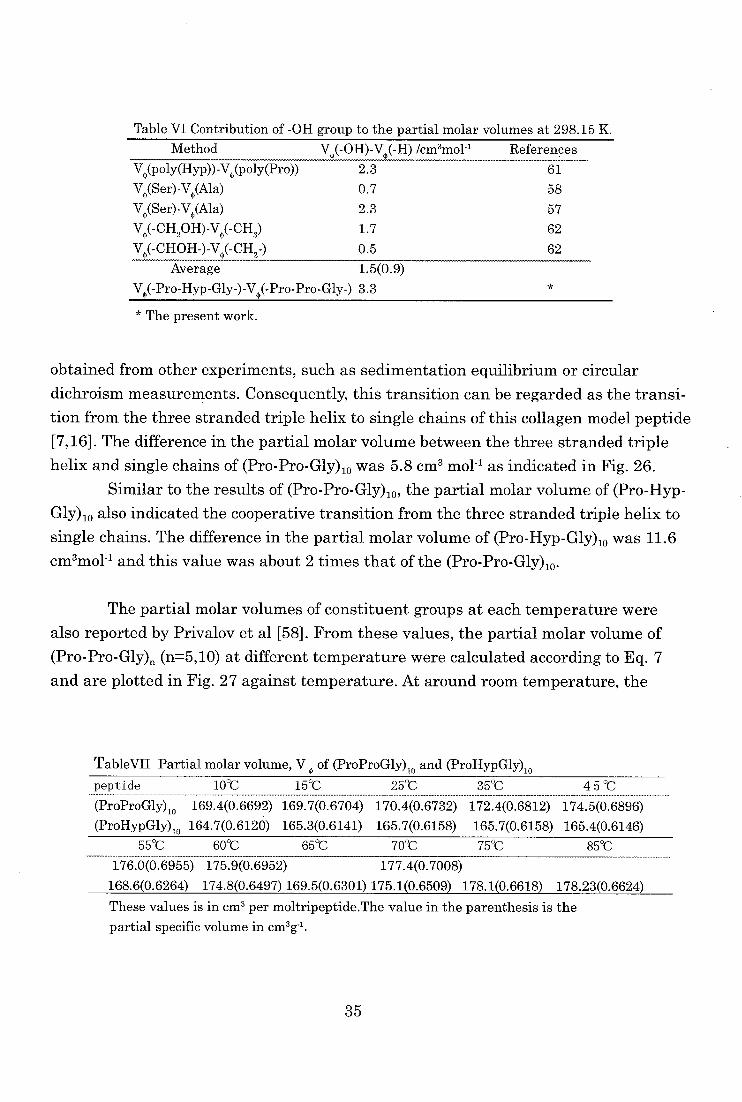
Table VI Contribution of -OH group to the partial molar volumes at 298.15 K.
Method V,(-0H)-V,(-H) /cm3mo1-1 References
V.(poly(Hyp))-V.(poly(Pro))
V.(Ser)-V.(Ala)
V0(Ser)-V.(Ala)
V.(- CH2OH)-V.(- CH3)
V.(- CH OH-)-V.(- CH2-)
2.3
0.7
2.3
1.7
0.5
61
58
57
62
62
Average
V.(-Pro-Hyp-Gly-)-V-Pro-Pro-Gly-)1.5(0.9)
3.3
* The present work .
obtained from other experiments, such as sedimentation equilibrium or circular
dichroism measurements. Consequently, this transition can be regarded as the transi-
tion from the three stranded triple helix to single chains of this collagen model peptide
[7,16]. The difference in the partial molar volume between the three stranded triple helix and single chains of (Pro-Pro-Gly)10 was 5.8 cm3 moll as indicated in Fig. 26.
Similar to the results of (Pro-Pro-Gly)10, the partial molar volume of (Pro-Hyp-
Gly)10 also indicated the cooperative transition from the three stranded triple helix to
single chains. The difference in the partial molar volume of (Pro-Hyp-Gly)10 was 11.6
cm3mol-' and this value was about 2 times that of the (Pro-Pro-Gly)10.
The partial molar volumes of constituent groups at each temperature were
also reported by Privalov et al [58]. From these values, the partial molar volume of
(Pro-Pro-Gly)„ (n=5,10) at different temperature were calculated according to Eq. 7 and are plotted in Fig. 27 against temperature. At around room temperature, the
TableVII Partial molar volume, V . of (ProProGly)10 and (ProHypGly)10peptide 10°C 15°C 25°C 35°C 4 5 °C
(ProProGly)10
(ProHypGly)10
169.4(0.6692) 169.7(0.6704) 170.4(0.6732)
164.7(0.6120) 165.3(0.6141) 165.7(0.6158)
172.4(0.6812)
165.7(0.6158)
174.5(0.6896)
165.4(0.6146)
55°C 60°C 65°C 70°C 75°C 85°C
176.0(0.6955)
168.6(0.6264)
175.9(0.6952) 177.4(0.7008)
174.8(0.6497) 169.5(0.6301) 175.1(0.6509) 178.1(0.6618) 178.23(0.6624)
These values is in cm3 per moltripeptide.The value in the parenthesis is the
partial specific volume in cm3g-1.
35
74
0 E
EceD
0
—.....
a)
E
51
ct
8 E cd
cd 1:14
185 7
180
175
170
165
160 I i" I I I I 0 20 40 60 80 100
Temperature 1°C
Fig. 26. Temperature dependence of the partial molar volume of (Pro-Pro-Gly). and (Pro -Hyp-Gly)
io The solid lines are results of a nonlinear least-squares fittng. The fittting was done by assuming two state transition (van't Hoff) and performing succesive
iterations using Marquardt-Levenberg routine as available Mathematica 3.0.
observed partial molar volumes of collagen model peptides are not so different from
the calculated values. On the other hand, regarding the temperature dependences of
these peptides, large discrepancies are observed between observed and calculated
values. Mostly, in case of the partial molar volume of (Pro-Pro-Gly)io, cooperative
;--40 185 E
180
175
cz$1 170
5 as 165
-4-D
1600 20 40 60
Temperature 1°C
80 100
Fig. 27. Temperature dependence of the partial specific volume of (ProProGly)5 and
(ProProGly)io. Calculated value (a) and observed value (b) of (ProProGly)5 and calculated value (c) and observed value (d) of (ProProGly)10.
36
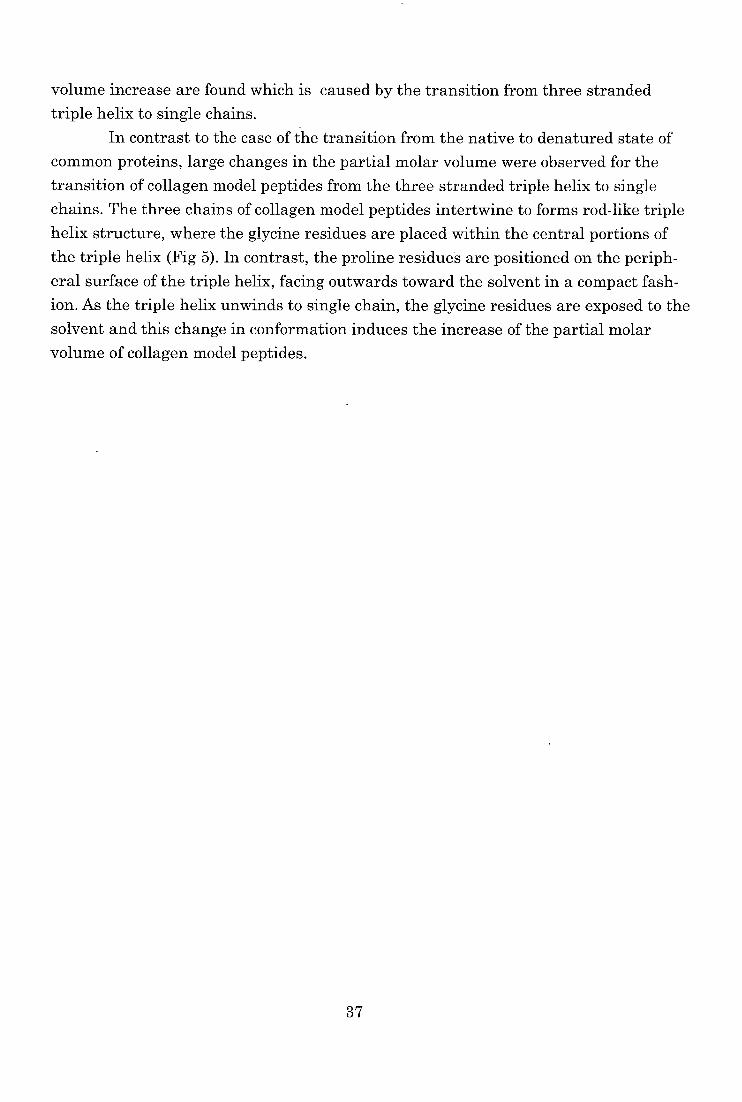
volume increase are found which is caused by the transition from three stranded
triple helix to single chains.
In contrast to the case of the transition from the native to denatured state of
common proteins, large changes in the partial molar volume were observed for the
transition of collagen model peptides from the three stranded triple helix to single
chains. The three chains of collagen model peptides intertwine to forms rod-like triple
helix structure, where the glycine residues are placed within the central portions of
the triple helix (Fig 5). In contrast, the proline residues are positioned on the periph-
eral surface of the triple helix, facing outwards toward the solvent in a compact fash-
ion. As the triple helix unwinds to single chain, the glycine residues are exposed to the
solvent and this change in conformation induces the increase of the partial molar
volume of collagen model peptides.
37
Conclusion
Several new and important discoveries about the transition of the triple helix
to single chains of collagen model peptides have been obtained using various physico-
chemical methods. The author has found in differential scanning calorimetry studies,
especially from the specific heat capacity curves and the raising rate dependence of
the transition, that the thermal transition of collagen model peptides exhibit an phase
transition. Furthermore, the author succeeded in evaluating thermodynamic quanti-
ties of the transition from the triple helix to single chains, based on detailed studies of
the raising rate dependence of the heat capacity curves. The transition temperature of
(Pro-Hyp-Gly)10 is found to be higher than that of (Pro-Pro-Gly)10 and (Pro-Hyp-Gly)io is more stabilized because of a larger enthalpy difference between two states.
From the determination of the temperature dependence of the partial molar
volumes of collagen model peptides it was found that the partial molar volumes in-
crease markedly as the transition proceeds. The increase in the partial molar volumes
of (Pro-Hyp-Gly)10 was found to be distinctly larger than that of (Pro-Pro-Gly)10. This
is another important physical quantity, which directly indicates the difference in the
nature of the transition of (Pro-Pro-Gly)10 and (Pro-Hyp-Gly)10. At the same time this
difference is closely related to the difference in the ratio of the entropy change of the
transition to the enthalpy change of the transition which in turn determines the tran-
sition temperature.
Another finding made by the author using NMR, the low temperature triple helix — high temperature triple helix transition, is still under investigation. Briefly, the
author has found that this transition accompanies absorption of heat at a specific
temperature irrespective of the solution system studied.
38
References
[1] Linsenmayer, T. F. (1991) Cell Biology of Extracellar Matrix 2nd ed., Hay, E. D., Ed., New York : Plenum Press, pp.7-44
[2] Rich, A. and Crick, F.H.C. (1955) Nature 176, 915.
[3] Ramachandran, G.N. and Kartha, G. (1955) Nature 176, 593.
[4] Brodsky-Doyle, B., Leonard, K.R. and Reid, K.B., (1976) Biochem. J 159, 279.
[5] Kodama, T., Freeman, M., Rohrer, L., Zabrecky, J., Matsudaira, P. and Krieger, M.(1990) Nature 343, 531.
[6] Rich, A. and Crick, F.H.C. (1961) J .Mol. Biol. 3, 483.
[7] Kobayashi, Y, Sakai, R., Kakiuchi, K. and Isemura, T. (1970) Biopolymers 9, 415.
[8] Sakakibara, S., Inoue, K., Shudo, K., Kishida, Y. Kobayashi., Y and Prockop, D.J.
(1973) Biochim. Biophys. Acta 303, 198-202.
[9] Fields, G.B. and Prockop, D.J. (1996) Biopolymers 40, 345.
[10] Okuyama, K., Okuyama, K., Arnott, S., Takayanagi, M., and Kakudo, M. (1981) J. Mol. Bio1152, 427-443.
[11] Bella, J., Eaton, M., Brodsky, B. and Berman, H.M. (1994) Science 266, 75
[12] Bella, J., Brodsky, B. and Berman, H.M. (1995) Structure 3, 893
[13] Kramer, R. Z., Vitagliano, L., Bella, J., Berisio, R., Mazzarella, L., Brodsky, B.,Zagari, A., and Berman, H. M. (1998) J Mol. Biol. 280, 623-638.
[14] Nagarajan, V., Kamitori, S., and Okuyama, K. (1998) J. Biochem. 124, 1117-1123.
[15] Lazarev, Y. A., Grishkovsky, B.A., Khromova, T. B., Lazareva, A. and Grechishko, V. S. (1992) Biopolymers 32, 189.
[16] Engel, J., Chen, H.T., Prockop, D.J. and Klump, H. (1977) Biopolymers 16, 601.
[17] Li, M.H., Fan, P., Brodsky, B. and Baum, J. (1993) Biochemistry 32, 7377-7387.
[18] Long, C.G., Braswell, E., Zhu, D., Apigo, J., Baum, J. and Brodsky, B. (1993) Biochemistry 32, 11688.
[19] Feng, Y., Melacini, G., Taulane, J. P. and Goodman, M. (1996) Biopolymers 39, 859.
[20] Feng, Y., Melacini, G. and Goodman, M. (1997) Biochemistry 36, 8716.
[21] Nemethy, G. and Scheraga, H.A. (1984) Biopolymers 23, 2781-2799
[22] Burjanadze, T. V. (1992) Biopolymers 32, 941-949
[23] Nemethy, G., Gibson, K. D., Palmer, K. A., Yoon, C. N., Paterlini, G., Zagari, A., Rumsey, S. and Scheraga, H. A. (1992) J. Phys. Chem. 96, 6472
[24] Brandts, J.F. and Lin, L. (1990) Biochemistry 29,6927.
[25] Scholtz, J.M, Marqusee, S., Baldwin, R.L., York, E.J, Stewart, J.M., Santoro, M.M. and Bolen, D.W. (1991) Proc. Natl. Acad. Sci. U.S.A. 88,
2854.
39
[26] Privalov, P.L. and Potekhin, S.A. (1986) Methods in Enzymology 131, 4.
[27] Gibbs, J.H. and DiMarzio, E. A. (1959) J. Chem. Phys. 30, 271.
[28] Zimm, B. H. and Bragg, J. K. (1959) J Chem. Phys. 31, 526.
[29] Lifson, S. and Roig, A. (1961) J Chem. Phys. 34, 1963.
[30] Poland, D. and Scheraga, H. (1966) J Chem. Phys. 45, 1456.
[31] Poland, D. and Scheraga, H. (1966) J Chem. Phys. 45, 1464.
[32] Grosberg, A.Y. and Khokhov, A. R. (1994) Statistical physics of macromol ecules, AIP, New York.
[33] Sutoh, K. and Noda, H. (1975) Biopolymers 13, 2477.
[34] Shaw, B. R. and Schurr, M. (1975) Biopolymers 14, 1951.
[35] Freire, E., van Osdel, W. W., Mayorga, 0. L. and Sanchez-Ruiz, J. M.
(1990) Ann. Rev Biophys. Biophys. 19, 159.
[36] Privalov, P.L. (1980) Pure Appl. Chem. 52, 479.
[37] Sturtvant, J. M. (1987) Ann. Rev. Phys. Chem. 38, 463.
[38] Scholtz, J. M, Marqusee, S. Baldwin, R. L. York, E. J. Stewart, J. M., Santoro, M.M. and Bolen., D. W. (1991) Proc. Natl. Acad. Sci. U. S. A. 88,
2854.
[39] Privalov, P.L. (1979) Adv Protein Chem. 33,167.
[40] Makhatadze, G.I. and Privlov, P.L. (1990) 1 Mol. Biol. 213, 375.
[41] Makhatadze, G.I. Medvedkin, V.N. and Privlov, P.L. (1990) Biopolymers 30, 1001
[42] Lumry, R. and Rajender, S. (1970) Biopymers 9, 1125.
[43] Slijper, M. Bonvin, A. M. Boelens, R. and Kaptein, R. (1996) 1 Mol. Biol. 259, 761.
[44] Arcus, V. L. Vuilleumier, S. Freund, S. M. Bycroft, M. and Fersht, A. R.
(1995) J. Mol. Biol. 254, 305.
[45] Kobayashi, Y. and Kyogoku, Y. (1973) Biopolymers 81, 337-347.
[46] Brodsky, B., Li, M.H., long, C.G. Apigo, J. and Baum, J. (1992) Biopoly mers 32, 447.
[47] Rance, M., Sorensen, 0.W., Bodenhausen, G., Wagner, G., Ernst, R.R. and Wuthrich, K. (1984) Biochem.Biophys.Res. Commun. 117, 479-485
[48] Hurd, R. E. and John, B. K. (1991) 1 Magn. Reson. 91, 648.
[49] Bothner, A. A., Stephens, R. L., Lee, J., Warren, C. D. and Jeanloz, R.W.,
(1984) 1 Am. Chem. Soc. 106, 811.
[50] Kobayashi, Y, Kyogoku, Y and Inoue, K. (1982) Abstract, 10th Int. Conf on Magnetic Resonance in Biological Systems, Stanford, CA, p. 179.
[51] Kemp, D. S. (1979) The Peptides: Analysis, Synthesis, Biology, vol. 1, Academic Press, New York, p315.
40
[52] Poznanski, J., Ejchart, A., Wierzchowski, K.L. and Ciurak, M. (1993) Biopolymers 33, 781-795.
[53] Raligh, D.P., Evans, P.A. Pitkeathly, M. and Dobson, C. M. (1992) J. Mol. Biol. 228, 338.
[54] Patel, D.J. Pardi, A. and Itakura, K. (1982) Science 216, 581.
[55] Eisenberg, H. (1976) In Biological Macromolecules and Polyelectrolytes in solu tion, Oxford : Clarendon Press.
[56] Cohn, E. J., Edsall, J. T. (1943) In Proteins, Amino Acids and Peptides, New York : Reinhold, 155-176.
[57] Zamyatnin, A. A. (1984) Annu. Rev Biophys. Bioeng. 13, 145-165.
[58] Makhatadze, G. I., Medvedkin, V. N., and Privalov, P. L. (1990) Biopolymers 30, 1001-1010.
[59] Chalikian, T. V., Volker, J., Anafi, D., and Breslauer, K. J. (1997) J Mol. Biol. 274, 237-252.
[60] Chalikian, T. V., Totrov, M., Abagyan, R., and Breslauer, K. J. (1996) J. Mol. 260, 588-603.
[61] Knof, S., and Engel, J. (1974) Israel J. Chem. 12, 165-177.
[62] Durchschlag, H. (1986) Thermodynamic Data for Biochemistry and Biotechnology, Hinz, H.-J., Ed., Berlin: Springer-Verlag, pp 45-128.
41
List of publications
Uchiyama, S., Kai, T., Kajiyama, K., Kobayashi, Y., and Tomiyama, T. (1997). Mea
surement of thermodynamic quantities in the heating-rate dependent thermal
transitions of sequenced polytripeptides. Chem. Phys. Lett. 281, 92-96.
Kai, T., Uchiyama, S., Kajiyama, K., Kobayashi, Y., and Tomiyama, T. (1997). NMR
observation of two states of triple helix in the thermal transition of (Pro-Pro-
Gly)10. Chem. Phys. Lett. 281, 86-91.
Kajiyama, K., Tomiyama, T., Uchiyama, S., and Kobayashi, Y. (1995). Phase
tranasitions of sequenced polytripeptides observed by microcalorimetry. Chem.
Phys. Lett. 247, 299-303.
Related publications
Ogawa, K., Nishimura, S., Uchiyama, S., Kobayashi, K., Kyogoku, Y., Hayashi M., and
Kobayashi, Y. (1998). Conformation analysis of eel calcitonin. Eur. J. Biochem.
257, 331-336.
Tomiyama, T., Uchiyama, S., and Shinohara, H. (1997). Solubility and partial specific
volume of C60 and Gm. Chem. Phys. Lett. 264, 143-148.
42
Acknowledgements
The studies presented in this thesis have been performed under the direction
of Professor Yuji Kobayashi, Graduate School of Pharmaceutical Sciences, Osaka
University and Dr. Tetsuo Tomiyama, Graduate School of Science, Nagoya University . The author is indebted to my teachers, colleagues and co-workers, who have
provided his inspiration, criticism and enlightenment for my work. The author would like to express my sincere gratitude to Professor Yuji Kobayashi and Dr. Tetsuo
Tomiyama for their cordial guidance and helpful criticism and encouragement. In the
preparation of this thesis the author has greatly benefited from the advice of Dr. Tetsuo Tomiyama.
The present research owes much to the precise amino acid analysis performed
by Dr. Yoshiko Yagi (Institute for protein science, Osaka University).
The author also wishes to thank Mr. Koichi Kajiyama (President of Admon
Science Inc. Fujieda) for providing me with instruments and valuable advice. The au-
thor wishes to express my gratitude to Professor Hisanori Shinohara (Graduate School
of Science, Nagoya University) for helpful comments. Thanks are also due to Dr. Eu-
gene Permyakov (Russian Academy of Science) for his suggestion regarding instrumen-tation. Special thanks are due to Kazuhiro Fukada (Tokyo Metropolitan University) for
allowing use of his density meter and expertise. The author also wishes to thank Profes-
sor Yoshimasa Kyogoku (Institute for Protein Research, Osaka University) and Dr.
Tadayasu Ohkubo (Pharmaceutical Sciences, Osaka University) for helpful advices.
Thanks are also due to Professor Takeshi Imanishi, Professor Motomasa Kobayashi
and Professor Hidenobu Omori (Pharmaceutical Sciences, Osaka University) for read-
ing the draft and making a number of helpful suggestions. The author gratefully
acknowledge helpful discussions with Takuya Yoshida (Pharmaceutical Sciences,
Osaka University), Tsutomu Kai and Yoshinori Nishi (Graduate School of Science,
Nagoya University). Finally, thanks are also due to Hideto Shimahara, Tetsuya Ishino,
Tomohisa Hatta, Kaoru Kobayashi and all members of the Laboratory of Physical
Chemistry of Pharmaceutical Sciences.
Lastly, I thank my wife Izumi for her understanding and support during the course of
this work. And I wish to thank my parents for their care and support.
43