barcelona observatory 2016
TRANSCRIPT
R E P O R T 2 0 1 6

We are pleased to present the 2016 Barcelona Observatory report, which showcases the positioning of Barcelona and its metropolitan area as a competitive and innovative space.
In a year of economic recovery after the impact of the reces-sion, Barcelona has established itself in the international context as a global city –taking the 20th position in the Global Power City Index ranking developed by the prestigious Mori Memorial Foundation– and boosting its innovation profile by taking 9th position amongst the most attractive European cities in terms of digital entrepreneurship. This is especially important given the strategic importance of hosting the Mobile World Capital.
These results are the fruit of a city in continuous trans-formation as we move towards an economic model that we want to be competitive, fair and sustainable. We want a diversified and innovative economic model that drives local industry, promotes local commerce, and combines attractive foreign investment options and internationaliza-tion with the potential of our creative and entrepreneurial ecosystem. All this, with a central objective: the creation of quality employment as the best mechanism for reducing inequality. That is why, for the first time, the Observato-ry report incorporates a vision of social cohesion, as such making this one of the priority issues for the municipal government.
Barcelona has significant assets that can help to achieve these ambitious goals. The city enjoys a strong brand image internationally, being placed among the top fifteen cities, for example, with the best reputation in the world (City RepTrak 2016) and among the fifteen safest cities at the global level (Economist Intelligence Unit). Barcelona is also a hub for generating and attracting talent, as shown by the significant critical mass of people working in sectors with high added value in the Catalan labour market, which has more than 730,000 employees in science and technology, a leading position (5th and 17th at the European and the world level) in terms of scientific production, a high percentage of workers with university degrees or the fact that we have
two business schools in the top ten in Europe. Also, crea-tion, culture and design are key elements in our competi-tiveness, and therefore there is a commitment to promote the creative industries.
In short: innovation, research, entrepreneurship and creativity, together with infrastructure and collective talent –these will be key elements in the future success of Barcelona–.
Barcelona offers a high quality of life, a key element in at-tracting and retaining talent, and there is a significant bal-ance between its benefits and moderate costs compared with other European and the world cities. The data pre-sented shows that Barcelona and its metropolitan area is a global city, and, therefore we are competing in the league of large cities. It is with these cities that we want to coop-erate in order to meet major XXI century social, economic and environmental issues, being fully aware that cities will play a key role in the answers to these challenges.
By presenting this fourteenth annual Barcelona Observato-ry report, I want to convey my congratulations to the tech-nical team of the Chamber of Commerce and City Council, who have made this publication possible, and I also want to thank the involvement of organizations that support the publication. This is a good example of co-operation be-tween institutions, which is a characteristic in our histo-ry, and we should remember that Barcelona is a collective project of institutions, companies and civil society.
Jaume Collboni CuadradoSecond Deputy Mayor for Business, Culture and Innovation
BARCELONA OBSERVATORY REPORT 2016 2 Presentation
Presentation
Barcelona has been benefiting from the effects of eco-nomic recovery since 2014. As a result, 2016 has been the most positive year since 2007, and all indicators show that the economy of the city recorded a growth rate similar to 2015. We should remember that GDP growth in the city of Barcelona was 3.2% in 2015, al-most double the previous year (1.7%). Also, both the number of companies and the rate of employment in-creased in 2016 for the third consecutive year, and at the same time, the number of unemployed people fell for the fourth consecutive year. These data confirm the positive outlook of Barcelona’s economy. Meanwhile the city is consolidating its position as the driving force in Southern Europe. Internal factors that have contributed to this economic recovery include the revitalization of domestic consumption and investment, which have ben-efited from a more tolerant fiscal policy, and a renewed confidence in the economy.
This is shown in the results of the Business climate survey which has been carried out on more than 1,000 companies in the Metropolitan Area, and which is pub-lished as a special report in this publication. 2015 and 2016 have registered the best results in the survey since the data series began in 2009, which is in line with the improving economic situation. Indeed, businesses in the Metropolitan Area indicate that business perfor-mance remained positive during the four quarters of 2016; the growth rate is being maintained despite years of poor performance. In addition, the general economic improvement is seen across all sectors except the con-struction business, which is nearing stability and which recorded similar levels to 2015.
This positive economic trend in the Metropolitan Area is confirmed by the results of a survey on business pros-pects for 2016 by Eurochambres, which is favourable and, moreover, represents a significant improvement on the previous year, especially in terms of domestic sales. This favourable economic outlook is a boost for the at-tractiveness of the city as a hub of economic activity. As such, 2016 saw Barcelona improving its position regard-
ing the overall competitiveness of the city, standing in 20th place and it is now amongst the fifteen top cities in the world with the best reputation. The appeal of Barce-lona and its strong positive image abroad for business are also very obvious in the field of international invest-ment, with the city now occupying 8th position amongst the principal urban areas of the world attracting foreign investment projects during the period 2012-2016, ac-cording to KPMG. It is also the first city in terms of large urban cities attracting foreign investment, according to the European Cities and Regions of the Future report 2016/17 by fDi Magazine. These results, along with oth-er indicators presented in the 2016 Barcelona Observa-tory report, give us a strong feeling of optimism.
I want to finish by thanking the technical team for their work and effort and continuous improvements to the Barcelona Observatory project, which this year has a new design. I would also like to thank all those organiza-tions that have worked to provide information to enrich the content of the report that we hereby present. Miquel Valls i MasedaPresident of the Chamber of Commerce, Industry, Services
and Navigation of Barcelona
BARCELONA OBSERVATORY REPORT 2016 3 Presentation

BARCELONA CITY COUNCIL
Jaume Collboni CuadradoDeputy Mayor for Business, Culture and Innovation
Salvador Illa i RocaGeneral Manager of Business, Culture and Innovation
Àngels Santigosa i Copete Head of the Political Economy and Local Development Studies Department
BARCELONA CHAMBER OF COMMERCE
Miquel Valls i Maseda President
Xavier Carbonell i Roura General Manager
Joan Ramon Rovira i Homs Head of the Economic and Infrastructure Studies Department
TECHNICAL TEAM
Political Economy and Local Development Studies Department, Barcelona City Council
Teresa Udina Abelló Laura Lahoz GonzálezEconomists
Barcelona Chamber of Commerce’s Economic and Infrastructure Studies Department
Carme Poveda i MartínezEconomist
Sandra Gutiérrez i Cubero Statistics and graduate in market research
Graphic design, coordination and design layout
Toni Fresno Barcelona Chamber of Commerce
BARCELONA OBSERVATORY REPORT 2016 4 Credits
Credits

Contents
7 INTRODUCTION
11 BARCELONA FACTS AND FIGURES 2015
15 RESULTS
17 A hub for economic activity
19 Introduction
20 Global competitiveness of cities in the world in 2016
21 World’s cities with the best reputations in 2016
22 Main urban areas in the world receiving foreign investment projects in 2016
23 Entrepreneurial activity in countries across the world in 2015
25 Business outlook in the European Union for 2016
27 Main cities in the world in terms of delegate numbers and international congresses held in 2015
29 Quality of life, sustainability and social cohesion
31 Introduction
32 Safety in cities around the world in 2015
33 Sport in cities around the world in 2015
34 Distribution of income in the main regions of the OECD
35 Population at risk of poverty or social exclusion in Europe’s regions in 2015
36 Sustainable Cities in 2015
37 CO2 emissions, equivalent per capita in cities around the world in 2016
39 Labour market and training
41 Introduction
42 Employment rate in European regions in 2015
44 Unemployment rate in European regions in 2015
45 Working population with a university degree in European regions with tertiary education in 2015
46 Best European business schools in 2016
49 Knowledge society 51 Introduction
52 Population employed in technology manufacturing and technology services in European regions in 2015
54 Population employed in science and technology in 2015 and expenditure on research and development in European regions in 2013
56 Main cities in the world for academic scientific output in 2015
58 Patent applications in the principal OECD provinces in 2013
60 European Digital City Index in 2016
63 Tourism 65 Introduction
66 Top European airports in terms of passenger traffic in 2015
68 International tourists in cities around the world in 2014
69 Cruise traffic at Europe’s main ports in 2015
71 Prices and costs 73 Introduction
74 Cost of living in cities around the world in 2015
76 Corporation tax and VAT in countries around the world in 2016
78 Office rental prices in cities in Europe, the Middle East and Africa in 2015
80 Retail rental prices in cities around the world in 2015
82 Industrial land rental prices in cities in Europe, the Middle East and Africa in 2015
84 Wage levels in cities around the world in 2015
87 SUMMARY OF RESULTS
88 Summary of results
93 Barcelona’s position in international rankings
95 SPECIAL REPORT
97 Business Climate in the Metropolitan Area of Barcelona Situation in 2015 and outlook for 2016
99 Executive summary
100 Situation and trends in the business climate in 2015
108 Factors that limited business performance in 2015
111 Situation and outlook for business performance in 2016
112 Appendix on methodology
BARCELONA OBSERVATORY REPORT 2016 5 Contents


INTRODUCTION


Introduction
We hereby present the 2016 Barcelona Observatory report.
The Observatory is an initiative developed by the Barce-lona City Council and the Barcelona Chamber of Com-merce with the support of other organizations in the city that year after year collaborate by providing information and making key contributions on their sectors.
This fourteenth edition of the annual Barcelona Obser-vatory report is designed to continue offering references that can be used as a basis for decision-making by busi-ness stakeholders interested in doing business here or setting up a business, or to attract talent and support can-didature bids for events or for the opening of new branch offices in Barcelona. To this end, as every year, the report presents Barcelona’s positioning regarding the world’s major cities on a set of economic and social reference in-dicators.
The 2016 report has a new format that improves data visualization, and offers a number of new features as summarized below:
• A selection of 30 significant indicators that provide readers an efficient overview regarding the position-ing of the city and the challenges to be met in six sub-ject areas: a hub for economic activity, quality of life, sustainability and social cohesion, labour market and training, the knowledge society, tourism, and prices and costs.
New features in this year’s report include six new indica-tors and an analysis of social cohesion for the first time. These are: sport in cities around the world, inequalities in income distribution via the Gini coefficient, the at risk of poverty or social exclusion rate –AROPE–, the sus-tainability index for the environment situation, and CO2
emissions equivalent per capita –indicators that are included in the chapter on Quality of life, sustainability and social cohesion–, as well as the index of digital cities, included in the Knowledge Society chapter.
• The inclusion of new visual elements for each indicator, with charts or maps that facilitate understanding of the results and analysis of its trend line.
• A summary table that presents all the indicators to visualize the results and graph international posi-tioning on different rankings.
• A special report by the Chamber of Commerce on the business climate in the Metropolitan Area of Barcelona in 2015 and the outlook for 2016, which includes a specific analysis of the main economic sectors. Based on the opinions of businesses, we offer a reading of the business environment in Cat-alonia and Barcelona, as well as the future scenar-io.
The Barcelona Observatory is characterized by the following features:
• It is built on a set of indicators, preferably defined at the city level, but that can also be extended to other regional areas.
• The information sources are renowned organiza-tions and institutions.
• Most sources are international rankings except for ten indicators, whereby data was obtained from a sample containing the main urban areas.
• The indicators include, where possible, a graphical representation of trends to assess progress on each specific area.
• Data and information collected are up-to-date, based on the current availability.
BARCELONA OBSERVATORY REPORT 2016 9 Introduction


FACTS AND FIGURESBARCELONA 2015

Barcelona facts and figures 2015
BARCELONA OBSERVATORY REPORT 2016 12 Barcelona facts and figures 2015
Copenhagen
Oslo Stockholm
Warsaw
Berlin
Prague Frankfurt
Munich
Zurich
Lyon Geneva
Milan
Amsterdam
Brussels
London
Dublin
Paris
Bilbao
Palma
BarcelonaZaragoza
Madrid
Lisbon
Athens Seville
Algiers
Rabat
Tunis
Rome
1,800 km
2h 30 min
1,000 km
1h 40 min

Surface area (km2) 102.2Population 1,604,555Foreign population (% of total) 16.3%Density (inhabitants/km2) 15,706Climate (Can Bruixa Observatory) Average monthly temperature 18.4 ºC Yearly rainfall (mm) 316.9 Hours of sun 2,867.5
MACRO ECONOMIC DATA GDP (var/ yr %) - Catalonia 3.4GDP (var/ yr %) - Barcelona 3.2Social Security membership 1,027,455Unemployment rate 16-64 years old (%) 13.3Employment rate 16-64 years old (%) 69.2Activity rate 16-64 years old (%) 79.8CPI (average var. %) - Barcelona province 0.0Exports (million €) - Barcelona province 50,166.5Imports (million €) - Barcelona province 62,673.8Outbound foreign investment (million €) - Catalonia 4,315.0Inbound foreign investment (millions €) - Catalonia 4,886.2Companies - Barcelona province 450,451Foreign companies in Catalonia 6,454
COMMERCE AND TOURISM Retail premises - Barcelona province 68,315Open-air shopping areas 22Municipal markets (number and surface area [m2]) 43/ 209,500Hotels Numbers 391 Beds 67,603 Tourists 8,303,649
INFRAESTRUCTURE Airport Runways (number and length [m]) 3/3,352;2,660;2,528 Passengers 39,711,276 International passengers (%) 73.3
Port Land surface area (ha) 1,081.0 Docks and moorings (km) 22.0 Total traffic (thousands of tonnes) 45,921.3
Trade fair and congress activity Trade fairs 68 Visits to Fira de Barcelona 2,000,000 Hall surface area taken up by fairs (m2) 700,000 International meetings 2,268
Catalan universities 12University students in Catalonia (course 2014/2015) 251,589Foreign schools (Barcelona province) 40Innovative companies in Catalonia* 3,801
Beaches (number and metres) 9; 4,703Bike lanes (km and bicing members) 120; 95,168Public libraries (number and users) 40; 6,175,624Museums, collections and exhibition spaces (number and users) 57; 26,066,903Public sports facilities (number and users) 1,904; 182,230Theatre, music and cinema spectators 9,684,653
Note: Data for 2015 except *2014 Source: AENA, Barcelona City Council, Regional Yearbook Caixa Catalonia, Fira de Barcelona, Generalitat of Catalonia, Idescat, INE, National Institute of Meteorology, State Ports, Secretary of State for Trade, Turisme de Barcelona, Institute of Culture of Barcelona, Ministry of Education.
GEOGRAPHICAL ENVIRONMENT
ECONOMIC ENVIRONMENT
TRAINING AND CITY OF KNOWLEDGE
QUALITY OF LIFE
BARCELONA OBSERVATORY REPORT 2016 13 Barcelona facts and figures 2015

RESULTS


Hub for economic act ivity


Introduction
The economy of the city of Barcelona underwent a recovery process in terms of business activity and labour markets in 2015, and the city experienced a real growth of 3.2% in GDP over the year driven by a recovery in domestic demand, especially household consumption and rising private investment, and strong performance in terms of exports. For 2016, forecasts point to continued growth for the economy, an in-crease in private consumption and investment and a strengthening of export markets. But there are uncertainties about the trend of the world economy stemming from factors such as Brexit, the recovery of oil prices and sluggish activity in Europe that may affect this outlook, as confirmed by the latest macro-economic analysis by the IMF.
This positive trend in the economy is confirmed by the results of a survey on business outlook by Euro-chambres for 2016: results are favourable and signifi-cantly better compared to the previous year, especially in terms of domestic sales, which confirms the strong performance in economic activity in Catalonia. Com-pared with the rest of Europe, Catalonia’s outlook is more favourable for exports, but less favourable for investment and similar regarding domestic sales and employment trends. Moreover, Barcelona improved its position in the ranking of overall city competitiveness, according to the Global Power City Index 2016, by the Mori Foundation, which saw Barcelona jumping six places to stand at 20th position in the world while occu-pying 14th place in terms of its reputation as reflected in the City RepTrak 2016 ranking.
Other indicators also show Barcelona’s attractiveness for business and its strong brand image abroad. On the one hand, Barcelona generates confidence for in-ternational investment, as shown by the fact it occu-pies the eighth position in the ranking of the top ur-ban areas in the world attracting foreign investment projects in the period 2012-2016, according to KPMG. In addition, the report European Cities and Regions of the Future 2016/17, by fDi Magazine, ranks Barcelo-na as the best urban area in terms of its strategy in order to attracting foreign investment, the third best city in southern Europe and tenth in terms of connec-tivity. On the other hand, it is among the top five cit-ies in the world in terms of number of delegates and number of international conferences organized over the period: 2012-2015, according to the International Congress and Convention Association (ICCA).
Regarding entrepreneurship, the rate of entrepreneurial activity (TEA) in the province of Barcelona in 2015 was 6.1%, exceeding that of countries like Norway (5.7%), Italy (4.9%) and Germany (4.7%). Both Barcelona Cham-ber of Commerce and Barcelona City Council have been working on promoting entrepreneurship and contribut-ing to the creation of quality jobs in the city
.
BARCELONA OBSERVATORY REPORT 2016 19 Hub for economic activity
Barcelona saw real growth
of 3.2% in GDP over the last year
driven by a recovery in domestic
demand
4
Source: Global Power City Index 2016. Institute for Urban Strategies. The Mori Memorial Foundation
Categories of urban competitiveness (Positioning of Barcelona)
Global competitiveness
Economy
R&D
Cultural interaction
Livability
Environment
Accessibility
Barcelona among the top 20 cities in terms of global competitiveness
Global competitiveness of cities in the world in 2016
BARCELONA OBSERVATORY REPORT 2016 20 Hub for economic activity
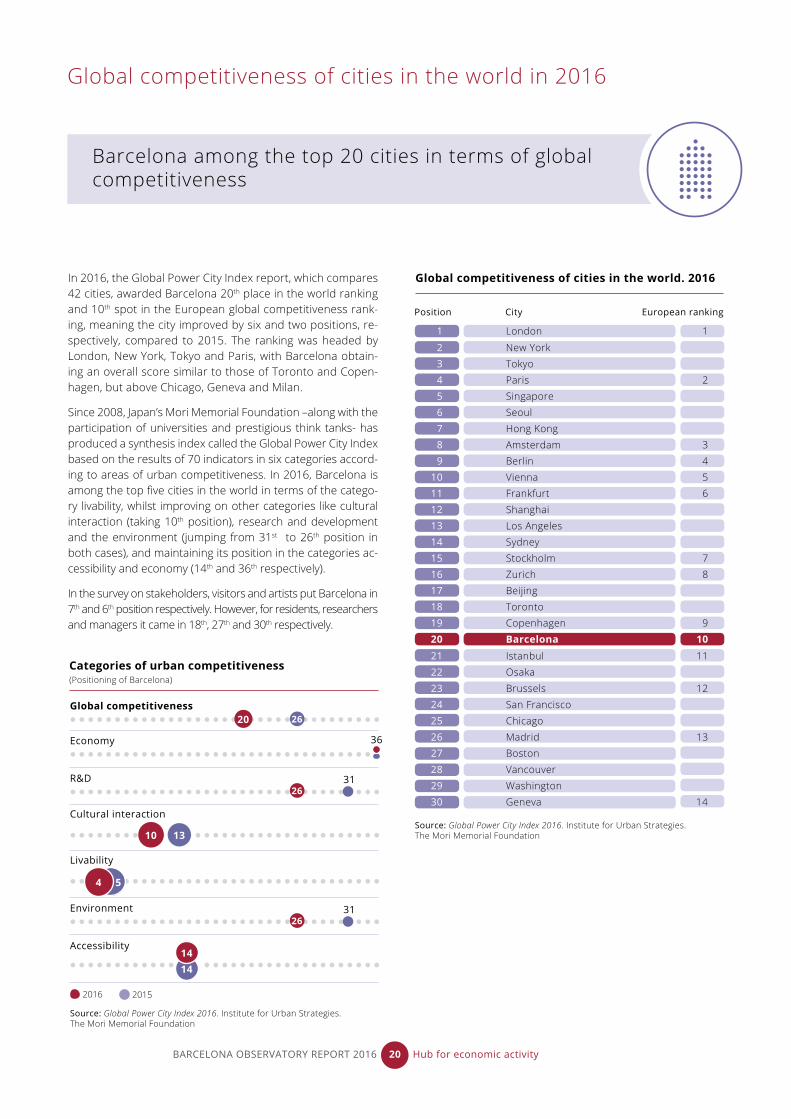
In 2016, the Global Power City Index report, which compares 42 cities, awarded Barcelona 20th place in the world ranking and 10th spot in the European global competitiveness rank-ing, meaning the city improved by six and two positions, re-spectively, compared to 2015. The ranking was headed by London, New York, Tokyo and Paris, with Barcelona obtain-ing an overall score similar to those of Toronto and Copen-hagen, but above Chicago, Geneva and Milan.
Since 2008, Japan’s Mori Memorial Foundation –along with the participation of universities and prestigious think tanks- has produced a synthesis index called the Global Power City Index based on the results of 70 indicators in six categories accord-ing to areas of urban competitiveness. In 2016, Barcelona is among the top five cities in the world in terms of the catego-ry livability, whilst improving on other categories like cultural interaction (taking 10th position), research and development and the environment (jumping from 31st to 26th position in both cases), and maintaining its position in the categories ac-cessibility and economy (14th and 36th respectively).
In the survey on stakeholders, visitors and artists put Barcelona in 7th and 6th position respectively. However, for residents, researchers and managers it came in 18th, 27th and 30th respectively.
Position City European ranking
Global competitiveness of cities in the world. 2016
1 London 1
2 New York 3 Tokyo 4 Paris 2 5 Singapore 6 Seoul 7 Hong Kong 8 Amsterdam 3 9 Berlin 4 10 Vienna 5 11 Frankfurt 6 12 Shanghai 13 Los Angeles 14 Sydney 15 Stockholm 7 16 Zurich 8 17 Beijing 18 Toronto 19 Copenhagen 9 20 Barcelona 10 21 Istanbul 11 22 Osaka 23 Brussels 12 24 San Francisco 25 Chicago 26 Madrid 13 27 Boston 28 Vancouver 29 Washington 30 Geneva 14
20
10 13
14
26
26
26
36
4 5
31
31
14
2016 2015
Source: Global Power City Index 2016. Institute for Urban Strategies. The Mori Memorial Foundation

World’s cities with the best reputation in 2016
Note: The index takes a value between 0 and 100.
Source: 2016 City RepTrack. Reputation Institute
Cities with the best reputation in the world in 2016
BARCELONA OBSERVATORY REPORT 2016 21 Hub for economic activity
1 Sydney 81.8
11 Helsinki 77.7
21 Milan 76.1
Position City Index
2 Vienna 81.7
12 Venice 77.5
22 London 75.6
2 Zurich 80.2
13 Melbourne 77.4
23 Paris 75.2
4 Toronto 79.5
14 Barcelona 77.2
24 Munich 74.7
5 Stockholm 79.5
15 Madrid 76.9
25 Prague 74.4
6 Edinburgh 78.9
16 Frankfurt 76.9
26 Seattle 74.2
7 Montreal 78.7
17 Amsterdam 76.9
27 New York 73.5
8 Rome 78.6
18 San Francisco 76.5
28 Singapore 73.5
9 Vancouver 78.4
19 Tokyo 76.5
29 Berlin 72.9
10 Copenhagen 78.4
20 Dublin 76.3
30 Boston 72.3
Positioning of Barcelona in the City Rep Trak Index (2011-2016)
Source: 2016 City RepTrak. Reputation Institute
2011
2012
2013
2014
2015
2016
Barcelona, among 15 top cities in the world with the best reputation
The results of the City Rep Trak report by the Reputation Institute placed Barcelona in 14th place in terms of the world’s best city reputations in 2016 from a list of 55 cities with the largest population, GDPs and that are most familiar, based on a survey of 23,000 online respondents from influ-ential countries in the world (G8).
The ranking was headed by Sydney, Vienna, Zurich, Toronto and Stockholm, with Barcelona above cities like Madrid, Frankfurt, Amsterdam, San Francisco and Tokyo. Despite dropping positions compared to 2015, Barcelona improved its overall score obtaining 77.2 points out of 100, a result similar to that of Melbourne.
In 2016, respondents rated cities on their attractiveness, the environment, effective government and advanced economy as the basis of a good reputation, which generates and facilitates tourism, foreign investment, knowledge and talent attraction.
In the 2015 ranking, Barcelona obtained 6th place overall, but stood out for its third place for livability, which was evaluated by its culture, lifestyle and the beauty of the city, and it was seventh top for being the most recommended for a visit and tenth for organizing conferences.
6
9
6
7
23
14
Source: Global Power City Index 2016. Institute for Urban Strategies. The Mori Memorial Foundation
Main urban areas in the world receiving foreign investment projects in 2016
BARCELONA OBSERVATORY REPORT 2016 22 Hub for economic activity
Source: Global Cities Investment Monitor 2016. KPMG
Shanghai2
Hong Kong3
Sao Paulo4
New York5
Paris6
Sydney
Barcelona
Beijing
Dublin
7
8
9
10
1,209
943
819
750
699
647
501
490
489
Urban areaPosition Projects2012/2016
1 London 1,663
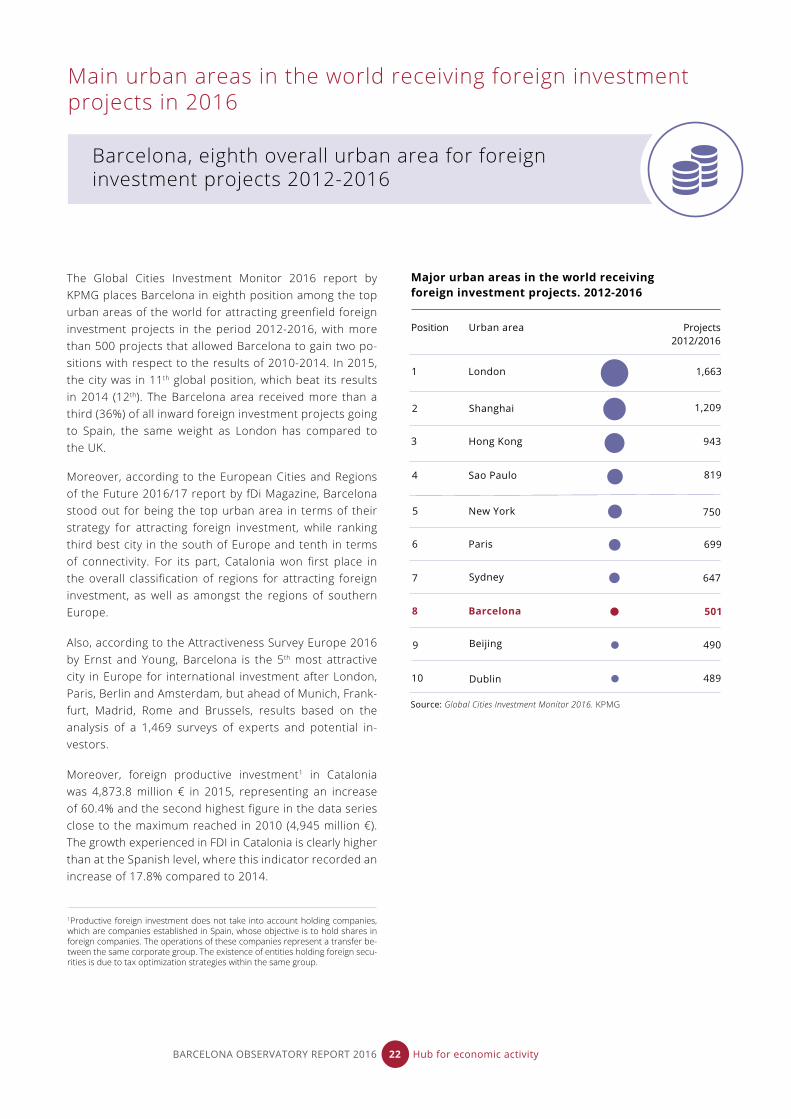
Barcelona, eighth overall urban area for foreign investment projects 2012-2016
1Productive foreign investment does not take into account holding companies, which are companies established in Spain, whose objective is to hold shares in foreign companies. The operations of these companies represent a transfer be-tween the same corporate group. The existence of entities holding foreign secu-rities is due to tax optimization strategies within the same group.
The Global Cities Investment Monitor 2016 report by KPMG places Barcelona in eighth position among the top urban areas of the world for attracting greenfield foreign investment projects in the period 2012-2016, with more than 500 projects that allowed Barcelona to gain two po-sitions with respect to the results of 2010-2014. In 2015, the city was in 11th global position, which beat its results in 2014 (12th). The Barcelona area received more than a third (36%) of all inward foreign investment projects going to Spain, the same weight as London has compared to the UK.
Moreover, according to the European Cities and Regions of the Future 2016/17 report by fDi Magazine, Barcelona stood out for being the top urban area in terms of their strategy for attracting foreign investment, while ranking third best city in the south of Europe and tenth in terms of connectivity. For its part, Catalonia won first place in the overall classification of regions for attracting foreign investment, as well as amongst the regions of southern Europe.
Also, according to the Attractiveness Survey Europe 2016 by Ernst and Young, Barcelona is the 5th most attractive city in Europe for international investment after London, Paris, Berlin and Amsterdam, but ahead of Munich, Frank-furt, Madrid, Rome and Brussels, results based on the analysis of a 1,469 surveys of experts and potential in-vestors. Moreover, foreign productive investment1 in Catalonia was 4,873.8 million € in 2015, representing an increase of 60.4% and the second highest figure in the data series close to the maximum reached in 2010 (4,945 million €). The growth experienced in FDI in Catalonia is clearly higher than at the Spanish level, where this indicator recorded an increase of 17.8% compared to 2014.
Major urban areas in the world receiving foreign investment projects. 2012-2016

Entrepreneurial activity in countries across the world in 2015
Barcelona’s rate is higher than those of Spain, Italy and Germany
According to data from the Global Entrepreneurship Moni-tor (GEM) in 2015, the rate of entrepreneurial activity (TEA)of the resident population in the Barcelona area is 6.1% and in Catalonia 6.4%, so both have fallen 1.2 and 1.1 per-centage points respectively compared with to the previous year.
In 2015, Barcelona and Catalonia’s TEAs exceeded those of countries like Norway (5.7%), Italy (4.9%) and Germany (4.7%), while Catalonia was the fifth region with the highest entrepreneurial activity rate –above the Spanish avera-ge (5.7%)–. However, Barcelona’s TEA remains below the average of the European Union where the activity rate of entrepreneurship also experienced a slight fall to stand at 7.6%.
Moreover, the quality and sustainability of entrepreneurship improved because in the Barcelona area entrepreneurship “to take advantage of a business opportunity” increased from 70% to 79% of the total, while entrepreneurship “out of need” fell from 29% to 20%. In Catalonia there has been an improvement in the business profile and aspirations of entrepreneurs, and in terms of the degree of innovation of the products, services and technologies used, in addition to an increase in the female entrepreneurial activity rate which is approaching the male rate.
Note: Entrepreneurship activity includes early-stage firms (less than three months trading) and new businesses (3 to 42 months of trading).The original database contains 63 countries, although the table only includes a small sample of selected reference countries
Source: Global Report and Executive Report Catalonia 2015. Global Entrepreneur-ship Monitor (GEM)
17,2 Brazil 21.0
7,8 EU average 7.6
6,3 Slovenia 5.9
TEA 2014 Country TEA 2015
14,4 Argentina 17.7
7,1 Switzerland 7.3
5,5 Spain 5.7
13,0 Canada 14.7
9,5 Netherlands 7.2
5,7 Norway 5.7
9,4 Estonia 13.1
6,7 Sweden 7.2
4,4 Italy 4.9
n.d Morocco 4.4
15,5 China 12.8
10,7 United Kingdom 6.9
5,3 Germany 4.7
n.d Bulgaria 3.5
13,8 United States 11.9
7,9 Greece 6.7
10,9 Slovakia 9.6
5,6 Finland 6.6
6,5 Ireland 9.3
7,5 Catalonia 6.4
9,2 Poland 9.2
5,4 Belgium 6.2
9,3 Hungary 7.9
7,3 Barcelona 6.1
Entrepreneurial activity in the world. 2015 (% population 18-64 years old)
BARCELONA OBSERVATORY REPORT 2016 23 Hub for economic activity

Source: Global Report and Executive Report Catalonia 2015. Global Entrepreneurship Monitor (GEM)
Switzerland
United Kingdom
Netherlands
Belgium
Germany
Sweden
Norway
Poland
Finland
Slovakia
Hungary
Greece
Estonia
Italy
Ireland
Spain Barcelona
Catalonia
Entrepreneurial activity in Europe. 2015 (% population 18-64 years old)
9.3
6.9
7.2
6.2
4.7
Bulgaria3.5
7.3
5.7 6.14.9
6.7
7.9
9.6
9.2
13.1
6.65.7
7.2
BARCELONA OBSERVATORY REPORT 2016 24 Hub for economic activity
6.4
Business outlook in the European Union for 2016
BARCELONA OBSERVATORY REPORT 2016 25 Hub for economic activity
2005 2006 2007 2008 2009 2010 2011 2012 2013 2014 2015 2016 (f)
46
-9
-58
-13
-29
-40
-45
5
1522
3025
36
25
3235
38
52
3834 37 33
-4
-40
-12
-6
-26
-15
59
-2
30
38
32
-3
-41
-20
-32
-11
-30
3
89
24
31 32
14
-45
Business prospects in Catalonia. 2016(Balances in percentages)
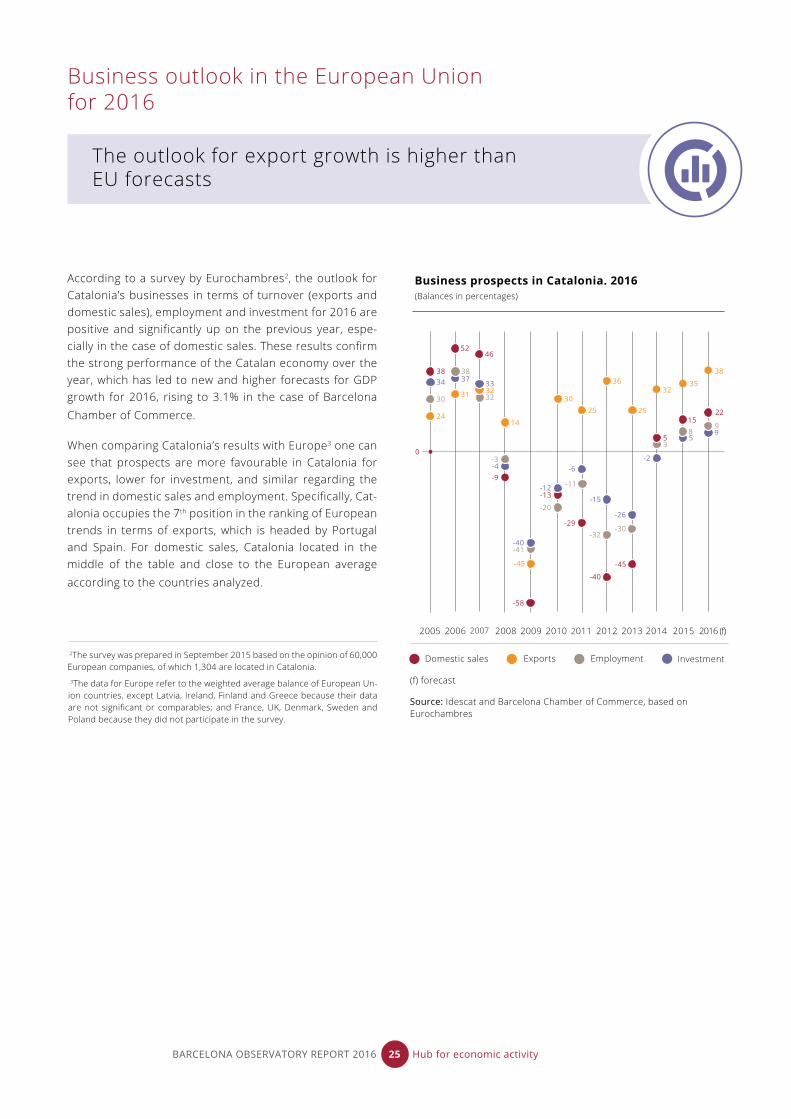
According to a survey by Eurochambres2, the outlook for Catalonia’s businesses in terms of turnover (exports and domestic sales), employment and investment for 2016 are positive and significantly up on the previous year, espe-cially in the case of domestic sales. These results confirm the strong performance of the Catalan economy over the year, which has led to new and higher forecasts for GDP growth for 2016, rising to 3.1% in the case of Barcelona Chamber of Commerce.
When comparing Catalonia’s results with Europe3 one can see that prospects are more favourable in Catalonia for exports, lower for investment, and similar regarding the trend in domestic sales and employment. Specifically, Cat-alonia occupies the 7th position in the ranking of European trends in terms of exports, which is headed by Portugal and Spain. For domestic sales, Catalonia located in the middle of the table and close to the European average according to the countries analyzed.
The outlook for export growth is higher than EU forecasts
2The survey was prepared in September 2015 based on the opinion of 60,000 European companies, of which 1,304 are located in Catalonia.
3The data for Europe refer to the weighted average balance of European Un-ion countries, except Latvia, Ireland, Finland and Greece because their data are not significant or comparables; and France, UK, Denmark, Sweden and Poland because they did not participate in the survey.
Domestic sales Exports InvestmentEmployment
(f) forecast
Source: Idescat and Barcelona Chamber of Commerce, based on Eurochambres
0

Germany 11
Montenegro 16
Czech Republic 11
Luxembourg 12
Business prospects in the European Union. 2016
Country Domesticsales(Balance in p.)
Country Exports(Balance in p.)
Country Employment(Balance in p.)
Country Investment(Balance in p.)
Source: Idescat and Barcelona Chamber of Commerce, based on Eurochambres data and Spanish Chamber of Commerce
Portugal 66
Belgium 35
Cyprus -6
Croatia 55
Slovenia 27
Hungary -27
Romania 44
Luxembourg 26
Lithuania 43
EU* 25
Turkey 42
Slovakia 23
Spain 41
Catalonia (BCN) 22
Serbia 40
Czech Republic 16
Montenegro 37
Bulgaria 16
Estonia 36
Italy 13
Malta 35
Austria -5
Portugal 57
Lithuania 33
Italy 18
Spain 51
Austria 32
Germany 16
Czech Republic 14
Hungary -27
Romania 51
Serbia 31
Belgium 48
Slovenia 48
Slovakia 26
Croatia 40
Malta 26
Catalonia (BCN) 38
EU* 26
Estonia 35
Luxembourg 26
Bulgaria 34
Montenegro 21
Turkey 33
Netherlands 19
Cyprus 28
Montenegro 46
Lithuania 22
Italy -3
Portugal 38
Slovenia 22
Germany 5
Austria -8
Hungary -19
Romania 35
Serbia 15
Turkey 35
Bulgaria 15
Croatia 34
Czech Republic 14
Malta 31
Luxembourg 14
Cyprus 29
Spain 27
Estonia 27
Belgium 23
Netherlands 5
Slovakia 9
EU* 9
Catalonia (BCN) 9
Portugal 47
Estonia 24
Slovakia 8
Lithuania 39
Catalonia (BCN) 9
Netherlands 7
Hungary -7
Serbia 38
Cyprus 23
Slovenia 33
Spain 23
Malta 32
Turkey 20
Romania 32
EU* 9
Croatia 31
Italy 28
Belgium 25
Bulgaria 24
Austria -12
BARCELONA OBSERVATORY REPORT 2016 26 Hub for economic activity
Note: The balances are calculated as the difference between the percentage of responses indicating an increase and the percentage of responses indicating a decrease.This year there is no information at the regional level because regional participation has been very heterogeneous.*Data for Europe refer to the weighted average of the balances for countries in the European Union except Latvia, Finland Ireland and Greece because the data are not significant or comparable - and France, UK, Denmark, Sweden and Poland have not participated in the survey.

Germany 11
Montenegro 16
Czech Republic 11
Luxembourg 12
Spain 23
Turkey 20
EU* 9
Croatia 31
Italy 28
Main cities in the world in terms of delegate numbers at international congresses held in 2015
BARCELONA OBSERVATORY REPORT 2016 27 Hub for economic activity
Barcelona is the third top city in the world in terms of number of congresses organized and delegates
In 2015, Barcelona was in the third top ranked city in the world in terms of number of international congresses or-ganized and number of delegates, rising two places com-pared to the previous year, according to the International Congress and Convention Association (ICCA).
Barcelona organized 180 international congresses in 2015, coming behind Berlin and Paris, but this year jumping ahead of Madrid and Vienna. Meanwhile, the number of delegates at international conferences stood at 108,961 people in 2015, only topped by Vienna and London. All three cities, along with Berlin, exceeded the 100,000-delegate mark. Importantly, the ICCA ranking is made from registered con-ferences which have a minimum of 50 delegates and, in ad-dition, it only includes events that have a minimum rotation between at least three countries, so it does not include, for example, the Mobile World Congress, which has its ven-ue fixed in Barcelona and yet brings together more than 80,000 participants.
Considering a broader analysis period between 2004 and 2013, Barcelona is also the world’s third top city in number of international congresses with 1,859 meetings, ahead of Berlin and Madrid and behind only Paris and Vienna
Top cities in the world in terms of delegate numbers and international congresses held. 2015
CitiesCongresses2014
Congresses2015
Var. 2015/2014 (Percentage)
193 Berlin 1.0 195
214 Paris -13.1 186
182 Barcelona -1.1 180
202 Vienna -11.9 178
166 London 3.0 171
200 Madrid -14.5 171
142 Singapore 9.9 156
130 Istanbul 13.8 148
109 Lisbon 33.0 145
105 Copenhagen 31.4 138
CitiesDelegates2014
Delegates2015
Var. 2015/2014 (Percentage)
Source: International Congress and Convention Association (ICCA)Source: International Congress and Convention Association (ICCA)
89,969 London 30.5 117,397
127,469 Barcelona -14.5 108,961
76,880 Berlin 35.7 104,299
57,497 Singapore 34.1 77,105
130,516 Paris -42.2 75,470
57,551 Copenhagen 30.8 75,269
46,921 Prage 57.5 7 73,896
28,177 Vancouver 158.8 72,935
79,356 Amsterdam -8.6 72,529
81,902 Vienna 52.5 124,899
Barcelona’s position
3 3
1112
8
2 2 2 2 2
3
22 2 2
3
1 1
2
5
4
5
2004 2005 2006 2007 2008 2009 2010 2011 2012 2013 2014 2015
Delegates Congresses
Source: International Congress and Convention Association (ICCA)
55


Quality of l i fe, sustainabi l i ty and social cohesion


Introduction
Barcelona wants to be a reference point in the transition towards a new economic, social and environmental mod-el, promoting measures to fight poverty and inequality, and how to mitigate and adapt to climate change. The city is internationally renowned for its quality of life, yet it faces challenges to ensure that the welfare and generation of opportunities leads to socioeconomic development for all citizens.
Regarding the dimensions associated with a good qual-ity of life, Barcelona is considered the 15th safest city in the world, especially in the healthcare field, according to The Safe Cities Index for 2015. The city also stands as an international benchmark in the field of sport, taking 3rd spot in the Sports Cities ranking for 2015, which is an activity that in addition to directly contributing to the quality life of Barcelona’s residents, also generates an important economic and social impact.
According to Eurobarometer’s Quality of Life in Euro-pean Cities index in 2015, published by the European Commission in 2016, the satisfaction of Barcelona’s residents regarding the city and the neighbourhood where they live stands at 92% of respondents, one of the highest percentages of the 79 cities analysed. Bar-celona gets good reviews relating to areas such as pub-lic space, security, public transport, cleanliness or trust in neighbours, but results are less favourable in areas such as services administration or the environment.
Barcelona is also one of the cities with the best results in dimensions related to sustainability, according to the Environmental Sustainable Cities Index 2016, which shows a relatively low volume of CO2 emissions equiv-alent per inhabitant compared to other cities in the world. As such, Barcelona’s Climate Commitment was presented during the celebration of the 21st United Na-tions Climate Change Conference (COP 21) in Paris. This commitment was the result of an extensive process of citizen participation, which defined objectives for 2030
as a 40% reduction in CO2 equivalent emissions com-pared to 2005 values and it proposed an increase of 1.6 km2 of green area, integrating and giving visibility to existing strategies and priority to municipal projects of significant impact.
The economic recession that began in 2008 has led to many European countries and regions experiencing considerable increases in levels of inequality, poverty and social exclusion. Barcelona’s residents have seen average incomes fall and regional inequalities widen, so that in 2014 the ratio of household disposable in-come comparing the highest and lowest neighbour-hoods in the city rose to 7.3, while the percentage of people with high, medium and low income stands at 16.6%, 46.8% and 36.6% of the total, respectively.
In Catalonia as a whole, the Gini coefficient has a sim-ilar value to the OECD average, while the rate of risk of poverty or social exclusion is below the European Union average. The fight against inequality and pover-ty is a priority for the City Council, which is developing inclusive policies in terms of business, labour, culture, and welcoming immigrants or housing, among others, a strategy which it shares with the third sector, social partners and all citizens under the Citizen Agreement for an Inclusive Barcelona.
BARCELONA OBSERVATORY REPORT 2016 31 Quality of life, sustainability and social cohesion
In terms of quality of life, Barcelona
is considered the 15th safest city
in the world

Security in cities around the world in 2015
According to The Safe Cities Index 2015 report by the British magazine The Economist, Barcelona is the 15th safest city in this global ranking of 50 cities across all continents, led by Tokyo, Singapore and Osaka. Barcelona came in 4th position amongst European cities, behind Stockholm, Amsterdam and Zurich, but ahead of London, Madrid or Paris.
The report’s findings are based on 40 indicators related to health, infrastructure and citizen and digital security. Notably, Barcelona came 7th on health security, which takes into account aspects like public access to the health system, the ratio of beds and medical professionals per thousand inhabitants, air and water quality, and life expectancy. Barcelona came 11th in terms of personal safety, 14th in terms of infrastructures, and 29th for digital security.
BARCELONA OBSERVATORY REPORT 2016 32 Quality of life, sustainability and social cohesion
Barcelona, among the safest cities in the world
Security in cities worldwide. 2015
Position City Index S/100
11 Hong Kong 77.2
21 Madrid 72.4
2 Singapore 84.6
1 Tokyo 85.6
12 San Francisco 76.6
22 Brussels 71,7
3 Osaka 82.4
13 Taipei 76.5
23 Paris 71.2
4 Stockholm 80.0
14 Montreal 75.6
24 Seoul 70.9
5 Amsterdam 79.2
15 Barcelona 75.2
25 Abu Dhabi 69.8
6 Sydney 78.9
16 Chicago 74.9
7 Zurich 78.8
17 Los Angeles 74.2
8 Toronto 78.8
18 London 73.8
19 Washington DC 73.4
9 Melbourne 78.7
10 New York 78.1
20 Frankfurt 73.1
Source: The Safe Cities Index 2015. The Economist Intelligence Unit
Source: The Safe Cities Index 2015. The Economist Intelligence Unit
Positioning of Barcelona on urban security categories. 2015
Total urban security
Digital security
Health safety
Security of Infrastructure
Personal security
15
29
7
14
11

Sport in cities around the world in 2015
Barcelona is ranked 3rd among 50 cities evaluated in the Ranking of Sports Cities in 2015, prepared by Around the Rings and TSE Consulting based on votes by public opin-ion specialists and the general public to determine which cities were most associated with sport.
The city has remained in the top ten since the first edition (2012), a position only shared with other Olympic cities such as London, Beijing, Sydney and Tokyo. Barcelona is still getting the most out of the physical assets that were the legacy of the 1992 Olympic Games, namely with a new leisure development called Open Camp located in the Montjuïc Olympic Ring. This is the first theme park in the world dedicated to sport, according a study by the University Pompeu Fabra, and which is forecasting a first year turnover of more than 100 million euro.
According to the ‘Survey of sports habits in Barcelo-na’ carried out in 2013, 55.6% of Barcelonans say they practice some physical activity or sport and the city has 67,500 federated sportspeople. In addition to contribut-ing directly to improve the quality of life of citizens, sport has a significant economic and social impact on the city. A report titled ‘Study of the impact of sport in Barcelo-na: economic, labour and social indicators’ carried out by the Barcelona City Council, showed there were some 2,000 firms and 2,500 organizations related to sports that generate more than 2,100 million euro in turnover, with 27,600 salaried workers and 35,000 volunteers in 2013.
Also, the city has a sports club that is a worldwide ref-erence: Football Club Barcelona, which has a world re-nowned brand that has a global economic impact esti-mated by Deloitte as generating 906 million euro during the 2014/15 season and 16,620 jobs.
BARCELONA OBSERVATORY REPORT 2016 33 Quality of life, sustainability and social cohesion
Asia and PacificEurope America Barcelona
LondonSydney
Rio de JaneiroTokyo
LausanneMelbourne
BarcelonaLos Angeles
BeijingEdmonton
ParisCopenhagen
LondonLausanne
BarcelonaRio de JaneiroTokyoBeijing
EdmontonSydney
ParisLos AngelesMelbourneCopenhagen
City Position 2014 Position 2015
Source: Ranking of Sports Cities 2015. Around the Rings and TSE Consulting
Sport in cities worldwide. 2015
2
3
5
6
7
8
9
10
11
12
1
2
3
4
5
6
7
8
9
11
21
28
1
4
Barcelona, third city most associated with sports

Source: Regional Income Distribution and Poverty Database, OCDE
Gini coefficient
OECD region City included Gini in the region Coefficient
Southern Finland Helsinki 0.242
Bratislava Bratislava 0.275
Capital (Denmark) Copenhagen 0.283
Central Hungary Budapest 0.286
Berlin Berlin 0.288
Rhône-Alpes Lyon 0.288
Bavaria Munich 0.294
Oslo and Akershus Oslo 0.295
South Kanto Tokyo 0.300
Lombardy Milan 0.304
Stockholm Stockholm 0.314
Central Region (Poland) Warsaw 0.321
Ontario Toronto & Ottawa 0.331
Vienna Vienna 0.337
Madrid Madrid 0.339
Ile de France Paris 0.343
Tel Aviv District Tel Aviv 0.345
Lazio Rome 0.347
New South Wales Sydney 0.348
Athens Athens 0.355
Brussels Capital Region Brussels 0.358
Greater London London 0.386
Washington Washington 0.389
New York New York 0.415
Federal district Mexico City 0.482
Santiago Metropolitan Santiago de Chile 0.484
Catalonia Barcelona 0.325
OECD average 0.315
Note: This table shows the Gini coefficient based on disposable income after taxes and transfers for the most recent years available in a selection of OECD regions. Data Extraction Data: June 2016.
Distribution of income in the main regions of the OECD
BARCELONA OBSERVATORY REPORT 2016 34 Quality of life, sustainability and social cohesion
The Gini coefficient is a benchmark indicator to measure the level of inequality in the distribution of income. Cata-lonia’s rate is 0.325, which is slightly higher than the OECD average (0.315) and close to places like Stockholm, On-tario, Vienna and Madrid. This coefficient can take values between 0 and 1, where 1 represents the most unequal income distribution (one person has all the income and the rest, nothing) and 0 the most egalitarian (everyone has the same income).
The global trend shows an increase in inequality. Accord-ing to the report ‘In it together’, by the OECD (2015), many countries have seen the distance between rich and poor in the population standing at their widest level for the past 30 years and this is now a central issue in the political and academic debate because its social impact is having a negative impact on economic growth, overall confidence in our institutions and health. For the regions analyzed, the levels of lower inequalities occur in the regions in the north and central Europe, including Helsinki and Copen-hagen, as well as in Japan. However, some capital regions of western Europe like Greater London and Brussels have higher levels of economic inequality, although these do not reach the levels seen in American regions like New York, Mexico Federal District, or Santiago de Chile, with coefficients between 0.4 and 0.5.
According to the survey of living conditions and habits of the population of Catalonia, Barcelona and the rest of the Metropolitan area (AMB) saw Gini levels improve between 1985 and 2006 although there has been a reversal in this process between 2006 and 2011 (latest coefficient availa-ble), when the city and the rest of the AMB scored a Gini index of 0.346 and 0.301 respectively, a similar result to 1990’s index.
Catalonia’s level of equality in terms of distribution of income is close to the OECD average

Population at risk of poverty or social exclusion in Europe’s regions in 2015
Population at risk of poverty or social exclusion. 2015
Country Region (main city) AROPE rate (%)
Czech Republic Prague (Prague) 10.6
Finland Helsinki-Uusimaa (Helsinki) 12.3
Sweden Stockholm (Stockholm) 13.1
Norway Akershus og Oslo (Oslo) 14.6
Slovakia Bratislavský kraj (Bratislava) 16.5*
Slovenia Slovenia - West (Ljubljana) 17.2
Netherlands Netherlands - West (Amsterdam) 18.0
Italy Lombardy (Milan) 18.1*
Denmark Hovedstaden (Copenhagen) 18.8
Switzerland Espace Mittelland (Bern) 19.7*
Spain Catalonia (Barcelona) 19.8
Spain Madrid (Madrid) 20.5
Romania Bucuresti - Ilfov (Bucharest) 20.5
Poland Central Region (Warsaw) 22.6*
Hungary Central Hungary (Budapest) 24.3
Italy Lazio (Rome) 24.7*
Bulgaria Bulgaria - Southwest (Sofia) 30.0
Greece Attica (Athens) 31.5
Ireland Ireland - South East (Dublin) 26.3*
Average EU-28** 23.7
Spain 28.6
Source: Eurostat
Note: The table shows the most recent data available for each of the regions selected for this sample (2015, or in the cases marked * 2014).**The UE28 average is the weighted average of the results of countries.
BARCELONA OBSERVATORY REPORT 2016 35 Quality of life, sustainability and social cohesion
The ‘At risk of poverty or social exclusion’ rate in Catalonia is lower than in the EU
According to Eurostat data, the rate of population at risk of poverty or social exclusion (AROPE) of Catalonia stood at 19.8% in 2015, which is lower than the Spanish rate (28.6%) and that of EU-28 (23.7%).
Above Catalonia, stand regions such as Budapest, Rome and Dublin, while below –but with similar values– are Berne and Amsterdam. Regions such as Prague or Helsin-ki show the lowest rates in the sample with values close to 10-12%.
The rate at Risk of Poverty or Social Exclusion (AROPE) in-dicates the percentage of the population that is at least in the following cases: at risk of poverty, in a situation of se-vere material deprivation or live in homes with low labour intensity. If the calculation for the population at risk of poverty with the specific threshold for Catalonia is done (60% of median annual income equivalent after available social benefit transfers for the Catalan population, rather than the median of Spain) the AROPE rate is 23.5%, a fig-ure that is closer to the average for the European Union but still below it. The AROPE rate for Barcelona in 2011, when calculated with the threshold for Catalonia, stood at 28.1%, while for the Metropolitan area it was 29.2%.
The economic crisis that began in 2008 has led to a signif-icant increase in levels of poverty and social exclusion in many European countries. Reducing the number of peo-ple at risk of poverty or social exclusion in the EU is one of the key objectives of the Europe 2020 strategy, which aims to promote a model of smart, sustainable and inclu-
sive growth.

...
Sustainable Cities in 2015
Position and score on the environment aspect. 2015
Position City Result (%)
11 Madrid 76.0
21 Leeds 71.0
2 Stockholm 87.1
1 Zurich 87.9
12 Singapore 75.8
22 Edinburgh 70.9
3 Geneva 86.0
13 Copenhagen 74.8
23 Barcelona 70.5
4 Vienna 84.5
14 Manchester 74.2
24 Munich 70.3
5 Frankfurt 84.1
15 Birmingham 73.5
25 Canberra 69.8
26 Seoul 69.7
97 Beijing 36.0
Note: The result is the average of relative positions to other cities on each part of the sub-index
Source: Sustainable Cities Index 2016. Arcadis
98 Doha 35.7
99 Wuhan 35.5
100 Calcuta 30.9
6 Wellington 81.1
16 Berlin 73.0
7 Rome 79.4
17 Rotterdam 72.4
8 Sydney 77.3
18 Vancouver 72.1
19 Amsterdam 72.1
9 London 76.5
10 Hamburg 76.4
20 Glasgow 71.2
BARCELONA OBSERVATORY REPORT 2016 36 Quality of life, sustainability and social cohesion
Barcelona, among the 25 most sustainable cities
Barcelona ranks 23rd in terms of its Environment accord-ing to the Sustainable Cities Index 2016 prepared by con-sultancy Arcadis, which compares 100 global cities on as-pects such as environmental risks, green spaces, energy, air pollution, emissions greenhouse gases, waste manage-ment and access to drinking water and sanitation. With a score similar to Edinburgh and Munich, Barcelona came top on the indicators concerning access to drinking water and sanitation, but had the worst percentage in of green spaces in relation to the city area. This is an issue that the City is trying to improve, along with others such as air pollution, which, according to the European survey ‘Qual-ity of Life in Cities 2015’, showed a rather unfavourable response from citizens.
Also, Barcelona is in 24th position in the General Index for Sustainable Cities 2016, which as well as the environment, analyzes social and economic dimensions.
‘The European City Ranking 2015 Best practices for clean air in urban transport’, published by German NGO Bund, in collaboration with the European Environmental Bureau, placed Barcelona in 3rd position in terms of promoting public transport, with a score similar to Milan and Stock-holm. In the case of Barcelona, one highlighted aspect was the re-planning of the bus network (2012), a previous ex-tension of the Metro network (2008 and 2010) and the promotion of public transport with communication poli-cies promoting the use of public transport, as well as the city’s commitment to increase the proportion of public transport usage compared to other transport means.

CO2 equivalent emissions per capita in the world’s cities in 2016
Barcelona is amongst the top 15 cities with the lowest volume of emissions of greenhouse gases per capita out of a total of 60 cities that report as part of GPC (Global Protocol for Community-Scale Greenhouse Gas Emission Inventories) to the Open Data portal of CDP. The level of CO2 equivalent emissions tons per capita, which stands at 2.22 per inhabitant in Barcelona, is similar to cities like Paris (2.29) or Oslo (2.04) and this is on the low side when making international comparisons, well below the values of cities like Vancouver, Greater London or New York. The city with the lowest emissions per inhabitant is Brazil’s Recife, while cities like Melbourne (31.71) and Rotterdam (50) have the highest levels.
Barcelona’s commitment to sustainability is notable after it launched the Barcelona Climate Commitment, backed by 800 citizens’ organizations linked to the Barcelona + Sostenible network with signatories from the Citizens’ Commitment to Sustainability 2012-2022 together with the City Council of Barcelona. This commitment proposes reaching certain goals for 2030 including reducing CO2 equivalent emissions per capita by 40% compared to 2005 and increasing per capita urban green space by 1 m2, which are strategic measures like the Green and Biodi-versity Plan for Barcelona 2020, and projects like energy saving and efficiency programmes for municipal buildings.
BARCELONA OBSERVATORY REPORT 2016 37 Quality of life, sustainability and social cohesion
Barcelona is one of the cities with the lowest levels of CO2e emissions per inhabitant
CO2 equivalent emissions per capita. 2016
City Country CO2 emissionsequivalent(metric tons)
t of CO2equivalent / inhabitant
Recife Brazil 1,883 0.00
Note: The original database contained 188 cities, and the table presents a sample of the 60 benchmark cities that use GPC to report their data. CDP is the only global disclosure system that enables businesses, cities, states and regions to manage their data on environmental impact.
Source: Citywide Emissions 2016 (CDP) and data from the Energy Agency of Barcelona
Addis Abeba Ethiopia 3,708,292 1.10 Lagos Nigeria 29,426,266 1.40 Metropolitan Municipality of Lima Peru 15,432,105 1.76
Metropolitan District of Quito Ecuador 5,233,350 2.34 Mexico City Mexico 23,655,111 2.67
Oslo Norway 1,340,422 2.04
Paris France 5,195,663 2.29 Barcelona Spain 3,568,967 2.22
Rio de Janeiro Brazil 20,268,045 3.13 Madrid Spain 10,257,048 3.25 Vancouver Canada 2,442,602 4.05 Seoul Metropolitan Government South Korea 47,612,664 4.62 Greater London Authority United Kingdom 40,190,000 4.67 Wellington New Zealand 1,084,979 5.32 Greater Manchester United Kingdom 14,889,318 5.39 Taipei Taiwan 14,957,404 5.53 Cape Town South Africa 22,643,846 5.78 New York US 49,385,508 5.82 Buenos Aires Argentina 19,667,128 6.44 Toronto Canada 18,320,966 6.65 Athens Greece 4,711,576 7.10 Ljubljana Slovenia 2,079,758 7.24 Los Angeles US 29,024,807 7.39 Sydney Australia 3,556,529 17.32 Melbourne Australia 4,372,420 31.71 Rotterdam Netherlands 31,512,000 50.50


Labour market and training


Introduction
In 2015, the EU economy grew at a rate of 1.9%, which showed a consolidated improvement on labour indi-cators that began in 2013, after the recession brought about a reduction in employment and an increase in unemployment across the whole of Europe in most member countries with greater or less intensity. De-spite this, the current levels of employment and un-employment are still lower and higher –respectively– than before 2008. There are still significant contrasts between the labour markets of northern and eastern Europe and the southern part of the continent as well as differences between groups of the population that are more or less disadvantaged.
This positive trend is also observed in Catalonia, which closed 2015 with an annual increase in employment of over 53,000 people and a decrease in the level of the unemployed population of almost 88,000 people, according to the Labour Force Survey published by Spain’s INE. However –as shown by data presented in the report for 2015–, the rate of employment in Cata-lonia is below the average for Europe and the unem-ployment rate is almost double the average rate for the EU although it has been falling since 2013.
In this context, net employment in Barcelona in 2015 rose for the second consecutive year after six years of labour market adjustments. Indeed, the city closed the year with nearly 34,000 affiliated social security members more than compared to a year ago, an ac-tivity rate (for the group 16 to 64 years) of 79.8% and an employment rate of 69.2% in the fourth quarter, which was more than 7 and 3 percentage points re-spectively higher than the European averages-, while the unemployment rate decreased to 13.3%, which is still well below the averages of Catalonia and Spain, which also reduces the difference with the EU-28 rate.
Barcelona City Council has developed a new em-ployment strategy for the period 2016-2020 which is defined by three strategic lines: improvements designed to increase employability for everyone; to locate employment at the centre of local politics by making this a transversal priority implicating all areas of the city council, and for bring services closer to the local population to meet the needs of people with territorial strategies regarding employment.
One of the most important assets that the Barcelona area has is its critical mass of qualified human cap-ital. Importantly, in 2015 the percentage of working population with university studies in Catalonia grew to reach 44.6% and in the case of working women this exceeded 50% for the first time, which are clear-ly higher rates than the averages for the European Union.
Finally, Barcelona is still a reference city in business training, because it is the only city with two Europe-an institutions (IESE and ESADE) in the top ten best business schools on the continent, according to The Financial Times and The Economist Intelligence Unit.
BARCELONA OBSERVATORY REPORT 2016 41 Labour market and training
Barcelona saw net job creation for
the second consecutive year with almost
34,000 more affiliated social security members
compared to a year ago

Employment rate in European regions in 2015
BARCELONA OBSERVATORY REPORT 2016 42 Labour market and training
Employment rate (%)
2002 2004 2005 2006 2007 2008 2010 2014 2015
Source: Idescat and Eurostat
64.6
58.660.9
62.362.6
63.364.3
65.7
63.3
64.8 65.264.3
58.6
56.057.8
67.269.3
70.4 71.069.9
63.1
61.9
63.164.0
64.865.6
Catalonia Spain EU-28
In 2015 the employment rate in the EU grew 0.8 percentage points compared to 2014 as a result of moderate increases in most of the regions analyzed.
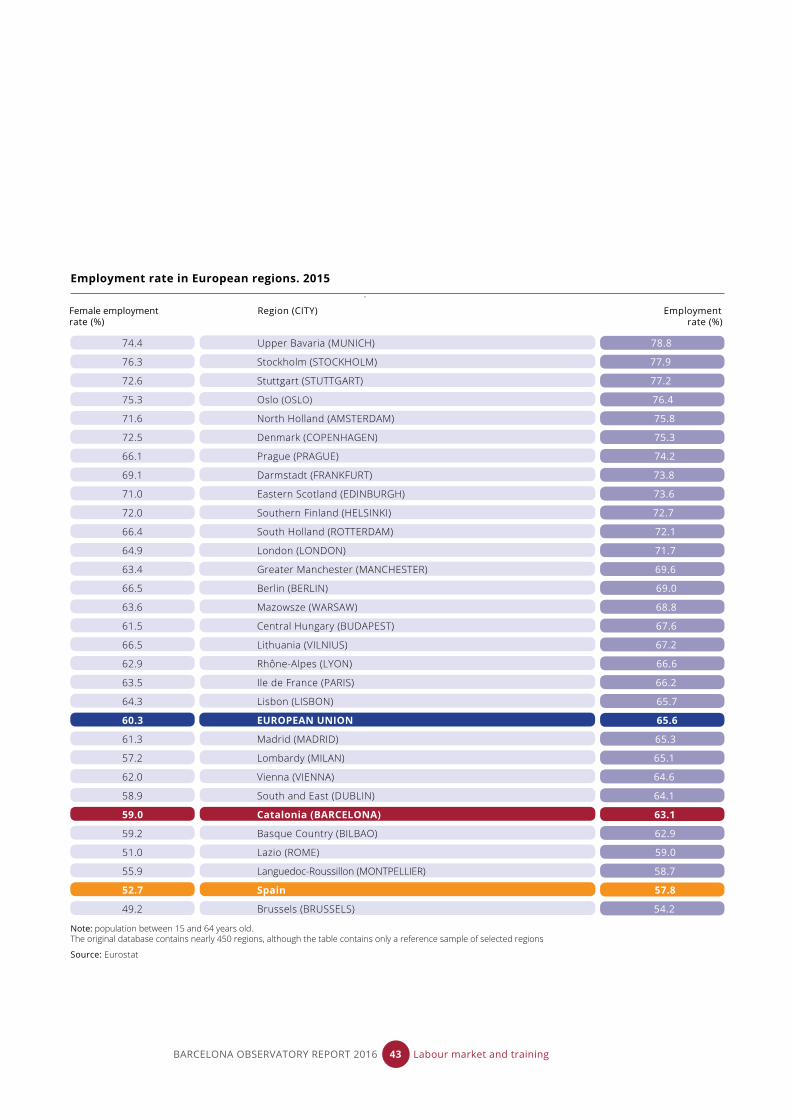
As such, the employment rate in Catalonia and Spain increased for the second year by 1.2 and 1.8 percentage points with respective to the previous year, overtaking the EU average increases, even thought the actual rates re-main among the lowest on the continent due to the sharp falls experienced from 2008 to 2013. Thus, the employ-ment rate in Catalonia was 63.1%, meaning it is below the European average for seventh consecutive year, but clearly above the Spanish rate by 5.3 percentage points and above regions like Rome, Montpellier or Brussels. On the other hand, the rate of female employment increased to 59% in Catalonia in 2015, which is above the Lombardy region or Dublin and well above the Spanish average (52.7%), but still below the European average and still far behind the leaders of top territories on the continent where the rate stands at about 70%.
The fourth quarter of 2015 saw the employment rate stand at 69.2% in Barcelona, which represented an in-crease on this indicator compared to the same period in 2014 by 1.6 percentage points. The rate of female em-ployment in the City (64.7%) remained four points above the average for Europe after stabilizing (-0.2 points) in inter-annual terms. Suffice to say that during the first two quarters of 2016 there has been a continuation in employment rate growth both in Barcelona where it has breached the 70% mark, and in Catalonia.
The employment rate increases in Catalonia
65.6
BARCELONA OBSERVATORY REPORT 2016 43 Labour market and training
Note: population between 15 and 64 years old.The original database contains nearly 450 regions, although the table contains only a reference sample of selected regions
Source: Eurostat
Female employment Region (CITY) Employmentrate (%) rate (%)
Employment rate in European regions. 2015
74.4 Upper Bavaria (MUNICH) 78.8
76.3 Stockholm (STOCKHOLM) 77.9
72.6 Stuttgart (STUTTGART) 77.2
75.3 Oslo (OSLO) 76.4
71.6 North Holland (AMSTERDAM) 75.8
72.5 Denmark (COPENHAGEN) 75.3
66.1 Prague (PRAGUE) 74.2
69.1 Darmstadt (FRANKFURT) 73.8
71.0 Eastern Scotland (EDINBURGH) 73.6
72.0 Southern Finland (HELSINKI) 72.7
66.4 South Holland (ROTTERDAM) 72.1
64.9 London (LONDON) 71.7
63.4 Greater Manchester (MANCHESTER) 69.6
66.5 Berlin (BERLIN) 69.0
63.6 Mazowsze (WARSAW) 68.8
61.5 Central Hungary (BUDAPEST) 67.6
66.5 Lithuania (VILNIUS) 67.2
62.9 Rhône-Alpes (LYON) 66.6
63.5 Ile de France (PARIS) 66.2
64.3 Lisbon (LISBON) 65.7
60.3 EUROPEAN UNION 65.6
61.3 Madrid (MADRID) 65.3
57.2 Lombardy (MILAN) 65.1
62.0 Vienna (VIENNA) 64.6
58.9 South and East (DUBLIN) 64.1
59.0 Catalonia (BARCELONA) 63.1
59.2 Basque Country (BILBAO) 62.9
51.0 Lazio (ROME) 59.0
55.9 Languedoc-Roussillon (MONTPELLIER) 58.7
52.7 Spain 57.8
49.2 Brussels (BRUSSELS) 54.2

Unemployment rate in European regions in 2015
Unemployment rate in European regions. 2015
Note: population over 15 years old.The database contains nearly 450 regions, although the table shows only shows a reference sample of selected regions
Source: Eurostat
2.4 Upper Bavaria (MUNICH) 2.7
3.3 Prague (PRAGUE) 2.8
3.3 Stuttgart (STUTTGART) 3.3
4.0 Darmstadt (FRANKFURT) 4.1
4.6 Oslo (OSLO) 4.7
5.4 Central Hungary (BUDAPEST) 5.3
5.7 Eastern Scotland (EDINBURGH) 6.0
6.5 North Holland (AMSTERDAM) 6.2
6.7 London (LONDON) 6.2
6.2 Mazowsze (WARSAW) 6.4
6.5 Greater Manchester (MANCHESTER) 6.5
6.9 Denmark (COPENHAGEN) 6.7
7.3 Stockholm (STOCKHOLM) 7.0
8.6 South Holland (ROTTERDAM) 7.8
8.7 Lombardy (MILAN) 7.9
7.5 Southern Finland (HELSINKI) 8.0
7.3 South and East (DUBLIN) 9.0
9.0 Rhône-Alpes (LYON) 9.1
8.2 Lithuania (VILNIUS) 9.1
8.1 Berlin (BERLIN) 9.4
9.5 EUROPEAN UNION 9.4
8.4 Ile de France (PARIS) 9.6
8.8 Vienna (VIENNA) 10.6
12.3 Lazio (ROME) 11.8
12.2 Languedoc-Roussillon (MONTPELLIER) 12.9
13.0 Lisbon (LISBON) 13.1
14.7 Basque Country (BILBAO) 14.8
17.3 Madrid (MADRID) 17.1
15.8 Brussels (BRUSSELS) 17.3
19.4 Catalonia (BARCELONA) 18.6
23.5 Spain 22.1
27.4 Attica (ATHENS) 25.2
Female Region (CITY) Unemploymentunemployment raterate (%) (%)
In 2015, the economic recovery seen across the European Union led to an end-of-year unemployment rate of 9.4%, 0.8 percentage points lower than in 2014. The unem-ployment situation continues to affect Southern Europe with special intensity, including Spain and Catalonia. The gap between the EU average has decreased compared to 2014, after having seen annual declines of 2.3 and 1.7 percentage points respectively.
Thus, the unemployment rate in Catalonia reached an annu-al average rate of 18.6% in 2015, which is almost double the European average rate and far from the main reference re-gions, although it is still below the Spanish average (22.1%). Meanwhile, the female unemployment rate stood at 19.4%, 0.6 points below that of 2014, but higher than the overall unemployment rate for the first time since 2009.
In the fourth quarter of 2015, the unemployment rate stood at 13.3% in Barcelona, which in annual terms shows a third consecutive year-on fall (-3.1 points). Thanks to this development, the unemployment rate in the city is closer to the European Union indicator than to the Spanish rate.
The unemployment rate in Catalonia has fallen, but it is still far from the European average
BARCELONA OBSERVATORY REPORT 2016 44 Labour market and training
Unemployment rate (%)
2002 2005 2008 2009 2010 2012 2013 2015
Source: Eurostat
10.1
9.0 9.0
7.0
9.0
9.6
10.4 10.8
9.49.2
11.3
18.0
20.1
25.0
26.4
22.1
7.0
9.0
16.217.8
22.623.4
18.6
2014
10.2
24.4
20.3
11.5
Catalonia Spain EU-28
Working population with tertiary education in European regions in 2015
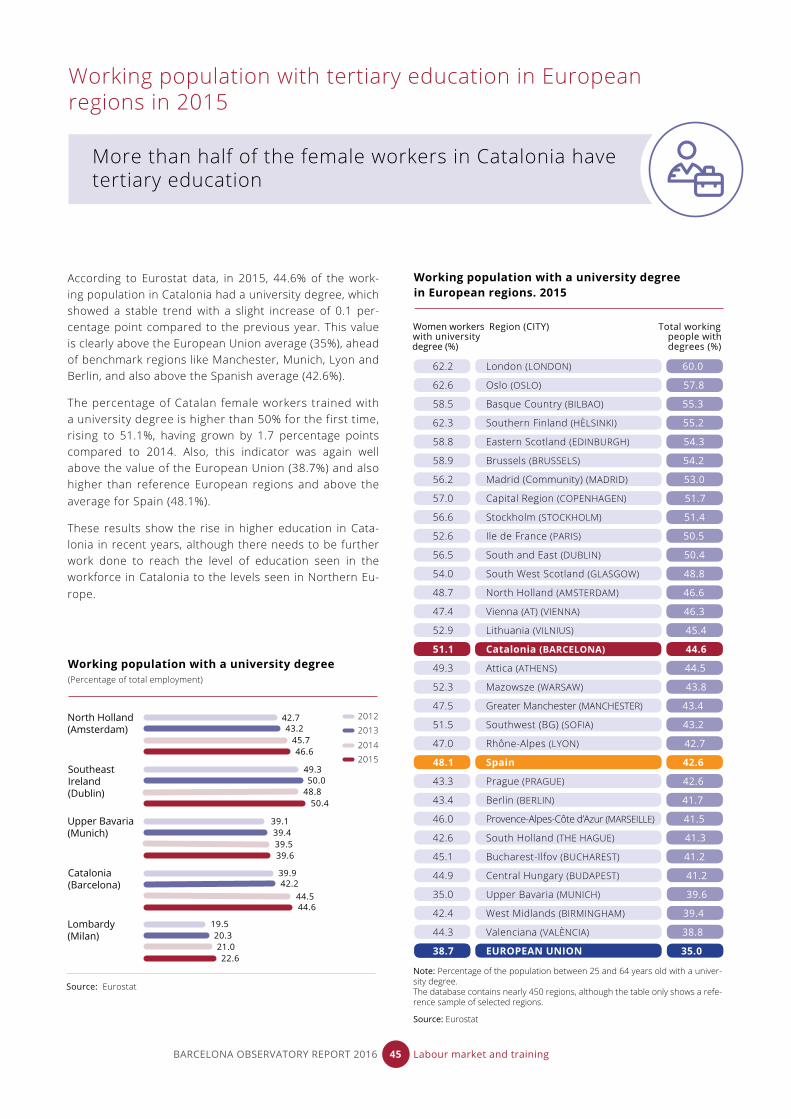
Note: Percentage of the population between 25 and 64 years old with a univer-sity degree.The database contains nearly 450 regions, although the table only shows a refe-rence sample of selected regions.
Source: Eurostat
Working population with a university degree in European regions. 2015
62.2 London (LONDON) 60.0
62.6 Oslo (OSLO) 57.8
58.5 Basque Country (BILBAO) 55.3
62.3 Southern Finland (HÈLSINKI) 55.2
58.8 Eastern Scotland (EDINBURGH) 54.3
58.9 Brussels (BRUSSELS) 54.2
56.2 Madrid (Community) (MADRID) 53.0
57.0 Capital Region (COPENHAGEN) 51.7
56.6 Stockholm (STOCKHOLM) 51.4
52.6 Ile de France (PARIS) 50.5
56.5 South and East (DUBLIN) 50.4
54.0 South West Scotland (GLASGOW) 48.8
48.7 North Holland (AMSTERDAM) 46.6
47.4 Vienna (AT) (VIENNA) 46.3
52.9 Lithuania (VILNIUS) 45.4
51.1 Catalonia (BARCELONA) 44.6
49.3 Attica (ATHENS) 44.5
52.3 Mazowsze (WARSAW) 43.8
47.5 Greater Manchester (MANCHESTER) 43.4
51.5 Southwest (BG) (SOFIA) 43.2
47.0 Rhône-Alpes (LYON) 42.7
48.1 Spain 42.6
43.3 Prague (PRAGUE) 42.6
43.4 Berlin (BERLIN) 41.7
46.0 Provence-Alpes-Côte d’Azur (MARSEILLE) 41.5
42.6 South Holland (THE HAGUE) 41.3
45.1 Bucharest-Ilfov (BUCHAREST) 41.2
44.9 Central Hungary (BUDAPEST) 41.2
35.0 Upper Bavaria (MUNICH) 39.6
42.4 West Midlands (BIRMINGHAM) 39.4
44.3 Valenciana (VALÈNCIA) 38.8
38.7 EUROPEAN UNION 35.0
Women workers Region (CITY) Total working with university people with degree (%) degrees (%)
According to Eurostat data, in 2015, 44.6% of the work-ing population in Catalonia had a university degree, which showed a stable trend with a slight increase of 0.1 per-centage point compared to the previous year. This value is clearly above the European Union average (35%), ahead of benchmark regions like Manchester, Munich, Lyon and Berlin, and also above the Spanish average (42.6%).
The percentage of Catalan female workers trained with a university degree is higher than 50% for the first time, rising to 51.1%, having grown by 1.7 percentage points compared to 2014. Also, this indicator was again well above the value of the European Union (38.7%) and also higher than reference European regions and above the average for Spain (48.1%).
These results show the rise in higher education in Cata-lonia in recent years, although there needs to be further work done to reach the level of education seen in the workforce in Catalonia to the levels seen in Northern Eu-rope.
More than half of the female workers in Catalonia have tertiary education
BARCELONA OBSERVATORY REPORT 2016 45 Labour market and training
Source: Eurostat
42.7
49.3
39.1
39.9
19.5
50.0
39.4
42.2
20.3
48.8
39.5
44.5
21.0
50.4
39.6
44.6
22.6
2012
2014
2013
2015
North Holland (Amsterdam)
Southeast Ireland (Dublin)
Upper Bavaria(Munich)
Catalonia(Barcelona)
Lombardy(Milan)
Working population with a university degree(Percentage of total employment)
46.645.7
43.2
2.4 Upper Bavaria (MUNICH) 2.7
3.3 Prague (PRAGUE) 2.8
3.3 Stuttgart (STUTTGART) 3.3
4.0 Darmstadt (FRANKFURT) 4.1
4.6 Oslo (OSLO) 4.7
5.4 Central Hungary (BUDAPEST) 5.3
5.7 Eastern Scotland (EDINBURGH) 6.0
6.5 North Holland (AMSTERDAM) 6.2
6.7 London (LONDON) 6.2
6.2 Mazowsze (WARSAW) 6.4
6.5 Greater Manchester (MANCHESTER) 6.5
6.9 Denmark (COPENHAGEN) 6.7
7.3 Stockholm (STOCKHOLM) 7.0
8.6 South Holland (ROTTERDAM) 7.8
8.7 Lombardy (MILAN) 7.9
7.5 Southern Finland (HELSINKI) 8.0
7.3 South and East (DUBLIN) 9.0
9.0 Rhône-Alpes (LYON) 9.1
8.2 Lithuania (VILNIUS) 9.1
8.1 Berlin (BERLIN) 9.4
9.5 EUROPEAN UNION 9.4
8.4 Ile de France (PARIS) 9.6
8.8 Vienna (VIENNA) 10.6
12.3 Lazio (ROME) 11.8
12.2 Languedoc-Roussillon (MONTPELLIER) 12.9
13.0 Lisbon (LISBON) 13.1
14.7 Basque Country (BILBAO) 14.8
17.3 Madrid (MADRID) 17.1
15.8 Brussels (BRUSSELS) 17.3
19.4 Catalonia (BARCELONA) 18.6
23.5 Spain 22.1
27.4 Attica (ATHENS) 25.2

Best European business schools in 2016
Position in the European ranking
2005
3
8
10 109
7 7
12
78 8 8 8
4 4 4 4 43 3 3
76
5
2006 2007 2008 2009 2010 2011 2012 2013 2014 2015 2016
Iese Business School Esade Business School
Source: Global MBA Ranking,2016. Financial Times
BARCELONA OBSERVATORY REPORT 2016 46 Labour market and training
According to the Financial Times ranking of the best 100 full-time MBA programmes in the world, now in its six-teenth year, Barcelona’s IESE and ESADE business schools are in 7th and 8th place respectively in the European ranking, remaining above recognised schools like Saïd Business School, or Britain’s University of Oxford or War-wick Business School. This consolidates Barcelona’s posi-tion as the only city with two education centres in the top ten best MBA Business Schools in Europe in 2016 for four consecutive years. Also, these two institutions are among the top 25 schools in the world with IESE in 16th and ESADE in 23rd position.
Regarding the results of the previous year, IESE is down to 7th position in the European ranking, after holding 3rd spot for three consecutive years, and dropping eight places in the world ranking; ESADE fell a position in the European ranking and four spots in the world ranking, standing in 23rd position.
According to the “Which MBA? full-time MBA” annual rank-ing published by The Economist Intelligence for the last thirteen years, IESE is in 3rd spot in the European rank-ing and 14th position in the world; ESADE occupies the 6th
place at the European level and 21st worldwide, improving three positions compared to the previous year.
These indicator show that year after year Barcelona is consolidating its position as a city of excellence and a magnet for business education at the international level.
Barcelona is the only city with two education centres in the Top Ten MBA business schools ranking for Europe

Best European Business Schools. 2016
European ranking Worldranking
Business school City
Source: Global MBA Ranking 2016. Financial Times
1 Insead Fontainebleau 1
2 London Business School London 3
3 University of Cambridge: Judge Cambridge 10
4 IE Business School Madrid 12
5 IMD Lausanne 13
6 HEC Paris Paris 15
7 Iese Business School Barcelona 16
8 Esade Business School Barcelona 23
9 SDA Bocconi Milan 25
10 University of Oxford: Saïd Oxford 28
11 Imperial College Business School London 35
12 Lancaster University Management School Lancaster 36
13 City University: Cass London 37
14 Alliance Manchester Business School Manchester 38
15 The Lisbon MBA Lisbon 40
16 Rotterdam School of Management, Erasmus University Rotterdam 42
17 Warwick Business School Coventry 46
18 Mannheim Business School Mannheim 49
19 Cranfield School of Management Cranfield 57
20 Universität St. Gallen St.Gallen 60
21 University of Strathclyde Business School Glasgow 63
22 ESMT- European School of Management and Technology Berlin 64
23 Durham University Business School Durham 66
24 University College Dublin: Smurfit Dublin 79
25 Edhec Business School Roubaix 84
26 Birmingham Business School Birmingham 92
27 Grenoble École de Management Grenoble 94
28 Leeds University Business School Leeds 98
28 University of Edinburgh Business School Edinburgh 98
28 University of Bath School of Management Bath 98
BARCELONA OBSERVATORY REPORT 2016 47 Labour market and training


Knowledge society


BARCELONA OBSERVATORY REPORT 2016 51 Knowledge society
Introduction
Given the fast-moving developments in information technology and urban dynamics, Barcelona wants to be-come an open, equitable, circular, and democratic city and a leader in technology policy with clear public and citizen leadership, even going beyond the construction of a Smart City. As such, the City Council has prepared a plan called ‘Barcelona Digital City 2017-2020, Transition towards Technological Sovereignty’, which outlines three main areas to develop: modernizing the administration and developing digital transformation to meet current technology challenges so that it is more efficient and effective; diversifying the digital economy and making it more accessible so entrepreneurs and SMEs can access public procurement and provide innovative solutions; and to promote digital education to citizens to facilitate active and participatory democracy and promoting digital sovereignty to contribute to urban democracy that favours openness and public control of data, and protecting the digital rights and freedoms of citizens.
At the same time, technology entrepreneurship has be-come a new hub of activity in the city. According to the European Digital City Index 2016, Barcelona is the 9th top city in Europe in terms of its support for digital entre-preneurship among 60 of the top European cities. This ecosystem lives from its ability to attract talent, which feeds off initiatives like 4YFN -a business platform for the community of emerging technology companies, driven by the Mobile World Capital Barcelona (MWCB); and Bar-celona Startup Week, which aims to promote collabora-tion between entrepreneurs in the city and networking; or Pier01, a new start up headquarters set up by Bar-celona Tech City which offers a pioneering acceleration programme for entrepreneurial digital firms at a growth phase in their development to prepare them for interna-tionalization and attracting talent.
In terms of the knowledge economy, it is very impor-tant to recognise the importance of the critical mass of Catalan labour market in sectors with high added value. In 2015, Catalonia was the 5th top European region in
terms of the number of people employed in high and medium-high intensity technology manufacturing and 7th in terms of the percentage of population working in science and technology, and 9th in terms of those em-ployed in knowledge services and cutting edge technol-ogy. Also, Barcelona is the 5th top city in Europe and 17th in the world in terms of academic scientific production, according to the Knowledge Cities 2015 ranking, prepared by the UPC’s Centre for Land Valuation Policy.
In terms of innovation, there was an increase in the total number of PCT patent applications and technol-ogy PCTs in the area of Barcelona in 2013. Regarding business innovation in 2015, Catalonia was again the region with the largest number of companies carrying out innovative activities in Spain, representing nearly a quarter of all companies and spending on innova-tion in Spain. In contrast, spending on R&D by compa-nies relative to GDP in Catalonia has been stable since 2010, reaching 0.84% in 2014, a figure that is higher than the Spanish average (0.65%).
According to a comparative analysis of innovation by regions in Europe published by the Regional Innova-tion Scoreboard2016, prepared by Eurostat, Catalonia ranks amongst 83 European regions as a ‘Moderate In-novator’. Although the overall innovative performance of Catalonia has dropped in relation to the 2014 edi-tion, Catalonia achieved a position that was above the European average on the indicators for the percentage of the population with higher education, employment in knowledge-intensive sectors and exports of medium and high technology content.
R
Barcelona has more than 12,500 technology
companies, many created recently, with 50% of these not in existence five years before

BARCELONA OBSERVATORY REPORT 2016 52 Knowledge society
Population employed in technology manufacturing and technology services in European regions in 2015
Source: Eurostat
Population employed in knowledge-intensive and high-tech services and those employed in high-tech and medium-high intensity manufacturing technology. 2015
399
305
205
161
73
58
140
106
101
79
75
275
Lombardy(Milan)
Southeast(Dublin)
Upper Bavaria(Munich)
Catalonia(Barcelona)
Rhône-Alps(Lyon)
London(London)
Population employed in high and medium-high intensity technology manufacturing (in thousands)
Population employed in knowledge-intensive and high-tech services(in thousands)
According to Eurostat, in 2015, Catalonia ranked in 5th place among European regions with the highest popula-tion employed in high and medium-high intensity tech-nology manufacturing with a total of 205,000 workers in these sectors. Despite losing a significant number of jobs in these activities during the first part of the recession, Catalonia stayed in 5th position –with a similar number of jobs to 2011– and only below Stuttgart, Lombardy, Upper Bavaria and Istanbul. Moreover, Catalonia shows a rela-tive weight of 6.7% in terms of employment in sectors with high and medium-high intensity manufacturing technol-ogy, a percentage that places it in the mid range of 316 European regions.
Furthermore, Catalonia is the 9th top region in Europe in terms of employment in knowledge and high technology intensive services, with a total of 101,000 workers in 2015, which is 11% above the registered in 2008. Regarding the previous year, employment in these activities decreased by 3,000 workers (-2.9%), which means a fall of one po-sition in the ranking, after being overtaken by Istanbul (increasing by 10.4%). As a result of this fall, the relative weight of employment in activities with high technology and knowledge-intensive services decreased slightly as a percentage of the total working population to stand at 3.3% (3.4% in 2014), which means it is located in the up-per middle part of the European regions ranking. In terms of Social Security data, the weight of these activities com-pared to the total number of jobs in the city of Barcelona reached 6% in December 2015.
Catalonia, fifth and ninth European region with most population engaged in technology manufacturing and technology services

BARCELONA OBSERVATORY REPORT 2016 53 Knowledge society
Population employed in technology manufacturing and services in European regions. 2015
Region (CITY)% employes in knowledge- intensive and high-tech services over all employees
% Employees in high and medium-high intensity technology manufacturing over all employees
Employees in high and medium-high
intensity technology manufacturing
(thousands)
Employees in knowledge-intensive and high-tech services(in thousands)
2.2 47 Stuttgart (STUTTGART) 19.5 412
3.3 140 Lombardy (MILANO) 9.4 399
4.4 106 Upper Bavaria (MUNICH) 12.6 305
2.0 106 Istanbul (ISTANBUL) 4.2 221
3.3 101 Catalonia (BARCELONA) 6.7 205
3.3 46 Karlsruhe (KARLSRUHE) 14.4 200
2.7 48 Piedmont (TURIN) 11.2 200
2.0 38 Emilia-Romagna (BOLOGNE) 9.9 188
2.2 52 Düsseldorf (DÜSSELDORF) 7.7 184
2.9 79 Rhône-Alpes (LYON) 5.9 161
3.5 72 Cologne (COLOGNE) 7.4 154
6.2 323 Ile de France (PARIS) 2.9 153
3.5 68 Darmstadt (FRANKFURT) 7.9 153
7.7 216 Madrid (Community) (MADRID) 3.3 93
4.9 133 Mazowsze (WARSAW) 3.3 90
5.2 70 Central Hungary (BUDAPEST) 6.5 87
2.4 36 Loire (NANTES) 4.9 75
5.1 75 South and East (DUBLIN) 5.0 73
2.4 32 Schleswig-Holstein (KIEL) 5.2 70
3.7 45 Midi-Pyrénées (TOULOUSE) 5.6 68
3.2 61 Provence-Alps-Côte d’Azur (MARSEILLE) 3.4 65
5.3 87 Berlin (BERLIN) 3.9 64
5.8 133 Lazio (ROME) 2.7 61
3.9 47 East Anglia (EAST ANGLIA) 4.8 58
6.4 275 London (LONDON) 1.4 58
5.2 63 Counties of Gloucester, Wiltshire and North Somerset 4.7 57
8.2 100 Counties of Berkshire, Buckingham and Oxford (OXFORD) 4.5 55
4.4 40 Hamburg (HAMBURG) 5.8 53
6.7 61 Capital Region (COPENHAGEN) 4.6 41
Source: Eurostat

BARCELONA OBSERVATORY REPORT 2016 54 Knowledge society
Population employed in science and technology in 2015 and expenditure on research and development in European regions in 2013
2000 2005 2010 2011 2012 2013 2014 2015
13.4
11.7
8.8
4.76.5
7.8 7.7 8.1 8.7 9.1 9.7
11.5 11.711.9 12.5 12.9 13.2
17.518.7 18.6 18.6 18.2
19.5 19.9
Source: Eurostat
People employed in science and technology (as a percentage of the population aged between 15 and 74 years old)
Catalonia (Barcelona) North Holland (Amsterdam) Lombardy (Milan)
Catalonia had 731,000 people employed with higher ed-ucation degrees dedicated to science and technology in 2015. This figure puts Catalonia in 7th place in the rank-ing of European regions, behind Paris, London, Madrid, Warsaw, Istanbul and Lyon, but above the regions of Lom-bardy, Upper Bavaria and Berlin, according to Eurostat. Despite an increase of 19,000 jobs compared to the pre-vious year, Catalonia dropped two positions in the rank-ing, being overtaken by the regions of Lyon and Istanbul, whose growth were higher (2.7% compared to 11.9%, and 4.7%, respectively). Thus, in Catalonia, the weight of the working population dedicated to science and technology in relation to the total population stands at 13.2%, 4.4 per-centage points higher than the results of 2000.
In 2013, research and development intensity (R&D) in Cat-alonia stood at 1.52% of GDP, a rate that is higher than regions such as London or Lombardy, while in contrast, Catalonia is still far from the leading regions like Copen-hagen, Stockholm and Stuttgart, and it is below the Eu-ropean average (2%) and the target set in the European strategy for 2020 (set at 3%). For the same year, Catalan companies accounted for almost a quarter of the Spain’s total domestic expenditure on R&D (24.3%).
Catalonia has the seventh highest employment in science and technology amongst European regions

BARCELONA OBSERVATORY REPORT 2016 55 Knowledge society
Region (CITY)Total R&D domestic expenditures (% GDP) in 2013
Employees in Science and Technology (in thousands) 2015
Employees in science and technology
(% population*) 2015
Domestic expenditures in the business sector on R+D (% GDP) in 2013
People employed in science and technology in 2015, and spending on research and development in the regions of Europe in 2013
2.91 1.99 Ile de France (PARIS) 1,665 19.1
0.98 0.34 London (LONDON) 1,542 24.2
1.77 1.00 Madrid (MADRID) 957 19.9
1.55 0.65 Mazowsze (Warsaw) 817 18.6
0.95 0.45 Istanbul (ISTANBUL)** 792 7.3
2.76 1.82 Rhône-Alpes (LYON) 742 16.0
1.52 0.86 Catalonia (BARCELONA) 731 13.2
1.30 0.91 Lombardy (MILAN) 726 9.7
4.41 3.35 Upper Bavaria (MUNICH) 656 18.9
1.06 0.39 Andalusia (SEVILLA) 559 8.8
2.46 1.50 Provence-Alpes-Côte d’Azur (MARSEELLE) 508 14.1
3.55 1.49 Berlin (BERLIN) 502 18.6
6.00 5.51 Stuttgart (STUTTGART) 494 16.2
2.92 1.13 Cologne (COLOGNE) 466 14.1
2.03 1.00 South Holland (ROTTERDAM) 465 17.4
3.12 2.48 Darmstadt (FRANKFURT) 460 15.6
1.67 1.24 Düsseldorf (DÜSSELDORF) 455 11.7
1.65 0.50 Lazio (ROME) 450 10.1
3.87 2.84 Stockholm (STOCKHOLM) 429 25.9
1.77 0.90 North Holland (AMSTERDAM) 418 19.9
1.77 1.26 Central Hungary (BUDAPEST) 412 18.1
0.95 0.45 Attica (ATHENS) 404 13.7
1.53 1.10 Southeast Ireland (DUBLIN) 400 16.1
0.62 0.32 Upper Silesia (KATOWICE) 399 12.1
3.49 2.14 Berkshire County and Buckingham County of Oxford (OXFORD) 398 23.5
1.04 0.42 Valencia (VALENCIA) 388 10.4
0.90 0.56 Southwest (BG) (SOFIA) 387 13.9
--- --- Ankara (ANKARA) 384 10.1
1.54 1.21 Surrey, East Sussex and West Sussex (BRIGHTON) 382 18.9
1.22 0.79 Loire (NANTES) 357 13.8
Note: workers who have a higher degree in science-related training and are employed as professionals or technicians. Domestic expenditure includes spending on capital and labour flows (both researchers and administrative staff) related to research activities in proportion to GDP.* Population between 15 and 74 years old.
Source: Eurostat

BARCELONA OBSERVATORY REPORT 2016 56 Knowledge society
Main cities in the world for academic scientific output in 2015
Barcelona came seventeenth among the world’s cities and fifth in Europe
Barcelona, with 17,024 scientific publications, is placed 5th top European city and 17th in the world, according to the Knowledge Cities 2015 ranking, prepared by the UPC’s Centre for Land Policy and Valuations. Despite Bar-celona seeing its number of publications fall slightly in relation to 2014 (-0.1%), the city dropped one position in the European ranking and six at the world level due to a significant increase in publications by Moscow and the US cities of Baltimore, Chicago, Houston, Philadelphia and Cambridge. However, it was still above the volume of papers published in the cities of Los Angeles, Singapore, Sao Paulo and Oxford.
Meanwhile, of the 277 Advanced Grants awarded to re-searchers in 2015 by the European Research Council, six went to Catalan institutions representing 50% of the grants awarded to Spain. Similarly, Catalan institutions got a similar number of Advanced Grants to that of Finland (seven) and twice as many as Denmark (three).
2005 2006 2007 2008 2009 2010 2011 2012 2013 2014 2015
27
21
7 7
15
17
13 1210
11
17
11
7
21 20
6 65 5 5
4 4
Source: analysis by the UPC’s CPVS from SCI data (Science Citation Index).
Main cities in the world with regard to the publishing of scientific papers
World Ranking European Ranking
(Positioning of Barcelona in the World and European rankings)

BARCELONA OBSERVATORY REPORT 2016 57 Knowledge society
CityWorld Ranking 2014
World Ranking 2015
European Ranking 2015
Papers 2015*
Main cities in the world with regard to the publishing of academic scientific papers
1 Beijing 1 71,322
2 London 2 1 42,304
3 Shanghai 3 35,385
5 New York 4 32,793
4 Seoul 5 32,637
7 Boston 6 32,010
6 Tokyo 7 30,347
8 Paris 8 2 30,252
9 Madrid 9 3 18,678
12 Baltimore 10 17,771
18 Moscow 11 4 17,506
14 Chicago 12 17,446
10 Toronto 13 17,369
17 Houston 14 17,144
13 Cambridge (USA) 15 17,076
16 Philadelphia 16 17,034
11 Barcelona 17 5 1 17,024
15 Los Angeles 18 16,911
19 Sao Paulo 19 15,955
20 Rome 20 6 15,927
21 Melbourne 21 15,470
22 Milan 22 7 14,573
23 Berlin 23 8 14,564
24 Singapore 24 14,223
26 Hong Kong 25 13,239
28 Cambridge (UK) 26 9 12,875
25 Montreal 27 12,855
27 Munich 28 10 12,341
29 Amsterdam 29 11 12,024
31 San Francisco 30 11,712
30 Oxford 31 12 11,537
*Data accessed on 26 May 2016Source: http://www-cpsv.upc.es/KnowledgeCitiesRanking/, Centre of Land Policy and Valuations - Polytechnic University of Catalonia

BARCELONA OBSERVATORY REPORT 2016 58 Knowledge society
Patent applications in the principal OECD provinces in 2013
PCT Patents *(Number of applications)
344
368
405 410
416
444
510458
443431
428
373
379377
187212
238
272
378 377
415419 422
412
443
464
442
456
95 9584
68
10795
106
131 134
110
80
130 125 119
254
202
242246
290 290
329
303
343
322
268
351
381
326
R
The Barcelona area registered a total of 456 international PCT patent applications during 2013, according to the resi-dence of the individual inventor. This is the second highest number since 2000, only behind the 464 patents applied for in 2011. So Barcelona is maintaining an upward trend that began in 2009 and continues to outperform cities such as Lyon, Madrid, Milan, Amsterdam, Montreal, Toron-to and Copenhagen. Similarly, if we look at the number of PCT patents applied for in relation to inhabitant numbers, Barcelona obtains a ratio of 83 applications per million inhabitants in 2013, three more than the previous year. It should be mentioned that this indicator measuring inno-vation per person, shows that the province of Barcelona is not so well positioned among the main areas of the OECD.
In terms of PCT technology patent applications in 2013, the figure stood at 126 for the Barcelona area -the highest in the data series, which is higher than other benchmark provinces like Milan, Amsterdam, Düsseldorf, Copenhagen and Lyon.
On the other hand, national patent applications decreased for the second year running in most of Spain’s provinces in 2015, according to data from the Spanish Patent and Trademark Office (SPTO). However, Barcelona, with 379 requests (-5.3% compared to 2014) remains in 2nd position regarding Spanish national patent applications.
Patent applications in Barcelona have increased
Amsterdam MilanBarcelona Dublin
*Patent Cooperation Treaty
2000 2001 2002 2003 2004 2005 2006 2007 2008 2009 2010 2011 2012 2013
Source: OECD
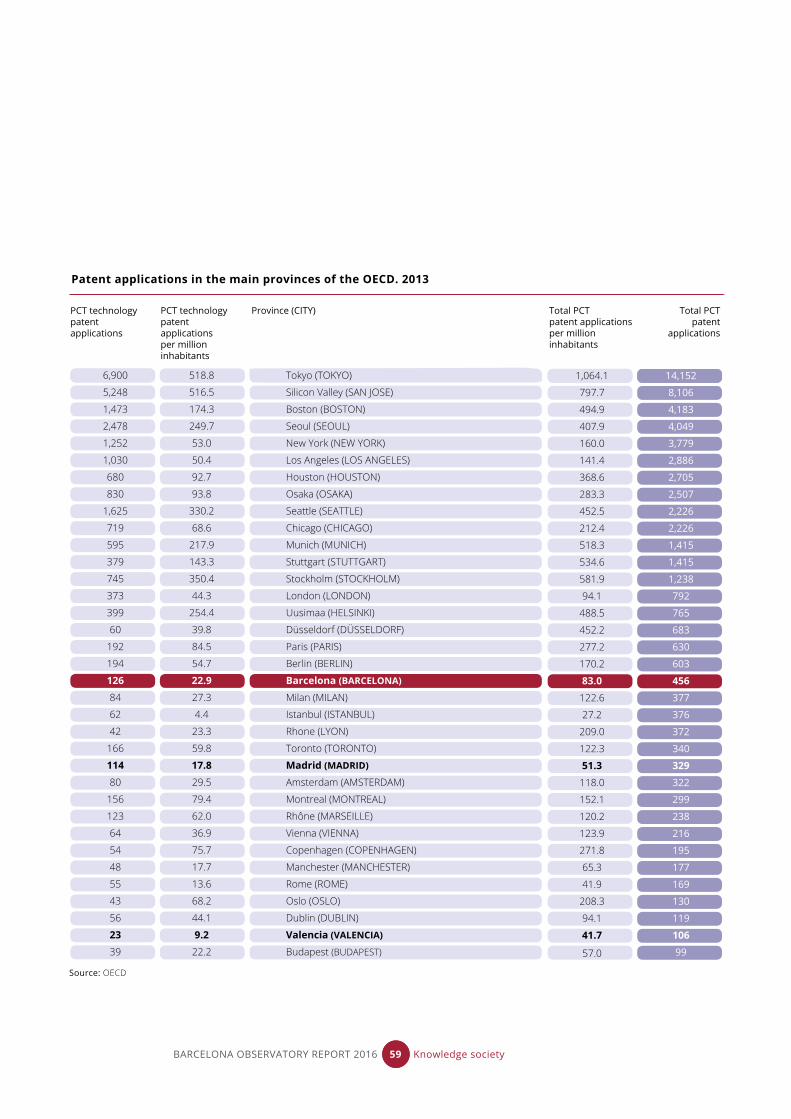
BARCELONA OBSERVATORY REPORT 2016 59 Knowledge society
PCT technology patent applications
PCT technology patent applications per million inhabitants
Total PCT patent applications per million inhabitants
Total PCT patent
applications
Province (CITY)
Patent applications in the main provinces of the OECD. 2013
6,900
5,248
1,473
2,478
1,252
1,030
680
830
1,625
719
595
379
745
373
399
60
192
194
12684
62
42
166
11480
156
123
64
54
48
55
43
56
2339
518.8
516.5
174.3
249.7
53.0
50.4
92.7
93.8
330.2
68.6
217.9
143.3
350.4
44.3
254.4
39.8
84.5
54.7
22.927.3
4.4
23.3
59.8
17.829.5
79.4
62.0
36.9
75.7
17.7
13.6
68.2
44.1
9.222.2
Tokyo (TOKYO)
Silicon Valley (SAN JOSE)
Boston (BOSTON)
Seoul (SEOUL)
New York (NEW YORK)
Los Angeles (LOS ANGELES)
Houston (HOUSTON)
Osaka (OSAKA)
Seattle (SEATTLE)
Chicago (CHICAGO)
Munich (MUNICH)
Stuttgart (STUTTGART)
Stockholm (STOCKHOLM)
London (LONDON)
Uusimaa (HELSINKI)
Düsseldorf (DÜSSELDORF)
Paris (PARIS)
Berlin (BERLIN)
Barcelona (BARCELONA)
Milan (MILAN)
Istanbul (ISTANBUL)
Rhone (LYON)
Toronto (TORONTO)
Madrid (MADRID)
Amsterdam (AMSTERDAM)
Montreal (MONTREAL)
Rhône (MARSEILLE)
Vienna (VIENNA)
Copenhagen (COPENHAGEN)
Manchester (MANCHESTER)
Rome (ROME)
Oslo (OSLO)
Dublin (DUBLIN)
Valencia (VALENCIA)
Budapest (BUDAPEST)
1,064.1
797.7
494.9
407.9
160.0
141.4
368.6
283.3
452.5
212.4
518.3
534.6
581.9
94.1
488.5
452.2
277.2
170.2
83.0122.6
27.2
209.0
122.3
51.3118.0
152.1
120.2
123.9
271.8
65.3
41.9
208.3
94.1
41.7
57.0
14,152
8,106
4,183
4,049
3,779
2,886
2,705
2,507
2,226
2,226
1,415
1,415
1,238
792
765
683
630
603
456377
376
372
340
329322
299
238
216
195
177
169
130
119
10699
Source: OECD

BARCELONA OBSERVATORY REPORT 2016 60 Knowledge society
European Digital City Index in 2016
European Digital City Index. 2016(Positioning of the city per variable)
Skills and qualifications
Non digital infrastructure Mentoring
and support
Entrepreneurial culture
Technology market
Knowledge spillovers
Digital infrastructure
Global index
Access to capital
Business environment
Lifestyle
London Barcelona Estocolm
Source: European Digital City Index 2016. Nesta and the European Digital Forum think tank
According to the second edition of the European Digital City Index 2016, Barcelona is the 9th top European city in terms of support for digital entrepreneurship among the 60 top cities on the continent (the EU28 capitals and 32 cities that are considered important digital entrepre-neurship hubs). In a ranking headed by London, followed by Stockholm and Amsterdam, Barcelona climbed five places compared to the previous year to stand above cities like Vienna, Munich, and Milan. Barcelona got better scores because of its position on variables including ac-cess to capital, mentoring and assistance, entrepreneurial culture and digital infrastructure (7th, 12th, 17th, and 20th
respectively) and worse on skills and lack of qualified labour force (47th). On other variables –like business envi-ronment, the technology market or knowledge spillovers– the city is located in the mid range between the 30th and 41st position.
In terms of the city of Barcelona, the report highlighted the presence of government-funded initiatives like Barce-lona Activa, which helps new companies to finding funds to start their businesses, and the growing number of ac-celerator centres for emerging companies and Co-work-ing events to facilitate knowledge exchange. But the pre-vious edition also mentioned that, despite the existence of several venture capital firms and angel investors, these are insufficient to support the rapid growth of digital en-trepreneurship in the city.
Barcelona has been considered one of the top ten cit-ies for innovation in Europe, according to the Ten Tech Hubs report, prepared by Brussels-based consulting firm Business Science, which highlights the city’s international reputation in areas like the early adoption of digital and wireless technologies, and biomedicine.
Barcelona, among the ten most attractive European cities for digital entrepreneurship
3039
47
35
20
17
129 7
Note variables:
Access to capital: The ability to attract early and late stage capital and financing by busi-ness angels and crowdfunding.
Business environment: ease of doing busi-ness (time and associated cost required), average cost of office rentals or commercial property prices, availability of team working spaces, access to data.
Digital infrastructure: average upload and download speeds of Internet data, cost of fixed broadband subscriptions, mobile con-nection speeds, homes with fibre optics in the building.
Skills and qualifications: average salary of software or web developers, web de-signers, etc. with five years of experience, percentage of people between 25 and 64 years old with higher education, the num-ber people working in the ICT sector, num-ber of employees in the finance and insur-ance sector, and percentage of population that can communicate in English .
Entrepreneurial culture: openness to take on the risks involved with starting a business, percentage of foreign population, the number of people collaborating online, the number of new companies compared to 1,000 people of working age, trust between fellow citizens, people’s perception of entrepreneurs, num-ber of Tweets related to entrepreneurship and number ‘unicorn’ emerging companies valued in thousands of millions of dollars.
Knowledge spillovers: the number of research institutions in the top 200 best cen-tres, and R&D expenditure per inhabitant.
Lifestyle: quality of life index (accessibility to housing, pollution, taxes, crime, quality of healthcare, etc.) and living costs (cost of vari-ous goods and services).
Technology market: percentage of people using Internet to buy or acquire goods or services for private use over the last year, per-centage of profits from electronic commerce (discounting the financial sector), subscription rates for broadband per 100 inhabitants, dif-ference in the percentage of people that have shopped online.
Mentoring and managerial support: num-ber networking and mentoring events, number of mentors, number of accelerator centres (who advise companies and pro-mote emerging companies in exchange for payment), number of business angels.
Non-digital Infrastructure: average time and commute distances, population that travel up to 3 hours a day by train, and the number of flights from local airports.
41
39

BARCELONA OBSERVATORY REPORT 2016 61 Knowledge society
Ranking 2015 Ranking 2016Global index Global index
Source: European Digital City Index 2015 i 2016. (Nesta and the European Digital Forum think tank).
European Digital Cities Index
1
2
3
4
5
6
7
8
9
10
11
12
13
14
15
16
17
18
19
20
21
22
23
24
25
26
27
28
29
30
1
2
3
4
5
6
7
8
9
10
11
12
13
14
15
16
17
18
19
20
21
22
23
24
25
26
27
28
29
30
London
Amsterdam
Stockholm
Helsinki
Copenhagen
Paris
Berlin
Dublin
Brussels
Munich
Cambridge
Madrid
Oxford
Barcelona
Vienna
Valletta
Lisbon
Luxembourg
Prague
Tallinn
Milan
Budapest
Cologne
Warsaw
Bratislava
Nicosia
Ljubljana
Rome
Vilnius
Bucharest
London
Stockholm
Amsterdam
Helsinki
Paris
Berlin
Copenhagen
Dublin
Barcelona
Vienna
Munich
Cambridge
Bristol
Madrid
Oxford
Manchester
Brussels
Tallinn
Edinburgh
Hamburg
Lyon
Aarhus
Birmingham
Lisbon
Frankfurt
Eindhoven
Utrecht
Cologne
Malmo
Uppsala


Tourism


Introduction
The consolidation of Barcelona as a benchmark interna-tional urban tourism destination has resulted in a rapid increase in tourist activity in the city in recent years, and this has led to public debate about the sustainability of this growth. As such, the City Council of Barcelona has given the go-ahead for the creation of a so-called Tour-ism and City Advisory Committee, a guidance body with different sector stakeholders, as well as the develop-ment of a new Strategic Tourism Plan for 2020, to define a roadmap for tourism management over the coming years. This plan proposes to improve tourism in terms of its sustainability, strengthening its positive impact on the city and managing its possible negative effects, facilitat-ing the integration of visitors and fostering the necessary balance between people who live here and preserving local identity and coexistence.
In this context, the tourism sector continued to drive eco-nomic activity in the city of Barcelona during 2015. Thus, according to Turisme de Barcelona, the city’s tourism board, Barcelona recorded almost 9 million tourists stay-ing in city accommodation, which represented an increase of 6.4% over the previous year. The strong performance of the tourism sector is mainly due to foreign tourism and business tourism, supported by a recovery in domestic tourism.
The strong international tourism results of the city are reflected in the main rankings in this industry. Barcelona was positioned 8th top European city and 26th in the world in terms of number of international visitors, according to the report Top Cities Destination Ranking 2014 carried out by Euromonitor International. According to the European Cities Marketing Benchmarking Report 2016, Barcelona is the 6th top European city in terms of having most over-nights by international tourists, only behind London, Paris, Berlin, Rome and Madrid. Another relevant ranking is the MasterCard Index of Global Destination Cities for 2016, with Barcelona taking 12th worldwide and 4th in Europe in terms of number of international tourists (only beaten by London, Paris and Istanbul). Regarding international tour-ist spending, the city is 12th in the global ranking and 3rd
in Europe. According to Tripadvisor, Barcelona is the 11th most popular destination worldwide in 2016.
These positive tourism results are boosted by strong results at the main access infrastructure routes into the city of Barcelona: the port and airport. The port of Barcelona remains a benchmark in the cruise industry, recording over 2.54 million cruise passengers –a rise of 7.4% compared to the previous year–, according to data from MedCruise.
Moreover, Barcelona-El Prat Airport remained among the top ten main airports in Europe in terms of passenger volumes in 2015. According to the Airport Traffic Report, by ACI Europe, Barcelona recorded a re-cord 39,711,276 passengers last year, which is 2.15 million people more than the previous year (5.7%). In a decade (2005-2015), and despite the recession, Bar-celona’s airport has almost doubled the number of destinations it has long-haul direct flights with, which stands at 34 destinations. Next year it is going to add at least five new destinations, helping Barcelona to-wards its goal of becoming an international hub for flight connections. This increase in intercontinental flights has had an effect on demand: while 345,000 people took these types of direct flights in 2005, in 2015 the figure was 2,056,968, a six-fold increase, according to the Barcelona Air Routes Development Committee (CDRA).
BARCELONA OBSERVATORY REPORT 2016 65 Tourism
The tourism sector remains one of the drivers
of economic activity in the city
of Barcelona
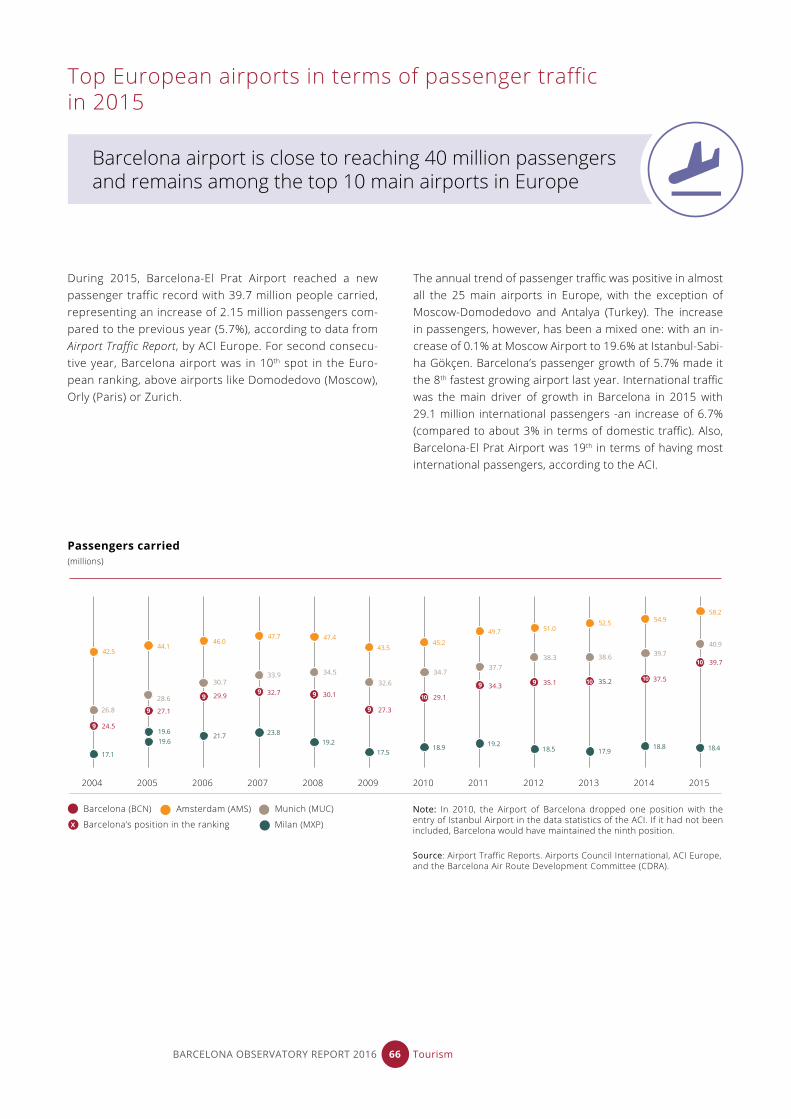
BARCELONA OBSERVATORY REPORT 2016 66 Tourism
Top European airports in terms of passenger traffic in 2015
Source: Airport Traffic Reports. Airports Council International, ACI Europe, and the Barcelona Air Route Development Committee (CDRA).
Barcelona airport is close to reaching 40 million passengers and remains among the top 10 main airports in Europe
During 2015, Barcelona-El Prat Airport reached a new passenger traffic record with 39.7 million people carried, representing an increase of 2.15 million passengers com-pared to the previous year (5.7%), according to data from Airport Traffic Report, by ACI Europe. For second consecu-tive year, Barcelona airport was in 10th spot in the Euro-pean ranking, above airports like Domodedovo (Moscow), Orly (Paris) or Zurich.
The annual trend of passenger traffic was positive in almost all the 25 main airports in Europe, with the exception of Moscow-Domodedovo and Antalya (Turkey). The increase in passengers, however, has been a mixed one: with an in-crease of 0.1% at Moscow Airport to 19.6% at Istanbul-Sabi-ha Gökçen. Barcelona’s passenger growth of 5.7% made it the 8th fastest growing airport last year. International traffic was the main driver of growth in Barcelona in 2015 with 29.1 million international passengers -an increase of 6.7% (compared to about 3% in terms of domestic traffic). Also, Barcelona-El Prat Airport was 19th in terms of having most international passengers, according to the ACI.
Note: In 2010, the Airport of Barcelona dropped one position with the entry of Istanbul Airport in the data statistics of the ACI. If it had not been included, Barcelona would have maintained the ninth position.
Passengers carried(millions)
2004 2005 2006 2007 2008 2009 2010 2011 2012 2013 2014 2015
24.5
27.1
32.7 30.1
27.3
29.1
34.3 35.1 35.2 37.5
39.7
17.1
19.619.6
17.518.9 19.2
18.5 17.918.8 18.4
21.7 23.819.2
26.8
28.6
33.9 34.532.6
34.737.7
38.3 38.6 39.740.9
42.544.1
46.047.7 47.4
43.545.2
49.7 51.052.5 54.9
58.2
9
9 9
9
10
9 9 1010
10
Barcelona (BCN) Amsterdam (AMS) Munich (MUC)
Milan (MXP)Barcelona’s position in the ranking
29.9
30.7
9
9
X

Main European airports in terms of passengers. 2015
City (airport) Variation 2015/2014 (%)
Passengers
London Heathrow (LHR) 2.2 74,958,031
Paris-Roissy (CDG) 3.1 65,766,986
Istanbul (IST) 8.2 61,322,729
Frankfurt (FRA) 2.5 61,032,022
Amsterdam (AMS) 6.0 58,285,118
Madrid (MAD) 11.9 46,828,279
Munich (MUC) 3.2 40,982,384
Rome-Fiumicino (FCO) 5.0 40,422,156
London-Gatwick (LGW) 5.7 4 0,275,430
Barcelona (BCN) 5.7 39,711,276
Moscow-Sheremetyevo (SVO) 0.1 31,611,061
Moscow Domodedovo (DME) -7.7 30,504,505
Paris-Orly (ORY) 2.8 29,664,993
Istanbul-Sabiha Gökçen (SAW) 19.6 28,112,438
Antalya (AYT) -2.2 27,724,249
Copenhagen (CPH) 3.8 26,610,332
Zurich (ZRH) 3.2 26,281,228
Dublin (DUB) 15.4 25,049,335
Oslo (OSL) 1.7 24,672,531
Palma de Mallorca (PMI) 2.7 23,745,131
Brussels (BRU) 7.0 23,460,018
Stockholm-Arlanda (ARN) 3.2 23,142,536
Manchester (MAN) 5.2 23,103,950
Vienna (VIE) 1.3 22,775,054
London-Stansted (STN) 12.9 22,515,500
Source: Airport Traffic Report 2015. Airports Council International and the Barcelona Air Route Development Committee (CDRA)
BARCELONA OBSERVATORY REPORT 2016 67 Tourism
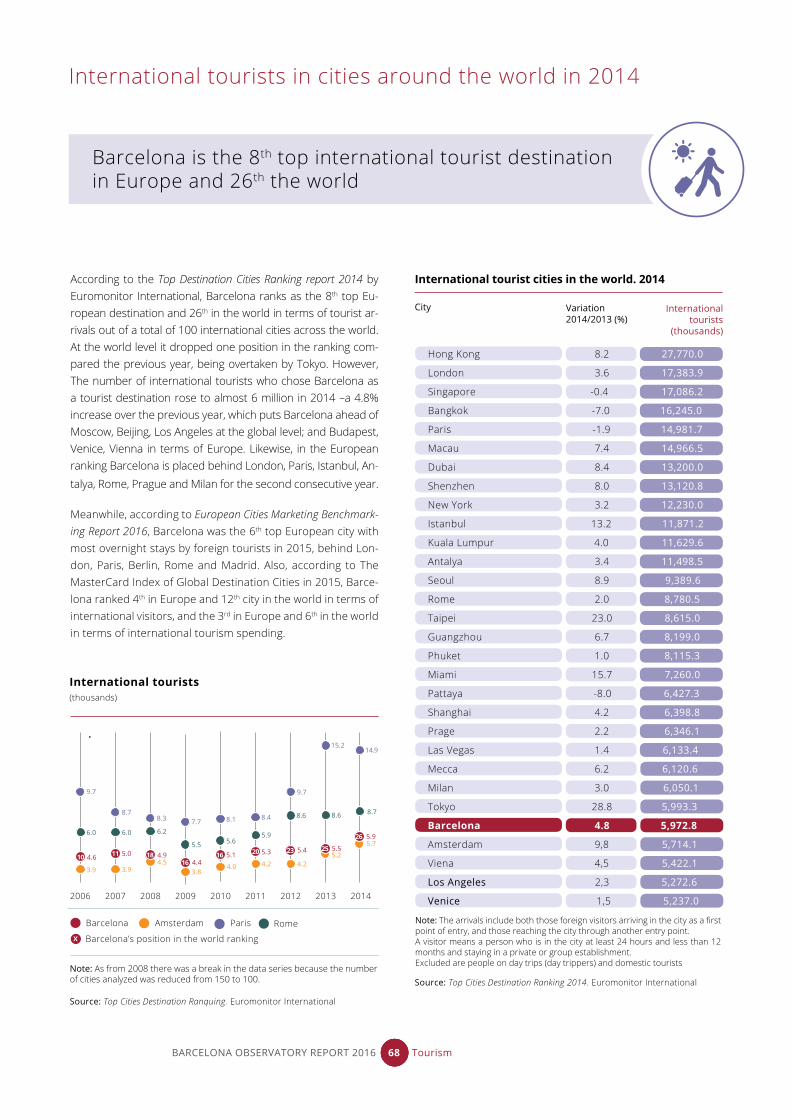
Source: Top Cities Destination Ranquing. Euromonitor International
International tourists in cities around the world in 2014
According to the Top Destination Cities Ranking report 2014 by Euromonitor International, Barcelona ranks as the 8th top Eu-ropean destination and 26th in the world in terms of tourist ar-rivals out of a total of 100 international cities across the world. At the world level it dropped one position in the ranking com-pared the previous year, being overtaken by Tokyo. However, The number of international tourists who chose Barcelona as a tourist destination rose to almost 6 million in 2014 –a 4.8% increase over the previous year, which puts Barcelona ahead of Moscow, Beijing, Los Angeles at the global level; and Budapest, Venice, Vienna in terms of Europe. Likewise, in the European ranking Barcelona is placed behind London, Paris, Istanbul, An-talya, Rome, Prague and Milan for the second consecutive year.
Meanwhile, according to European Cities Marketing Benchmark-ing Report 2016, Barcelona was the 6th top European city with most overnight stays by foreign tourists in 2015, behind Lon-don, Paris, Berlin, Rome and Madrid. Also, according to The MasterCard Index of Global Destination Cities in 2015, Barce-lona ranked 4th in Europe and 12th city in the world in terms of international visitors, and the 3rd in Europe and 6th in the world in terms of international tourism spending.
City Variation 2014/2013 (%)
International tourists
(thousands)
Source: Top Cities Destination Ranking 2014. Euromonitor International
International tourist cities in the world. 2014
Hong Kong 8.2 27,770.0
London 3.6 17,383.9
Singapore -0.4 17,086.2
Bangkok -7.0 16,245.0
Paris -1.9 14,981.7
Macau 7.4 14,966.5
Dubai 8.4 13,200.0
Shenzhen 8.0 13,120.8
New York 3.2 12,230.0
Istanbul 13.2 11,871.2
Kuala Lumpur 4.0 11,629.6
Antalya 3.4 11,498.5
Seoul 8.9 9,389.6
Rome 2.0 8,780.5
Taipei 23.0 8,615.0
Guangzhou 6.7 8,199.0
Phuket 1.0 8,115.3
Miami 15.7 7,260.0
Pattaya -8.0 6,427.3
Shanghai 4.2 6,398.8
Prage 2.2 6,346.1
Las Vegas 1.4 6,133.4
Mecca 6.2 6,120.6
Milan 3.0 6,050.1
Tokyo 28.8 5,993.3
Barcelona 4.8 5,972.8
Amsterdam 9,8 5,714.1
Viena 4,5 5,422.1
Los Angeles 2,3 5,272.6
Venice 1,5 5,237.0
BARCELONA OBSERVATORY REPORT 2016 68 Tourism
Barcelona is the 8th top international tourist destination in Europe and 26th the world
Note: The arrivals include both those foreign visitors arriving in the city as a first point of entry, and those reaching the city through another entry point.A visitor means a person who is in the city at least 24 hours and less than 12 months and staying in a private or group establishment.Excluded are people on day trips (day trippers) and domestic tourists
Note: As from 2008 there was a break in the data series because the number of cities analyzed was reduced from 150 to 100.
International tourists(thousands)
6.0 6.0
9.7
3.9 3.94.5
3.84.0 4.2 4.2
5.2
5.7
8.78.3 7.7 8.1 8.4
9.7
15.214.9
6.2 5.9
8.6 8.6 8.7
4.6 5.0
2006 2007 2008 2009 2010 2011 2012 2013 2014
Barcelona Amsterdam Paris Rome
Barcelona’s position in the world ranking
4.94.4
5.1 5.3 5.4 5.5
5.95.5 5.6
10
X
11 1816
16 20 23 25
26

Source: Top Cities Destination Ranking 2014. Euromonitor International
Cruise ships at Europe’s main ports in 2015
The port of Barcelona’s success is clearly evident with the city being the top port in the Mediterranean and Europe in terms of cruise traffic for the fifteenth consecutive year, according to statistics from MedCruise 2015. More than 2.5 million cruise passengers passed through the port of Bar-celona in 2015 which represents an increase of 7.4% over the previous year, representing almost 30% of all cruise passengers in Spain. In the international context, Barcelona remained the 4th top port in the world in 2014, according to data from CLIA and Seatrade, just behind Florida’s big three ports (Miami, Port Everglades and Port Canaveral) and in front of Venice, Southampton, and New York. Notably, more and more operators choose to work out of Barcelona’s port. During 2015, more than half of cruise passengers were on turnaround cruises; meaning they start and finish their trips in the Catalan capital.
In 2014, the cruise industry in Barcelona generated a total turnover of nearly 800 million €, more than 6,700 jobs, contributing to 413.2 million € a year to the GDP of Catalo-nia, according to the findings of the report Study of the impact on the Catalan economy and socio-economic profile of cruisers (2014), produced by the University of Barcelona, Turisme de Barcelona and the Port of Barcelona.
BARCELONA OBSERVATORY REPORT 2016 69 Tourism
The port of Barcelona has consolidated its position as a benchmark Mediterranean port
2010 2011 2012 2013 2014 2015
1.55
1.79
1.61
1.34
1.541.59
2.00
1.15
1.49
1.20 1.30
1.06 0.98
2.66
2.41
2.60
2.36
2.54
1.621.78
1.82
1.73
1.58
Source: MedCruise and Spanish Ports
Cruise passengers (millions of people)
Barcelona Piraeus (Athens) Venice Palma de Mallorca
2.35
Barcelona’s positioning in the Mediterranean ranking
1
1
1 1 1
1
1
The main cruise ports in the Mediterranean
City Variation 2015/2014 (%)
Travelling pasengers
(thousands)
Source: MedCruise Spanish Ports
Barcelona 7.4 2,540
Civitavecchia 6.2 2,272
Balearic islands 25.8 1,997
Venice -8.7 1,582
Marseille 10.7 1,451
Naples 14.0 1,270
Savona -3.6 982
Piraeus -7.1 980
Ports of Tenerife 11.1 933
Genoa 2.9 848
Dubrovnik/Korcula -7.1 831
Kusadasi/Bodrum/Antalya 6.1 808
Livorno 11.4 698
La Valletta 29.1 668
La Spezia 38.0 667
Corfu -3.7 647
Istanbul 0.0 589
Ports of Madeira 21.9 580
Palermo 2.9 547
Ports of the French Riviera -8.3 546
Lisbon 2.2 512
Kotor 42.9 442
Malaga 2.4 419
Valencia -0.5 371
Bari -34.4 368
Gibraltar 14.7 344
Messina 2.5 328
Split 47.5 271
Cagliari 221.6 263
Monaco 29.6 259
X

Prices and costs


Introduction
The historical period of moderate inflation –a wide-spread phenomenon in European countries– that started at the end of 2013 became more pronounced as 2015 progressed. This, together with weak Euro zone growth, prompted the ECB to implement various monetary stimulus measures to boost demand at an internal level. Given this context, Barcelona is a com-petitive city in terms of costs when we compare it with other cities around the world, as it has price and wage levels that are at the lower-mid range of the ranking of major European cities. However, the economic recov-ery that began in 2015 marked an upward trend in the rental prices of industrial land, offices and commercial premises, which breaks with the trend seen over the past years, but that does not substantially alter the city’s position the rankings.
In 2015, Barcelona fell in the cost of living index rank-ing in relation to the reference city (New York), accord-ing to Mercer Human Resource Consulting. Zero in-flation and wage moderation and the depreciation of the euro seen in 2015 were the main causes of this relative fall in the cost of living in the city of Barcelona.
It’s worth noting that that in recent years, inflation in Barcelona’s provincial area has been very low if non-existent (0.3% in 2014 and 0.0% annual average rates in 2015). Wages have also seen great stability on average in recent years. Between 2012 and 2015, gross wage costs decreased by an accumulated 2.4% in Catalonia to stand at 32,514 euro / year.
Compared to other European cities, the wage level in Barcelona is located in the lower-middle part of the ranking, only above cities like Lisbon, Athens, Prague or Budapest, but far lower than other similar cities like Dublin, Munich, Amsterdam and Milan. From a gender perspective, it is noteworthy that, according to a study on average salaries in Barcelona in 2014, employed women residents of Barcelona received a salary that
was on average 25.1% less than men, while the wage gap between Catalonia and Spain was slightly higher than for the population of Barcelona (26.6% and 25.8% respectively) while at the European Union level the figure stood at 16.7%.
Regarding taxation, in 2015 there was a drop in the rate of corporation tax, which went from 30% to 28%, and in 2016 there was a second reduction down to 25%. This fall means Spain is approaching the aver-age European corporation tax rate of around 22%. However, we should add that the nominal rates may differ quite a lot with the effective ones, which are those actually being applied once deductions and allowances are included, which in the case of Spain is lower than the nominal rate. The fall in corpora-tion tax is in addition to a reduction in income tax, which has been introduced in steps between 2015 and 2016.
Finally, it is worth noting that Barcelona remains in a highly competitive position with regard to the rent-al prices of industrial land, offices and commercial buildings, which helps to attract businesses to Bar-celona, both in terms of new companies setting up here and the maintenance of existing ones that are already here. However, rental prices began to in-crease in 2015 in the city of Barcelona, because of an improvement in the economic situation and appeal of the city.
BARCELONA OBSERVATORY REPORT 2016 73 Prices and costs
Rental prices for businesses
have risen due to the economic recovery
and the city’s growing appeal in the
global markets

Cost of living in cities around the world in 2015
BARCELONA OBSERVATORY REPORT 2016 74 Prices and costs
Barcelona fell significantly in the cost of living ranking of cities in the world, going from 71st position in 2014 to 124th in 2015, according to an annual survey by Mercer Human Resource Consulting, taken from an analysis of more than 200 basic products and services in 207 cities worldwide. In the last eight years, coinciding with the recession, Bar-celona has experienced a sharp decline in its position in the ranking (from 31st in 2008 to 124th in 2015), which at the same time has enabled the city to gain in terms of competitiveness compared to foreign markets.
Other European cities such as Paris, Milan, Rome and Ber-lin have followed the same trend as Barcelona in 2015. The depreciation of the euro, which began in the second half of 2014 and continued during the whole of 2015, was the main cause of this decline in the cost of living rank-ing for European cities because the benchmark city in the ranking is New York. In the case of Barcelona, there was the additional issue of containment in consumption goods prices between 2014 and 2015 (with average annual in-flation of 0.3% and 0.0% respectively). Overall, there has been a relative drop in the cost of life in Barcelona com-pared to world cities, although when compared to other European cities the situation remains quite similar.
Barcelona drops in the ranking of cities with the highest costs of living
Barcelona’s position
56
43
66
56
31 31
38
124
49
84
71
85
2004 2005 2006 2007 2008 2009 2010 2011 2012 2013 2014 2015
Source: Worldwide Cost of Living Survey, City Rankings 2015. Mercer Human Resource Consulting
Hig
her c
ost
Low
er c
ost

BARCELONA OBSERVATORY REPORT 2016 75 Prices and costs
City CityRanking2014
Ranking2014
Ranking2015
Ranking2015
Cost of living in cities worldwide. 2015
1
3
5
4
6
10
11
14
8
2
7
12
20
17
24
16
13
18
86
25
54
34
67
15
48
47
50
66
71
19
26
23
68
46
36
62
74
20
22
49
61
85
28
63
88
27
33
37
51
92
9
71
1
2
3
4
5
6
7
8
9
10
11
12
13
14
15
16
17
18
19
20
21
22
23
24
24
26
27
28
29
30
31
32
33
33
35
36
37
38
39
40
41
42
42
44
45
46
47
48
49
50
50
124
Luanda
Hong Kong
Zurich
Singapore
Geneva
Shanghai
Beijing
Seoul
Bern
N’Djamena
Tokyo
London
Kinshasa
Shenzhen
Guangzhou
New York
Victoria
Tel Aviv
Buenos Aires
Lagos
Shenyang
Conakry
Dubai
Copenhagen
Qingdao
Nanjing
Tianjin
Yangon
Chengdu
Libreville
Sydney
Osaka
Abu Dhabi
Baku
Abuja
Los Angeles
San Francisco
Oslo
Noumea
Sao Paulo
Taipei
Chicago
Brazzaville
Beirut
Bangkok
Paris
Melbourne
Perth
Dublin
Washington DC
Moscow
Barcelona
Source: Worldwide Cost of Living Survey, City Rankings 2015. Mercer Human Resource Consulting

Corporation tax and VAT in countries around the world in 2016
Spain continues to be located in the upper middle part of the European ranking with regards to VAT rates, currently standing at 21%, but below countries like Greece (23%) and Italy (22%), and above Germany (19%) and France (20%). Regarding corporate tax, Spain reduced its rates in 2015 from 30% to 28% and again in 2016, the rates fell to 25%, meaning they are now approaching the EU average (22.1%). These tax rates falls are in addition to the income tax reductions, which have been implemented gradually in 2015 and 2016. According to KPMG, other EU countries like Spain have lowered their rates of corporation tax, but not as much as Denmark and Norway.
According to the study by PwC and the World Bank called Paying Taxes 2015, Spanish companies paid a total tax rate of 58.2% in 2015, higher than the average for Eu-ropean countries, but quite similar to the rates three years ago (58.6% in 2012). In terms of tax concepts con-sidered, it is worth noting that most of this tax is paid on work (35.7%), followed by corporate tax (21.9%) and other taxes (0.6%)
Corporation tax and VAT in countries across the world. 2016
BARCELONA OBSERVATORY REPORT 2016 76 Prices and costs
The corporate tax rate is approaching the European rate average
Country CountryBase rateVAT (%)
Base rateCorporate Tax (%)
Hungary
Denmark
Norway
Sweden
Finland
Greece
Ireland
Poland
Portugal
Slovenia
Italy
Argentina
Belgium
SpainLatvia
Netherlands
Czech Republic
Austria
Slovakia
France
United Kingdom
Germany
Cyprus
Tunisia
Israel
Luxembourg
China
India
South Africa
Australia
South Korea
Japan
Switzerland
Canada
United States
Hong Kong
United States
Argentina
India
Belgium
France
Japan
Italy
Australia
Germany
Luxembourg
Greece
South Africa
Canada
Austria
SpainIsrael
Norway
Netherlands
Tunisia
China
South Korea
Denmark
Slovakia
Sweden
Portugal
Finland
United Kingdom
Hungary
Polòand
Czech Republic
*Switzerland
Slovenia
Hong Kong
Latvia
Ireland
Cyprus
27
25
25
25
24
24
23
23
23
22
22
21
21
2121
21
21
20
20
20
20
19
19
18
17
17
17
15
14
10
10
8
8
5
---
---
40.0
35.0
34.6
34.0
33.3
32.3
31.4
30.0
29.7
29.2
29.0
28.0
26.5
25.0
25.025.0
25.0
25.0
25.0
25.0
24.2
22.0
22.0
22.0
21.0
20.0
20.0
19.0
19.0
19.0
17.9
17.0
16.5
15.0
12.5
12.5
Source: KPMG’s Corporate and indirect Tax Rate tables. KPMG
Note: The original database contains 138 countries, while the table lists a sample of selected reference countries *Data for 2015

BARCELONA OBSERVATORY REPORT 2016 77 Prices and costs
Source: KPMG’s Corporate and indirect Tax Rate tables. KPMG
SwitzerlandSlovenia
Austria
Regne Unit Denmark
Germany
Czech Republic
France
Sweden
Norway
Poland
Finland
Hungary
Greece
Italy
Irleland
Spain
Portugal
Corporation tax. 2016 (%)
12.5
29.0
29.7
33.3
31.4
17.9
17.0
25.0
25.0
21.0
22.020.0
19.0
19,0
19.0
22.0
25.0
20.0
15.0
Slovakia22.0
Latvia
Luxembourg29.2
Belgium 34.0
25.0 Netherlands

Office rental prices in cities in Europe, the Middle East and Africa in 2015
BARCELONA OBSERVATORY REPORT 2016 78 Prices and costs
Yields on offices in European cities. Q III 2015
Note: Yields refer to the return on investment in the office sector for each city Source: EMEA Rents and Yields Q3 2015 (Europe, Middle East & Africa).CB Richard Ellis
Lyon
Barcelona
Amsterdam
Dublin
Madrid
Munich
4.9%
4.8%
5.3%
4.7%
4.5%
3.8%
Office rental prices are up for the first time in the last six years
The price per square metre of office rentals in Barcelo-na stood at €234 a year in 2015, according to the report EMEA Rents and Yields, prepared by CB Richard Ellis. Pric-es have increased almost 10% compared to a year ago, after remaining stable the previous year, and having de-creased the four previous years to that. This trend means Barcelona has climbed five positions, moving from the 45th spot to 40th position in the ranking for office rental prices from a total of 58 selected cities in the area of Europe, Middle East and Africa. Despite the increases in price last year, Barcelona is still located in the lower-to-middle range of the selected sample, with prices similar to Prague and Copenhagen, but well below the reference cities like Dublin, Milan, Amsterdam and Lyon. In comparison, the city of Madrid is located in a higher position than Barce-lona, with office rental prices of 312 € m2 and growth last year of 5.1%.
The yield obtained from renting offices in Barcelona was 4.9% in 2015, according to CB Richard Ellis, very similar to cities like Amsterdam, Dublin and Madrid, among others.

City CityRanking RankingOffice rentals
(€/m2/year)
Office rentals
(€/m2/year)
Rental prices for offices in cities in Europe, Middle East and Africa. 2015
1
2
3
4
5
6
7
8
9
10
11
12
13
14
15
16
17
18
19
20
21
22
23
24
25
25
27
28
28
9.3
11.7
0.0
0.0
-26.7
-3.0
0.0
16.7
13.3
2.1
0.0
8.3
4.0
7.0
0.0
8.8
-2.7
5.3
3.5
3.6
1.5
0.0
1.5
-55.9
-1.9
5.1
0.0
3.7
2.0
-5.6
0.0
0.0
7.7
2.2
-1.9
4.6
-14.8
14.3
0.0
0.0
9.9
3.0
0.0
0.0
2.8
0.0
0.0
2.4
13.3
0.0
6.7
8.8
9.8
19.2
-1.8
5.4
0.0
4.8
30
30
32
33
34
35
36
37
38
39
40
40
42
43
44
44
46
47
48
49
50
51
51
53
54
55
56
57
58
1,784
1,017
825
800
788
767
735
565
552
490
484
475
474
456
446
444
439
438
431
416
402
380
350
316
312
312
309
303
300
288
288
285
280
276
265
252
247
243
240
234
234
228
225
222
222
220
215
210
204
192
192
192
188
186
168
152
144
120
London West End
London city
Geneva
Paris
Moscow
Zurich
Dubai
Dublin
Stockholm
Milan
Istanbul
Manchester
Frankfurt
Edinburgh
Oslo
Helsinki
Abu Dhabi
Birmingham
Glasgow
Bristol
Munich
Rome
Amsterdam
St. Petersburg
Düsseldorf
Madrid
Vienna
Gothenburg
Hamburg
Warsaw
Tel Aviv
Brussels
Lyon
Berlin
Marseille
Athens
Kyiv
Belfast
Budapest
Prague
Barcelona
Copenhagen
Rotterdam
Lisbon
Bucharest
Lille
The Hague
Utrecht
Vilnius
Bratislava
Belgrade
Tallinn
Aarhus
Riga
Zagreb
Johannesburg
Oporto
Thessaloniki
Source: EMEA Rents and Yields Q3 2015 (EMEA: Europe, Middle East & Africa). CB Richard Ellis
Annual var. (%)
Annual var. (%)
BARCELONA OBSERVATORY REPORT 2016 79 Prices and costs

3,2403,2403,180
Portal de l’Àngel(Barcelona)
3,0002,940
2,880
Preciados(Madrid)
4,4404,3804,320
KaufingerstradeBe(Munich)
2,580
2,7602,700
Pg. de Gràcia(Barcelona)
2,9002,9002,900
Kalverstraat(Amsterdam)
Retail rental prices in cities around the world in 2015
According to the study Main Streets Across the World 2015/2016 by Cushman & Wakefield, Portal de l’Angel is again the most expensive street in Spain, placed 15th in the world ranking, one spot lower than the previous year. Specifically, the rental price of retail premises in Portal de l’Angel was € 3,240 / m2 / year, far from the € 33,812 /m2/year charged down Fifth Avenue, New York, which is the world’s most ex-pensive shopping street; or Avenue des Champs Elysees (€ 13,255 /m2/year), the most expensive street in Europe. Compared to the previous year, Portal Angel has maintained stable prices per m2, while Passeig de Gràcia and Rambla de Catalunya have seen increases in rentals of 2.2% and 5.6% respectively.
In the Spanish ranking, Madrid’s main shopping street called calle Preciados occupies 2nd position with a price of € 3,000 /m2/year; and the third most expensive is Pas-seig de Gràcia, which had an average price of € 2,760 /m2/year. Barcelona continues to occupy a high position in the world ranking of retail rental prices reflecting its global appeal and recent strong sales performance, especially purchases by foreign tourists
BARCELONA OBSERVATORY REPORT 2016 80 Prices and costs
Source: Main Streets Across the World 2015-2016. Cushman & Wakefield
1,0201,0801,140
10,000
13,255
33,812
8,500
13,25513,255
29,822
7,500
20,702
3,0912,529
2,389
Grafton Street(Dublin)
2015
20132014
Rbla. de Catalunya(Barcelona)
Via Montenapoleone
(Milan)
Avenue desChamps Elysées
(Paris)
5th Avenue(New York)*
Rental prices for retail premises (€/m2/year
Prices rise in the city centre but remained stable in Portal de l’Angel
(*) In 2014 and 2015 the reference is to Upper 5th Avenue, while previous years the reference was in general to the 5th Avenue. Therefore, the 2014 data and previous years are not comparable

Rental rates for retail premises in cities around the world. 2015
Country City2014 Street2015
BARCELONA OBSERVATORY REPORT 2016 81 Prices and costs
1
2
3
4
7
5
9
6
8
10
12
13
11
16
14
19
18
17
15
23
20
21
22
26
25
27
28
30
31
24
1
2
3
4
5
6
7
8
9
10
11
12
13
14
15
16
17
18
19
20
21
22
23
24
25
26
27
28
29
30
33,812
23,178
13,255
12,762
10,000
8,898
8,643
8,520
8,519
4,620
4,440
4,233
3,814
3,253
3,240
3,091
3,016
2,900
2,852
2,640
2,515
2,413
2,280
2,276
2,160
1,968
1,750
1,675
1,620
1,616
US
Hong Kong (China)
France
United Kingdom
Italy
Australia
Switzerland
Japan
South Korea
Austria
Germany
China
Russia
Singapore
Spain
Ireland
Turkey
Netherlands
Norway
Taiwan
Canada
Denmark
Czech Republic
India
Greece
Finland
Belgium
New Zealand
Luxembourg
Ukraine
New York
Hong Kong
Paris
London
Milan
Sydney
Zurich
Tokyo
Seoul
Vienna
Munich
Shanghai
Moscow
Singapore
Barcelona
Dublin
Istanbul
Amsterdam
Oslo
Taipei
Toronto
Copenhagen
Prague
New Delhi
Athens
Helsinki
Antwerp
Auckland
Luxembourg
Kiev
Upper 5th Avenue (49th-60th Sts)
Causeway Bay (main street shops)
Avenue des Champs Elysées
New Bond Street
Via Montenapoleone
Pitt Street Mall
Bahnhofstrasse
Ginza
Myeongdong
Kohlmarkt
Kaufinger/Neuhauser
West Nanjing Road
Stoleshnikov
Orchard Road
Portal de l’Àngel
Grafton Street
Bagdat Caddesi
Kalverstraat
Karl Johan
ZhongXiao E. Road
Bloor Street
Stroget (Vimmelskaftet inclós)
Wenceslas Square
Khan Market
Ermou
City Centre
Meir
Queen Street
Grand Rue
Kreschatik Street
Note: This ranking only includes the most expensive shopping street in each country
Source: Main Streets Across the World 2015/2016. Cushman & Wakefield
Rentalshops
(€/m2/year)

Industrial land rental prices in cities in Europe, the Middle East and Africa in 2015
The annual rental prices of industrial land in Barcelona was 75 euros per square meter in 2015, according EMEA Rents and Yields report, by CB Richard Ellis. For the first time in recent years, rental prices increased by 4.2% year-on-year, which explains why Barcelona has gone from 20th position in the ranking in 2014 to 14th in 2015 amongst a total of 50 selected cities in the area including Europe, Middle East and Africa, which is a similar price/m2 for cit-ies like Amsterdam and Rotterdam. This change is due to an improvement in industrial activity, which is also seen in most European cities analyzed, but the most signifi-cant rises were recorded in London, Dublin and Belgrade, while cities that experienced largest declines are located in Russia, Ukraine, Turkey and Greece, which is due to the difficult economic situation in these countries. It is worth noting that in Madrid the rental price of industrial land is quite a bit lower, standing at 60 €/m2.
According to CB Richard Ellis, the yields on industrial land rentals in Barcelona reached 6.5% in 2015, identical to other European cities like Dublin and Vienna, but lower than the 7.5% recorded the previous year.
BARCELONA OBSERVATORY REPORT 2016 82 Prices and costs
Nota: Yields refer to the return on investment of industrial land for each city Source: EMEA Rents and Yields Q3 2015 (Europe, Middle East & Africa)CB Richard Ellis
Lyon
Barcelona
Amsterdam
Dublin
Munich
6.5 %
6.3 %
6.5 %
5.9 %
5.2 %
Yields on industrial land in European cities. Q III 2015
Prices rise due to increased demand

City CityRanking RankingRentals on industrial land
(€/m2/year)
Rentals on industrial land
(€/m2/year)
Rental price of industrial land in cities in Europe, Middle East and Africa. 2015
1
2
3
4
5
6
7
8
8
10
11
12
13
14
14
14
17
18
19
20
20
22
23
24
25
0.0
12.0
0.0
6.3
4.4
0.0
6.4
3.9
0.0
8.3
0.0
-3.2
0.0
4.2
0.0
0.0
0.0
-10.0
11.5
0.0
0.0
0.0
3.9
-45.1
-5.7
0.0
3.5
11.1
1.0
-48.6
0.0
0.0
0.0
0.0
0.0
0.0
5.9
3.6
0.0
4.2
-20.4
0.0
4.4
0.0
2.2
0.0
0.0
0.0
0.0
-7.7
25
25
25
29
30
31
32
33
34
35
35
35
38
39
40
41
42
43
44
45
46
47
48
49
50
219.5
204.5
183.4
163.0
144.0
136.9
131.3
98.6
97.3
95.0
86.9
80.6
78.0
75.0
75.0
75.0
74.4
73.0
72.5
70.0
70.0
68.4
64.8
62.7
60.0
60.0
60.0
60.0
58.2
57.9
57.6
57.0
55.2
55.0
54.0
54.0
54.0
52.2
52.0
50.0
48.4
48.0
48.0
48.0
46.0
45.6
44.0
43.5
39.0
36.0
Abu Dhabi
London
Geneva
Zurich
Helsinki
Oslo
Dubai
Glasgow
Stockholm
Edinburgh
Manchester
Istanbul
Munich
Barcelona
Amsterdam
Rotterdam
Frankfurt
Gothenburg
Dublin
The Hague
Utrecht
Hamburg
Düsseldorf
Moscow
Zagreb
Madrid
Paris
Belgrade
Vienna
St. Petersburg
Tallinn
Copenhagen
Berlin
Johannesburg
Budapest
Vilnius
Riga
Prague
Rome
Milan
Kyiv
Warsaw
Brussels
Bratislava
Lyon
Bucharest
Lille
Marseille
Lisbon
Athens
Annualvar. (%)
Annualvar.(%)
BARCELONA OBSERVATORY REPORT 2016 83 Prices and costs
Source: EMEA Rents and Yields Q3 2015. CB Richard Ellis

Wage levels in cities around the world in 2015
According to the report Prices & Earnings Around the Globe published by UBS, which analyzes trends in wage levels across 72 cities around the world between 2012 and 2015, the level of gross wages in Barcelona has de-creased in relation to the reference city (New York). This trend is shared with the main European reference cities as a result of wage moderation and the depreciation of the euro. Barcelona fell in the world rankings, falling from 29th position in 2012 to 30th in 2015, and stays in the mid range compared to other European cities. It is below Dublin, Munich, Amsterdam, Milan and Lyon, among many others, but above cities such as Madrid, Lisbon, Prague or Budapest.
The fall in net salaries in the period analysed in Barcelo-na (ie, after taking away taxes and social security contri-butions) has been even more significant if you take into account the behaviour of gross salaries, which indicates there is a differential in income tax in Barcelona when compared to the reference city (New York).
Barcelona falls in salary ranking
51.7
58.7
68.8
65.3
67.7
59.6
70.3
77.7
78.3
91.5
Barcelona
Munich
Milan
Dublin
Amsterdam
20152012
Gross salary(Index New York = 100)
Note: Effective wages per hour are based on a calculation for 14 professions. The net salary is calculated after taxes and social security contributions Source: Prices & Earnings around the Globe 2015. UBS
BARCELONA OBSERVATORY REPORT 2016 84 Prices and costs
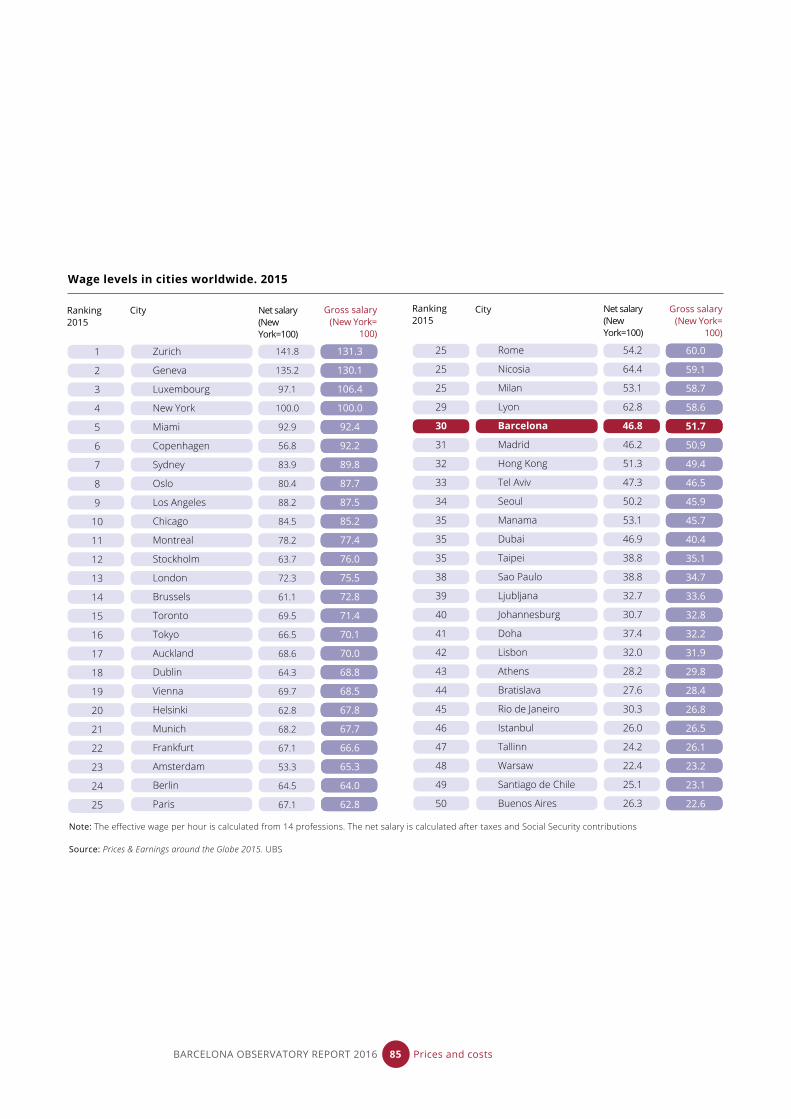
BARCELONA OBSERVATORY REPORT 2016 85 Prices and costs
City CityRanking2015
Ranking2015
Gross salary(New York=
100)
Gross salary(New York=
100)
Wage levels in cities worldwide. 2015
1
2
3
4
5
6
7
8
9
10
11
12
13
14
15
16
17
18
19
20
21
22
23
24
25
141.8
135.2
97.1
100.0
92.9
56.8
83.9
80.4
88.2
84.5
78.2
63.7
72.3
61.1
69.5
66.5
68.6
64.3
69.7
62.8
68.2
67.1
53.3
64.5
67.1
54.2
64.4
53.1
62.8
46.8
46.2
51.3
47.3
50.2
53.1
46.9
38.8
38.8
32.7
30.7
37.4
32.0
28.2
27.6
30.3
26.0
24.2
22.4
25.1
26.3
25
25
25
29
30
31
32
33
34
35
35
35
38
39
40
41
42
43
44
45
46
47
48
49
50
131.3
130.1
106.4
100.0
92.4
92.2
89.8
87.7
87.5
85.2
77.4
76.0
75.5
72.8
71.4
70.1
70.0
68.8
68.5
67.8
67.7
66.6
65.3
64.0
62.8
60.0
59.1
58.7
58.6
51.7
50.9
49.4
46.5
45.9
45.7
40.4
35.1
34.7
33.6
32.8
32.2
31.9
29.8
28.4
26.8
26.5
26.1
23.2
23.1
22.6
Zurich
Geneva
Luxembourg
New York
Miami
Copenhagen
Sydney
Oslo
Los Angeles
Chicago
Montreal
Stockholm
London
Brussels
Toronto
Tokyo
Auckland
Dublin
Vienna
Helsinki
Munich
Frankfurt
Amsterdam
Berlin
Paris
Rome
Nicosia
Milan
Lyon
Barcelona
Madrid
Hong Kong
Tel Aviv
Seoul
Manama
Dubai
Taipei
Sao Paulo
Ljubljana
Johannesburg
Doha
Lisbon
Athens
Bratislava
Rio de Janeiro
Istanbul
Tallinn
Warsaw
Santiago de Chile
Buenos Aires
Net salary(New York=100)
Net salary(New York=100)
Source: Prices & Earnings around the Globe 2015. UBS
Note: The effective wage per hour is calculated from 14 professions. The net salary is calculated after taxes and Social Security contributions


SUMMARY OF RESULTS
Summary of results
In 2015, the economies of Catalonia and Barcelona ad-vanced in terms of the labour market recovery that start-ed in 2013, driven by a recovery in domestic demand, especially family consumption and private investment, and strong exports performance, which was supported by external factors like the depreciation of the euro, low oil prices and ECB expansionary monetary policy. The forecast for 2016 points to annual growth of more than 3%, despite growing international instability after Brex-it and these financial risks could translate into a certain slowdown. In this environment, Barcelona has managed to maintain its strong economic and business position in the international and European contexts on most of the indicators included in the 2016 Report by the Barcelona Observatory, even improving on some of these positions.
The Catalan economy’s positive trend is confirmed by the results of the Survey on Business Outlook for 2016 by Eurochambres, which shows an improvement compared to the previous year. In parallel to this positive outlook, other indicators also re-affirm Barcelona’s appeal as a centre for business activity and the good image that the city has abroad. In this area, the city improved its overall position regarding global competitiveness, jump-ing six positions to stand at 20th in the ranking in the world, according to the Global Power City Index 2016 published by the Mori Memorial Foundation; and it is positioned 14th in the world ranking in terms of being a reputable city, according to the City RepTrak 2016, albeit falling positions compared to the previous year. Barcelo-na also generates confidence when it comes to interna-tional investment, as shown by the fact that it occupies the 8th position among the main urban areas in the world attracting foreign investment projects during the period 2012-2016, according to KPMG. On the other hand, the city is among the top five in the world in terms of num-ber of delegates and the number of international confer-ences organized in the period 2012-2015, according to the ICCA. Barcelona is also known for its entrepreneurial spirit and the business opportunities it offers, with a rate of entrepreneurial activity (TEA) which stands at 6.1% for the province of Barcelona in 2015, a rate that is above those of Germany, Norway and Italy, but below the Euro-pean Union average (7.6%).
The report’s chapter on quality of life, social cohesion and sustainability has been renewed this year with the addition of new indicators on social cohesion analysing two issues -inequalities and the risk of poverty and social exclusion- that are now centre stage in today’s political
and social debate. Regarding variables associated with a good quality of life, Barcelona is considered the 15th safest city in the world, according to The Safe Cities In-dex 2015, and 3rd in the field of sports, according to the Sports Cities Ranking for 2015. In terms of sustainability, Barcelona is also one of the cities with best results on dimensions related to environmental issues, according to the Sustainable Cities Index 2016, and it produces a relatively low volume of CO2 equivalent per inhabitant compared to other cities worldwide. The indicators that refer to social cohesion have developed unfavourably since the recession, although the Gini coefficient in Catalonia shows a very similar rate to the average for the OECD, while the rate of risk of poverty or social exclusion re-mains lower than the European Union indicator.
Regarding the labour market as a whole, it is worth mentioning that since 2014 there has been an improve-ment in line with economic recovery, although the em-ployment rate in Catalonia is still below the European average for seventh consecutive year. In this context, in 2015, Barcelona created net jobs for second consecutive year, after six years of labour market adjustments, re-cording a significant annual decline in the unemployed population, although unemployment is still well above the European average.
In the field of higher education Barcelona is a leader in business education, being the only European city with two educational institutions (IESE and ESADE) among the top ten business schools in Europe, according to The Financial Times and The Economist Intelligence Unit. Barcelona is also known for its skilled human capital. The percentage of workers with university degrees is well above the EU average (44.6% and 35% respectively) and in the case of working women this figure is above 50% for the first time, according to Eurostat data for 2015.
In the field of knowledge and technology, Barcelona remains well positioned at the European level, developing itself as a benchmark city in technology entrepreneur-ship. According to the European Digital City Index 2016, Barcelona is the 9th best European city in terms of offering support for digital entrepreneurship amongst Europe’s 60 principal cities. The city’s commitment to boosting research has allowed Barcelona to position itself as the 5th top city in Europe and 17th in the world in terms of publishing and producing scientific papers, according to an annual report prepared by the University Polytechnic of Catalonia, although –while maintaining the number of
BARCELONA OBSERVATORY REPORT 2016 88 Summary of results

papers published at the 2014 level– the city dropped six positions in the world ranking. Importantly, the city de-veloped a critical mass in terms of employment in sec-tors with high added value in 2015: Catalonia was the 5th top European region with the largest number of people employed in high and medium-high technology intensity manufacturing and 7th in terms of the number of working population in science and technology and 9th in terms of population employed in knowledge and technology ser-vices. In terms of innovation, the results of the latest data available for the year 2013 show an increase in the num-ber of total PCT applications for patents and technology in the Barcelona area.
The tourism sector continues to be one of the drivers of the city’s economic activity. On the back of favoura-ble past performance, Barcelona enjoys a strong position as a leading city tourist destination, both in Europe and internationally. Thus, in 2015, Barcelona recorded a re-cord number of tourists staying at city accommodation, approaching 9 million people, which is an increase of 6.4% over the previous year, according to Turisme de Barcelona. Barcelona’s strong position as an interna-tional tourism destination is reflected in the report Top Destination Cities Ranking 2014, where Barcelona is po-sitioned as the 8th city in Europe and 26th in the world in terms of number of international visitors. Also, according to the European Cities Marketing Benchmarking Report 2016, Barcelona is the 6th top European city with most overnights by international tourists, only behind Lon-don, Paris, Berlin, Rome and Madrid. This strong tourism performance is enhanced by the city’s excellent posi-tioning in terms of the quality of its transport infrastruc-ture. Firstly, in 2015, the port of Barcelona was –for the fifteenth consecutive year– the top port for cruises in Europe, with 2.54 million cruise passengers, 7.4% more than the previous year, according to data from MedCruise. On the other hand, Barcelona Airport was again in the top ten airports in Europe in terms of passenger volumes in 2015, reaching a record 39.7 million passengers (5.7% more than the previous year), according to the Airport Traffic Report, by ACI Europe.
Barcelona remains competitive in terms of prices and costs at the world level, given the fact that its wage and price levels are at the low-to-mid range of the ranking of all major European cities. However, the economic recovery that started in 2015 created an upward trend in the rental prices of industrial land, offices and retail premises, which bucks recent trends, but that does not
substantially alter the city’s position in the rankings. This reflects an improvement in the economic situation of the city and its growing appeal to global markets. In terms of costs of living, Barcelona dropped positions in the cost of living index ranking in relation to the reference city (New York) in 2015, according to Mercer Human Resource Con-sulting. This trend is in part due to factors including zero inflation, wage moderation and the depreciation of the Euro, and this means that in comparison with other Eu-ropean cities, the wage level in Barcelona is located in the lower-middle part of the ranking. As regards taxation, there has been a decline in the rate of corporation tax to 25% in 2016, meaning Spain is close to the European average. This reduction is accompanied with a reduction in income tax rates that have been phased in between 2015 and 2016.
For sixth consecutive year the Barcelona Observatory is publishing its special report titled the Business climate in the Metropolitan Area of Barcelona (AMB), which analyzes the business trends of 2015 and progress dur-ing the first three quarters of 2016, offering a forecast for the fourth quarter. This analysis highlights the con-solidation of the economic recovery during 2015 and 2016, and presents the best results from the Survey on the business climate in the AMB since 2009. The busi-ness situation and performance in the AMB was positive in the first three quarters of 2016, keeping up the growth rate achieved in 2015. Looking to the fourth quarter of 2016, business people in the AMB forecast that business performance will remain positive, especially in the retail sector, in line with the previous year.
BARCELONA OBSERVATORY REPORT 2016 89 Summary of results

BARCELONA OBSERVATORY REPORT 2016 90 Summary of results
1 Ranking refers to a selected sample 2 The ranking refers to regions or provinces 3 The ranking refers to countries 4 Ranking goes from low to high values
Global competitiveness
2016
Best reputation
2016
Foreign investment
projects
2012-2016
Entrepreneurial activity rate1,3
2015
Business outlook, exports1,3
2016
Organisation of international
congresses
2015
Safe cities
2015
Sports cities
2015
Gini coefficient1,2,4
2013
At risk of poverty or social
exclusion rate1,2,4
2015
London Sydney London Brazil Portugal Berlin Tokyo London Helsinki Prague
New York Vienna Shanghai Argentina Spain Paris Singapore Lausanne Bratislava Helsinki
Tokyo Zurich Hong Kong Canada Romania Barcelona Osaka Barcelona Copenhagen Stockholm
Paris Toronto São Paulo Estonia Belgium Vienna Stockholm Rio de Janeiro Budapest Oslo
Singapore Stockholm New York China Slovenia London Amsterdam Tokyo Berlin Bratislava
Seoul Edinburgh Paris United States Croatia Madrid Sydney Beijing Lyon Ljubljana
Hong Kong Montreal Sydney Slovakia Barcelona Singapore Zurich Edmonton Munich Amsterdam
Amsterdam Rome Barcelona Ireland Estonia Istanbul Toronto Sydney Oslo Milan
Berlin Vancouver Beijing Poland Bulgaria Lisbon Melbourne Paris Tokyo Copenhagen
Vienna Copenhagen Dublin Hungary Turkey Copenhagen New York Los Angeles Milan Bern
Frankfurt Helsinki EU average Lithuania Prague Hong Kong Melbourne Stockholm Barcelona
Shanghai Venice Switzerland Austria Amsterdam San Francisco Copenhagen Warsaw Madrid
Los Angeles Melbourne Netherlands Serbia Brussels Taipei Vancouver Barcelona Bucharest
… Barcelona --- Cyprus Seoul Montreal Glasgow Toronto & Ottawa Warsaw
20 Barcelona Madrid Barcelona Slovakia Hong Kong Barcelona Toronto Vienna Budapest
1
2
3
4
5
6
7
8
9
10
11
12
13
14
15
Summary of results

BARCELONA OBSERVATORY REPORT 2016 91 Summary of results
1 Ranking refers to a selected sample 2 The ranking refers to regions or provinces 3 The ranking refers to countries 4 Ranking goes from low to high values
Sustainable cities
2016
CO2 emissions equivalent
per capita1,3,4
2016
Employment rate1,2
2015
Unemployment rate1,2,4
2015
Workers with tertiary
education1,2
2015
Business schools
2016
Employeees in high-tech industries2
2015
Employees in science and technology2
2015
Scientific production
2015
PCT patent applications1,2
2013
Zurich Recife Munich Munich London Stuttgart Paris Beijing Tokyo
Stockholm Addis Abeba Stockholm Prague Oslo Milano London London San José
Geneva Lagos Stuttgart Stuttgart Bilbao Munich Madrid Shanghai Boston
Vienna Lima Oslo Frankfurt Helsinki Istanbul Warsaw New York Seoul
Frankfurt Oslo Amsterdam Oslo Edinburgh Barcelona Istanbul Seoul New York
Wellington Barcelona Copenhagen Budapest Brussels Karlsruhe Lyon Boston Los Angeles
Rome Paris Prague Edinburgh Madrid Turin Barcelona Tokyo Houston
Sydney Quito Frankfurt Amsterdam Copenhagen Bologne Milan Paris Osaka
London Mexico City Edinburgh London Stockholm Düsseldorf Munich Madrid Seattle
Hamburg Rio de Janeiro Helsinki Warsaw Paris Lyon Seville Baltimore Chicago
Madrid Madrid Rotterdam Manchester Dublin Cologne Marseille Moscow Munich
Singapore Vancouver London Copenhagen Glasgow Paris Berlin Chicago Stuttgart
Copenhagen Seoul Manchester Stockholm Amsterdam Frankfurt Stuttgart Toronto Stockholm
--- London … … … Madrid Cologne … …
23 Barcelona Wellington 25 Barcelona 29 Barcelona 16 Barcelona Warsaw Rotterdam 17 Barcelona 19 Barcelona
1
2
3
4
5
6
7
8
9
10
11
12
13
14
15
FontainebleauInsead
LondresLondres Business
School
Cambridge University of
Cambridge: Judge
MadridIE Business School
LausanneIMD
ParisHEC Paris
BarcelonaIese Business
School
BarcelonaEsade Business
School
MilanSDA Bocconi
OxfordUniversity of Oxford:
Saïd
LondonImperial College Business School
LancasterLancaster University
LondonCity University Cass
ManchesterAlliance Business
School
LisbonThe Lisbon MBA
R

BARCELONA OBSERVATORY REPORT 2016 92 Summary of results
1 Ranking refers to a selected sample 2 The ranking refers to regions or provinces 3 The ranking refers to countries 4 Ranking goes from low to high values
Digital cities
2016
Airport passengers
2015
International tourists
2014
Cruise passengers in Europe
2015
Cost of living
2015
Corporation tax1,3
2016
Office rental prices
2015
Rentals on retail premises
2015
Industrial land rental prices
2015
Salary levels
2015
London Hong Kong Barcelona Luanda United States London-West End Abu Dhabi Zurich
Stockholm London Civitavecchia Hong Kong Argentina City of London London Geneva
Amsterdam Singapore Balearic islands Zurich India Geneva Geneva Luxembourg
Helsinki Bangkok Venice Singapore Belgium Paris Zurich New York
Paris Paris Marseille Geneva France Moscow Helsinki Miami
Berlin Macau Naples Shanghai Japan Zurich Oslo Copenhagen
Copenhagen Dubai Savona Beijing Italy Dubai Dubai Sydney
Dublin Shenzhen Piraeus Seoul Australia Dublin Glasgow Oslo
Barcelona New York Ports of Tenerife Bern Germany Stockholm Stockholm Los Angeles
Vienna Istanbul Genoa N’Djamena Luxemoburg Milan Edinburgh Chicago
Munich Kuala Lumpur Dubrovnik/Korcula Tokyo Greece Istanbul Manchester Montreal
Cambridge Antalya Kusadasi London South-Africa Manchester Istanbul Stockholm
Bristol Seoul Livorno Kinshasa Canada Frankfurt Munich London
Madrid … La Valletta … Austria … Barcelona …
Oxford 26 Barcelona La Spezia 124 Barcelona Barcelona 40 Barcelona Amsterdam 30 Barcelona
New York Upper 5th Avenue
Hong Kong Causeway Bay
Paris Avenue des Champs-Élysées
London New Bond Street
Milan Via Montenapoleone
Sydney-Pitt Street Mall
Zurich Bahnhofstrasse
Tokyo Ginza
Seoul Myeongdong
Vienna Kohlmarkt
Munich Kaufingerstraße
Shangai West Nanjing Road
Moscow Stoleshnikov
Singapore Orchard Road
Barcelona Portal de l’Àngel
Londres Heathrow (LHR)
Paris-Roissy (CDG)
Istanbul (IST)
Frankfurt (FRA)
Amsterdam (AMS)
Madrid (MAD)
Munich (MUC)
Rome-Fiumicino (FCO)
London-Gatwick (LGW)
Barcelona (BCN)
Moscow Sheremetyevo (SVO)
Moscou Domodedovo (DME)
Paris-Orly (ORY)
Istanbul (SAW)
Antalya (AYT)
1
2
3
4
5
6
7
8
9
10
11
12
13
14
15

BARCELONA OBSERVATORY REPORT 2016 93 Summary of results
Foreign investment projects. 2012-2016
1 2 3 4 5 6 7 8 9 10 11 12 13 14 15
London Shangai Hong Kong Sao Paulo New York Paris Sydney Barcelona Beijing Dublin
Global competitiveness. 2016
1 2 3 4 5 6 7 8 9 10 11 12 13 14 20
London New York Tokyo Paris Singapore Seoul Hong Kong Amsterdam Berlin Viena Frankfurt Shangai Los Angeles ... Barcelona
Best reputation. 2016
1 2 3 4 5 6 7 8 9 10 11 12 13 14 15
Sydney Vienna Zurich Toronto Stockholm Edinburgh Montreal Rome Vancouver Copenhagen Helsinki Venice Melbourne Barcelona Madrid
Safe cities. 2015
1 2 3 4 5 6 7 8 9 10 11 12 13 14 15
Tokyo Singapotre Osaka Stockholm Amsterdam Sydney Zurich Toronto Melbourne New York Hong Kong San Francisco Taipei Montreal Barcelona
Sustainable cities. 2016
1 2 3 4 5 6 7 8 9 10 11 12 13 14 23
Zurich Stockholm Geneva Venice Frankfurt Wellington Rome Sydney London Hamburg Madrid Singapore Copenhagen ... Barcelona
European business schools. 2016
1 2 3 4 5 6 7 8 9 10 11 12 13 14 15
Fontainebleau Insead
London London
Business School
Cambridge University of Cambridge:
Judge
Madrid IE Business
School
Lausanne IMD
Paris HEC Paris
Barcelona IESE Business
School
Barcelona Esade School
Milan SDA Bocconi
Oxford University of Oxford:
Saïd
London Imperial College Business School
Lancaster Lancaster University
London University
Cass
Manchester Alliance
Business School
Lisbon The Lisbon
MBA
Digital cities in Europe. 2016
1 2 3 4 5 6 7 8 9 10 11 12 13 14 15
London Stockholm Amsterdam Helsinki Paris Berlin Copenhagen Dublin Barcelona Vienna Munich Cambridge Bristol Madrid Oxford
Scientific production. 2015
1 2 3 4 5 6 7 8 9 10 11 12 13 14 17
Beijing London Shangai New York Seoul Boston Tokyo Paris Madrid Baltimore Moscow Chicago Toronto ... Barcelona
European airports in terms of number of passengers. 2015
1 2 3 4 5 6 7 8 9 10 11 12 13 14 15
London Heathrow
(LHR)
Paris Roissy (CDG)
Istanbul (IST)
Frankfurt (FRA)
Amsterdam (AMS)
Madrid (MAD)
Munich (MUC)
Rome Fiumicino
(FCO)
London Gatwick (LGW)
Barcelona (BCN)
Moscow Sheremetyevo
(SVO)
Moscow Domodedovo
(DME)
Paris Orly
(ORY)
Istanbul (SAW)
Antalya (AYT)
Cruise passengers in the Mediterranean. 2015
1 2 3 4 5 6 7 8 9 10 11 12 13 14 15
Barcelona Civitavecchia Balearic islands
Venice Marseille Naples Savona Piraeus Ports of Tenerife
Genoa Dubrovnik Korĉula
Kusadasi Bodrum Antalya
Livorno La Valletta La Spezia
Cost of living. 2015
1 2 3 4 5 6 7 8 9 10 11 12 13 14 124
Luanda Hong Kong Zurich Singapore Geneva Shangai Beijing Seoul Bern N’Djamena Tokyo London Kinshasa ... Barcelona
Rentals on retail premises. 2015
1 2 3 4 5 6 7 8 9 10 11 12 13 14 15
New York Upper
5th Avenue
Hong Kong Causeway Bay
Paris Avenue
des Champs-Élysées
London New Bond
Street
Milan Via
Montenapoleone
Sydney Pitt
Street Mail
Zurich Bahnhofstrasse
Tokyo Ginza
Seoul Myeongdong
Vienna Kohlmarkt
Munich Kaufingerstraße
Shangai West
Nanjing Road
Moscow Stoleshnikov
Singapore Orchard Road
Barcelona Portal
de l’Àngel
Barcelona’s position in international rankings


SPECIAL REPORT

Business Cl imate in the Metropolitan Area of Barcelona
Situation in 2015 and outlook for 2016


Executive summary
Best results since 2009
The Survey on the business climate in the AMB for 2015 recorded its best results since 2009 (start of the data series), in line with an improving economic situation:
• The business performance is positive after years of negative results
• The falls in sales prices are more moderate
• Employment increased for first time since 2009
• Investment in the AMB is positive for the second consecutive year
Strong results across all sectors analyzed
• The annual averages of business perfor-mance, employment and investment are already positive for all sectors, with the ex-ception of the construction sector, which recorded positive values in the fourth quar-ter
• The hospitality sector stands out because it shows the most positive trend for all varia-bles analyzed (business performance, pric-es, employment and investment)
• The building sector, despite being the only sector still showing a slightly negative bal-ance, recorded most improvement togeth-er with the hospitality sector
Factors that limit business performance
In terms of the factors that limited business performance in 2015:
• Weak demand continues to be the factor most mentioned by companies; neverthe-less, it is becoming less relevant for the third consecutive year
• Conversely, increased competition, which was the second factor most mentioned, gained in relevance and was almost men-tioned as much as weak demand
• The third factor was financing difficulties, which was mentioned less compared to other factors, but was still relevant from a historical perspective
Positive outlook
• The first three quarters of 2016 record-ed positive overall business performance and last year’s growth is being main-tained.
• The outlook for business performance for the fourth quarter of 2016 is positive and stable compared to a year ago.
BARCELONA OBSERVATORY REPORT 2016 99 Business Climate in the Metropolitan Area of Barcelona

Business performance was positive in the Metropolitan Area of Barcelona for the first time since 2009
Situation and trends in the business climate in 2015
In 2015 business performance improved very significantly compared to the previous year, both in Catalonia and in the Metropolitan Area of Barcelona (AMB), according to the business climate survey carried out by Barcelona’s Cham-ber of Commerce and Idescat. For the first time since the survey was first carried out in 2009, business performance recorded an overall positive balance for both the AMB and Catalonia. These results mirror the improvement in the economic situation during 2015, in line with the growth in Catalonia’s GDP –estimated at 3.4% by Idescat. This growth was the result of a recovery in domestic demand, especially household consumption, as well as strong export results.
Indeed, the percentage of business people who considered business performance to be favourable increased from 22% in 2014 to 27% in 2015, while the percentage that said busi-ness performance was unfavourable went from 26% to 16% in the same period. Quarterly data show this improvement has taken place progressively throughout 2015 up until the final quarter, which recorded the most positive balance in the data series available.
BARCELONA OBSERVATORY REPORT 2016 100 Business Climate in the Metropolitan Area of Barcelona
Business performance across the economy1. Comparison with CataloniaBalance2, in %
Business performance by sectorsBalance, in %
2012
2013
2014
2015
-44-46
-26-28
-4-7
118
-27
11
-51-60
-11
-22
36
-35
-65
-10-14
10
-15
-45
-3 -3-6
-35-42
-534
-28
2
2926
-13
-24
-5-53
-10
4
-6 -8
1321
4
-10-3
12
32
8
-8
14 12
41
8
-10
13
41
11117
20
-32
-57-65
-79
-24
Industry Construction Retail Hospitality Other services
Source: Chamber of Commerce of Barcelona and Idescat
1. The results for the whole economy are the aggregation of results for industry, construction, retail, hospitality, and other services. Since 2013 data has not been presented in the survey for Spain because this data is not available. INE only publishes results for the Harmonized Business Climate Indicator for all sectors in Spain.
2. The overall balance is the difference between the percentage of businesses indicating that the variable being analysed recorded a positive performance and the percentage that noted that performance was negative. It should be mentioned that in the case of the hospitality sector the quarterly balances are subject to seasonality, and the series are too short to smooth.
I-13 II-13 III-13 IV-13 I-14 II-14 III-14 IV-14 I-15 II-15 III-15 IV-15
Source: Chamber of Commerce of Barcelona and Idescat
AMB Catalonia

Source: Chamber of Commerce of Barcelona and Idescat
The performance of businesses in Catalonia improved sig-nificantly in 2015, although performance continues to be more positive in the AMB, with 26% of business people in Catalonia indicating business performance to be favoura-ble, slightly lower than the 27% recorded in the AMB; mean-while the percentage indicating performance was unfavour-able is 17%, higher than the 16% recorded in the AMB.
This improved business performance has been widespread across all sectors in the last quarter of 2015, although the average annual results for the construction sector are still showing a slight decrease compared to the previous year.
Prices in the AMB continued to fall more moderately in 2015 for the third consecutive year as a result of a recovery in demand, while the falling prices of production due to low oil prices and raw materials could slow this process down in 2016. Thus, the balance between positive responses (increases in prices) and negative (decreases in prices) re-mains negative but the gap is narrower than during the previous three years. The quarterly data from the survey showed a stable drop in prices throughout the year. More-over, results by sectors indicate that the slowdown in the decline of prices has been widespread, although the hospi-tality business is the only sector which recorded a positive balance over the year (increases in prices), which was the first time since 2009.
Employment in the AMB also recorded a very strong per-formance in 2015, with jobs created in virtually all sectors, something which had not happened since the beginning of the data series in 2009. Thus, in terms of employment, there was an increase in the number of positive respons-es (growth in the number of people employed) from 15% in 2014 to 18% in 2015; while the percentage of negative responses (decreases in the number of people employed) fell from 18% in 2014 to 13% in 2015. In terms of sectors, the construction business is the only sector with a negative overall balance in 2015, although this sector has also expe-rienced the most substantial improvements. It is worth not-ing that the hospitality sector saw the steepest increase in employment in 2015 for second consecutive year. Quarterly results show that the improvement in jobs was particularly relevant in the last three quarters of 2015, which recorded slight positive balances. These strong results confirm the turnaround observed in the labour market since 2014, as shown by data from EPA and employees paying into the So-cial Security (SS) system both in Catalonia and the province of Barcelona. The number of people signed up with the SS in Catalonia grew by 3.5% on average in 2015, and in the province of Barcelona this was 3.8%. However, while this
BARCELONA OBSERVATORY REPORT 2016 101 Business Climate in the Metropolitan Area of Barcelona
Business performance trends for the economy of the AMBBalance, in %
2012
2013
2014
2015
-44
-26
-4
11
-20
-16
-3
4
-21
-19
-12
-6
-20
-11
3
6
is good news, there is still a long way to reach the employ-ment levels seen before the recession.
The trend in investment also improved compared to the previous year, recording a slightly positive balance for the second year in a row. This improvement reflects the overall growth in positive responses (increase in investment), which went from 21% in 2014 to 22% in 2015, whilst the number of negative responses decreased (decrease in investment), which fell from 18% in 2014 to 16% in 2015. We can re-late this upward trend to improvements in Gross Capital in Catalonia, which recorded an increase of 5.6% per annum on average in the first three quarters of 2015. In terms of sectors, the hospitality and commerce business areas re-corded the highest increases in positive balances during the year, while the construction sector has gone from a very negative balance in 2014 to one that shows greater stability (-1%). However, not all the sectors in the survey recorded such significant improvements in 2015: industry and other services experienced a positive balance but slightly lower than in 2014.
Business performance Prices Employment Investment

Source: Chamber of Commerce of Barcelona and Idescat
As mentioned before, business performance was more positive for the AMB than Catalonia. However, in terms of investment, it was positive for Catalonia. For employment and prices, both areas recorded practically the same re-sults.
Results per sector
A general trend across all sectors in the AMB in 2015 was better business performance, as analyzed in the Survey on business climate, but it was the hospitality industry that achieved the best results on all the variables analysed. However, it is worth noting that the construction sector also improved, even though this was the only sector with a negative overall balance for the whole year. Also, it is worth noting the growth experienced by industry, retail and other services sectors.
The industry3 sector saw improvements across all varia-bles analyzed in 2015, except for investment. Business performance improved in the industrial sector, achieving a positive balance for the first time in recent years. Indus-trial production data published by INE also shows positive dynamics in the industrial sector in 2015: the IPI for Cata-lonia’s industrial sector registered a growth of 2.5% com-pared to 1.6% in 2014.
This improvement in the industrial sector’s business per-formance has been helped by strong exports, which has been the driving force behind industrial activity during the last few years of the recession. Indeed, the Survey’s results show a positive balance on this variable, standing at 7%, which is a similar level to the one achieved in 2012 and 2013. These strong exports results are confirmed by data from the Secretary of State for Trade showing export growth in the province of Barcelona was 6.1% in 2015, more than double the growth achieved in the previous year (3%). In addition, The Survey results show that the business cli-mate was more positive in terms of industrial exports in the AMB in 2015 than in Catalonia.
Regarding the prices of goods and services, these regis-tered a lower fall than in the previous year. In 2015, the percentage of business people who said that prices rose increased slightly to 5%, while the percentage of business people claiming prices fell stood at 10% (14% in 2014).
BARCELONA OBSERVATORY REPORT 2016 102 Business Climate in the Metropolitan Area of Barcelona
Trends in the business climate in the industrial sector in the AMBBalance, in %
2012
2013
2014
2015
-39
-15
6-14
-16
Business performance Exports Prices
Employment Investment
Business climate across the whole economy. 2015 Comparison with CataloniaBalance, in %
Business performance
Prices
Employment
Investment
-6-5
611
Source: Chamber of Commerce of Barcelona and Idescat
AMB Catalonia
118
44
3. Since 2013 the survey has widened the industrial sectors analyzed to cover the whole industrial sector and not just manufacturing, as had been done until 2012
-12
-6
9-12
-4
-4
-1
1-11
8
-5
11
65
7

4. From 2013 the question on the Business climate survey about investment was only asked once a year. Therefore, since there is no quarterly result, the ques-tion is about the trend in annual investments and not quarterly investments as it was before.
Source: Chamber of Commerce of Barcelona and Idescat
However, the indicator that shows industry’s greatest im-provement in 2015, apart from improvements to business performance, is employment. In 2015, the sector ex-perienced an increase in employment in the AMB for the first time since the data series began. The percentage of business people who said there had been an increase in employment was higher than the percentage indicating a decrease (17% and 12% respectively). Especially important were the second and the fourth quarters of the year, when the sector recorded a strong positive balance.
In terms of investment4, as already mentioned, the indus-trial sector stabilized its growth compared to the previous year, with the percentage of firms noting that investment had grown standing at the same rate (25%), which remains above the percentage indicating a decrease in investment (even though this increased from 17% in 2014 to 20% 2015).
The overall trend in the industrial sector in terms of busi-ness performance was similar in the AMB and Catalonia, while investment was clearly stronger in Catalonia and ex-ports were stronger in the AMB. Employment, on the other hand, was stronger in both areas.
The construction sector continues to record the most negative overall balance, but also the most significant im-provements on nearly all variables analyzed (with the over-all balance falling most in percentage terms), meaning that the decline is slowing down. This has been possible thanks to consolidation in the recovery process that started in the construction sector during 2015, after a very strong adjust-ment process that began in mid 2008. In fact, this sector recorded a positive GVA rate in 2015, after seven consecu-tive years in recession. This is shown by residential housing activity, property prices that have started to grow, mortgag-es that have also started to rise and an increase in house sales. By contrast, public works tendering in Catalonia reg-istered a decline in 2015.
The percentage of business people saying that business performance was favourable increased slightly to 17% (11% in 2013), while those saying it was unfavourable fell signif-icantly to 22% in 2015 (36% in 2014). Although the overall balance remained negative, it was not very far behind other sectors with positive values analyzed in the survey. It should also be noted that the last quarter of 2015 saw the lowest percentage of business people that considered business performance had been unfavourable since 2009 (16%), this comes at the same time when the survey found the highest
BARCELONA OBSERVATORY REPORT 2016 103 Business Climate in the Metropolitan Area of Barcelona
Trends in the business climate in the construction sector in the AMB areaBalance, in %
2012
2013
2014
2015
-69
Business climate in the industrial sector. 2015 Comparison with CataloniaBalance, in %
Business performance
Exports
Prices
Employment
Investment
Source: Chamber of Commerce of Barcelona and Idescat
AMB Catalonia
11
6
-2-5
12
6
7
5
4
21
-45-48
-42
-62-39
-48-60
-25-24-24-23
-5-13
-6-1
9
Business performance Prices Employment Investment

percentage of business people considering business per-formance to be favourable since 2010 (23%). This gives the first positive quarterly balance in the available series (since 2009).
The fall in prices continued to slow in 2015 for third con-secutive year, but this variable proved to be the most neg-ative balance for all sectors analyzed, although far less so compared to previous years. Thus, the percentage of business people in the construction sector that say prices increased in this sector rose slightly from 1% in 2014 to 2% in 2015, the percentage of business people noting a fall in prices decreased by a much higher percentage, 25% in 2014 to 14% in 2015.
Regarding employment, one can also observe a clear im-provement in 2015, the most significant across all sectors, in which the negative balance fell to a quarter of that regis-tered last year. Indeed, in 2015, the percentage of business people that indicated that employment would decline was 22% (compared to 33% in 2014), and those indicating that it would increase was 16% (9% in the previous year).
Also, investment substantially improved in 2015 to almost register a positive balance. 17% of business people suggest that investment has fallen, while 16% indicate it has risen (compared to 32% and 10% in 2014 respectively).
The results of the survey on the business climate in the con-struction sector are negative and very similar in the AMB and the whole Catalonia in 2015.
The retail sector recorded a significant improvement on all variables in 2015, and the overall situation is much more positive than during the previous year. These strong re-sults have been partly due to a recovery in domestic sales throughout 2015. The index of retail sales in Catalonia, which measures the trends in the sector’s activity -by way of business turnover- registered growth of 3.1% at current prices, higher than in the previous year (2.5%).
Indeed, the retail sector’s overall balance registered a pos-itive business performance in 2015 for the first time since the start of the series in 2009. This improvement was due to the fact that the percentage of business people in the sector indicating that business had been unfavourable de-creased (31% in 2014 to 18% in 2015) while the percentage of business people indicating that business performance has improved rose (from 21% to 26%). Throughout the year, there was a positive and progressive improvement, and in
BARCELONA OBSERVATORY REPORT 2016 104 Business Climate in the Metropolitan Area of Barcelona
Trends in the business climate in the retail sector in the AMBBalance, in %
Business climate in the construction sector. 2015 Comparison with CataloniaBalance, in %
Business performance
Prices
Employment
Investment
Source: Chamber of Commerce of Barcelona and Idescat
AMB Catalonia
-5
Source: Chamber of Commerce of Barcelona and Idescat
2012
2013
2014
2015
-61
-41
-11
8
-20
-18
-4
7
-8
-18
-13
-7
-19
-7
2
14
-4
-13-11
-6-3
-1-2
Business performance Prices Employment Investment

Source: Chamber of Commerce of Barcelona and Idescat
the fourth quarter the figure reached the highest overall balance since the beginning of the series (11%).
The fall in prices has slowed in 2015 compared to 2014 with a reduction in the percentage of business people say-ing that prices are declining, down to 13% (18% in 2014), in contrast to a slight increase in the percentage of business people saying prices increased, up to 6% (5% 2014).
Regarding employment, the balance is positive for the first time since the series started. And not only that, employ-ment remained positive throughout all the four quarters of the year, and it followed a clear path of growth as the year progressed. On the one hand, the percentage of positive answers (meaning an increase in employment) increased to 17% in 2015 (compared to 12% in 2014) and, on the other hand, there was a significant decrease in the percentage of negative responses (decrease in employment) to 10% (17% in 2014).
Investment also recorded a significant improvement in 2015 with a balance that was considerably more positive than the year before. Therefore, the upward trend contin-ued after that year. Thus, the percentage of business peo-ple that indicated increases in investment far exceeds those that indicated a decrease, 25% and 11% respectively (com-pared to17% and 14% respectively in 2014).
The size of the overall balances on the variables analyzed in the Survey on the business climate in terms of retail are similar in the AMB and Catalonia, but somewhat more favourable in the AMB, in terms of business performance, employment and investment.
Hospitality is the sector that has by far registered the best results across all variables analyzed on the Business climate survey in 2015. These results are in line with the strong results seen in terms of tourism in Catalonia in 2015, thanks mainly to an increase in foreign tourism and a recovery in domestic tourism. The number of foreign tourists coming to the province of Barcelona increased 3.3% while spending from this tourism rose 4.5%. Similar-ly, overnight stays in city hotels by foreign tourists in the province of Barcelona increased by 4.1% while domestic overnights grew 5.1% in 2015.
BARCELONA OBSERVATORY REPORT 2016 105 Business Climate in the Metropolitan Area of Barcelona
Trends in the business climate in the hospitality sector in the AMB areaBalance, in %
2012
2013
2014
2015
-3
Business climate in the retail sector. 2015 Comparison with CataloniaBalance, in %
Business performance
Prices
Employment
Investment
-7-6
1412
Source: Chamber of Commerce of Barcelona and Idescat
AMB Catalonia
85
67
-23-5
-7
0-10
-18
10-3
123
3415
1129
Trends in the business climate in the retail sector in the AMBBalance, in %
Business performance Prices Employment Investment

Indeed, the hospitality sector performed better than the rest of the sectors analyzed, it also recorded a very positive balance (34%). Although this sector has a strong seasonal effect, the overall balance has increased as we moved through the quarters (21% in the first quarter to 41% in the fourth). Thus, in 2015, 48% of business peo-ple qualified business performance as favourable, tripling the 14% that described performance as unfavourable; whereas in 2014 these percentages were 34% and 24% respectively.
Prices in the hospitality industry are the only ones show-ing positive values compared to all the other sectors; this sector not only had a positive balance, but the size of this overall balance was very large (15%). This could be relat-ed to an increase in the quality of hotels and also due to increased pressure from demand.
The number of people employed in the hospitality in-dustry is the only indicator that showed a similar increase to the previous year. Throughout 2015 the trend in em-ployment has been favourable, except in the last quarter due the seasonality of this sector.
Investment in the hospitality industry has experienced the greatest increase compared to all other sectors; it went from an overall balance of 3% (2014) to a remark-able 29% in 2015. The percentage of business people indicating increases in investment far exceeded the per-centage indicating a decrease -35% and 5% respectively- (compared to 25% and 22% respectively in 2014).
The hotel sector saw better results for all variables ana-lyzed in the Business climate survey 2015 in the AMB area than in Catalonia as a whole, especially in the case of business performance, which recorded a balance that was more than twice as high in the AMB than for Catalo-nia. The fact that leisure tourism in Barcelona is becom-ing less seasonal and also thanks to the large amount of business tourism here means that the AMB performed better than Catalonia.
The other services sector saw positive trends in both business performance and employment. Business perfor-mance is worth noting after last year having had a negative balance in 2014, but now has the second best results by sector, only being beaten by the hospitality industry. The percentage of business people in the AMB claiming unfa-vourable business performance declined by nearly half, from 22% in 2014 to 13% in 2015, while the percentage saying it was favourable rose from 22% to 25% respectively.
BARCELONA OBSERVATORY REPORT 2016 106 Business Climate in the Metropolitan Area of Barcelona
Trends in the business climate in the rest of services sector in the AMBBalance, in %
Business climate in the hospitality sector. 2015 Comparison with CataloniaBalance, in %
Business performance
Prices
Employment
Investment
Source: Chamber of Commerce of Barcelona and Idescat
AMB Catalonia
34
Source: Chamber of Commerce of Barcelona and Idescat
2012
2013
2014
2015
-41
-24
0
12
-21
-17
-2
3
-26
-21
-12
-8
-20
12
4
0
16
159
118
2923
Business performance Prices Employment Investment

The decline in prices slowed in 2015 compared to the previous year with the percentage of business people saying prices had fallen down to 11% (15% in 2014), while the percentage that indicated an increase remained sta-ble for the fourth consecutive year (3%). This moderation is clear when we look at the quarterly data, because as the year went by, the fall in prices reduced because of a recovery in private consumption.
Employment in the other services sector recorded an increase in 2015, which is the first time this has hap-pened since 2009. In quarterly terms, only the first quar-ter recorded a negative balance. Thus, in 2015, 15% of business people noted that employment had decreased (a lower percentage than in 2014, 19%), while the per-centage pointing to an increase in employment was up to 18% (16% in 2014).
Investment was worse compared to 2014. Specifically, it registered a neutral balance compared to a slight positive balance recorded the previous year.
The other services sector recorded very similar results in Catalonia and the AMB. Regarding business performance, prices and employment the overall balances were virtually identical in both areas. However, investment was better in Catalonia, which returned a positive result and an improve-ment. The AMB area remains stable but worsened com-pared to the previous year.
BARCELONA OBSERVATORY REPORT 2016 107 Business Climate in the Metropolitan Area of Barcelona
Business climate in the rest of services sector. 2015 Comparison with CataloniaBalance, in %
Business performance
Prices
Employment
Investment
-8-8
05
Source: Chamber of Commerce of Barcelona and Idescat
AMB Catalonia
1210
43
Trends in the business climate in the rest of services sector in the AMBBalance, in %

Weak demand is still the most important factor limiting business performance but less than before
Factors that limited business performance in 2015
Weak demand is still the factor most mentioned by em-ployers as limiting business performance in 2015, but this factor is now less important in weighting terms compared to other factors for the third consecutive year thanks to a recovery in private consumption. However, increased competition, the second factor mentioned as limiting business performance, has gained in relevance.
Meanwhile, continued improvements to financial market conditions has made financing difficulties lose importance as a limiting factor after increasing during the recession years. However, it is the third most mentioned limiting factor.
Results per sector
In 2015, the most mentioned factor limiting business performance by companies in the Metropolitan Area of Barcelona was weak demand, but this factor has lost its importance somewhat compared to other factors for the third consecutive year, mainly thanks to a recovery in domestic consumption. Thus, 66% of business people in the AMB say that weak demand was limiting business performance in 2015, a percentage that is considerably less than the 77% recorded in 2014.
This fall in relevance has been widespread across all sectors analyzed in the Business climate survey. However, the con-struction and retail sectors remain the most affected by this factor, according to 69% of business people in the construc-tion sector and 78% of retailers (lower percentages than those recorded the previous year: 88% and 83% respective-ly). In the industrial and other services sectors this was also the most limiting factor mentioned by businesses (64% and 61%, respectively). However, in the hospitality sector, this was the second most mentioned factor behind increased competition.
The second most mentioned factor by business people in the AMB as limiting business performance was increasing competition, according to 57% of responses, a percentage that is slightly up on 2014 (54%). However, this was mostly
in the industrial sector and to a lesser extent the construc-tion and other services business, while retail and hospitality saw this factor fell in terms of importance. However, the hospitality sector recorded the highest percentage of busi-ness people mentioning this as the most important factor limiting business performance (79%).
The third factor limiting business performance was finance difficulties, which was mentioned by 30% of business peo-ple in the AMB, a smaller percentage compared to the pre-vious two years (37% and 40% respectively). This fall was due to both the economic recovery and improved condi-tions in financial markets.
This lesser issue of financing is found across all sectors, except in the hospitality industry. In the construction and industrial sectors this is intense, while in the other services
BARCELONA OBSERVATORY REPORT 2016 108 Business Climate in the Metropolitan Area of Barcelona
Factors that limit business performance across the whole economy. Comparison 2013-2015In %
Weak demand
Increased competition
Finance difficulties
Lack of qualified workforce
Insufficient production equipment
Source: Chamber of Commerce of Barcelona and Idescat
2015 2014 2013
66
57
30
13
7
77
54
37
8
5
80
49
40
6
4
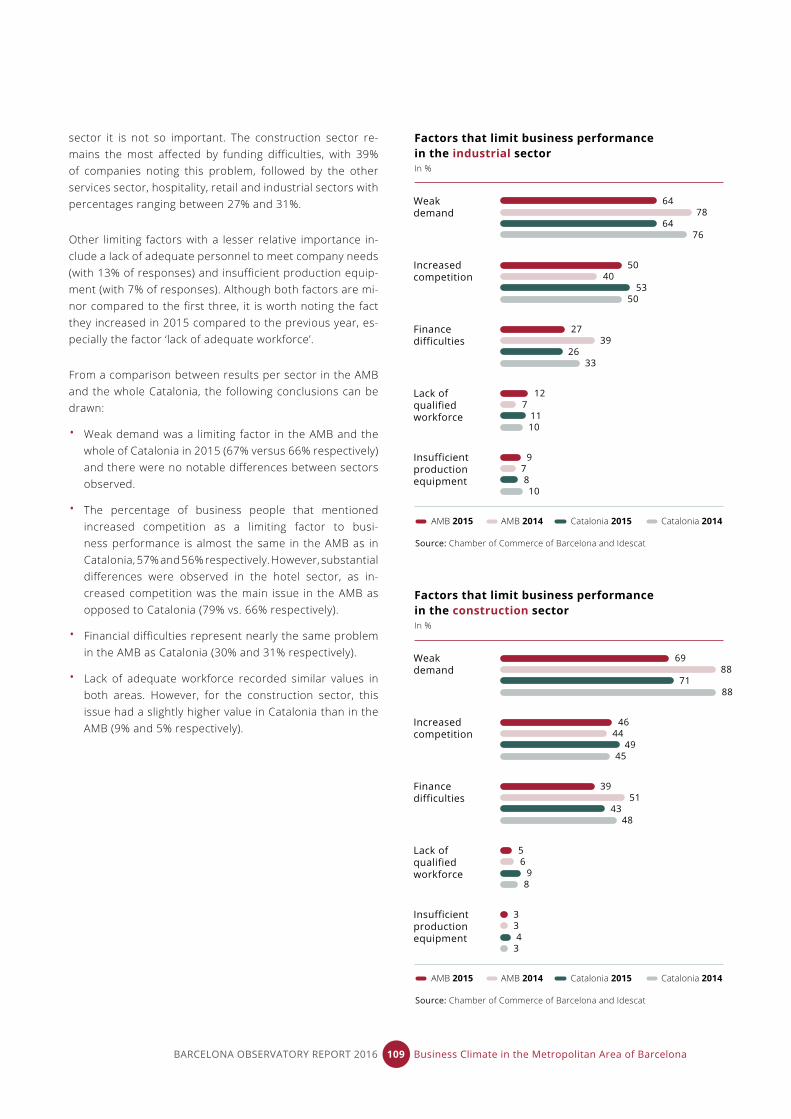
sector it is not so important. The construction sector re-mains the most affected by funding difficulties, with 39% of companies noting this problem, followed by the other services sector, hospitality, retail and industrial sectors with percentages ranging between 27% and 31%.
Other limiting factors with a lesser relative importance in-clude a lack of adequate personnel to meet company needs (with 13% of responses) and insufficient production equip-ment (with 7% of responses). Although both factors are mi-nor compared to the first three, it is worth noting the fact they increased in 2015 compared to the previous year, es-pecially the factor ‘lack of adequate workforce’.
From a comparison between results per sector in the AMB and the whole Catalonia, the following conclusions can be drawn:
• Weak demand was a limiting factor in the AMB and the whole of Catalonia in 2015 (67% versus 66% respectively) and there were no notable differences between sectors observed.
• The percentage of business people that mentioned increased competition as a limiting factor to busi-ness performance is almost the same in the AMB as in Catalonia, 57% and 56% respectively. However, substantial differences were observed in the hotel sector, as in-creased competition was the main issue in the AMB as opposed to Catalonia (79% vs. 66% respectively).
• Financial difficulties represent nearly the same problem in the AMB as Catalonia (30% and 31% respectively).
• Lack of adequate workforce recorded similar values in both areas. However, for the construction sector, this issue had a slightly higher value in Catalonia than in the AMB (9% and 5% respectively).
BARCELONA OBSERVATORY REPORT 2016 109 Business Climate in the Metropolitan Area of Barcelona
Factors that limit business performance in the industrial sectorIn %
Factors that limit business performance in the construction sectorIn %
Weak demand
Weak demand
Increased competition
Increased competition
Finance difficulties
Finance difficulties
Lack of qualified workforce
Lack of qualified workforce
Insufficient production equipment
Insufficient production equipment
Source: Chamber of Commerce of Barcelona and Idescat
Source: Chamber of Commerce of Barcelona and Idescat
AMB 2015
AMB 2015
Catalonia 2015
Catalonia 2015
AMB 2014
AMB 2014
Catalonia 2014
Catalonia 2014
64
69
50
46
27
39
12
5
9
3
78
88
40
44
39
51
7
6
7
3
64
71
53
49
26
43
11
9
8
4
76
88
50
45
33
48
10
8
10
3
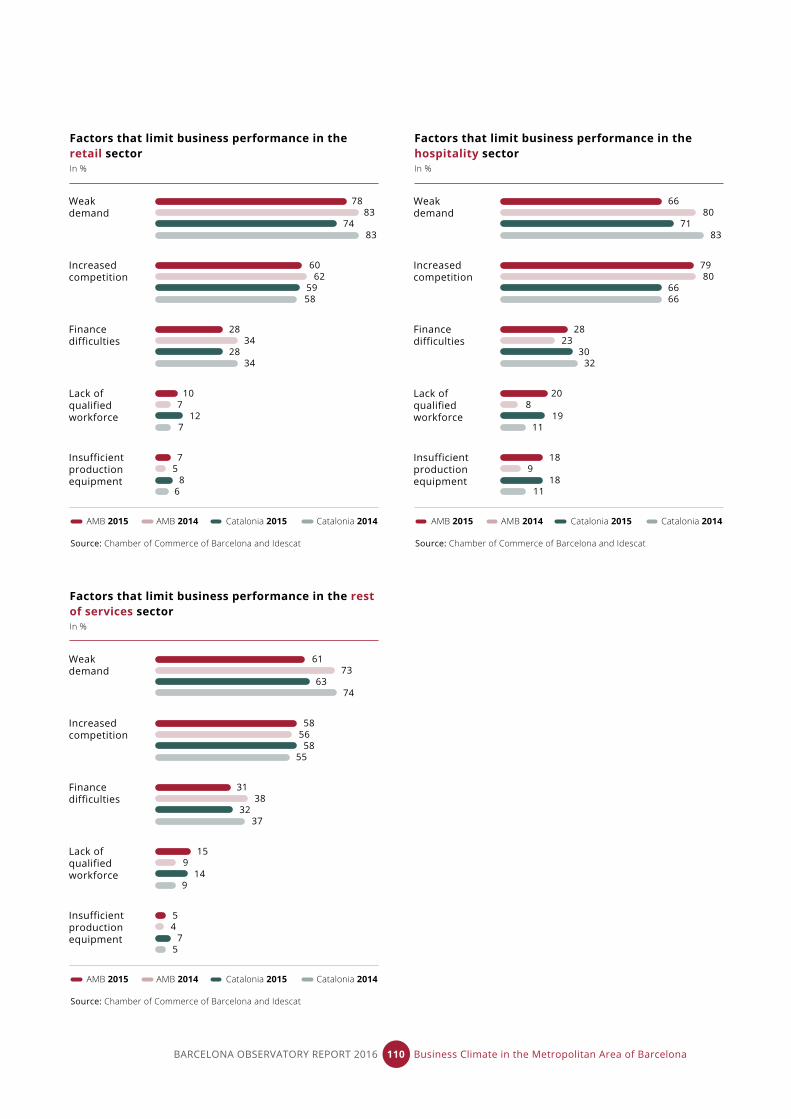
6680
Factors that limit business performance in the rest of services sectorIn %
Weak demand
Increased competition
Finance difficulties
Lack of qualified workforce
Insufficient production equipment
Source: Chamber of Commerce of Barcelona and Idescat
AMB 2015 Catalonia 2015AMB 2014 Catalonia 2014
61
58
31
15
5
73
56
38
9
4
63
58
32
14
7
74
55
37
9
5
Factors that limit business performance in the retail sectorIn %
Weak demand
Increased competition
Finance difficulties
Lack of qualified workforce
Insufficient production equipment
Source: Chamber of Commerce of Barcelona and Idescat
AMB 2015 Catalonia 2015AMB 2014 Catalonia 2014
78
60
28
10
7
83
62
34
7
5
74
59
28
12
8
83
58
34
7
6
Factors that limit business performance in the hospitality sectorIn %
Weak demand
Increased competition
Finance difficulties
Lack of qualified workforce
Insufficient production equipment
Source: Chamber of Commerce of Barcelona and Idescat
AMB 2015 Catalonia 2015AMB 2014 Catalonia 2014
28
20
7980
18
23
8
9
71
66
30
19
18
83
66
32
11
11
BARCELONA OBSERVATORY REPORT 2016 110 Business Climate in the Metropolitan Area of Barcelona

-15-13
33
-2
-6 -5
-1 0
11
6
17
121312
1514 14
6
1715
13 14
SituationForecast
Source: Chamber of Commerce of Barcelona and Idescat
I-14 2-14 III-14 IV-14 I-15 II-15 III-15 IV-15 I-16 II-16 III-16 IV-16
BARCELONA OBSERVATORY REPORT 2016 111 Business Climate in the Metropolitan Area of Barcelona
Business performance remained positive in the AMB during the first three quarters of 2016 and this trend is expected to continue in the 4th quarter
Situation and outlook for business performance in 2016
Economic recovery remained solid in Catalonia in 2016 and forecasts indicate the growth experienced in 2015 will continue this year. Indeed, the Chamber of Commerce has predicted that the Catalan economy will grow by 3.3% in 2016, virtually the same amount as in 2015 (3.4%). There are more factors that are contributing to this, including a fall in oil prices, low interest rates and a Euro exchange rate that is depreciating against the dollar.
Thus, the results of the Business climate survey confirmed the consolidation of a business recovery in the AMB in 2016. Business performance in the AMB remained positive for the first three quarters of the year, with a growth rate that has kept pace with growth experienced last year. All sectors ex-perienced a positive balance on average in the first three quarters, except the construction sector that moved towards stabilisation despite maintaining a similar level to 2015.
Regarding fourth quarter forecasts on business perfor-mance for 2016, managers expect this to be positive and virtually identical to results obtained a year ago. By sector, business people are forecasting a slowdown in growth com-pared to a year ago in the industrial sector, hospitality and other services, while the outlook for the retail and construc-tion sectors remains quite similar.
Business performance across the whole economy1
Balance5, in %
Business performance outlook by sectorBalance5, in %
0
17
41
-15
1919
7
-8
3
9914
24
13
-3
1115
45
1
161619
15
37
-10
13 13
40
16
-1
73
1520
-6
33
-16 -17
9
3
-3
-11
-18
-4
3
23
-1
-29
-6
9
-18
34
-31
6
-17
-3
-38
-3
-19
Industry Construction Retail Hospitality Other services
Source: Chamber of Commerce of Barcelona and Idescat
5. The overall balance for the situation each sector finds itself in is taken as the di-fference between the percentage of businesses who say business performance has been favourable and the percentage of businesses who say that this was unfavourable. In the case of the forecasts for 2016, this was the difference be-tween the percentage of businesses who expect business performance will be favourable and the percentage that forecast it will be unfavourable.
I-14 II-14 III-14 IV-14 I-15 II-15 III-15 IV-15 I-16 II-16 III-16 IV-16

BARCELONA OBSERVATORY REPORT 2016 112 Business Climate in the Metropolitan Area of Barcelona
Appendix on methodology
Sectors featured in the Business climate survey
Industry
01 Food, beverages and tobacco (CCAE-2009: 10 to 12)
02 Textiles, clothing, leather and footwear (CCAE-2009: 13 to 15)
03 Wood and cork, paper and printing industries (CCAE-2009: 16 to 18)
04 Chemical, rubber and other non-metal minerals industries (CCAE-2009: 20 to 23)
05 Metallurgy and manufacturing of metal products (CCAE-2009: 24 and 25)
06 Manufacture of machinery and mechanical equipment, and electrical products, computers, electronic and optical products (CCAE-2009: 26 to 28)
07 Other industries (CCAE-2009: 05 to 09, 19, 29 to 33, 35 to 39)
Construction
Section F of the CCAE-2009 is considered, with divisions:
41 Construction of buildings
42 Construction of civil engineering works
43 Specialised construction activities
Retail and commerce
01 Retail trade of food products, beverages and tobacco specialized (CCAE-2009: 472)
02 Retail trade of household goods, cultural and recreational goods in specialized shops (CCAE: 475 and 476)
03 Other types of retail (CCAE-2009: 473, 474, 477, 478, 479)
04 Retail in non specialised stores (CCAE-2009: 471)
05 Sales and repairs of motor vehicles and scooters (CCAE-2009: 45)
06 Wholesale trading and intermediary trading (CCAE-2009: 46)
Hospitality
CCAE-2009: 55 and 56
55 Accommodation Services
56 Food and Beverage Services
Other services
01 Information and communication (CCAE-2009: 58 to 63)
02 Legal and accounting activities (CCAE-2009: 69)
03 R&D, advertising and market research and scientific and technical activities (CCAE-2009: 71 to 75)
04 Administrative and support service activities (CCAE-2009: 77 to 82)
05 Other Services (CCAE-2009: 49 to 53, 64 to 66, 68, 92, 93 and 96)
6. Maximum possible error calculated from a simple random sample.
Industry 170 7.5%
Sectors Sample Error6
* Quarterly average
Source: Barcelona Chamber of Commerce and Idescat
Sampling errors. Barcelona Metropolitan Area*
Construction 88 10.3%
Retail 219 6.7%
Hospitality 89 10.7%
Other services 498 4.4%
Total 1,064 3%

