bridging gaps in police crime data - bureau of justice ... · bridging gaps in police crime data a...
TRANSCRIPT

Bureau of Justice Statistics
U.S. Department of JusticeOffice of Justice Programs
Bridging Gaps in Police Crime Data A Discussion Paper from the BJS Fellows Program
1955 1960 1965 1970 1975 1980 1985 1990 19950%
20%
40%
60%
80%
100%
Percent of the U.S.
UCR arrest statistics
population covered in
crime statistics of the
Reporting ProgramUniform Crime
(UCR)
crime statistics of theUniform CrimeReporting Program(UCR)
UCR arrest statistics

U.S. Department of JusticeOffice of Justice Programs
810 Seventh Street, N.W.Washington, D.C. 20531
Janet RenoAttorney General
Raymond C. FisherAssociate Attorney General
Laurie RobinsonAssistant Attorney General
No11l BrennanDeputy Assistant Attorney General
Jan M. Chaiken, Ph.D.Director, Bureau of Justice Statistics
Office of Justice ProgramsWorld Wide Web Homepage:
http://www.ojp.usdoj.gov
Bureau of Justice StatisticsWorld Wide Web Homepage:http://www.ojp.usdoj.gov/bjs/
For information contact:BJS Clearinghouse
1-800-732-3277

U.S. Department of JusticeOffice of Justice ProgramsBureau of Justice Statistics
Bridging Gaps inPolice Crime DataA Discussion Paper from theBJS Fellows Program
by Michael D. MaltzDepartment of Criminal Justice University of Illinois at Chicago andVisiting Fellow Bureau of Justice Statistics
September 1999, NCJ 176365
This paper is based on a Workshop on Uniform Crime ReportingImputation, sponsored by the Bureau of Justice Statisticsand theFederal Bureau of InvestigationUniform Crime ReportingProgram

U.S. Department of JusticeBureau of Justice Statistics
Jan M. Chaiken, Ph.D.Director
The points of view or opinions expressed in this document are thoseof the author and do not necessarilyrepresent the official position or policies of the U.S. Department of Justice.
BJS Discussion Papers promote theexchange of information, analysis, and ideas on issues related to justicestatistics and to the operations of thejustice system.
This document was prepared undercooperative agreement 95-BJ-CX-0001 for the BJS Visiting FellowshipProgram.
The author may be reached at thefollowing addresses:
Professor Michael D. Maltz Department of Criminal Justice University of Illinois at Chicago 1007 W. Harrison Street (M/C 141) Chicago, IL 60607-7140
email: [email protected]
Bridging Gaps ii in Police Crime Data
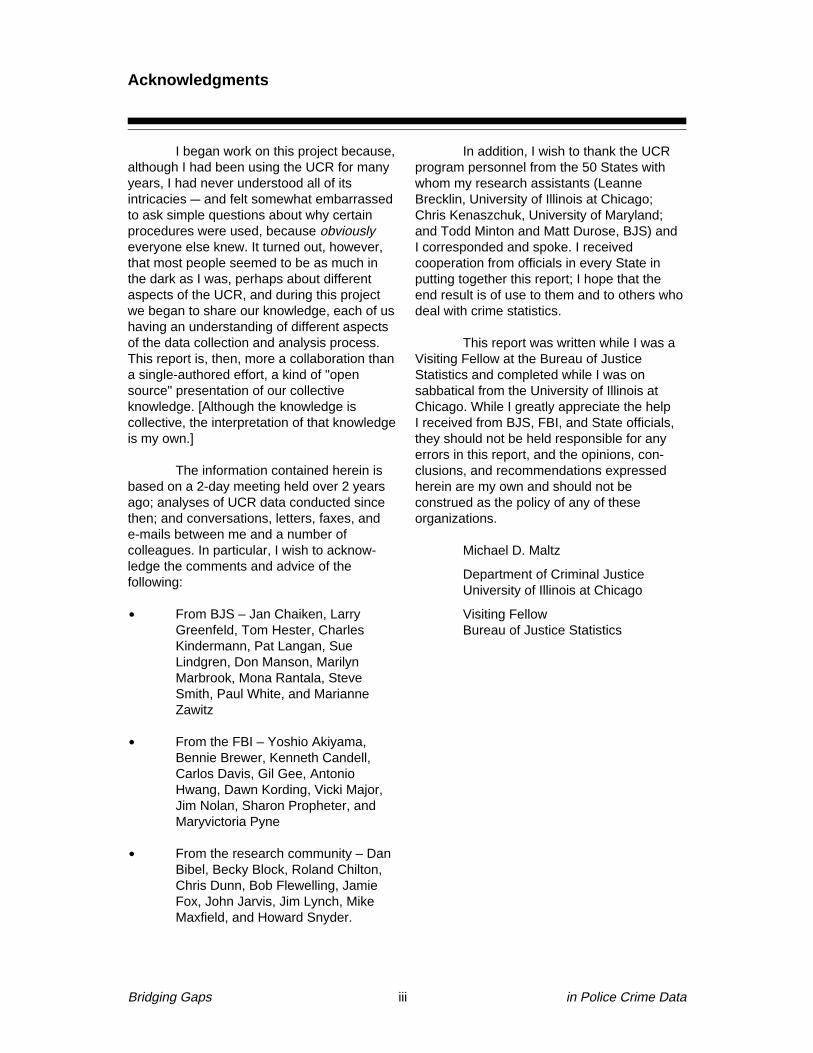
I began work on this project because,although I had been using the UCR for manyyears, I had never understood all of itsintricacies & and felt somewhat embarrassedto ask simple questions about why certainprocedures were used, because obviouslyeveryone else knew. It turned out, however,that most people seemed to be as much inthe dark as I was, perhaps about differentaspects of the UCR, and during this projectwe began to share our knowledge, each of ushaving an understanding of different aspectsof the data collection and analysis process.This report is, then, more a collaboration thana single-authored effort, a kind of "opensource" presentation of our collectiveknowledge. [Although the knowledge iscollective, the interpretation of that knowledgeis my own.]
The information contained herein isbased on a 2-day meeting held over 2 yearsago; analyses of UCR data conducted sincethen; and conversations, letters, faxes, ande-mails between me and a number ofcolleagues. In particular, I wish to acknow-ledge the comments and advice of thefollowing:
ù From BJS – Jan Chaiken, LarryGreenfeld, Tom Hester, CharlesKindermann, Pat Langan, SueLindgren, Don Manson, MarilynMarbrook, Mona Rantala, SteveSmith, Paul White, and MarianneZawitz
ù From the FBI – Yoshio Akiyama,Bennie Brewer, Kenneth Candell,Carlos Davis, Gil Gee, AntonioHwang, Dawn Kording, Vicki Major,Jim Nolan, Sharon Propheter, andMaryvictoria Pyne
ù From the research community – DanBibel, Becky Block, Roland Chilton,Chris Dunn, Bob Flewelling, JamieFox, John Jarvis, Jim Lynch, MikeMaxfield, and Howard Snyder.
In addition, I wish to thank the UCRprogram personnel from the 50 States withwhom my research assistants (LeanneBrecklin, University of Illinois at Chicago;Chris Kenaszchuk, University of Maryland;and Todd Minton and Matt Durose, BJS) and I corresponded and spoke. I receivedcooperation from officials in every State inputting together this report; I hope that theend result is of use to them and to others whodeal with crime statistics.
This report was written while I was aVisiting Fellow at the Bureau of JusticeStatistics and completed while I was onsabbatical from the University of Illinois atChicago. While I greatly appreciate the help I received from BJS, FBI, and State officials,they should not be held responsible for anyerrors in this report, and the opinions, con-clusions, and recommendations expressedherein are my own and should not beconstrued as the policy of any of theseorganizations.
Michael D. Maltz
Department of Criminal JusticeUniversity of Illinois at Chicago
Visiting FellowBureau of Justice Statistics
Acknowledgments
Bridging Gaps iii in Police Crime Data

Crime in the United States (CIUS),published annually by the FBI, is a compilationof the Uniform Crime Reports (UCR) providedby over 18,000 policing jurisdictions. It repre-sents one of the two primary sources of dataabout crime in the United States, the NationalCrime Victimization Survey (NCVS) being theother. While the NCVS is a very reliableindicator of national trends in crime, it isbased on a survey of under 50,000 house-holds and thus cannot provide local informa-tion on crime, which is provided by the UCRand CIUS. [For a thorough understanding of the differences between the two statisticalseries, see Biderman and Lynch's (1991)Understanding Crime Incidence Statistics:Why the UCR Diverges from the NCS. TheNCS, or National Crime Survey, was thepredecessor to the NCVS. A briefer explana-tion can be found in The Nation's Two CrimeMeasures, found at http://www.ojp.usdoj.gov/bjs/abstract/ntmc.htm and includedannually in CIUS.]
Not only does CIUS provide localinformation about crime incidence, it alsocompiles arrest data from these jurisdictions;these data permit us to form a picture of whois committing crime (or at least, who isarrested for committing crime).
The quality of the data provided to theFBI, however, is uneven. Reporting to the FBIremains for many jurisdictions a voluntaryactivity; although many States now mandatethat agencies report crime and arrest data tothem (which they then forward to the FBI),even in those States local agencies do notalways comply. Moreover, despite the effortsof the FBI to maintain their quality, there aremany gaps in the data that make their usequestionable. While this has had limitedimpact in the past, the fact that the UCR datahave, for the first time, been used to allocateFederal funds brings issues about data quality to center stage.
In addition, the FBI is moving toimplement an improved crime and arrestreporting system, the National Incident-BasedReporting System (NIBRS), to augment thesummary UCR data published in CIUS. It ishoped that the study of deficiencies in UCRdata will be of use in planning for the fullimplementation of NIBRS.
This report describes the history ofthe UCR system and the data problems that it deals with in reporting crime, arrest andhomicide. It describes the procedures used by the FBI to fill in gaps in the data when theyexist and makes suggestions about how theymight be improved.
Summary
Bridging Gaps iv in Police Crime Data

I. Introduction . . . . . . . . . . . . . . . . . . . . . . . . 1Why We Need to Look at the UCR . . . . . . 2
The Information-Gathering Process 3Report Organization . . . . . . . . . . . . . . 3
II. UCR History and Coverage . . . . . . . . . . 4State-Level Reporting . . . . . . . . . . . . 4Comparing Crime Data . . . . . . . . . . . 4Coverage Gaps and Imputation . . . . 5The UCR and Funding Decisions . . 7The UCR and Electronic Access . . . 9Use of Sub-National UCR Data . . . 10The UCR and NIBRS . . . . . . . . . . . . 11
III. Incomplete Crime Data . . . . . . . . . . . . 16Error Checking . . . . . . . . . . . . . . . . . 16Reasons for Incomplete Reporting . 16
IV. Incomplete Arrest Data . . . . . . . . . . . . 18
V. Processing and Publishing the Crime Data . . . . . . . . . . . . . . . . . . . . . . 21
Publishing the UCR . . . . . . . . . . . . . 21Archiving the UCR Data File . . . . . . 22
VI. Procedures Used for Imputing Crime Data . . . . . . . . . . . . . . . . . . . . . . . . 23
FBI Imputation Procedures for Crime . . . . . . . . . . . . . . . . . . . . 23NACJD Imputation Procedure . . . . 23Imputation Procedures for Arrests . 24Imputation and "Zero-Population" Agencies . . . . . . . . . . . . . . . . . . . 24Updating UCR Files . . . . . . . . . . . . . 25
VII. Inaccuracies Produced by the Imputation Procedures . . . . . . . . . . . . . . . . . . . . . . . . . 26
Incomplete-Reporting Agencies . . . 26Non-Reporting Agencies . . . . . . . . . 26"Zero-Population" Agencies . . . . . . . 26Summary . . . . . . . . . . . . . . . . . . . . . . 27
VIII. Suggested Imputation Philosophy . . 28Suggested Imputation . . . . . . . . . . 28Zero-Population Agencies . . . . . . . . 29Incomplete and Non-Reporting Agencies . . . . . . . . . . . . . . . . . . . . 29
IX. Supplementary Homicide Reports . . 31Uses of the SHR . . . . . . . . . . . . . . . . 31Incomplete Provision of SHR Data by Police Departments . . . . . . . . . . 33Updating SHR Files . . . . . . . . . . . . . . 34Availability of SHR Data Sets . . . . . . 35SHR Imputation . . . . . . . . . . . . . . . . . . 36Weighting the Victim File . . . . . . . . . . 36Weighting the Offender File . . . . . . . 37Problems with This SHR Imputation Procedure . . . . . . . . . . . . . . . . . . . . 38Suggested Alternative SHR Imputation Procedure . . . . . . . . . . 39
X. Conclusions and Recommendations . 40Reporting Practices . . . . . . . . . . . . . . 40Publishing and Archiving . . . . . . . . . . 40Imputation . . . . . . . . . . . . . . . . . . . . . . 41NIBRS . . . . . . . . . . . . . . . . . . . . . . . . . . 41
Appendix A. Persons Attending the Workshop on UCR Imputation Procedures 43
Appendix B. State On-Line Publication of Crime Data . . . . . . . . . . . . . . . . . . . . . . . 44
Appendix C. Characteristics of State UCR Collection Programs . . . . . . . . . . . . . 45
Appendix D. Extent of UCR Data Coverage, Alabama-Wyoming, 1958-97 . 47
Appendix E. Missing Data in UCR Files Used for the 1996 LLEBG FormulaCalculations . . . . . . . . . . . . . . . . . . . . . . . . 64
Background . . . . . . . . . . . . . . . . . . . . . 64Extent of Missing Data, by State . . . 62Characteristics of Agencies with Less than 36 Months of Violent Crime Data . . . . . . . . . . 64Agencies with 0 Months of Data . . . 64Jurisdictions with between 1 and 35 Months of Data . . . . . . . . . . . . . 65Impact of Incomplete Data . . . . . . . . 65Addendum on "Zeropop" Agencies . 66
References . . . . . . . . . . . . . . . . . . . . . . . . . 70
Glossary . . . . . . . . . . . . . . . . . . . . . . . . . . . . 72
Contents
Bridging Gaps v in Police Crime Data

The Uniform Crime Reporting Pro-gram (UCR)1 of the Federal Bureau ofInvestigation (FBI) has been collecting crimeand arrest data from police departmentsthroughout the United States since 1930. Thedata are published in the annual report, Crimein the United States (CIUS), and representone of the more widely used sources oflongitudinal data in the social sciences. TheUCR is based on monthly summary reports ofcrimes known to the police and arrests madeby the police, that are provided to the FBI byover 17,000 of the more than 18,000 policeagencies in the United States and itsterritories.2
The FBI office that deals with the UCRis the Program Support Section (PSS), asection of the Criminal Justice InformationServices (CJIS) Division. Five of the eightunits within PSS are concerned with variousaspects of CIUS:
ù The Statistical Unit collects, checks,and manages the data coming in fromthe police agencies.
ù The Communications Unit is involved
in publications and datadissemination.
ù The Education and Training Services
Unit trains local agencies in UCR datacollection procedures.
ù The Crime Analysis Research and
Development Unit analyzes data anddevelops specifications for newmethods of presenting the data.
ù The CJIS Audit Unit performs qualityassurance reviews to maintain thequality of the UCR.
The UCR includes a Crime Index, acount of certain specific crimes occurring overthe past year in each jurisdiction. These arecalled “Index crimes,” and, listed in order oftheir presumptive seriousness, are murder
and nonnegligent manslaughter, forcible rape,robbery, aggravated assault, burglary,larceny-theft, and motor vehicle theft.
Arson was added to the Crime Indexin 1979 although it is not as likely as the otherIndex crimes to be reported to the police,because arsons are often categorized as “firesof suspicious origin.” Except for arson, theseparticular crimes were chosen because theywere frequent, generally serious in nature, andmost likely to be reported to the police;victims, their relatives, and/or bystanders whowitness the incident are likely to know thatincidents of those types are criminal in natureand are likely to report them.
Although the UCR has somelimitations (indeed, the aim of this report is toaddress some of them), even these limitationsprovide important information. For example,incomplete citizen reporting to the police ofcertain types of crimes has been used as anindicator of a number of police-related factors:how the relationship between offender andvictim affects citizen reporting of crime; theextent to which citizens trust the police; andthe effect of police policies and problems onreporting behavior. Yet the public is generallyunaware that the UCR system is essentially avoluntary system; there is no federallegislation that requires states or localjurisdictions to report their crime data to theFBI.
The voluntary nature of the UCR, ofcourse, affects the accuracy and complete-ness of the data. Although the FBI devotes agreat deal of attention to the quality of the datait publishes in CIUS, it cannot mandateagencies to provide data on time (or at all). Asa consequence, the FBI must deal withproblems of missing or late data, and hasdeveloped a mechanism to account for thesegaps: it imputes (or estimates) data wheregaps exist, which limits the accuracy of theestimated crime statistics published in CIUS.
I. Introduction
Bridging Gaps 1 in Police Crime Data
2Police agencies also report on other topics to the FBI, including hate crimes, personnelstatistics, and law enforcement officers killed and assaulted. These topics are not covered in this report.
1The first mention of an acronym in this report is printed in bold. Also see Glossary, page 72.

Why We Need to Look at the UCR
Despite these problems with the data,adjustments for missing data have not been ofmajor consequence in the past, since theprimary purpose of the data was to presentnational and State trends & and estimateswere adequate for this purpose. Researchers,police administrators, and some journalistsare aware of the limitations of the UCR, but itmattered little to others outside the field.However, in the recent past four changeswere made in the environment in which theUCR data are being employed:
ù UCR data are being used to allocateFederal funds.
ù The data are now instantly accessibleon the Internet.
ù Because of the greater accessibility of the data, researchers areincreasingly analyzing UCR statisticsat sub-national levels, but the resultsof their analyses may be suspectbecause of the way missing data arehandled.
ù A new reporting system (the NationalIncident-Based Reporting System orNIBRS) now being implemented toaugment the summary UCR data willincrease the amount of data collectedon each crime and arrest.
Thus, the collection, analysis, andpublication of crime data are now occurring ina new environment, due to changes inlegislation, changes in the ease of access bycitizens and researchers to the data, andchanges in crime reporting. This means thatthe FBI’s imputation procedures, which wereadequate for handling many of theweaknesses in the current data collectionsystem, may have to be revised.
Toward this end, a Workshop on UCRImputation Procedures was held inWashington, DC, April 24-25, 1997, andattended by key personnel from the FBI and
the Bureau of Justice Statistics (BJS ), as wellas by researchers familiar with UCR data andtheir problems. The list of attendees is given in Appendix A. Just prior to the workshop theFBI had moved the Program Support Sectionto Clarksburg, West Virginia. The moveresulted in a turnover of personnel andequipment. The workshop thus came at anopportune time for the FBI, which recognizesthe need to update the procedures it has beenusing for over 40 years & when the UCR hadits last major revision (FBI, 1958).
The workshop provided an opportunityfor statisticians and researchers from both ofthese Federal agencies and from the usercommunity to discuss ways of improving UCRdata collection and estimation procedures.The goal of the workshop was to recommendnew ways to ensure that the American publicis provided with the best possible police-collected information related to crime andcriminality, and to move toward that end in themost expeditious and feasible way possible.This report is based on the findings anddiscussions from that workshop.
Issues relating to standard UCR data(i.e., crime counts, arrests) were not the onlytopics addressed at the workshop. Attentionwas also devoted to the SupplementaryHomicide Reports (SHR), forms filled out bypolice departments that provide a moredetailed description of each homicide than justthe raw statistics of number of homicides. Theworkshop explored how these data could bemade more useful, and this report discussesthose findings as well.
Issues related to Federal crime dataare not included in this report. Thus, theaccuracy or completeness of the statistics ofcrimes committed on Indian reservations,military installations, and national parks are forthe most part excluded.
This report also includes informationgathered from State criminal justice agencypersonnel and data analyses subsequent tothe workshop.
Bridging Gaps 2 in Police Crime Data

The voluntary nature of the UCR system means that there is a high degree ofState-to-State variation in UCR reporting.Specifically, some States mandate reportingand require reports to be channeled through (and checked by) State agencies before beingtransmitted to the FBI, while in other Statesindividual jurisdictions report directly to theFBI. Although the FBI institutes quality controlchecks on the data it receives, the lack ofuniform reporting standards and proceduresresults in a lack of uniformity in the UniformCrime Reports.3
The Information-Gathering Process
Some of the material included hereinis based on informal conversations with FBIand BJS personnel and State officials who useor collect the data, and some of theirstatements about the UCR (or myinterpretations of what they meant) may be inerror. Although I have tried to verify allstatements, some errors may have slippedthrough. Should a reader find mistakes in thisreport, please notify me ([email protected] ),and corrections will be added to an erratasheet that will be posted on the BJS website.
It seems that every decade or so Ilook into the intricacies of crime data (Maltz,[1972] 1999; 1984: 141) and find the followingcaution about official statistics from JosiahStamp (1929: 258) applicable:
The individual source of thestatistics may easily be the weakestlink. Harold Cox tells a story of hislife as a young man in India. Hequoted some statistics to a Judge,an Englishman, and a very goodfellow. His friend said, "Cox, whenyou are a bit older, you will notquote Indian statistics with thatassurance. The Government arevery keen on amassing statistics –they collect them, add them, raisethem to the nth power, take the
cube root and prepare wonderfuldiagrams. But what you must neverforget is that every one of thesefigures comes in the first placefrom the chowty dar [villagewatchman], who just puts downwhat he damn pleases."
While strides have been made inimproving the coverage and accuracy ofpolice-reported crime data (in India as well asin this country), there is still need for a greatdeal of improvement. My hope is that thisreport helps to realize this goal.
Report Organization
The organization of this report is asfollows: The next section gives a briefsummary of how the coverage of the UCR hasincreased over the past few decades, both interms of population covered and Statecollection efforts. Section III describes thereasons for incomplete crime data andSection IV problems with arrest data. SectionV documents the steps necessary to verifyand publish CIUS. The imputation proceduresused by the FBI to account for these gaps aredescribed in Section VI, and the problems withthese imputation procedures in Section VII.Some suggested changes in the imputationprocedures are described in Section VIII.Issues related to the SHR data are addressedin Section IX. Conclusions and recommenda-tions are found in Section X.
Five appendixes are included:Appendix A lists the attendees at the BJS/FBIworkshop. Appendix B is a compendium ofcrime-related data available on the Internetfrom State agencies. Appendix C lists some ofthe characteristics of State UCR collectionprograms. The crime reporting history of eachState is charted in Appendix D. Appendix E,written by Sue Lindgren of BJS, describes theprocedures used to account for missing datain calculating the Local Law EnforcementBlock Grant funding for each jurisdiction.
Bridging Gaps 3 in Police Crime Data
3The lack of uniformity is due primarily to variation in completeness of State reporting, not tovariation in what is reported. The PSS Education and Training Services Unit works with individual policeagencies to ensure uniformity in reporting practices.

The International Association ofChiefs of Police (IACP) created the UCR inJanuary 1930. It was created in large part toforestall newspapers from manufacturing“crime waves” out of thin air (IACP, 1929;Maltz, 1977). A national system of crimereporting, it was felt, would put the inevitable(and unpredictable) swings of crime incidencein a single jurisdiction into a proper context,reducing the media pressure put on anyparticular jurisdiction or police chief. Thispressure has led to police departments“cooking the books” and reducing the amountof crime they recorded instead of the amountof crime reported to them.
At the request of the IACP, the FBIassumed stewardship of the UCR in 1930,soon after it started. Police departments thatprovided crime (and other) data sent the datadirectly to the FBI, which compiled the dataand published periodic reports.
[A note on terminology: the FBIidentifies all police and other agencies thatreport crime data with an ORI (for ORIginatingAgency Identifier) number. In this report I usethe terms "ORI," "reporting agency," "policedepartment," and "jurisdiction"interchangeably.]
Initially there was not enoughcoverage of the entire United States to permitestimation of the crime rate for the Nation as awhole. From 1930 through 1957 the FBIpublished the data in tables according to sizeof the reporting jurisdiction and did notaggregate the data to the national level. In1958, based on a review of the UCR by aconsultant committee (FBI, 1958), it was feltthat there was enough coverage to begin toestimate annual crime rates for the Nation asa whole, which the FBI began to do with thepublication of the 1958 report.
State-Level Reporting
In the late 1960’s a few States thathad been compiling their own statistics
arranged with the FBI to act as the datacollection point for all ORIs within the State,and began to send the entire State’s datadirectly to the FBI, in an effort to make theprocess more manageable for the FBI. OtherStates also began to compile their crimestatistics; under the Law EnforcementAssistance Administration (LEAA ), funds weremade available to the States to establishstatewide programs as part of State criminaljustice Statistical Analysis Centers (SACs).The SACs were developed in an effort to buildanalytic capability in States, so that they coulddeal with their crime problems by themselves.The FBI then developed requirements forState UCR collection programs; currently, 44States have met these requirements and sendall of their agencies' data to the FBI.4 Seefigure 1, which shows how the programdeveloped over the past four decades.
Although some of the SACs disap-peared or were scaled down after Federalfunding declined, States have continued tocompile their own crime data. Most States and territories have set up State-level UCRprograms & some under SACs, some underthe State police, and some in other agencies& and now publish annual crime reports, andthe FBI continues to compile and publish thedata for the Nation as a whole. Appendix Bprovides a (partial) listing of the availability of State on-line publication of crime data.
Comparing Crime Data
The annual publication of CIUS is stillan occasion for the media to compare ajurisdiction’s crime rates with those of otherjurisdictions and with its past experience, somedia pressure has not been entirelydispelled. But nowadays reporters and thepublic are more sophisticated and recognizethat the police have only a limited ability toaffect many types of crime. This has eased the pressure on police administrators“ to keepthe crime rate down” by reporting less crimethan had occurred, although the pressure to falsify crime data still persists,
II. UCR History and Coverage
Bridging Gaps 4 in Police Crime Data
4The decrease in the early 1980’s was due to the loss of LEAA funding.

from Philadelphia to New YorkCity to Atlanta to Boca Raton.5
Other problems withthe data are due to inadequatesystems and procedures. Butas local jurisdictions automatetheir crime record systems weshould be able to see improve-ments in crime data accuracy.New software products forpolice records managementinclude provisions for auto-mated reporting of UCR andNIBRS data in the correctformats. And the accuracy ofcrime data seems to havebeen improving. As figure 2shows, the UCR estimates ofviolent crime recorded by thepolice have been drawingcloser to (and following thesame general pattern of)estimates of violent victimi-zations that victims say theyreported to the police (the two middle lines).6
Coverage Gaps andImputation
However, in recentyears more and more of thecrime statistics reported by thepolice have not been based oncrime counts but on imputedcrime counts. Figure 3 showshow the percentage of thepopulation covered by the UCRhas changed over time; as can
Bridging Gaps 5 in Police Crime Data
6The victimization data are from the National Crime Victimization Survey (NCVS), which beganin 1972. In it a random sample of U.S. households is chosen, and household members age 12 and overare asked about their victimization experiences. The crime data are from CIUS, modified to be madecomparable to the victimization data; that is, for robbery it means that all commercial robberies areexcluded, as are rapes, robberies and aggravated assaults whose victims were under 12 years old. Thatthe two sources of data are now converging means that the crimes that citizens say they have reportedto the police are being recorded more completely by the police in their statistics. For a more completedescription of the characteristics of the two crime measures, see The Nation’s Two Crime Measures(BJS/FBI, 1995, htt p://www.o jp .usdo j.gov/b js/pub/pdf/ntmc. pdf and in recent issues of CIUS).
5See The Philadelphia Inquirer, November 1, 1998, “How To Cut City's Crime Rate: Don'tReport It;” The New York Times, August 3, 1998, “As Crime Falls, Pressure Rises To Alter Data;” The Atlanta Journal-Constitution, May 21, 1998, “Manipulation of Crime Figures Alleged;” and The Miami Herald, May 3, 1998, “Sugarcoating? Officer Faked Boca Crime Stats.”
1970 19950
10
20
30
40
50
Number of States submittingdata directly to the FBI
1975 1980 1985 1990
Figure 1. Number of States Submitting UCR Data Directly to the FBISource: CIUS, 1969-97, and States responding by letter, e-mail, andtelephone
Figure 2. Four Measures of Serious Violent CrimeSource: http://www.ojp.usdoj.gov/bjs/glance/cv2.htm

be seen, a long period ofimprovement in coverage hasbeen followed in recent yearsby a reduction in coverage.This rather considerabledecline in population coveragein the 1990’s is due in part toproblems at the State level, inconverting their crime reportingsystems to comply with NIBRSrequirements. As problemsare dealt with, the coverageshould return to above 95%.
The missing coverageis not uniform over space andtime. Most jurisdictions providelargely accurate crime reportsevery month while others donot, for reasons described laterin the report. Since 1969 moreand more States have passedlegislation mandating the submission of crimedata by local jurisdictions to state agencies,but very few incur penalties if they do notcomply with such requirements. See AppendixC for a listing of the characteristics of StateUCR reporting procedures.
Appendix D (page 47) shows theextent to which the 50 States have providedcrime reports to the UCR since 1958, the yearthat national and State crime rates were firstpublished. As can be seen from the patterns,some States have historically been able toprovide close to 100 percent UCR coverage(and therefore low imputation rates). Thisresponse is true of about 20 States.
The infusion of LEAA funding in the1970’s apparently permitted an additional 12States to improve their UCR reportingsystems. All experienced a reduction in thepercent of crime imputed in the 1970’s andcontinue to have low percentages of imputedcrime. Some States, however, haveexperienced substantial problems in UCRreporting:
ù Complete data for Illinois, forexample, have not been included inthe UCR since 1985, initially becausethe Illinois statutory definition ofsexual assault is inconsistent with theUCR definition of rape,7 and since1992 because the Illinois UCRsubmissions did not adhere to theUCR’s “hierarchy rule” (see page 14).
ù A number of States have hadproblems in implementing NIBRS,reflected in recent major increases inthe percentage of imputed UCR dataor in the complete absence of data.
ù In still other States, there has been arecent gradual growth in the percentimputed, reflecting a gradualwithdrawal of local jurisdictions fromthe UCR reporting program.
These reporting omissions (i.e., datathat are missing or are reported too late tomeet the publication deadline of CIUS) havegenerally been considered to be of littleconsequence, because most do not account
Bridging Gaps 6 in Police Crime Data
7“Until 1984, ‘rape’ was defined as the carnal knowledge of a female, forcibly and against herwill. On July 1, 1984, Illinois’ sexual assault laws became gender neutral and the old concept of rapewas broadened to include many types of sexual assault. This index crime now includes all sexualassaults, completed and attempted, aggravated and non-aggravated.” (Illinois Criminal JusticeInformation Authority, 1987, p. 5.)
1955 1960 1965 1970 1975 1980 1985 1990 19950%
20%
40%
60%
80%
100%
Percent of U.S. populationcovered by the UCR
Figure 3. Percent of the U.S. Population Covered by the UCR
Source: CIUS, 1953-97

for a significant percentage of overall crime &as can be seen in figure 3, despite thereporting gaps depicted in Appendix D, theUCR still represents 87 percent of the U.S.population. Moreover, the FBI has developedprocedures to accommodate such omissions.These procedures in essence “fill in the gaps”by imputing data when the data are eithermissing or not furnished to the FBI until afterits publication deadline. Such imputationspermit the FBI to make national, regional, andState estimates of crime data despite themissing data, and thus keep the annualpublication of CIUS on schedule with relativelycomparable data from year to year.
But researchers have been usingcounty-level data to study crime characteris-tics, without realizing that some counties'crime statistics are based on a substantialamount of imputed data.8 The county-leveldata set is compiled from the raw jurisdictionaldata provided by the FBI to the NationalArchive of Criminal Justice Data (NACJD),which uses its own county-level imputationprocedures (described in Section IV.).
NACJD is maintained by theUniversity of Michigan’s Inter-universityConsortium for Political and Social Research(ICPSR). Funded by BJS, NACJD obtains theFBI's archived raw crime and arrest data setsto archive them on their own website in a formsuitable for research use. NACJD has agency-level data files from 1966-96 and data filesaggregated at the county level for 1977through 1996. Imputation procedures used byNACJD in aggregating data to the county levelare described in Section IV.
As mentioned earlier, in some casesthe data for a whole State have beenproblematic. In particular, over the pastdecade some or all of the data from Delaware(1995), Florida (1988, 1996), Illinois(1985-97), Iowa (1991), Kansas (1993-97)Kentucky (1988, 1996-97), Michigan (1993),Minnesota (1993), Montana (1994-97), NewHampshire (1997), Pennsylvania (1995), and
Vermont (1997) have not been included by theFBI for tabulation in CIUS, as seen in figure 4on page 8. In other words, to develop nationalestimates of crime, data for States have beenimputed in whole or in part. Imputation to suchan extent may no longer be appropriate ordesirable, especially now that UCR crime dataare legislatively required to be used informulas for allocating certain Federal funds.
The UCR and Funding Decisions
In 1994, in reauthorizing the OmnibusCrime Control and Safe Streets Act of 1968,the U.S. Congress appropriated additionalanticrime funding for jurisdictions under theLocal Law Enforcement Block Grant Program.The amount of funds received by a jurisdictionwas to be based on the number of violentcrimes they had experienced in the 3 mostrecent years (1992-94). According to thestatute, the UCR was to be the source of thecrime data.
This marked the first time that fundingdecisions were to be made on the basis of thedata in the UCR, and caused a number ofother agencies within the US Department ofJustice (DOJ) to deal directly with the short-comings of this data set. The Bureau ofJustice Assistance (BJA ) was charged withthe task of allocating the funds; BJA called onBJS, with its statistical expertise and know-ledge of the UCR's characteristics, to developthe allocation formula according to the law’sprovisions. [Appendix E gives the backgroundfor the development of this formula.]
BJS used the actual raw crime dataas reported by each police agency to the FBI,rather than the imputed data, in the allocationformula. But in reviewing the raw UCR data,BJS immediately recognized their limitations:Of the 18,413 police agencies that reported tothe FBI in 1992-94, 3,516 (19%) did notprovide crime data for any month during the
Bridging Gaps 7 in Police Crime Data
8Neither estimated city nor county data are disseminated outside the FBI. They are used solelyto arrive at State and national estimates.

Bridging Gaps 8 in Police Crime Data
Correction: Alaska is shown to be reporting UCR datasince 1970. The State contact for Alaska is KathleenMather, 907-269-5701.
Figure 4. State-Level Reporting of UCR Data to the FBI
Sources: CIUS, 1969-96, and responses from State officials by letter, email, and telephone.
*These 3 States ceased submitting State-level data in the 1980’s.
States that had problems with some or all of the submitted data
States reporting UCR data to the FBI
1970 1975 1980 1985 1990 1995 Wisconsin
VermontRhode IslandPennsylvania
New JerseyNebraskaMontana
CaliforniaAlaska
MinnesotaKentucky
FloridaWest Virginia
DelawareNorth Carolina
Michigan South Carolina Oregon Oklahoma New Mexico* Nevada Maine
IllinoisIdaho
ArkansasVirginia
Tennessee*New YorkMarylandLouisiana
KansasIowa
HawaiiGeorgiaArizona
TexasOhio*
ColoradoAlabamaWyoming
New Hampshire Massachusetts
ConnecticutNorth Dakota
WashingtonDistrict of Columbia
South DakotaUtah
MissouriMississippi
Indiana

36-month period used in the formula andanother 3,197 (17%) reported between 1 and35 months (table 1). Although most gaps inthe data were found to be relativelyinconsequential, this was not true across theboard. Of the 3,516 non-reporting agencies,all but 866 either were within jurisdictions thathad other agencies report for them or wereState agencies or special police agencies(such as transit police, fish-and-game police,or park police) that probably were noteligible for a formula award.9
However, the remaining 866 agenciesthat provided no crime data for the 36-monthperiod included some major jurisdictions: theprimary police agencies in 3 cities andcounties with populations over 100,000; 17cities with populations between 50,000 and100,000; and almost 200 cities withpopulations over 10,000. Note that fully 5percent of the regular police agenciesprovided no reports for 3 full years. Asubsequent analysis found that 15 percent ofthe regular agencies did not provide any datafor 1992, and reporting behavior worsened insucceeding years (reanalysis by S. Lindgren,May 27, 1999).
In less populous States, even citieswith populations of 10,000 received awards.Thus, the lack of complete reporting hadfinancial consequences for a significantnumber of jurisdictions. The legislation doesmake provision for determining funding if UCRdata are not available, but it may also serve as
a spur for ORIs to improve their reportingpractices.
The UCR and Electronic Access
Another recent change in the crimedata environment is the greater degree ofpublic access to crime data. They have alwaysbeen available to the public on paper, in theannual CIUS publications. For the most part,analyzing the data in the past usually meantentering data from the paper version of CIUSinto one’s own computer.10 As discussedearlier, for many years they have been madeavailable (primarily to researchers) inelectronic form (e.g., magnetic tape), but theyare now also accessible to the general publicfrom various websites.
The FBI, BJS, and NACJD now haveregularly updated websites that provideaccess to UCR data, so it can be anticipatedthat more people will be encountering theinconsistencies in the data. Each site containscrime data, but in different forms and formats:
ù The FBI site is http://www.fbi.gov ;it contains the UCR data as publishedin CIUS, beginning in 1995.
ù The BJS site is http://www.ojp.usdoj/bjs In the section Crime andJustice Electronic Data Abstracts(CJEDA ), it provides UCR crime databy State from 1960 to 1997, UCRcrime and arrest data for the 90largest counties for 1990-96, and1985-97 homicide data for cities withpopulations over 100,000.
ù The NACJD site is http://www.icpsr.umich.edu/nacjd/ucr.html ; itcontains downloadable arrest andoffense data at the agency level from1966 to 1996 and at the county levelfrom 1977 to 1996.
Bridging Gaps 9 in Police Crime Data
5866Regular agency142,650Special agency 193,516No reports173,197Partial reporting (1-35 months)64%11,700Full reporting (36 months)
100%18, 413TotalPercent Number Reporting frequency
Police agencies
Table 1. Reporting Behavior of 18,413 PoliceAgencies, 1992-94
10When I started as a Visiting Fellow at BJS in early 1995, BJS statisticians were still doing this on a regular basis.
9But by not reporting crimes that occurred within the jurisdiction, they may have affected the statistics of agencies that were eligible for an award, and thus the crime figures reported to the FBI for that jurisdiction may be lower than had actually occurred. In some States an agencyreporting as few as five violent crimes in the 3-year period qualified for a grant of over $10,000.

The State estimates provided by theFBI (and found on the BJS website) are basedon the FBI’s imputation and estimation proce-dures and are not directly comparable toNACJD's county-level data. Now that anyperson in the world with a computer andmodem can download the data and docomparisons, it would be helpful to resolve thedata inconsistencies as much as possible andto provide explanations for the inconsistencieswhen resolution is not possible.11
Use of Sub-National UCR Data
The ready availability of UCR data at the subnational level has resulted inresearchers using these data to answer policyquestions. Unfortunately, the data may not beup to the task. To understand why this is so, abrief account of the history of their collection,aggregation, and initial uses would bebeneficial.
Prior to 1958, UCR data werecollected from individual jurisdictions andaggregated to give, for each crime type in thecrime index: urban and rural crime rates andyear-to-year changes; crime counts by size ofcity (for reporting cities) and year-to-yearchanges; crime counts by State for reportingcities in each State, and year-to-yearchanges; and crime counts in citiesby size of city, and year-to-yearchanges. State-level data were based on only those cities thatreported to the FBI, and State-levelcrime rates were calculated bydividing the crime counts for thesecities by their aggregate population.
State-level data . Despite the known deficiencies in the data,the UCR State-level homicide data for the years 1930, 1940, 1950, 1960, and 1970 were used by Ehrlich (1975) to estimate that everyexecution deters eight homicides, a
finding that the U.S. Supreme Court cited(Maltz, 1996, p. 36). Critics pointed out someof the analytic problems, but it was assumedthat State-level homicide data would be moreaccurate than data concerning other crimes.
However, the State-level homiciderates for 1930, 1940, and 1950 were doubt-less based on jurisdictions covering less than70 percent of the Nation. (See figure 3.) Thevariation in coverage from State to State wasprobably considerable. Although I have notexamined the data from this era, it seemslikely that much of the reporting was fromurban agencies. Thus, a State that was 75percent rural and 25 percent urban, but inwhich the urban agencies were much morediligent than rural agencies in reporting UCRdata, would have its homicide rate basedprimarily on the homicide experience of itsurban areas rather than on the experience ofthe State as a whole.
County-level data . In 1983 BJSpublished Report to the Nation on Crime andJustice (Zawitz, 1983), a snapshot of the stateof crime and justice at that time. It featured achoropleth map of the county-by-countyviolent crime rate in the United States in 1980(figure 5).12 To produce this map, BJS
Bridging Gaps 10 in Police Crime Data
12A choropleth map of crime displays levels of crime with different shadings or colors.
11Many of the downloadable data sets currently contain explanations for some inconsistencies(see, for example, the data set at http://www.ojp.usdoj.gov/bjs/dtdata.htm#crime ), but theexplanations are not complete.
Figure 5. County-Level UCR Violent Crime Rates, 1980
Source: Zawitz, 1983

tasked NACJD with estimating the crime rateof each county. This was done by aggregatingthe crime count for all the jurisdictions in thecounty and dividing by the aggregatedpopulation for those jurisdictions.
Some counties reported no data; theyare represented in white in the figure. ORIsthat did not report at least 6 months of data tothe FBI were also excluded; those that didreport 6 months or more, but provided lessthan 12 months, had their data imputed. Theimputation procedure simply multiplied theviolent crime rate by 12/N, where N was thenumber of months reported. This implicitlyassumes that the crime rate for non-reportingmonths is the same as for the reportingmonths.
Moreover, if some agencies in acounty did not report, or reported less than 6months of data, their data and their populationwere excluded from the crime rate calcula-tions. This implicitly assumes that the crimerate for nonreporting ORIs is the same as forthe reporting ORIs in the county, which isprobably a stretch.
It should be noted that the imputationprocedure was developed as an ad hocprocedure to make the 1980 data reasonablycomparable from county to county soas to provide a snapshot, and not as a final means of dealing with missingdata.
However, this report wasreceived so favorably that BJS decidedto update it. In 1988 it released thesecond edition of Report to the Nationon Crime and Justice (Zawitz, 1988a),based on UCR data from 1984. (Seefigure 6.) NACJD used the sameimputation procedure to fill in themissing data.13
Because of favorable receptionof the reports and the data on whichthey were based, BJS decided to make
county-level data sets routinely availablethrough NACJD. The deficiencies or conse-quences of using the ad hoc imputationprocedure were not considered, because up to that time the county-level data had onlybeen used for cross-sectional comparisonsand not for more rigorous analytic purposes.
Since then, however, these data havebeen used for other purposes. For example, arecent study used the data to conclude thatright-to-carry laws reduce crime (Lott, 1998).This finding was contested on methodologicalgrounds (Black and Nagin, 1998), but not fromthe standpoint of the data quality. It turns outthat smaller counties are more likely than thelarger counties to have a significant fraction of their data imputed (C. Dunn, at the 1997workshop); the fact that smaller counties aremore rural may have a decided effect on thisanalysis.
One data documentation feature that NACJD now uses (until an improvedimputation procedure is implemented) is a“coverage factor” in the county-level data set.This feature (described in Section VI) at leastwarns the analyst that the data are limited in coverage.
Bridging Gaps 11 in Police Crime Data
13The procedure is described in Zawitz (1988b), p. 8.
Figure 6. County-Level UCR Violent Crime Rates, 1984
Source: Zawitz, 1988a

The UCR and NIBRS
A fourth change in the crime datapicture concerns the way crime data are to bereported to the FBI. Over 10 years ago a studycommissioned by the FBI and BJS provided a“blueprint” for changing the way crime datawere to be reported to the FBI (Poggio et al.,1985). The recommended changes have beenadapted and incorporated in a set of newprocedures that comprise NIBRS; NIBRS hasalready been implemented in a number ofstates and is expanding to cover the entireUnited States.
The change in data collection isconsiderable. Under the UCR program anagency provides a monthly summary report of crime, called Return A (figure 7); each lineof the report refers to a single type of crime; it contains a count of the number of crimes of that type that had occurred in that month.Under NIBRS each incident is to be reportedin detail, with a number of records devoted todescribing the characteristics of each crime.For a single incident, information is recordedfor each included offense (type, weapons,location, motivation method of entry, etc.);victim, offender, and arrestee; type ofproperty; and so on. See figure 8 (fromAkiyama and Nolan, 1999a). NIBRS willprovide a great deal of detail about the natureof criminal activity: for example, one will beable to determine to what extent aggravatedassaults were committed by family membersor strangers, or what fraction of burglariesoccurred in apartments or in private homes, bytime of day, and in other ways. This will giveboth the police and the public with detailedinformation on the risk of crime to enable themto develop more useful policies and tactics.
Bridging Gaps 12 in Police Crime Data

Bridging Gaps 13 in Police Crime Data
Figure 7. Replica of the FBI’s UCR Return A
GRAND TOTAL
c. Other Vehicles
b. Trucks and Buses
a. Autos
7. MOTOR VEHICLE THEFT TOTAL
(Except Motor Vehicle Theft)
6. LARCENY-THEFT TOTAL
c. Attempted Forcible Entry
b. Unlawful Entry - No Force
a. Forcible Entry
5. BURGLARY TOTAL
a. Other Assaults s Simple. Not Aggravated
d. Hands, Fists, Feet, Etc. - Aggravated injury
c. Other Dangerous Weapon
b. Knife or Cutting Instrument
a. Firearm
4. ASSAULT TOTAL
d. Strong-Arm (Hands, Fists, Feet, Etc.)
c. Other Dangerous Weapon
p. Knife or Cutting Instrument
a. Firearm
3. ROBBERY TOTAL
b. Attempts to commit Forcible Rape
a. Rape by Force
2. FORCIBLE RAPE TOTAL
b. MANSLAUGHTER BY NEGLIGENCE
1. CRIMINAL HOMICIDEa. MURDER AND NONNEGLIGENT HOMICIDE (score attempts as aggravated assault) If homicide reported, submit Supplementary Homicide Report
6NUMBER OF CLEARANCES
INVOLVING ONLYPERSONS UNDER 18
YEARS OF AGE
5 TOTAL OFFENSES
CLEARED BY ARREST OREXCEPTIONAL MEANS
(INCLUDES COL. 6)
4 NUMBER OF ACTUAL
OFFENSES (COLUMN 2 MINUS COLUMN 3)
(INCLUDE ATTEMPTS)
3 UNFOUNDED, I.E.,
FALSE OR BASELESSCOMPLAINTS
2 OFFENSES REPORTED OR
KNOWN TO POLICE(INCLUDE "UNFOUNDED"
AND ATTEMPTS)
1 CLASSIFICATION OF OFFENSES
D065(Rev. 7-28-87)
Form ApprovedOMB No. 1110-0001
5(7851 $ 0 0217+/< 5(7851 2) 2))(16(6 .12:1 72 7+( 32/,&(This report is authorized by law Title 28, Section 534, U. S. Code. While you are not required to respond, your cooperation in forwarding this report by seventh day after the close of the month to Uniform Crime Reports, Federal Bureau of Investigation, Washington, D. C. 20535, will assist in compiling comprehensive, accurate national crime figures on a timely basis.
CHECKING ANY OF THE APPROPRIATE BLOCKS BELOW WILL ELIMINATE YOUR NEED TO SUBMIT REPORTS WHEN THE VALUES ARE ZERO. THIS WILL ALSO AID THE NATIONAL PROGRAM IN ITS QUALITY CONTROL EFFORTS.
NO SUPPLEMENTARY HOMICIDE REPORT SUBMITTED SINCE NOMURDERS, JUSTIFIABLE HOMICIDES, OR MANSLAUGHTERS BYNEGLIGENCE OCCURRED IN THIS JURISDICTION DURING THEMONTH.
NO SUPPLEMENT TO RETURN A REPORT SINCE NO CRIMEOFFENSES OR RECOVERY OF PROPERTY REPORTED DURINGTHE MONTH.
NO LAW ENFORCEMENT OFFICERS KILLED OR ASSAULTED REPORT SINCE NONE OF THE OFFICERS WERE ASSAULTED OR KILLED DURING THE MONTH.
.NO AGE, SEX, AND RACE OF PERSON. ARRESTEDUNDER I8 YEARS OF AGE REPORT SINCE NO ARRESTS OFPERSONS WITHIN THIS AGE GROUP.
NO AGE, SEX, AND RACE OF PERSONS ARRESTED18 YEARS OF AGE AND OVER REPORT SINCE NO ARRESTSOF PERSONS WITHIN THIS AGE GROUP.
NO MONTHLY RETURN OF ARSON OFFENSES KNOWN TO LAWENFORCEMENT REPORT SINCE NO ARSONS OCCURRED.
*
*
*
*
*
*
CORES
ADJUSTED
ENTERED
EDITED
RECORDED
INITIALS
DO NOT USE THIS SPACE
__________________________________________________ _________________________________________________________ ______________________________________________________ Month and Year of Report Agency Identifier Population
______________________________________________________ Date
_________________________________________________________________________________Prepared By Title
__________________________________________________ ___________________________________________________________________________ Agency and State Chief, Commissioner, Sheriff, or Superintendent

One of the problems with current UCRreporting that should be ameliorated by NIBRSis caused by a characteristic of the UCRsystem known as the hierarchy rule. Thehierarchy rule for reporting crimes wasinstituted by the FBI in the 1930’s, to ensurethat there would be no double-counting ofcrimes. A criminal event that includes twodifferent crime categories is thus counted onlyonce, and only in the most serious crimecategory. For example, if a convenience storerobbery results in the death of the store clerk,this would be classified as a homicide ratherthan a robbery & because homicide is a moreserious crime than robbery. Yet this expedient,important in the pre-computer age, masks thenature of what happened. It would certainly bebetter to recognize both characteristics of theincident, if only to be able to provide anestimate of risk, in the form of the fraction ofincidents that start out as robberies but resultin homicide (see, e.g., Maltz, 1976b).
Even with NIBRS implemented,summary data will doubtless be aggregatedand compiled for each agency, and data forsome agencies may continue to be missing,delinquent, or in error. In other words, therewill still be a need for imputation proceduresafter NIBRS is implemented nationwide. Infact, missing data may become a greaterproblem under NIBRS, because of the hugeincrease in categories and the complexity ofdefinitions. This may make it more difficult toassume that the counting rules and definitionsare being applied uniformly.
Bridging Gaps 14 in Police Crime Data

Bridging Gaps 15 in Police Crime Data
òôôôôôôôôôôôôôôô� 52 Disposition of Arrestee < 18îôôôôôôôôôôôôôôô� 51 Arrestee Resident Statusîôôôôôôôôôôôôôôô� 50 Arrestee Ethnicityîôôôôôôôôôôôôôôô� 49 Arrestee Race
ARRESTEE îôôôôôôôôôôôôôôô� 48 Arrestee Sex òôôôôôF 40 ôôôôôôôôôôôôôôôôôôôôôôôôêôôôôôôôôôôôôôôô� 47 Arrestee Ageó Arrestee Seq # îôôôôôôôôôôôôôôôF 46 Arrestee Was Armed withó îôôôôôôôôôôôôôôô� 45 UCR Arrest Offense Codeó îôôôôôôôôôôôôôôô� 44 Multi Arrest Segments Indicatoró îôôôôôôôôôôôôôôô� 43 Type of Arrestó OFFENDER òô�39 Off Race îôôôôôôôôôôôôôôô� 42 Arrest DateîôôôôF 36 ôôôôôôôôêô�38 Off Sex ïôôôôôôôôôôôôôôô� 41 Arrest Transaction Numberó ïô�37 Off Ageóóó òôôôôôôôôF 34 Offender Number(s) to Be Related ôôôô�35 Relationship(s)ó ó of Victim to Offender(s)ó îôôôôôôôôF 33 Type Injuryó îôôôôôôôô� 32 Additional Justifiable Homicide Circumstancesó îôôôôôôôôF 31 Aggravated Assault/Homicide Circumstancesó VICTIM îôôôôôôôô� 30 Victim Residence StatusîôôF 23 ôôôôôôôôôôêôôôôôôôô� 29 Victim Ethnicityó îôôôôôôôô� 28 Victim Raceó îôôôôôôôô� 27 Victim Sexó îôôôôôôôô� 26 Victim Ageó îôôôôôôôô� 25 Type of Victim
ORI # ó ïôôôôôôôôF 24 Victim Connected to UCR Offense Code(s)1 ôF 2 ôôôôôì Incident #ó òôôôôôôôôF 20 Suspected Drug Type ôôôôôôô� 21 Estimated Drug Quantity
ó ó ïôôôô�22 Type of Drug Measureó PROPERTY îôôôôôôôô� 19 Number of Recovered Motor VehiclesîôôôôôF 14 ôôôôôôôîôôôôôôôô� 18 Number of Stolen Motor VehiclesóType Property óó Loss/Etc. ó òôôôôôôô� 17 Date Recoveredó ïôôôôôôôôF 15 Property Description ôôôôìó ïôôôôôôô� 16 Value of Propertyóóó òôôôôôôôôôôôôF 13 Type Weapon/Force Involvedó îôôôôôôôôôôôôF 12 Type Criminal Activityó OFFENSE îôôôôôôôôôôôô� 11 Method of EntryîôôôôF 6 ôôôôôôôôôôôôôôôôôîôôôôôôôôôôôô� 10 Number of Premises Enteredó UCR Offense Code îôôôôôôôôôôôô� 9 Location Typeó îôôôôôôôôôôôô� 8A Bias Motivationó îôôôôôôôôôôôôF 8 Offender(s) Suspected of Usingó ïôôôôôôôôôôôô� 7 Offense Attempted/Completedóóóó ADMINISTRATIVE òôôôô� 4 Cleared Exceptionally ôôôôô�5 Exceptional Clearance Dateïôôôôôôôôôôôôôôôôôôôôôôôôôì
ïôôôôôôôôôôôôôôôô� 3 Incident Date/Hour
Figure 8. The Structure of NIBRS Data Elements
Source: Akiyama and Nolan, 1999a

Two separate streams of crime dataare sent to the FBI’s Uniform Crime ReportingSection: one from individual police agencies,the other from State UCR collection programs.Although 36 States now have statutesmandating the reporting of crime and othercriminal justice information, not all policedepartments submit this information to theirState agency designated to collect the data, orthey may submit it too late for entry in CIUS.
Occasionally some of the data mayappear to be in error & too high or too low,based on the jurisdiction’s past crimeexperience. This section describes theprocedures used by the FBI to correct errorsin reporting and, when reporting gaps occur,to impute data as necessary. It also discusseswhen and how UCR data files are updated.
Error Checking
Potential errors in the data arechecked in different ways, depending on howthe UCR reports were sent to the FBI anddepending on the size of the jurisdiction. If thedata are first collected by the State agency,that agency itself may undertake follow-upprocedures to verify the data. When the errorsare glaring, they can be found by simplyinspecting the data or by using simplegraphical techniques. One State agency refersto such errors as “tent poles” and “craters” —excessively high or low figures compared tothe surrounding data (R. Christ, personalcommunication). Such errors often come fromtransposing numbers in returns submittedmanually. Small errors, however, will probablynot be caught in this manner.
If the State does not have auditingprocedures, or if the data are sent directly tothe FBI, staff members in the FBI’s UCRSection may note the omission or anomalyand request the State agency to follow up. Incases in which the data are sent directly to theFBI, the FBI may follow up with the policeagency by mail. If, however, the agency has apopulation of over 100,000, personnel fromthe UCR Section call the agency directly toverify the data (D. Kording, at the 1997workshop).
When errors are found in the data,they are corrected, and the corrected countsare included in the statistics. Depending onwhen the errors were discovered andcorrected, they may not be incorporated inCIUS (if the corrections occur after the FBI'spublication deadline), but they may beincluded in the public-use data set archived atNACJD (J. Lynch, at the 1997 workshop). Thismeans that someone trying to determine theextent of crime in a jurisdiction will encounterunexplained differences between CIUSstatistics and the data archived by NACJD.
Reasons for Incomplete Reporting
Aside from these errors in reporting,police agencies may not provide complete (orany) reports to the FBI. The agencies may bedelinquent or incomplete in their reporting ofcrime for a number of reasons:
ù Some agencies experienced naturaldisasters that prevented them fromgetting their data in on time (or insome instances, at all).
ù As has been the case with otherpublic agencies, budgetary restrictionson the police have meant that someagencies have had to cut back onservices. Although crime reporting isconsidered an essential functionbecause it provides information aboutcommunity safety to the public, someagencies that are especially strappedmay forgo these routine clericalactivities so as to ensure that suffi-cient resources exist for patrolling thestreets.
ù Retirements, promotions, and otherpersonnel changes may mean that theperson experienced in the preparationof UCR crime and arrest data isreplaced by someone — — who has little experience in itspreparation (and consequently makesnumerous errors) — who is not given sufficient training — who gives the task a low priority — or who doesn’t prepare the data in a timely manner.
Bridging Gaps in 16 Police Crime Data
III. Incomplete Crime Data

ù With respect to training, somejurisdictions may rely completely on handbooks on UCR reportingproduced by the Program SupportSection, and there may be ambiguitiesin the reports that require morecomplete descriptions than areincluded in the handbooks.
ù Phasing in a new reporting system orcomputerization of the old systemmay cause delays or gaps in thecrime reporting process. This may beespecially true as agencies convert toNIBRS. (See Appendix C.)
ù Small agencies with little crime toreport may feel it unnecessary to fillout reports that are filled almostentirely with zeros. [In fact, in somecases small agencies file reports foronly 1 month; they want to ensure thattheir agencies’ employee statistics areincluded in CIUS, and reporting theirdata for 1 month will accomplish this.]
y A State may have offense definitionsthat are incompatible with UCRdefinitions, leading to data beingsubmitted but not accepted.
Thus, there are a number of reasonsthat crime reports may be incomplete, late, orin error. The extent to which this is a problemin an individual State can be seen in AppendixD (page 47), which shows the UCR reportingbehavior of each State over the past 40 years.Note that the impact of LEAA funding of Statestatistical systems in the 1970’s is apparent inthese graphs, as is (in some States) theimpact of its termination.
Note also that while some States havea history of consistently good reporting, otherStates have a history of consistently poorreporting, and yet others have exhibited highlyerratic reporting behavior. In particular:
ù The data for six States were excludedfrom the 1997 UCR, with the datafrom one of those States not havingbeen included since 1993.
ù Six States have consistently poorreporting, missing reports on thecrime experienced by more than 20% of their population.
Some of the recent erratic reportingby States is attributable to their conversion toNIBRS. In particular, some States andagencies that have begun the NIBRSconversion process are working with softwarethat currently does not have the ability toproduce UCR reports. Over the long term wecan expect that many of these reportingproblems will disappear or at least diminish.Many smaller agencies that are currentlyautomating are purchasing computersoftware that provides near-automaticreporting (including audit checks) of thesedata. However, in the near term we canexpect these problems to continue, forstandards for such software do not currentlyexist. (See Appendix C.)
Bridging Gaps in 17 Police Crime Data

As with offense data, there are majorgaps in arrest data. To some extent theproblems with arrest data are greater becauseof three factors:
ù The percent of arrests reported bypolice is substantially lower than thepercentage of crimes reported.
ù By publishing the characteristics of arrestees, there is an implicitassumption that they alsocharacterize those who commit similar crimes but are not arrested.
ù Whereas crimes reported to the policeare generally considered to be (andhave been shown to be) similar tocrimes not reported to the police,arrests reported by the police are asmuch a reflection of police prioritiesas they are of criminal activity.
Agencies are less diligent in reportingarrest data than crime data. The FBI attemptsto ensure completeness of arrest data byrejecting an agency’s adult arrest data if itdoes not also send in juvenile arrest data, noris arrestee race information accepted withoutage and sex information (V. Major, at the 1997workshop). This means, however, thatinformation on arrests is considerably lesscomplete than information on crimes.
Moreover, the arrest data published inCIUS are biased even in comparison to thearrest data eventually reported to the FBI.14
For example, Snyder compared the 1980CIUS arrest data with the final counts ofarrests, after all of the late-reporting ORIssubmitted their data (H. Snyder, personalcommunication, 1999). He found that juvenilearrests (as a percentage of all arrests) wereoverrepresented in the published statistics. Heattributed this to the fact that large urbanagencies, with higher percentages of juvenilearrestees, generally reported early (in time forpublication) and the late reporters tended tobe less urban agencies, with lower percent-ages of juvenile arrestees. So, not only are the
arrest data published in CIUS not arepresentative sample of all arrests, they arenot a representative sample of arrest dataeventually reported to the FBI.
Figure 9 shows how 1997 arrestreporting varies by State. As can be seen, 4States and Washington, DC, did not provideacceptable arrest data, and more than half ofthe population was not represented in anadditional 12 States.
Figure 10 shows the extent nationallyto which arrest data have been reported to theFBI for the past four decades. The percent-ages are consistently lower than those forcrime data (cover figure), but their time trendshows the same declining pattern. As with thedecline in crime reporting, it is probablyattributable for the most part to the difficultiesin shifting to NIBRS.
Note that compared to the reporting ofcrime data, there is a greater degree of annualvariation in the reporting of arrest data.Year-to-year differences of close to tenpercent in the reporting population are notuncommon. This variation is due in part to thechanges in reporting standards for arrests.
For example the large “notch” inarrest reporting in 1974 was probably due tothe changeover from annual to monthly arrestreporting, which took some time for agenciesto systematize (V. Major, personalcommunication, May 20 and August 23,1999). In prior years only agencies thatreported arrests every month (i.e., were“12-months complete”) were included in thearrest tallies; starting in 1974, when monthlyarrest data began to be collected, arrest datawere aggregated for all agencies with 6months or more of arrest data. This changedagain after 1981; from 1982 on, the FBIreverted to reporting aggregate arrests foronly those agencies that provided 12 monthsof arrest data. The effect of this change canbe seen in the 1981-82 drop in the populationrepresented in arrest reports.
Bridging Gaps 18 in Police Crime Data
IV. Incomplete Arrest Data
14The FBI accepts data that it receives after its publication deadline date and includesthem in data files sent to NACJD, so the data files include reports not included in CIUS.

This lack of completeness andconsistency (and, more importantly, lack ofrepresentativeness) of the reporting of arrestdata can have major consequences becauseof implicit assumptions made by some
individuals in “analyzing” the arrest data. Forexample, Snyder shows how these arrest datahave been used improperly to infer offenserates of juveniles (Snyder, 1999)
Bridging Gaps 19 in Police Crime Data
Corrections: This figure is based on FBI data, which include arrests only from agencies that submit arrest data for all 12 months(see p. 18). In some States & for example, Georgia & the State UCRagency has records of more arrests than are shown in the figure. Connecticut had 100% coverage, originally shown to be 85%.
District of ColumbiaFloridaKansas
New HampshireVermontKentucky
IllinoisGeorgia
MississippiMontana
DelawareTennessee
AlaskaSouth Dakota
NevadaNew York
PennsylvaniaOhio
IndianaMissouri
WashingtonNewMexico
ColoradoUtah
WisconsinLouisianaMichigan
IowaMassachusetts
ArizonaOregon
ArkansasNorth Dakota
AlabamaMaine
NebraskaWest Virginia
New JerseyHawaiiTexasIdaho
WyomingVirginia
CaliforniaNorth CarolinaSouth Carolina
MinnesotaMarylandOklahoma
ConnecticutRhode Island
0% 25% 50% 75% 100%
Percent of population covered by reported arrest data
Figure 9. Percent of Population Covered in Arrest Data Reported to the FBI, 1997
Source: CIUS, 1997

Bridging Gaps 20 in Police Crime Data
by police agencies providing arrest data
1960 1970 1980 19900%
20%
40%
60%
80%
100%
Percent of U.S. population represented
1997
Figure 10. Percent of U.S. Population Represented by Agencies that Provide Arrest Data
Source: CIUS, 1960-97
Figure 11. Part of the Printout of the FBI’s Crime-by-County File
2264613936236287487425,007COUNTY TOTAL
118,621BARBOUR8AL0060000312128154452703LOUISVILLE7AL0060400312483711241,635CLAYTON7AL0060200312
1761012025185279714,048EUFAULA5AL0060100312
2183,0491,004229793854,6234,622116,677COUNTY TOTAL
6948636456221521,0141,01464,493BALDWIN9AL0050054700212621665532952952,690ORANGE BEACH6AL0051254700212359143118181832SUMMERDALE7AL0050954700212
194671271411364164114,820DAPHNE5AL005085470021258625711241243,106ROBERTDALE6AL0050554700212
123661151125065064,584GULF SHORES6AL00504547002121579431607023821,2641,2636,726FOLEY6AL0050354700212
3736511354137159059010,771FAIRHOPE5AL00502547002121061219611081088,655BAY MINETTE6AL0050154700212
12951,16731288571731,7511,73939,223COUNTY TOTAL
11370961432120019914,534AUTAUGA9AL004005560011211821,09721674541521,5511,54024,689PRATVILLE5AL0040155600112
ARSON
MTRVEHTHEFT
LAR-CENY
BURG-LARY
AGGRA-VATEDASSAULT
ROB-BERY
FORCI-BLERAPE
MUR-DER
MODI-FIEDINDEXINDEX
POPULA--TIONAGENCY NAMEGORISMACTYMO
UCR5510003/05/99CRIME BY COUNTY 1997

After the data are received by the FBI(specifically, by the Program Support Sectionof the Criminal Justice Information ServicesDivision), they are stored in a data file thatcontains (among other data) offense data foreach ORI taken from Return A (figure 7):month-by-month counts of each of theoffenses listed. A computer programprocesses this file, in which the 12 months ofdata for each offense are summarized by twonumbers: total for that offense and number ofmonths reported. A page of output from oneof the many programs used by the FBI toprocess the data is shown in Figure 11. Thisoutput file, "Crime by County," is one of themore widely distributed files. Note that—
ù The ORIs are grouped by State andby county within each State.
ù An ORI's population and its StandardMetropolitan Area (SMA & not thesame codes as used by the U.S.Bureau of the Census) and populationgroup indicators are given. (See table2.)
ù Both the total number of Index crimesand modified Index crimes (the firstseven Index crimes plus arson) aregiven.15
ù Although not apparent from theprintout, only the reporting ORIs areincluded in this compilation. If an ORIdoes not submit any UCR data for ayear, it is omitted from the data file,and its population is not included inthe county total.
Publishing the UCR
The deadline for submitting UCR datato the FBI is late March of the following year.Data submitted beyond this date are acceptedby the FBI and incorporated in the data fileuntil the FBI closes out the data file for thatyear. The date that this file is closed out is not fixed; for example, the 1997 file was notclosed out until early April 1999.
The paper version of CIUS for a givenyear is published in the fall of the followingyear, usually in October or November.Between the March cutoff date and thepublication date the staff of the ProgramSupport Section perform the error checks andprepare the data for publication.
January and February are devoted towriting to the larger ORIs to verify data and/orto request missing months; listings of missingmonths are routinely prepared during thisperiod. Data from agencies that do not provide12 months of data are analyzed to identify anymonth(s) deviating from agency norms due tospecial circumstances affecting thoseagencies (e.g., floods, tornadoes, and fire). Byearly March all agencies with delinquent datahave been contacted. By mid-Februarypopulation estimates are calculated, based onCensus Bureau data, and included in the rawdata file.
By mid-April the data processing unitprepares a preliminary set of tables; thispermits the Crime Analysis Research andDevelopment Unit to begin to look for patternsin the data and draft the text and analysis forthe report. In addition, the tables are sent to
Bridging Gaps in 21 Police Crime Data
V. Processing and Publishing the Crime Data
15The arson totals provided in figure 11 are summaries of all arson on file for the respectiveagencies and may not be representative of the number of months reported in the MO column.
Note: Group VII, missing from this table, consists of cities with populations under 2,500 and universitiesand colleges to which no population is attributed. Forcompilation of CIUS, Group VII is included in GroupVI.aIncludes universities and colleges to which nopopulation is attributed.bIncludes State police to which no population isattributed.
. . .CountybIX (Suburban County)
. . .CountybVIII (Rural County)Less than 10,000CityaVI10,000 to 24,999CityV25,000 to 49,999CityIV50,000 to 99,999CityIII100,000 to 249,999CityII250,000 and overCityI
Population range
Political label
Population group
Table 2. FBI Classification of PopulationGrou ps

the outside contractor to format the tables forprinting.
The material for CIUS is sent to ancontractor in three installments. The firstinstallment is delivered to the contractor inMay. It consists chiefly of the appendixes,which have few tables and do not changemuch from year to year, the methodologysection, and tables of law enforcementpersonnel, which had been collected from theORIs in October. Over the next month the FBI corrects the proofs and returns them to thecontractor twice in succession.
Installment 2, consisting chiefly ofCrime Index Offenses Cleared, is sent to thecontractor in early June and, as with the firstinstallment, is proofread and returned to thecontractor twice for revision over the nextmonth.
The third installment consists primarilyof tables and text on offenses and arrests, aswell as the program summary (Section I) andthe inclusion of some data that were omittedfrom sections that had been prepared earlier.For example, the schedule for the 1998 CIUSprojects completion of these three installmentsby the end of July, and a final check of theentire report by early August.
Archiving the UCR Data File
At the request of BJS, the raw datafile is provided to NACJD for archiving. Thefile is then restructured by NACJD andadditional fields are included to make it moreaccessible for research purposes. In the pastthis restructuring has resulted in errors suchas mismatched fields; consequently, the FBIcannot respond to queries about the dataarchived by NACJD.
The file that NACJD archives is notthe one used to produce CIUS; rather, it is theupdated file that contains the additional datareceived by the FBI after the March publicationdeadline. This has meant that analyses usingthe raw data cannot be compared to the tablesin CIUS, because they are based on differentdata sets.
NACJD also produces county-levelfiles from the raw data file (see Section II)which are available for downloading fromNACJD (http://www.icpsr.umich.edu/nacjd/ucr.html ) . Notes accompanying those filesstate that "UCR county-level files are notofficial FBI UCR releases and are beingprovided for research purposes only. Userswith questions regarding these UCRcounty-level data files can contact the NationalArchive of Criminal Justice Data at ICPSR."
Thus, two sets of UCR data are madeavailable to the public. One, published in CIUSand available through the FBI website,contains the data sent to the FBI before itspublication cutoff date. The other, availablethrough the NACJD website, contains datasent to the FBI before its data file cutoff date,which may be considerably later than thepublication cutoff date. The differencebetween the two is usually not great, but hasled to some misunderstandings.
Bridging Gaps 22 in Police Crime Data

It should be noted at the outset thatthe FBI does not publish or release data thatinclude imputations below the State level. Itsimputation procedures are used solely forestimating crime rates at the State andnational levels. NACJD, however, doespublish offense data that have been imputedat the county level. In this section we describethe imputation procedures used by both theFBI and NACJD.
FBI Imputation Procedures for Crime
Whether an ORI reports through theSummary UCR Program or through NIBRS,the FBI will still need to use imputationtechniques that allow it to make reasonableestimates of crime and arrests. Theimputation procedures used by the FBI forestimating crime rates are described below.
Since 1958 the FBI has used twodifferent means of imputing crime data for apolice agency.16 If the agency reports 3 ormore months, one procedure is used, whileanother is used when less than 3 months isreported.
Partial Use of Data . If an agency hasprovided reports of crime data for 3 or moremonths, the imputation procedure is based onthose reports. The total annual crime for thatjurisdiction is estimated by multiplying thereported number of crimes by 12/N, where Nis the number of months for which reportsexist. Thus, an agency that reports 4 monthsof crime data (a third of the year) would beestimated to have 12/4, or 3 times the numberof crimes that it reports for that period.
Data Not Used. If an agency reportsfor 2 or fewer months, the number of crimes isestimated from scratch. These agencies areconsidered to be nonreporting agencies, andthe FBI bases the imputed data for suchagencies on the crime rates for the same yearfor similar agencies. “Similar agencies” areconsidered to be those in the same Population
Group in the same State, but only those thatprovided 12 months of data. Table 2 (page 21)shows how the FBI categorizes these groups.Thus, if an agency in Alabama with a popula-tion of 150,000 reports 2 months or less ofcrime data in 1997, and the 1997 aggravatedassault rate for Group II agencies (populationbetween 100,000 and 249,999) in Alabama is620.2 per 100,000, then the agency isestimated to have had 930.3 (620.2 x 150,000/ 100,000) aggravated assaults for 1997.17
NACJD Imputation Procedure
Every year NACJD obtains a data setfrom the FBI containing the raw UCR figuresfrom the FBI, archives it, and uses it todevelop a file containing crime and arrest datafor each county in the US. NACJD also has tocontend with missing data, in aggregating tothe county level. It has used two differentimputation procedures: one for the 1980-93data sets and the other for datasets from 1994onward.
As stated earlier, the originalcounty-level imputation procedure wasdeveloped to be used to plot crime by countyfor a single year, 1980. When BJS decided tocontinue providing county-level data throughNACJD, they continued to use the sameimputation procedure, similar to the FBIprocedure but with a different cut point:agencies that provided reports for 6 or moremonths were estimated to have 12/N crimes,where N is the number of months reported.
Those reporting less than 6 monthswere estimated to have the same offenserates as the rest of the county (not State andpopulation group). If an agency with 10percent of a county’s population providedreports for 5 months or less, then the county’srates were used for that agency, and theestimated number of crimes for the countybecame C/.9, where C is the number ofcrimes reported by the rest of the county.However, from the 1994 data file onward
Bridging Gaps 23 in Police Crime Data
VI. Procedures Used for Imputing Crime Data
17If there are no comparable ORIs in the State, the estimate is based on the rates of occurrencein the region: New England, Middle Atlantic, East North Central, etc.
16Crime data are not imputed for all agencies; see “Imputation and Zero-Population Agencies.”

NACJD has used essentially the sameimputation procedure as the FBI.
Coverage Factor . More recently, in consultation with BJS, NACJD began toinclude a new element, “coverage factor,” in its county-level data files. This factorrepresents the extent to which the crime andarrest figures for a county are based on realdata and the extent to which they are basedon imputed figures. For example, if a countywith a population of 500,000 includes anagency with a population of 100,000 thatreported for only 9 months (all other agenciesreporting fully), then the coverage factor forthat county would be 1.00 - (3/12) x(100,000/500,000) = .95, or 95 percent,because a fourth of the data are missing for20 percent of the county population. If thatagency reported for 2 months or less, then thecoverage factor would be 1.00 - (12/12) x(100,000/500,000) = .80, or 80 percent, sinceall 12 months are considered missing. Thisdoes not correct the problems of imputation somuch as it puts the users of the data on noticethat the data they are using have beenestimated to some degree.
Imputation Procedures for Arrests
Arrest data are missing to a muchgreater extent than crime data. Imputing themissing arrest figures thus becomes muchmore difficult. The imputation procedure usedby the FBI to account for missing or late arrestdata is applied to all ORIs that report fewerthan 12 months of data, i.e., are not"12-months complete." It is similar to thatused for crime data, with two exceptions: first,arrests are estimated only at the national level;and second, instead of basing the imputationon the arrest rates in the same populationgroup and State, it is based on the arrest ratesin the same population group throughout thecountry.
NACJD has used a similar arrestimputation procedure since the 1994 datayear, except that data for the nonreportingagencies (2 or fewer months) are imputedbased on the arrests rates in the samepopulation group and the same State.
Imputation and “Zero-Population”Agencies
In compiling its crime and arreststatistics, the FBI tries to ensure that both thenumerators (number of crimes and arrests)and denominators (number of people) arebased on accurate data and estimates. Thismeans that populations that are policed bymore than one agency should be counted onlyonce. Some jurisdictions are policed by Stateor county police departments, or even by othercities. For example, Chicago is in CookCounty, Illinois. But the number of crimesreported by the Cook County Sheriff’s PoliceDepartment (CCSPD) is for the areas policedby the CCSPD, and only for those areas (bothunincorporated areas and municipalities thatcontract with CCSPD); it does not include thecrimes in Chicago or any other Cook Countyjurisdiction not policed by the CCSPD. Sincethe crime rate is the number of crimes dividedby the population, the population in questionshould live only in the areas policed by theCCSPD.
As noted earlier (and in the footnotesto table 2), not all police agencies havepopulations associated with them in the UCRprogram. These “zero-population” agencies(transit police, park police, university police,and similar agencies) may be entirely within“primary” police jurisdictions (Groups I-VI intable 2) that already report crime to the FBI.Were these special police agencies to beassociated in the UCR with the populationsthey serve, it would be tantamount todouble-counting those populations.
When these agencies report crimedata, the data are attributed to that ORI andare included in the respective counties of theagencies. When they are not reported (or aredelayed in reporting, or report only partially),no imputation is made of the missing figures.
State police agencies are usuallyconsidered “zero-population” agenciesbecause, for the most part, they police Statehighways and rural areas not covered bymunicipal agencies. When these agenciesreport crime or arrest data, the data are also
Bridging Gaps 24 in Police Crime Data

attributed to their ORI (for example, eachState police barracks may have its own ORI)and are included in the respective counties ofthe agencies. And similarly, when theseagencies’ data are not reported or are delayedin reporting or are reported only partially, noimputation is made of the missing figures.
Updating UCR Files
As previously noted, UCR files areupdated when additional or correctedinformation is made available . For example,suppose a jurisdiction was missing Decem-ber’s Return A, but then sent it in after thepublication cutoff date and prior to the datethat the data file is archived. In such a casethe data file (but not the published material) isupdated to include the additional information.The updated file is then sent to NACJD forarchiving, and contains different data than theprinted version.
Bridging Gaps 25 in Police Crime Data
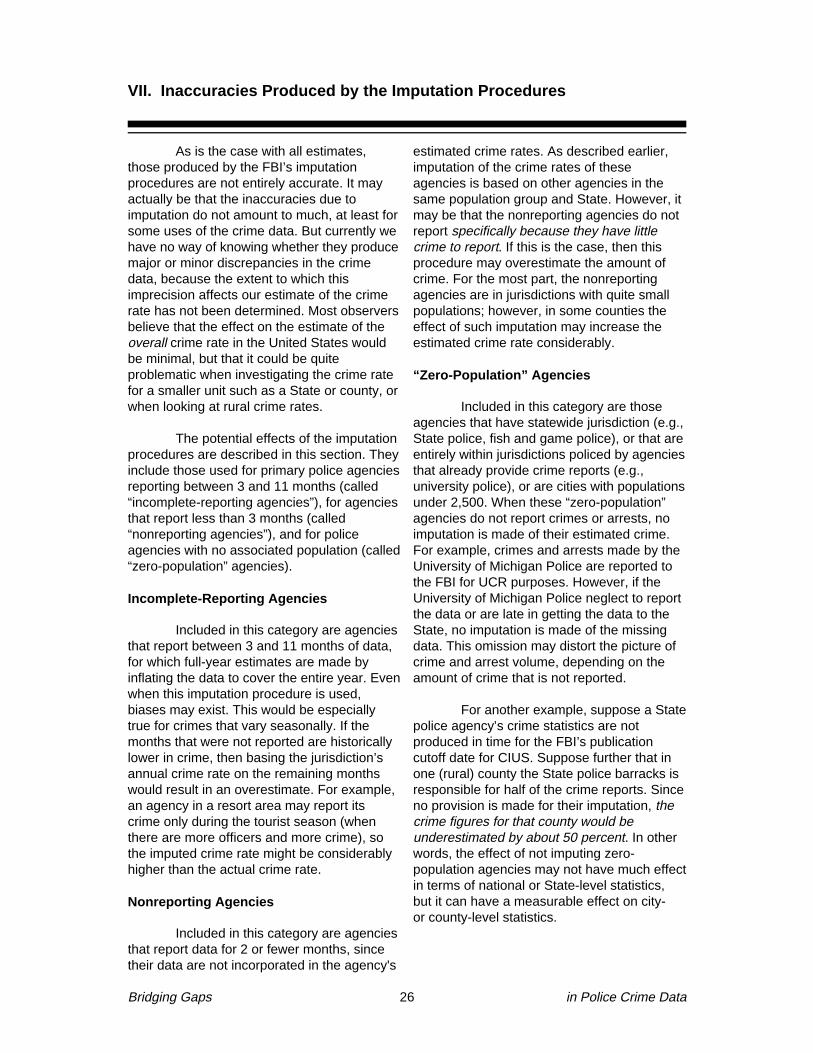
As is the case with all estimates,those produced by the FBI’s imputationprocedures are not entirely accurate. It mayactually be that the inaccuracies due toimputation do not amount to much, at least forsome uses of the crime data. But currently wehave no way of knowing whether they producemajor or minor discrepancies in the crimedata, because the extent to which thisimprecision affects our estimate of the crimerate has not been determined. Most observersbelieve that the effect on the estimate of theoverall crime rate in the United States wouldbe minimal, but that it could be quiteproblematic when investigating the crime ratefor a smaller unit such as a State or county, orwhen looking at rural crime rates.
The potential effects of the imputationprocedures are described in this section. Theyinclude those used for primary police agenciesreporting between 3 and 11 months (called“incomplete-reporting agencies”), for agenciesthat report less than 3 months (called“nonreporting agencies”), and for policeagencies with no associated population (called“zero-population” agencies).
Incomplete-Reporting Agencies
Included in this category are agenciesthat report between 3 and 11 months of data,for which full-year estimates are made byinflating the data to cover the entire year. Evenwhen this imputation procedure is used,biases may exist. This would be especiallytrue for crimes that vary seasonally. If themonths that were not reported are historicallylower in crime, then basing the jurisdiction’sannual crime rate on the remaining monthswould result in an overestimate. For example,an agency in a resort area may report itscrime only during the tourist season (whenthere are more officers and more crime), sothe imputed crime rate might be considerablyhigher than the actual crime rate.
Nonreporting Agencies
Included in this category are agenciesthat report data for 2 or fewer months, sincetheir data are not incorporated in the agency's
estimated crime rates. As described earlier,imputation of the crime rates of theseagencies is based on other agencies in thesame population group and State. However, itmay be that the nonreporting agencies do notreport specifically because they have littlecrime to report. If this is the case, then thisprocedure may overestimate the amount ofcrime. For the most part, the nonreportingagencies are in jurisdictions with quite smallpopulations; however, in some counties theeffect of such imputation may increase theestimated crime rate considerably.
“Zero-Population” Agencies
Included in this category are thoseagencies that have statewide jurisdiction (e.g.,State police, fish and game police), or that areentirely within jurisdictions policed by agenciesthat already provide crime reports (e.g.,university police), or are cities with populationsunder 2,500. When these “zero-population”agencies do not report crimes or arrests, noimputation is made of their estimated crime.For example, crimes and arrests made by theUniversity of Michigan Police are reported tothe FBI for UCR purposes. However, if theUniversity of Michigan Police neglect to reportthe data or are late in getting the data to theState, no imputation is made of the missingdata. This omission may distort the picture ofcrime and arrest volume, depending on theamount of crime that is not reported.
For another example, suppose a Statepolice agency’s crime statistics are notproduced in time for the FBI’s publicationcutoff date for CIUS. Suppose further that inone (rural) county the State police barracks isresponsible for half of the crime reports. Sinceno provision is made for their imputation, thecrime figures for that county would beunderestimated by about 50 percent. In otherwords, the effect of not imputing zero-population agencies may not have much effectin terms of national or State-level statistics,but it can have a measurable effect on city- or county-level statistics.
Bridging Gaps 26 in Police Crime Data
VII. Inaccuracies Produced by the Imputation Procedures

Summary
In 1958, when the FBI first began toprovide national estimates — based on therecommendations of its Consultant Committeeon Uniform Crime Reporting (FBI, 1958) —about half of the States had over 90 percentcoverage, and now about three-quarters haveover 90 percent coverage. Yet, despite theincreases in coverage, the missing data candistort the crime picture in subnationalestimates. When a primary police agency (i.e.,in Groups I-V in table 2) does not report, orprovides partial reports, an attempt is made torectify the omissions by imputation. Theimputation procedures that are used, however,may serve to overestimate the amount ofcrime that actually occurred.
When reports from a zero-populationagency are missing, no matter how large theagency or how important it is in terms of crimereporting, no estimates are made to compen-sate for the missing reports. Thus, the effectof this policy may be to underestimate crimeand arrest rates for counties and rural areas.
The FBI initiated these proceduresover four decades ago, well before the timewhen computing was widespread, and whencompilation of crime and arrest data fromeach individual agency was a difficult andtime-consuming process. Although it is stilldifficult and time consuming, the current stateof computer hardware and software makes itpossible to make adjustments to the data withmuch greater ease.
That this imputation procedure has continued to the present is probablyattributable to —(a) the desire on the part of the FBI to
maintain consistency in its data series(b) the assumption that it made little
difference at the national level (atmost 1 or 2 percent) and would notgreatly affect the general trends in the data
(c) the fact that there had been no needin the past to make any changes & ”If it ain’t broke (or if no one cares ifit’s broke), don’t fix it.”
But now that UCR data are beingused at the jurisdictional level to determinefunding, it is clear that the crime reportingsystem needs to be improved.18 According toNACJD personnel, even before the newFederal legislation brought the problems to theforefront, it was quite evident that the crimerates in some counties had substantialdiscrepancies due to missing data (C. Dunn,at the 1997 workshop). Even though the FBIdoes not impute at the county level (and doesnot condone such uses), it is a fact that thedata are imputed at this level & and thatpolicies are proposed based on the imputeddata. It is for this reason that the FBI shouldconsider revising its imputation procedures. A small percentage difference in overall crimeis one thing, but when looking at a level likerural crime in a single State (or morespecifically, like a single jurisdiction’s crimerate), the difference might be moresubstantial.
Bridging Gaps 27 in Police Crime Data
18Data for individual jurisdictions are not imputed in the calculation of funds; "however, theState-level estimates we use to determine the amount to be distributed across the States are based onimputations. To the extent that these imputations cause errors that are not consistent across all States, it does affect the dollar amounts to be distributed across the States" (S. Lindgren, memorandum to theauthor, March 20, 1999). Therefore, the agencies within States that have higher imputed estimates ofcrime than they actually experienced will get larger awards than they should, and those in States with too low estimates will get lower awards.

[This section is based on conversa-tions with and memoranda written by YoshioAkiyama and James Nolan, III. While I amdeeply indebted to them for their advice andconsultation, as with the rest of this report theopinions and recommendations are mine andshould not be taken as policy of the FBI orBJS.]
The UCR imputation procedures usedby the FBI have been generally effective. Thegoal of the FBI has been to estimate nationaland State rates, and the methods perform thattask effectively. The extension of imputation tosmaller units of analysis (where problemsarise) was first done by NACJD at the behestof BJS, to provide a more fine-grained nationalpicture of crime, and has since been done ona yearly basis by NACJD. This may have ledresearchers to (incorrectly) assume that theimputed data were accurate at this level.
However, because the UCR data arethe only source of crime and arrest data at thejurisdictional level and because they havebeen used to allocate Federal funds, it maywell be worthwhile to update the imputationprocedures to an extent. This will permit theFBI to provide as accurate an estimate ofjurisdictional data as possible; however, itshould be accomplished without undulyburdening the FBI with complicatedprocedures.
No specific imputation procedures arerecommended. Only those who have adetailed knowledge of the data collection andanalysis processes can specify what makessense in practice. However, some generalprinciples can be considered.
Suggested Imputation Philosophy
At the jurisdiction level, a longitudinalestimation procedure (i.e., over time within thesame jurisdiction) appears to be preferable toa cross-sectional one (i.e., for the same yearacross jurisdictions). Longitudinal estimationassumes that the best indicator of ajurisdiction’s current and future crime andarrest activity is its own crime and arrest
history, not the history of “similar” jurisdictions.This means that an estimate based on thejurisdiction’s crime experience in the previousyear is better than an estimate based on otherjurisdictions’ crime experience during thecurrent year, and an estimate for a missingmonth that is based on the same month lastyear is better than one based on the reportedmonths for this year.
Current research in criminologystrongly supports this approach. Recentstudies have clearly shown that “all crime islocal” (Sherman et al, 1997; Lattimore et al,1997). That is, different jurisdictions havedifferent crime patterns (and differentneighborhoods in a jurisdiction have differentcrime patterns). This should be recognized interms of how gaps in criminal justice data arefilled in by imputation.
For global estimates of missingagencies, however, cross-sectional methodsshould be seriously considered. They assumethat the best indicator of a group of agenciesis the average of similar agencies for thesame year, as sampling theory indicates.
Among the points that must beconsidered in developing an imputationscheme are (a) whether an agency reporteddata in the previous year (to permitlongitudinal estimation), (b) the historicalreporting behavior of a delinquent agency, (c)whether non-reporting agencies constitute arandom sample of all jurisdictions, (d) whetherthe agencies in question have changed theirborders during the time period in question.
Different procedures need to beconsidered for zero-population agencies andfor regular agencies that are incomplete- andnon-reporting agencies. Some of the issuesthat might affect the imputation proceduresare described below.
Bridging Gaps 28 in Police Crime Data
VIII. Suggested Imputation Philosophy

Zero-Population Agencies
Currently no imputation is made ofmissing data from zero-population agencies.This policy should be reconsidered. Althoughthe crime counts from these agencies mayconstitute a small fraction of the whole, it maybe advisable to investigate the extent to whichignoring these agencies' data affects theestimates of crime rates for specific sub-populations – rural areas, certain types ofcrimes, etc.
In particular, before any specificimputation procedure can be recommended, astudy should be undertaken to determine (a) ifdifferent types of zero-population agenciesshould be handled differently and (b) whetherthey provide reports to other governmentalentities (cities, States) from which an estimateof their statistics can be made. The examplesgiven earlier, of university or State policeagencies not providing data consistently,indicate that they may have some effect onbiasing the crime picture; it is worthdetermining the extent to which this is thecase.
Different strategies might be tried fordifferent situations. Imputing data for a non-reporting State police department might bebased on the crime rate for the State as awhole; if it has decreased by 5 percent, then areasonable estimate for the State police mightalso be a decrease of 5 percent. Imputing datafor a university police department, on the otherhand, might be based more properly on thechange in crime rate for the city in which theuniversity is located. [Although it might bemore accurate to base the imputation on thechange in crime rate for the neighborhood ofthe university, such detail is beyond thecapability or needs of the UCR program.]
Incomplete and Non-Reporting Agencies
As Akiyama and Nolan (1999b) pointout in their memorandum, "UCR DataImputation: Longitudinal vs Cross-SectionalApproaches," the bulk of the delinquentagencies report fewer than 4 months (i.e.,there are relatively few incomplete-reportingagencies as compared to non-reportingagencies). Imputing the missing data for theseagencies might best be accomplished byimputing each missing month separately. Thishas the effect of simplifying the imputationprocess by putting all agencies with missingdata into the same category (and eliminatingthe arbitrary 3-month cut-point), but it alsowould permit seasonality to be taken intoaccount by providing monthly estimates.
There are two different cases toconsider for primary police agencies thatsubmit no reports. First, there are agenciesthat virtually never provide reports of crimes.The voluntary nature of the UCR programprecludes the FBI from taking any measuresto require reporting from non-reportingagencies. The fact that they do not report tothe FBI, however, does not mean that theyprovide no reports of their activity at all; mostagencies must do so, to some governmentalbody. A sample of these reports could beanalyzed to determine the extent to which thecurrent imputation procedure (i.e., using thesame crime rate as in “similar” jurisdictions)reflects their true crime rates.
For example, if a particular municipalpolice department does not provide crime datato the FBI or State criminal justice agency, it still may prepare an annual report to themunicipality: a police department mustnormally justify its annual budget with anaccounting of its activity. To determine theextent to which crime is underreported, itmight be worthwhile to get in contact with arandom sample of non-reporting agencies andobtain their annual reports. In this way anestimate could be made of the extent of crimeand arrest activity in these and similarnon-reporting jurisdictions.
Bridging Gaps 29 in Police Crime Data

Second, there are agencies thatnormally do prepare reports but are unable todo so for a particular year. In such a case, animputation procedure that is partly longitudinaland partly cross-sectional may be useful. Thatis, one can use the year-to-year change incrime rate for like jurisdictions (in the samestate and same population group), and applythis year-to-year change to the agency’s prioryear’s data. For example, if Agency X did notproduce reports for 1997, and the year-to-yearincrease in crime for “like” agencies (i.e., inthe same population group and State) was3%, this increase could be imputed to lastyear’s data for Agency X.
Bridging Gaps 30 in Police Crime Data

The FBI initiated the SupplementaryHomicide Reports in the 1960s (Riedel, 1990),and NACJD has archived the data from 1976to the present. All police departments thatreport homicides to the FBI generally alsosubmit SHR forms. While the monthly reportsto the UCR program consist for the most partof summary data (e.g., the number ofhomicides occurring in January 1998), thedata from the SHR are considerably moredetailed (figure 12 on page 32).
In some ways, the SHR can beconsidered a precursor to NIBRS, since itprovides details about the incident's occur-rence (the jurisdiction, month, and year ofoccurrence); the apparent circumstancesunder which it occurred (number of victimsand offenders, whether it resulted from arobbery, domestic violence, argument, orother circumstance); age, race, and sexinformation about the victims and offenders, if known; and the relationship between victimsand offenders, if known.
As with any new data series, SHRdata for the first few years had somelimitations, but the series appears to be fairlyaccurate in terms of the number of homicidesreported. The basis for this assessment is thefact that another data series on homicideexists, mortality data based on deathcertificates and collected by health depart-ments since around the turn of the century.Data on Vital Statistics are collected andmaintained by the National Center for HealthStatistics (NCHS), US Department of Health and Human Services. Although the SHR was apparently undercountinghomicides by about 14 percent during the1960’s and 1970’s (Riedel, 1990), morerecently the two series have been within a few percentage points of each other (Riedel,1999).
Uses of the SHR
The SHR has been useful indeveloping policy recommendations related tohomicide. Its nationwide collection, and thefact that not just the number of homicides butthe characteristics of the victims and offendersare included, permits researchers to uncoverpatterns of significant importance: forexample, that the decreasing homicide ratesfor some groups tended to mask the increasein homicide rates for 14- to 17-year-old males(Fox, 1997) and that infanticide is a significantproblem in the United States (Maltz, 1998). Inaddition, many of the articles in HomicideStudies, a journal published by the HomicideResearch Working Group, are based on theSHR data, and many have policy conse-quences.
These studies may not lead to solvingparticular homicides, which has long been theprimary focus of police attention to homicide;however, insofar as they point out patternsand risk factors, they contribute greatly to thepublic safety, the primary mission of thepolice. The accessibility of the SHR data isincreased by the inclusion of files that containSPSS and SAS data definition and program-ming statements, so that the SHR can beanalyzed using these two statistical analysispackages or others that can read theseformats.
The SHR has been used not only tostudy homicide patterns but to study patternsof violent crime in general. The rationale forusing homicide rates as a proxy for violentcrime rates is because they are highlycorrelated (e.g., Blumstein, 1974); however,since there is very little unreported homicide in comparison to other crimes, using the homi-cide rate all but eliminates the problem ofunreported crime. But this is misleading, and the SHR has been misinterpreted by researchers and journalists in their searchfor patterns in homicide data. Homicide is not so much a crime in itself as it is the fatal
Bridging Gaps 31 in Police Crime Data
IX. Supplementary Homicide Reports

Bridging Gaps 32 in Police Crime Data
Do Not Write In These Spaces
Eth
nici
ty
Rac
e
Sex
Age
Eth
nici
ty
Rac
e
Sex
Age
Circumstances(Victim shot by robber, robbery victimshort robber, killed by patron during
barroom brawl, etc.)
Relationship of Victimto Offender
(Husband, Wife, Son,Father, Acquaintance,
Neighbor, Stranger, etc.)
Weapon Used(Handgun, Rifle, Shotgun,
Club, Poison, etc.)
Data Code Offender** Victim**
Situ
atio
n*
Inci
dent
1-704 (Rev. 4-24-95)Form ApprovedOMB No. 1110-000
SUPPLEMENTARY HOMICIDE REPORT
This report is authorized by law Title 28, Section 534, United States Code. While you are not required to respond, your cooperation in using this form to list data pertaining to all homicides reported on your Return A will assist the FBI in compiling comprehensive, accurate data regarding this important classification on a timely basis.Ia. Murder and Nonnegligent Manslaughter List below specific Information for all offenses shown in item Ia of the monthly Return A. In addition, list all Justifiable killings of felons by a citizen or by a peace officer in the line of duty. A brief explanation in the circumstances column regarding unfounded homicide offenses will aid the national Uniform Crime Reporting Program in editing the reports.
AdjustedVerifiedPunchedEditedRecorded
(DO NOT WRITE HERE)
Do Not Write In These Spaces
Eth
nici
ty
Rac
e
Sex
Age
Eth
nici
ty
Rac
e
Sex
Age
Circumstances(Victim shot by robber, robbery victimshort robber, killed by patron during
barroom brawl, etc.)
Relationship of Victimto Offender
(Husband, Wife, Son,Father, Acquaintance,
Neighbor, Stranger, etc.)
Weapon Used(Handgun, Rifle, Shotgun,
Club, Poison, etc.)
Data Code Offender** Victim**
Situ
atio
n*
Inci
dent
SUPPLEMENTARY HOMICIDE REPORT (Continued)
Ia. Manslaughter by Negligence Do not list traffic fatalities, accidental deaths, or death due to the negligence of the victim. List below all other negligent manslaughters, regardless of prosecutive action taken.
y** - See reverse side for explanation
_______________________________ _________________________ ______________________ _____________________ Month and Year Agency Identifier Prepared by Title
_______________________________ _________________________ ______________________________________________ Agency State Chief, Sheriff, Commissioner, superintendent
* Situations A - Single Victim/Single Offender D - Multiple Victims/Single Offender B - Single Victim/Unknown Offender or Offenders E - Multiple Victims/Multiple Offenders C - Single Victim/Multiple Offenders F - Multiple Victims/Unknown Offender or Offenders
Use only one victim/offender situation code per set of information. The utilization of a new code will signify the beginning of a new murder situation.** Age - 01 to 99. If 100 or older use 99. Newborn up to one week use NB. If over one week, but less than one year old use BB. Use two characters only in age column. Sex - M for Male and F for Female. Use one character only. Race - White - W, Black B, American Indian or Alakan Native - 1, Asian or Pacific Islander - A, Unknown - U. Use only these as race designations. Ethnicity - Hispanic Origin H, Not of Hispanic Origin - N, Unknown - U
Figure 12. Replica of Supplementary Homicide Report Form, pages 1 and 2

outcome of different crimes or "homicidesyndromes," and analysis of homicide as asingle entity can produce misleading results.The easy accessibility of the SHR data, then,has unfavorable as well as beneficialconsequences.
A better way to look for patterns inhomicide data is to consider the variouscircumstances under which homicides occur,that is, to disaggregate infanticides from felonyhomicides from spousal murders, and toconsider the homicide rate from within thecontext of the underlying crime. From this typeof analysis one can investigate the risk ofdeath due to child abuse, armed robbery, ordomestic violence (Maltz, 1976, 1998;Maxfield, 1989; Block and Block, 1992).
This, then is one of the great benefitsof the SHR: because it provides detailedinformation about each homicide, it can beused to great advantage in exploring offensepatterns and public policies. For example, ifthe risk of death due to child abuse is muchhigher in one jurisdiction than another, it maybe that the true rates are the same but that thelower-rate jurisdiction has better child abusereporting practices.
Incomplete Provision of SHR Data by Police Departments
The SHR has a number ofshortcomings, in particular with respect toincomplete data. There are three ways inwhich SHR data may be incomplete. First, notall homicides reported on the UCR are
reported on the SHR form. Second, someagencies do not include all the informationabout offender characteristics or motivationsthat is available to them. Third, even when theinformation is complete it may be wrong,because offender-victim relationship is giveninstead of victim-offender relationship or because the same relationship is given for allvictims and/or offenders in an incident withmore than one victim and/or offender.
The FBI tries to ensure that allhomicides reported on the UCR are reportedin the SHR as well, by specifically requestingthis information from jurisdictions for eachUCR-reported homicide. The FBI doesn’talways obtain it, but the SHR/UCR ratio hasrun between 86 percent and 96 percentbetween 1980 and 1994 (Snyder, 1996:10-11).
Incomplete reporting of SHR data is agreater problem. For example, the dataelement "Circumstance" reflects the nature ofthe homicide as far as it can be determined.See table 3. Yet, the number of homicideswith unknown circumstances varies consid-erably from agency to agency, indicating thatdepartmental policy more than knowledge ofthe circumstances governs the informationcollected by the SHR.
There may be a number of reasonsfor agencies not providing completeinformation. First, the information may not bereadily available initially, when the officer firstcompletes the agency's homicide report – andit may be this initial form that is used to
Bridging Gaps 33 in Police Crime Data
Source: Fox, 1997
Sniper attack49Other felony-type not specified26Felon killed by private citizen81Institutional killing48Gambling19Felon killed by police80Juvenile gang killing47Narcotics and drug laws18 Suspected felony-type70Gangland killing46Other sex offense17
All other negligent manslaughterexcept traffic death
59Other arguments45Prostitution and commercialized vice
10Other negligent handling of gun53Argument over money or property44Arson9Children playing with guns52Brawl due to influence of narcotics43Motor vehicle theft7self-inflictedBrawl due to influence of alcohol42Larceny6Gun-cleaning death not 51Child killed by babysitter41Burglary5Victim shot in hunting accident50Lover's triangle40Robbery3Other60Abortion32Rape 2
Circumstances coded in SHR records
Table 3. Circumstances under Which Homicide Occurred

complete the SHR form. There are strongindications that the Washington, DC,Metropolitan Police Department may fill theform out based on this preliminary report – forexample, in 1994 the offenders in 96 percentof homicides were listed as of unknown age(this was used as a proxy for "offenderunknown"). Although this is the most extremeexample of inadequate data collection efforts,figure 13 on page 35 (based on data fromSnyder, 1996) shows that Washington is farfrom alone.
Second, some departments maydownplay the utility of such information andgive it low priority, since it is a voluntarycollection system. Thus, the goal of obtainingcomplete information for crime preventionpurposes too often takes a back seat toreducing the paperwork burden for a policedepartment.
Third, one city (Boston) does notprovide information about the offender orhis/her possible motivation "in order to preventcreating documentation that would bediscoverable and of potential use to thedefense at trial" (Braga, Piehl and Kennedy,1997).19
Fourth, there is a great deal ofvariability from city to city in the diligence withwhich the SHR information is provided. Duringthe 1997 workshop it was mentioned that onecity (Washington, DC) rarely records druginvolvement in homicides, while in another city(Detroit) almost every homicide is recorded asdrug-involved — when the actual truth for bothcities is somewhere in between.
Moreover, incompleteness in SHRreporting also reflects the coding proceduresestablished by the FBI to collect the data. Thecodebook (Fox, 1996) for the SHR data givesan example: "[T]he structure of the datacollection forms prescribes that therelationship of the offender to the first victim
(often chosen arbitrarily) be coded for thisoffender. Thus, for example, in 1977 aRedondo Beach, California, woman killed herhusband and three step-children by burningdown the family home. Appropriately in thiscase, the weapon was coded a ‘fire’ for all fourvictims, but the relationship of victim tooffender was coded as ‘step-daughter’ for allvictims & two 8-year-old white females, a7-year-old white male, and a 40-year-old whitemale." That is, the FBI strips the relationshipdata that may be provided to the FBI and usesonly one relationship to characterize the entireincident.
This problem does not affect mosthomicides, however, since the great majorityof homicides consist of one victim and oneoffender.
Updating SHR Files
SHR files are updated when additionalinformation is provided by police departments.It should be understood that the SHR file isupdated, but individual records are notupdated. For example, an accidental deathmay be reclassified as a homicide, andconsequently is sent in to the FBI for inclusionin the SHR file; it is in this way that the SHRfile is updated.
However, if police submit an SHRrecord to the FBI with a homicide whoseoffender was classified as unknown, andsubsequently learn of the identity of theoffender (the Unabomber or TheodoreKasczinski case is exemplary), the records ofthose homicides are not changed. The FBIcannot revisit old records because no uniqueindex code is included in the SHR file thatwould permit them to identify specifichomicides.
This problem will diminish whenNIBRS is implemented, since each incidentwill have a unique identifier, permitting true
Bridging Gaps 34 in Police Crime Data
19I suspect that this policy was instituted after the information was used successfully in acquitting a defendant; I also suspect that a less drastic step could have been taken. In any event, this problem may be mooted by NIBRS, which allows a window of 2 years in which to update an incident with additional information.

updating for 2 years after the incident. Insofaras police departments adopt NIBRS andadhere to its requirements, it will be possibleto truly update the incident files as moreinformation about incidents develops.
Availability of SHR Data Sets
The FBI makes the data files availableto BJS, and the files are then restructured,reformatted, cleaned, and given wider
Bridging Gaps 35 in Police Crime Data
Washington, DC: N = 398Lake, IN: N = 112
New York, NY: N = 1592Orleans Parish, LA: N = 420Richmond City, VA: N = 160
Prince Georges, MD: N = 127Baltimore City, MD: N = 325
Fresno, CA: N = 122Duval, FL: N = 118
Fulton, GA: N = 224Wayne, MI: N = 599
Orange, CA: N = 172Alameda, CA: N = 188
Contra Costa, CA: N = 120Clark, NV: N = 128
Jefferson, AL: N = 164San Diego, CA: N = 206
Franklin, OH: N = 108Dade, FL: N = 316
Dallas, TX: N = 361Maricopa, AZ: N = 296
St. Louis City, MO: N = 252Los Angeles, CA: N = 1677
Philadelphia, PA: N = 404Riverside, CA: N = 166
Marion, IN: N = 130Essex, NJ: N = 128
Cook, IL: N = 960Bexar, TX: N = 214
Tarrant, TX: N = 165San Bernardino, CA: N = 243
Sacramento, CA: N = 129Harris, TX: N = 463King, WA: N = 105
Jackson, MO: N = 165Cuyahoga, OH: N = 147
Broward, FL: N = 102Shelby, TN: N = 167Hinds, IVIS: N = 101
Milwaukee, W1: N = 144Hillsborough, FL: N = 103
0% 10% 20% 30% 40% 50% 60% 70% 80% 90% 100%
County, State N= total number of homicides
Percent of SHR offenders reported as known, 1994
Figure 13. Percent of Offenders with Known Ages (as Proxy for Known Offenders)in SHR Data in Counties with More than 100 Homicides in 1994Source: Snyder, 1997

accessibility through the NACJD website (at http://icpsr.umich.edu/nacjd/ucr.html ).Each record can contain information on up to11 victims and offenders; since mosthomicides are one-victim/one-offenderhomicides, this makes each year's file muchlarger than it need be and consequently moredifficult to analyze. In addition, there is aseparate file for each year, so these datasetsneed to be combined to perform anymulti-year analyses.
For this reason, BJS and the NationalInstitute of Justice funded an effort to makethe SHR data more accessible, resulting in amulti-year SHR data set, 1976-94 (Fox, 1996).Included in the restructured file are weightsthat take into account missing offender dataaccording to their age, race, and sex, at boththe State and Federal levels. Manslaughtersby negligence and justifiable homicides arenot included in the data set.
There are problems in dealing withmultiple victims and offenders in a single dataset, in a way that keeps the victim-offenderrelationships intact without having to carryalong (mostly empty) space for 11 victims andoffenders. The way it is handled in the1976-94 dataset is to create a different recordfor each victim-offender pair. That is, anincident with four victims and two offenderswould have eight records, each recordcorresponding to a different victim-offenderpair.
Multi-year SHR data sets from1976-97 will soon be available at NACJD,which handle multiple victims and offenders ina different manner. Two separate data setsare generated from the FBI data files, a victimdata set and an offender data set. The victimdata set contains a separate record for eachvictim; if a single homicide incident includesfour victims and two offenders, four records
are created — one for each victim — and theoffender data included on those four recordsare the characteristics of the first offender. Todescribe the same incident, the offender dataset would include two records, one for eachoffender, and the victim data included onthose two records are the characteristics of the first victim.
SHR Imputation
The first point to be made aboutimputation of the SHR is that the FBI does notimpute SHR data. However, the victim andoffender data sets for the combined 1976-97SHR data, to be provided at NACJD, doinclude imputation procedures. The imputationprocedures incorporated in these data setsare not the only ones that have been used forSHR data, but because they are used on themost complete SHR data sets (1976-97) —and the ones most likely to be used in thefuture — their characteristics are describedbelow.
Two different kinds of imputation areused in the (to-be) archived multi-year SHRdata set. The first one is used to reconcile thecount of SHR homicide victims with the countin CIUS. The second imputation procedure isused to estimate the characteristics ofoffenders in incidents in which there is noinformation about the offender. In both typesof imputation weights are assigned to eachcase. The best way to explain these imputa-tion procedures and their use is to discusseach type of weight given in the SHR file.
Weighting the Victim File
The number of records in the victimfile is the count of SHR homicides. As notedearlier, this number is often not the same asthe count of UCR homicides, both nationallyand at the State level. Two of the weightsincluded in the victim file are used to reconcilethese two numbers.
Bridging Gaps 36 in Police Crime Data

Weight wtus . This weight is the samefor all cases for a given year. The weightrepresents the ratio of the number ofhomicides reported in CIUS to the numberreported in the SHR. Thus, since the UCRreported 18,780 homicides and the SHRreported 16,605 homicides for 1976, theweighting factor wtus is 1.13 (18,870/16,605)for 1976. It is used in the following way:suppose one wants to estimate the number ofhomicide victims under 6 years of age. TheUCR does not detail this information, but wecan estimate the number by extrapolatingfrom the known SHR cases to the UCR cases.In 1976 the SHR recorded 519 such cases, sothe 1976 estimate would be (1.13 x 519 =) 587victims under age 6. This would permit us tocompare 1976 data with data from anotheryear, in which a different weighting factor isused. For example, in 1977, 548 such caseswere recorded in the SHR, representing a 6%increase over the 519 in 1976. However, wtusfor 1977 was 1.06 (19,120 UCR homicidesversus 18,032 SHR homicides), so weestimate that there actually were 581 suchvictims; this represents a 1% decrease fromthe 1976 estimate of 586.20
Weight wtst . This weight is the samefor all cases in a State. The weight representsthe ratio of the number of homicides reportedby the State in CIUS to the number reported In the SHR. Thus, the weighting factor wtst of 1.17 for Alabama's 453 SHR-recordedhomicides for 1976 indicates that Alabamaexperienced (1.17 x 453 = ) 530 homicides
in 1976. For Alaska, however, wtst was 1.0 for all of the 43 homicides, indicating that theUCR and SHR reported the same number ofhomicides. In 1977 the values of wtst forAlabama and Alaska were 1.06 and 0.96,respectively, so the SHR counts of 487 and 46indicate that these States had (1.06 x 487 =)516 and (0.96 x 46 =) 44 UCR-reportedhomicides, respectively.21
Weighting the Offender File
There are three weights in theoffender file. Just as the weights in the victimfile are meant to provide a better estimate ofthe number of homicide victims, the weights inthe offender file are meant to provide a betterestimate of the number of homicide offenders.Whereas the victim file weights are used to fillin for missing records, the offender file weightsare used to fill in for missing data withinrecords, that is, for cases where the identityand characteristics of the offender areunknown.
Weight wtimp . This weight imputes,for the Nation at large, the number ofoffenders by age/race/sex category. Supposethat there are 500 victims in a specificage/sex/race category, and 400 of them arekilled by known offenders. Then wtimp wouldequal 1.25 because the unknown offendersare presumed to have the same age/sex/racecharacteristics as the known offenders. Forexample, suppose that 25 percent of them (or100) are killed by white males ages 15-24.Then we would estimate that 25 of the victimsof unknown offenders are also killed by whitemales ages 15-24.
Weights wtimpus and wtimpst . Inorder to take into account the cases that arereported to the UCR but not included in theSHR, we can estimate the total number ofwhite male offenders ages 15-24 in the UnitedStates, by multiplying wtimp by the aforemen-
Bridging Gaps 37 in Police Crime Data
21There may be more SHR homicides than UCR classifications due to crime reclassification across years. For example, perhaps two shooting victims in Alaskain incidents classified as aggravated assaults in 1976 died in 1977.
20These examples are given for illustrative purposes only. A better way of estimating year-to-year change is to obtain the rate, by dividing the estimates by the estimated population under 6 in each year.
-1.0%Estimated UCR percent increase5.6%SHR percent increase
Victims under age 5 &
5815481.0618,03219,12019775875191.1316,60518,7801976
5 or under5 or underSHR ratiototaltotalYearUCR ageSHR age UCR/SHRUCREstimated
Table 4. Victim Im putation in the SHR

tioned wtus. If the latter is 1.13, as in theearlier example, the value of the weightwtimpus would be (1.13 * 1.25 =) 1.41.Similarly, if we wanted to estimate the numberof such offenders in Alabama, we wouldweight each homicide committed by a 15- to24-year-old white male by (1.17*1.25 =) 1.46,the value of wtimpst for Alabama.
Problems with this SHR ImputationProcedure
Since there are two different weightingschemes, for the victim and offender data setsrespectively, the inaccuracies that arise fromtheir application need to be consideredseparately.
Victim File. The weights wtus and wtstare applied to reconcile the number ofhomicides recorded in the UCR and SHR, atthe national or State levels, respectively.When there is a discrepancy between the two,the UCR is usually (but not always) the largerof the two, so these weights are usually largerthan 1. There may be a number of reasons forthe discrepancy.
• There may be clerical errors in an agency'ssubmission of either Return A or the SHRform. For example, some homicides that werereported to the UCR may have "slippedthrough the cracks" when an agency filled outthe SHR form, or perhaps because the agencydid not fill the form out at all. If the former istrue, then the agency is likely to be a largerpolice department with many cases to report;if the latter is true, then the agency is likely tobe a rural department that does not reporthomicides very often.
• Part of the discrepancy may be due to dateslippage, as when a person is injured in onecalendar year and succumbs to these injuriesin another year. In such cases, the homicidemay not be reported on the SHR form,especially if agency practice is to fill it out atthe time of the offense.
In any case, assuming that the missinghomicides generally have the samecharacteristics as the reported ones (whichthis weighting scheme implies) may be inerror. The error attributable to this, however, is likely to be small, since the concordancebetween the two data sets is usually fairly high (Chilton and Jarvis, 1999).
Offender File. The weights wtimp,wtimpus, and wtimpst estimate the number of offenders in cases where the offenders areunknown. However, there is a problem inassuming that the best means of estimatingoffender characteristics is to predicate theestimation on the age, race, and sex of thevictims. For example, suppose that most45-year-old women are killed by their mates,i.e., by 40- to 49-year-old white males.However, if a 45-year-old female clerk at aconvenience store is killed by an unknownassailant, not by her husband, there should besome way of including this in the imputationequation. In other words, the circumstance of the killing (which is included in the SHRrecord) is probably a better indicator ofoffender characteristics than a rule that doesnot include this information. Williams andFlewelling (1987) used this imputationmethod; however, Langford, Isaac, and Kabat(1998) describe some limitations to usingcircumstance for imputation purposes.
An indication of the problem with thistype of imputation is made clear wheninvestigating the distribution of unknownhomicides within a State. Between 1976 and1996 Richmond accounted for 18 percent of Virginia's homicides but 41 percent of itshomicides by unknown assailants; Atlantaaccounted for 29 percent of Georgia'shomicides but 49 percent of its unknowns; and Indianapolis accounted for 21 percent of Indiana's homicides and 35 percent of itsunknowns.22 So making the assumption thatthe unknown assailants have the samecharacteristics as the known offenders isquestionable.
Bridging Gaps 38 in Police Crime Data
22These figures are based on an analysis by the author.

More to the point, the very fact thatthe assailant is unknown often means that thetype of homicide is quite different than those in which the assailant is known. Studies inChicago and Boston confirm this assertion. Block (1998) compared 1993-94 Chicagohomicides found in the SHR data with those in the Chicago Homicide Dataset (CHD),perhaps the most complete homicide datasetin the country. Her data show that about 10percent of the CHD incidents had unknownoffenders in the SHR data, but that it variedfrom around 30 percent (for sexual assault) tounder 4 percent (when firearms were used).
Braga et al. (1997) compared BostonSHR data for 1990-94, for victims 21 or under(N = 155), with data they had collected for thispopulation in conjunction with the Boston GunProject (BGP & see Kennedy, Piehl, andBraga, 1996), a program to reduce youth gunviolence. Since the BGP data were collectedwell after the events, they were much moredetailed than the SHR data, especiallyconsidering the concerns of the Bostonhomicide detectives (see page 34 above).Thus, it was not surprising to find that, whilethe SHR data listed 65 percent as withunknown circumstances (and 79 percent withunknown victim-offender relationship), theBGP data had only 30 percent – less than halfas many – with unknown circumstances and40 percent – again about half as many – withunknown victim-offender relationship.
Although neither city is representativeof the Nation as a whole, what these studiespoint out is that the unknown offenders are notnecessarily representative of the knowns. Thismay be due to the fact that homicide is not aspecific crime like robbery. Rather, asmentioned earlier, it is the fatal outcome of alot of different crimes: intimate partnerviolence, armed robbery, child abuse, etc. Theimputation rule used in the SHR offender fileimplicitly assumes that they are all of thesame general nature, which is not the case;moreover, the information included in the SHRfile is specifically included so that differenttypes of homicides can be distinguished fromeach other, and an imputation rule for theSHR should take this information into account.
Suggested Alternative SHR ImputationProcedure
A homicide's circumstance (see table3), rather than the victim's characteristics,would seem to be a more appropriate indicatorof the characteristics of the offender. Nomatter what the age, race, and sex of thevictim, if the homicide arose during the courseof a robbery the characteristics of the offenderwould probably resemble other robbery-homicide offenders more than they would anyother class of offender. To some extent, thissuggestion takes the SHR reporting practicesof some agencies into account: even thoughWashington, DC, reported that 94 percent ofthe 473 homicides had unknown offenders,the circumstances were listed as unknown inonly 50 percent of the cases.
However, this suggestion should beconsidered carefully. Maxfield (1989) notedthe lack of consistency among agencies incoding homicide circumstance. Because of itsimportance, imputation of homicide offendersis a topic that should not be undertaken lightly.In the aggregate it may not amount to much,but as we begin to go beyond looking only ataggregate rates and investigating smallsubgroups it takes on more importance.
Newspapers report not just onState-by-State homicide rates, but on offenserates, by State, by age group, by weapon, andthe rates inferred by imputation may beseriously in error, as suggested by the Bostonand Chicago studies. Granted, the "unknown"offenders in Boston and Chicago do notrepresent unknown offenders in the rest of theUnited States; these cities were chosenbecause of the availability of good data; inboth cities homicide detectives andresearchers have formed a strong workingrelationship. Rather, as noted earlier, despitetheir lack of representativeness, these studiesdo provide a benchmark against which to testdifferent imputation procedures. Only throughresearch like this can we find the extent towhich our view of crime is distorted byincomplete and inaccurate data.
Bridging Gaps 39 in Police Crime Data
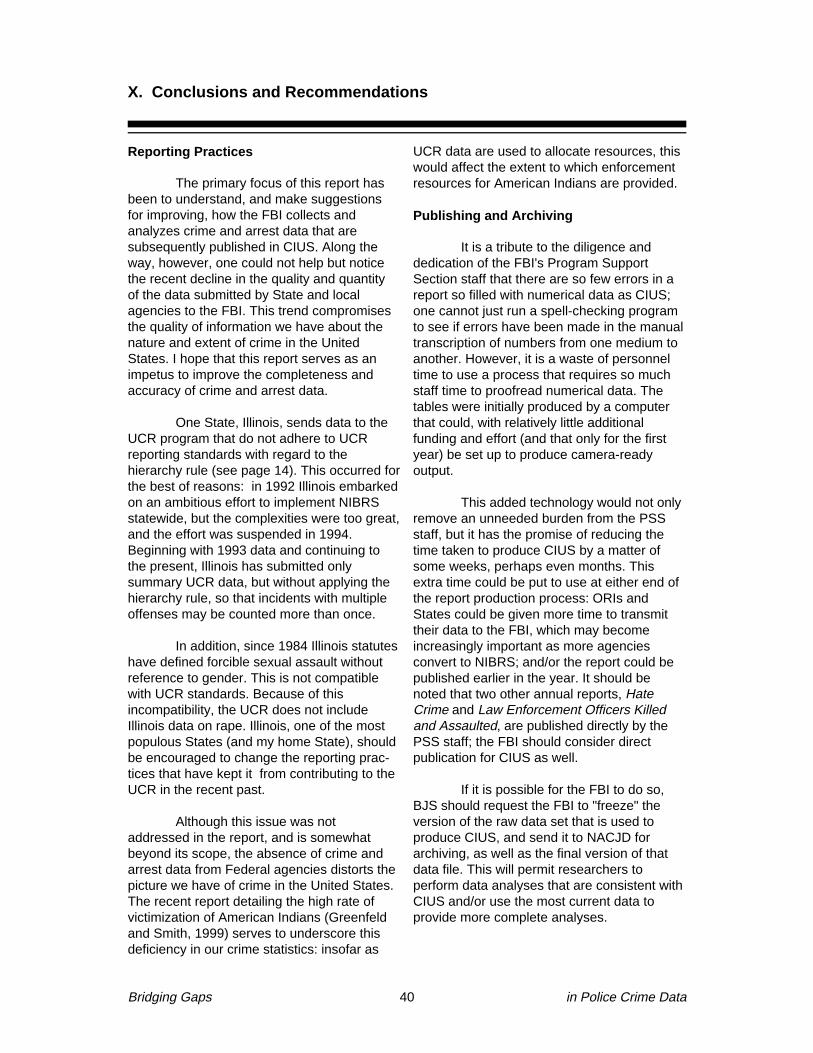
Reporting Practices
The primary focus of this report hasbeen to understand, and make suggestionsfor improving, how the FBI collects andanalyzes crime and arrest data that aresubsequently published in CIUS. Along theway, however, one could not help but noticethe recent decline in the quality and quantity of the data submitted by State and localagencies to the FBI. This trend compromisesthe quality of information we have about thenature and extent of crime in the UnitedStates. I hope that this report serves as animpetus to improve the completeness andaccuracy of crime and arrest data.
One State, Illinois, sends data to theUCR program that do not adhere to UCRreporting standards with regard to thehierarchy rule (see page 14). This occurred forthe best of reasons: in 1992 Illinois embarkedon an ambitious effort to implement NIBRSstatewide, but the complexities were too great,and the effort was suspended in 1994.Beginning with 1993 data and continuing tothe present, Illinois has submitted onlysummary UCR data, but without applying thehierarchy rule, so that incidents with multipleoffenses may be counted more than once.
In addition, since 1984 Illinois statuteshave defined forcible sexual assault withoutreference to gender. This is not compatiblewith UCR standards. Because of thisincompatibility, the UCR does not includeIllinois data on rape. Illinois, one of the mostpopulous States (and my home State), shouldbe encouraged to change the reporting prac-tices that have kept it from contributing to theUCR in the recent past.
Although this issue was notaddressed in the report, and is somewhatbeyond its scope, the absence of crime andarrest data from Federal agencies distorts thepicture we have of crime in the United States.The recent report detailing the high rate ofvictimization of American Indians (Greenfeldand Smith, 1999) serves to underscore thisdeficiency in our crime statistics: insofar as
UCR data are used to allocate resources, thiswould affect the extent to which enforcementresources for American Indians are provided.
Publishing and Archiving
It is a tribute to the diligence anddedication of the FBI's Program SupportSection staff that there are so few errors in areport so filled with numerical data as CIUS;one cannot just run a spell-checking programto see if errors have been made in the manualtranscription of numbers from one medium toanother. However, it is a waste of personneltime to use a process that requires so muchstaff time to proofread numerical data. Thetables were initially produced by a computerthat could, with relatively little additionalfunding and effort (and that only for the firstyear) be set up to produce camera-readyoutput.
This added technology would not onlyremove an unneeded burden from the PSSstaff, but it has the promise of reducing thetime taken to produce CIUS by a matter ofsome weeks, perhaps even months. Thisextra time could be put to use at either end ofthe report production process: ORIs andStates could be given more time to transmittheir data to the FBI, which may becomeincreasingly important as more agenciesconvert to NIBRS; and/or the report could bepublished earlier in the year. It should benoted that two other annual reports, HateCrime and Law Enforcement Officers Killedand Assaulted, are published directly by thePSS staff; the FBI should consider directpublication for CIUS as well.
If it is possible for the FBI to do so,BJS should request the FBI to "freeze" theversion of the raw data set that is used toproduce CIUS, and send it to NACJD forarchiving, as well as the final version of thatdata file. This will permit researchers toperform data analyses that are consistent withCIUS and/or use the most current data toprovide more complete analyses.
Bridging Gaps 40 in Police Crime Data
X. Conclusions and Recommendations

Imputation
As this report details, imputation ofcrime and arrest data has been based on adhoc procedures that were appropriate at thetime they were made and for the uses towhich they were originally put. Now that UCRdata are being used for different purposes,new methods of imputing data need to beconsidered. This report describes somereasonable candidates, but these should notbe applied without setting up an evaluationprogram to determine whether they actuallyprovide improved estimates. This is true for alldata sets in which imputation is being used:crime, arrest, and SHR data. One area wheresome experimentation might be helpful is todetermine where the cutoff threshold shouldbe before an ORI's data are sufficient to beincluded without full imputation, the 3 monthsused by FBI or the 6 months previously usedby NACJD. Among the possible ways ofperforming these experiments are:
ù Analyze nonreporting agencies'submissions to their municipalgovernments to see to what extent theimputation procedure is valid.
ù Develop different categories ofnonreporting ORIs and randomlyselect a number of full reporters fromeach category; apply an imputationmethod and see how closely theimputed data comes to the actualdata.
ù Do the same withincomplete-reporting ORIs.
The data from so-called"zero-population" agencies should also beimputed. The exact means of doing so shouldprobably depend in part on the nature of thejurisdiction: the procedure for imputing a Statepolice agency's data should not be the sameas for a university police department.
NIBRS
NIBRS represents a major increase in the amount of data to be collected by localagencies and forwarded to the FBI. A numberof States have implemented NIBRS success-fully in essentially all their reporting agencies;however, others have had software and otherproblems that have not only prevented NIBRSfrom being fully implemented, but they havebeen unable to send even the summary UCRdata to the FBI.
Some police administrators havecomplained about NIBRS and the level ofdetail it entails. However, its implementation isin part a recognition that if the focus of policingis to be more than just "catching the badguys," and to deal with public safety moregenerally, then the police need to beconcerned with analyzing crime for patternsthat go beyond the modus operandi ofindividual offenders. Such a pattern maysuggest, for example, that a new domesticviolence or after-school program might reducecertain types of offenses. ImplementingNIBRS will give us the ability to compare theeffectiveness of such programs in differentjurisdictions with different populations. Arecent FBI report, The Structure of FamilyViolence (found on the FBI's website atwww.fbi.gov/ucr.htm/famvio21.pdf ), givessome indication of the way NIBRS data can beused for this purpose.
As I mentioned in the beginning of this report, my goal (and the goal of thosewho attended the workshop) has been tosuggest some ideas for consideration inrevising the FBI's Uniform Crime ReportingProgram. While not all of the suggestions maybe feasible to implement at this time, I hopethat this report lays the groundwork forimproving our knowledge of the nature andextent of crime in the United States, one of the more pressing social problemsconfronting the Nation.
Bridging Gaps 41 in Police Crime Data

US Department of JusticeParticipants:
Bureau of Justice AssistanceRichard Ward
Bureau of Justice StatisticsJan ChaikenLawrence GreenfeldCharles KindermannPatrick LanganSue LindgrenMichael RandBruce TaylorMarianne Zawitz
Criminal DivisionJulie SamuelsSteven Shandy
Federal Bureau of InvestigationYoshio AkiyamaBen BrewerGilford GeeAntonio HwangJohn JarvisDawn KordingVictoria MajorJames NolanSharon Propheter
National Institute of JusticeJordan Leiter
Office of Juvenile Justice andDelinquency PreventionBarbara Allen-Hagen
Other Participants:
American UniversityJames Lynch
Inter-University Consortium forPolitical and Social ResearchNora AratoChristopher DunnChristopher LysholmKaye Marz
Massachusetts State PoliceDaniel Bibel
National Center for Juvenile JusticeHoward Snyder
Northeastern UniversityJames Fox
Research Triangle InstituteRobert Flewelling
Rutgers UniversityMichael Maxfield
Project SEARCHDavid Roberts
University of Illinois at ChicagoMichael Maltz
University of Massachusetts, AmherstRoland Chilton
Appendix A : Persons Attending the Workshop on UCR Imputation Procedures
Bridging Gaps 43 in Police Crime Data

Appendix B : State On-Line Publication of Crime Data
Bridging Gaps 44 in Police Crime Data
http://www.state.va.us/vsp/zucr1.html
22296-9797Virginia
http://www.dps.state.vt.us/cjs/crimestats.htm
2297Vermont
http://www.ps.ex.state.ut.us/22296Utah
http://www.state.pa.us/PA_Exec/PCCD/stats/factsheets/statspag.htm
276-96Pennsylvania
http://www.ocjs.state.oh.us/80-9680-96Ohio
http://sbi.jus.state.nc.us/crimstat/nccrime.htm
22278-9793-98North Carolina
http://criminaljustice.state.ny.us/crimnet/pubs.htm
290-96New York
http://www.state.nj.us/lps/njsp/stats.html
22288-9793-97New Jersey
http://www.state.nh.us/nhsp/97New Hampshire
http://www.info.ded.state.ne.us/stathand/contents.htm93-95Nebraska
http://www.dps.state.mn.us/bca95-96Minnesota
http://www.state.mi.us/msp/crd/ucr/contents.htm
222288-9797Michigan
http://www.magnet.state.ma.us/msp/crimedat.htm#Taunton95Massachusetts
http://www.state.ky.us/agencies/ksp/crime.htm
22295-96Kentucky
http://www.state.ia.us/government/dps/crime/stats/
22296Iowa
http://www.state.il.us/isp/cii00001.htm
222293-9794-97Illinois
http://www.cpja.ag.state.hi.us/rs/22292-9783-97Hawaii
http://www.ganet.org/gbi/stcrime.html
285, 95-9698Georgia
http://www.fdle.state.fl.us/Crime_Statistics
296-9797Florida
http://www.state.ct.us/dps/CT-UCR.htm96-97Connecticut
http://www.state.co.us/gov/dir/cdps/dci/ors/stats.htm80-96Colorado
http://caag.state.ca.us/cjsc/pubsol.htm
222296-97California
http://www.acic.org/statistics.htm
22297-9895-96Arkansas
http://agencies.state.al.us/acjis/pages/alacrime.htm
22293-9797Alabama
Website URLArrestsHate/bias
CrimetrendsUCRState Personnel
Officerskilled/assaulted
CrimeLaw enforcement
Data reported on website

Appendix C : Characteristics of State UCR Collection Programs
Bridging Gaps 45 in Police Crime Data
Robert Hyde505-277-4257No longer has a State-level programNew Mexico
Lt. John Burke609-882-2000, x2392Y X New Jersey
Karen Lamb603-271-2509YNX X New Hampshire
Mark Cameron702-687-3342YNYNevada
Marilyn Keelan402-471-2194YYXNebraska
Thomas Murphy406-444-4298YMontana
Martin Carso573-751-3313No State-level programMissouri
Ron Sennett601-359-7880No State-level programMississippi
Kathy Leatherman612-603-0121YNYMinnesota
Beth Huebner517-353-4515NY XMichigan
Dan Bibel508-820-2111YNMassachusetts
Ida Williams410-298-3444NMaryland
Robert Ducasse207-624-7003NYMaine
Rachel Christ504-383-8342YYLouisiana
Alice Strange502-227-8700YNYKentucky
Mary Ann Howerton785-296-8277YYXXXKansas
Martha Coco515-281-8494YIowa
Robert Omstead317-232-8265No State-level programIndiana
Mark Myrent312-793-8550YNY X Illinois
Robin Elson208-884-7156YNYIdaho
Paul Perrone808-586-1500YNHawaii
Michelle Johnson404-559-4949YY XGeorgia
Matthew Finn850-410-7140YYXFlorida
Connie Moore302-739-5876Y*Y XDelaware
William Lopez860-685-8030NYConnecticut
Jennie Rylands303-239-4222YNYColorado
Steve Galeria916-227-3470NYXCalifornia
Gwen Ervin-McLarty501-682-7421YYArkansas
Lynn Allmann602-223-2263YNYXXXArizona
Kathleen Mather907-269-5701NYAlaska
Therese Ford334-242-4900YNYXAlabama
State contact
Vigorousremindingonly
Grantsmay bedelayedPenaltyStatute
Manpowerandtraining
Localagencies
ChangetoNIBRS
Soft-wareState
Statutes and consequences of failure to reportProblems with UCR

Bridging Gaps 46 in Police Crime Data
*Delaware may audit an agency that fails to report UCR data.
Richard Russell307-777-7625YNYWyoming
Tom Eversen 608-266 7644YYWisconsin
Sgt. S. G. Midkiff304-746-2159YYXWest Virginia
Beverly Hempleman360-902-0594NXXWashington
Max Schlueter802-244-8727, x 5220YYY XVermont
Donald Faggiani804-371-2371YYVirginia
Nannette Rofle801-965-4571NYXXUtah
Lori Kirk 512-424-2091YNYTexas
Jacqueline Vandercook615-741-0430 No longer has a State-level programTennessee
Kari Stulken605-773-6312YYXSouth Dakota
Jerry Hamby803-896-7016NYSouth Carolina
Linda Fracolla401-444-1121YNYRhode Island
Carey Robinson717-772-4888NPennsylvania
Ray Spooner503-378-3057YNYOregon
Freda Atkinson405-879-2533YYOklahoma
Melissa Winesburg614-466-7782 No longer has a State-level programOhio
Judy Volk701-328-5500NX XNorth Dakota
Doug Yearwood919-571-4736YYXXNorth Carolina
Robert Giblin518-457-8381YYXNew York
State contact
Vigorousremindingonly
Grantsmay bedelayedPenaltyStatute
Manpowerandtraining
Localagencies
ChangetoNIBRS
Soft-wareState
Statutes and consequences of failure to reportProblems with UCR

Appendix D : Extent of UCR Data Coverage, Alabama - Wyoming, 1958-97
Bridging Gaps 47 in Police Crime Data
1950 1960 1970 1980 1990 20000%
20%
40%
60%
80%
100%
Alabama
1950 1960 1970 1980 1990 20000%
20%
40%
60%
80%
100%
Alaska
1950 1960 1970 1980 1990 20000%
20%
40%
60%
80%
100%
Arizona
The populationrepresented byAlabama’s UCR data apparentlyshows an effect ofLEAA funding in themid-1970’s.
Alaska’s UCRreporting has beenfairly strong but hasfallen during the lastfew years.
Arizona’s UCRreporting has beenconsistently strong.
Note on sources: Data for these figures are from CIUS, 1958-97. The District of Columbia is not included because it consists of only one jurisdiction reporting 100% of its UCR data to the FBI since 1980.
Percent of populationrepresented by UCR

Bridging Gaps 48 in Police Crime Data
1950 1960 1970 1980 1990 20000%
20%
40%
60%
80%
100%
California
1950 1960 1970 1980 1990 20000%
20%
40%
60%
80%
100%
Arkansas
1950 1960 1970 1980 1990 20000%
20%
40%
60%
80%
100%
Colorado
California’s UCRreporting has beenconsistently strong.
Arkansas’ UCRreporting apparentlyshows the effect of LEAA funding in the mid-1970’s.
Colorado’s UCRreporting has beenfairly strong but hasfallen slightly duringthe last few years.
Percent of populationrepresented by UCR

Bridging Gaps 49 in Police Crime Data
Since the 1970’sFlorida’s UCR datacollection effort hasbeen strong.
1950 1960 1970 1980 1990 20000%
20%
40%
60%
80%
100%
Delaware
1950 1960 1970 1980 1990 20000%
20%
40%
60%
80%
100%
Connecticut
1950 1960 1970 1980 1990 20000%
20%
40%
60%
80%
100%
Florida
Aside from occasionallapses, Delaware’sUCR reporting hasbeen consistentlystrong.
Since the 1980’sConnecticut’s UCRdata collection efforthas been strong.
Percent of populationrepresented by UCR

Bridging Gaps 50 in Police Crime Data
Since the 1970’sIdaho’s UCRreporting has been strong.
1950 1960 1970 1980 1990 20000%
20%
40%
60%
80%
100%
Hawaii
1950 1960 1970 1980 1990 20000%
20%
40%
60%
80%
100%
Georgia
1950 1960 1970 1980 1990 20000%
20%
40%
60%
80%
100%
Idaho
Since the 1970’sHawaii’s UCRreporting has beenstrong.
Georgia’s UCR reporting apparentlyshows an effect of LEAA funding in the mid-1970’s.
Percent of populationrepresented by UCR

Bridging Gaps 51 in Police Crime Data
Iowa’s UCR reportinghas fallen in recentyears.
1950 1960 1970 1980 1990 20000%
20%
40%
60%
80%
100%
Indiana
1950 1960 1970 1980 1990 20000%
20%
40%
60%
80%
100%
Illinois
1950 1960 1970 1980 1990 20000%
20%
40%
60%
80%
100%
Iowa
Indiana’s UCR reporting hasgenerally been fallingover the last twodecades.
The FBI has notaccepted Illinois UCR data in recent years. See page 40.
Percent of populationrepresented by UCR

Bridging Gaps 52 in Police Crime Data
Louisiana’s UCRreporting, after adecline in the 1980’s, has improved inrecent years.
1950 1960 1970 1980 1990 20000%
20%
40%
60%
80%
100%
Kentucky
1950 1960 1970 1980 1990 20000%
20%
40%
60%
80%
100%
Kansas
1950 1960 1970 1980 1990 20000%
20%
40%
60%
80%
100%
Louisiana
Kentucky’s data have not beenincluded for the past 2 years due in part to a damaged computer system.
Kansas’ data havenot been included in recent years due to problems attendantto NIBRS conversion.
Percent of populationrepresented by UCR

Bridging Gaps 53 in Police Crime Data
Massachusetts’ UCRreporting, after adecline in the 1980’s,has improved inrecent years.
1950 1960 1970 1980 1990 20000%
20%
40%
60%
80%
100%
Maryland
1950 1960 1970 1980 1990 20000%
20%
40%
60%
80%
100%
Maine
1950 1960 1970 1980 1990 20000%
20%
40%
60%
80%
100%
Massachusetts
Maryland’s UCRreporting has beenconsistently strong.
Since 1976 Maine’sUCR reporting hasbeen consistentlystrong.
Percent of populationrepresented by UCR

Bridging Gaps 54 in Police Crime Data
Mississippi’s UCRreporting, after aperiod of improve-ment in the 1970’s,has been falling overthe last decades.
1950 1960 1970 1980 1990 20000%
20%
40%
60%
80%
100%
Minnesota
1950 1960 1970 1980 1990 20000%
20%
40%
60%
80%
100%
Michigan
1950 1960 1970 1980 1990 20000%
20%
40%
60%
80%
100%
Mississippi
Except for 1 year,Minnesota’s UCR reporting has beenconsistently strong.
Michigan’s UCRreporting has beenfairly strong but hasfallen during the lastfew years.
Percent of populationrepresented by UCR

Bridging Gaps 55 in Police Crime Data
Since the 1970’sNebraska’s UCRreporting has beenfairly strong.
1950 1960 1970 1980 1990 20000%
20%
40%
60%
80%
100%
Montana
1950 1960 1970 1980 1990 20000%
20%
40%
60%
80%
100%
Missouri
1950 1960 1970 1980 1990 20000%
20%
40%
60%
80%
100%
Nebraska
Montana’s UCR datahave not beenavailable for the last 4 years due tolate submissions frommany local agenciesthat apparently hadconverted to newcomputer systems.
Missouri’s UCRreporting has beenreasonably strong,with a single,exceptional year ofalmost total coverage.
Percent of populationrepresented by UCR

Bridging Gaps 56 in Police Crime Data
New Jersey’s UCRreporting has beenconsistently strong.
1950 1960 1970 1980 1990 20000%
20%
40%
60%
80%
100%
New Hampshire
1950 1960 1970 1980 1990 20000%
20%
40%
60%
80%
100%
Nevada
1950 1960 1970 1980 1990 20000%
20%
40%
60%
80%
100%
New Jersey
New Hampshire’sUCR reporting overthe past few yearshas fallen, and thedata for 1997 werenot available due toproblems attendant toconversion to NIBRS.
Nevada’s UCRreporting, after adecline in the 1980’s,has improved inrecent years.
Percent of populationrepresented by UCR

Bridging Gaps 57 in Police Crime Data
North Carolina’s UCR reportingapparently shows aneffect of LEAAfunding in themid-1970’s.
1950 1960 1970 1980 1990 20000%
20%
40%
60%
80%
100%
New York
1950 1960 1970 1980 1990 20000%
20%
40%
60%
80%
100%
New Mexico
1950 1960 1970 1980 1990 20000%
20%
40%
60%
80%
100%
North Carolina
New York’s UCRreporting has beenconsistently strong.
New Mexico’s UCRreporting, after adecline in the 1980’s,improved in 1997.
Percent of populationrepresented by UCR

Bridging Gaps 58 in Police Crime Data
Percent of populationrepresented by UCR
Oklahoma’s UCR reporting apparentlyshows an effect ofLEAA funding in themid-1970’s and hasbeen consistently strong since then.
1950 1960 1970 1980 1990 20000%
20%
40%
60%
80%
100%
Ohio
1950 1960 1970 1980 1990 20000%
20%
40%
60%
80%
100%
North Dakota
1950 1960 1970 1980 1990 20000%
20%
40%
60%
80%
100%
Oklahoma
Ohio’s UCR reporting has generally beenfalling over the lasttwo decades.
1RUWK 'DNRWD’s UCRreporting, since the1970’s has been fairlystrong but has fallenduring the last fewyears.

Bridging Gaps 59 in Police Crime Data
Rhode Island’s UCRreporting has beenconsistently strong.
1950 1960 1970 1980 1990 20000%
20%
40%
60%
80%
100%
Pennsylvania
1950 1960 1970 1980 1990 20000%
20%
40%
60%
80%
100%
Oregon
1950 1960 1970 1980 1990 20000%
20%
40%
60%
80%
100%
Rhode Island
Pennsylvania’s UCRreporting has beenstrong but has fallenslightly during the lastfew years.
Oregon’s UCRreporting has beenconsistently strong.
Percent of populationrepresented by UCR

Bridging Gaps 60 in Police Crime Data
Tennessee’s UCRreporting shows aneffect of LEAAfunding in themid-1970’s butstarted to declineafter LEAA fundingterminated.
1950 1960 1970 1980 1990 20000%
20%
40%
60%
80%
100%
South Dakota
1950 1960 1970 1980 1990 20000%
20%
40%
60%
80%
100%
South Carolina
1950 1960 1970 1980 1990 20000%
20%
40%
60%
80%
100%
Tennessee
South Dakota’s UCRreporting hasgenerally beeninconsistent anddeclined considerablyin 1997.
South Carolina’s UCRreporting apparentlyshows an effect ofLEAA funding in themid-1970’s and hasbeen strong sincethen.
Percent of populationrepresented by UCR

Bridging Gaps 61 in Police Crime Data
Vermont’s UCRreporting has beeninconsistent, and thedata were unavailablein 1997, probably dueto the change toNIBRS.
1950 1960 1970 1980 1990 20000%
20%
40%
60%
80%
100%
Utah
1950 1960 1970 1980 1990 20000%
20%
40%
60%
80%
100%
Texas
1950 1960 1970 1980 1990 20000%
20%
40%
60%
80%
100%
Vermont
Utah’s UCR reportingapparently shows aneffect of LEAAfunding in themid-1970’s and hasbeen strong sincethen.
Texas’ UCR reportingapparently shows aneffect of LEAAfunding in themid-1970’s and hasbeen strong sincethen.
Percent of populationrepresented by UCR

Bridging Gaps 62 in Police Crime Data
West Virginia’s UCRreporting apparentlyshows an effect of LEAA funding in the mid-1970’s and has been strongsince then.
1950 1960 1970 1980 1990 20000%
20%
40%
60%
80%
100%
Washington
1950 1960 1970 1980 1990 20000%
20%
40%
60%
80%
100%
Virginia
1950 1960 1970 1980 1990 20000%
20%
40%
60%
80%
100%
West Virginia
Washington’s UCRreporting has beenconsistently strong.
Virginia’s UCRreporting has beenconsistently strong.
Percent of populationrepresented by UCR

Bridging Gaps 63 in Police Crime Data
1950 1960 1970 1980 1990 20000%
20%
40%
60%
80%
100%
Wyoming
1950 1960 1970 1980 1990 20000%
20%
40%
60%
80%
100%
Wisconsin
Wyoming’s UCRreporting apparentlyshows an effect ofLEAA funding in themid-1970’s and hasbeen strong sincethen.
Since the 1970’sWisonsin’s UCR datacollection effort hasbeen strong.
Percent of populationrepresented by UCR
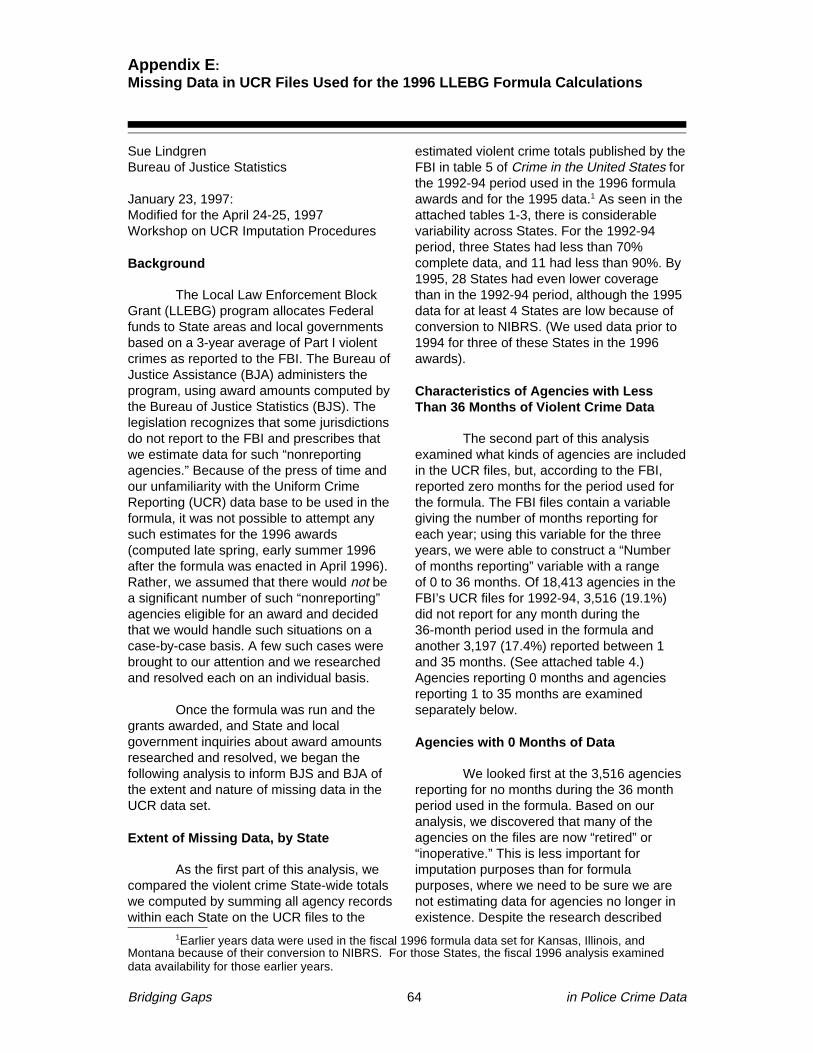
Sue LindgrenBureau of Justice Statistics
January 23, 1997: Modified for the April 24-25, 1997Workshop on UCR Imputation Procedures
Background
The Local Law Enforcement BlockGrant (LLEBG) program allocates Federalfunds to State areas and local governmentsbased on a 3-year average of Part I violentcrimes as reported to the FBI. The Bureau ofJustice Assistance (BJA) administers theprogram, using award amounts computed bythe Bureau of Justice Statistics (BJS). Thelegislation recognizes that some jurisdictionsdo not report to the FBI and prescribes thatwe estimate data for such “nonreportingagencies.” Because of the press of time andour unfamiliarity with the Uniform CrimeReporting (UCR) data base to be used in theformula, it was not possible to attempt anysuch estimates for the 1996 awards(computed late spring, early summer 1996after the formula was enacted in April 1996).Rather, we assumed that there would not be a significant number of such “nonreporting”agencies eligible for an award and decidedthat we would handle such situations on acase-by-case basis. A few such cases werebrought to our attention and we researchedand resolved each on an individual basis.
Once the formula was run and thegrants awarded, and State and localgovernment inquiries about award amountsresearched and resolved, we began thefollowing analysis to inform BJS and BJA ofthe extent and nature of missing data in theUCR data set.
Extent of Missing Data, by State
As the first part of this analysis, wecompared the violent crime State-wide totalswe computed by summing all agency recordswithin each State on the UCR files to the
estimated violent crime totals published by theFBI in table 5 of Crime in the United States forthe 1992-94 period used in the 1996 formulaawards and for the 1995 data.1 As seen in theattached tables 1-3, there is considerablevariability across States. For the 1992-94period, three States had less than 70%complete data, and 11 had less than 90%. By1995, 28 States had even lower coveragethan in the 1992-94 period, although the 1995data for at least 4 States are low because ofconversion to NIBRS. (We used data prior to1994 for three of these States in the 1996awards).
Characteristics of Agencies with LessThan 36 Months of Violent Crime Data
The second part of this analysisexamined what kinds of agencies are includedin the UCR files, but, according to the FBI,reported zero months for the period used forthe formula. The FBI files contain a variablegiving the number of months reporting foreach year; using this variable for the threeyears, we were able to construct a “Number of months reporting” variable with a range of 0 to 36 months. Of 18,413 agencies in theFBI’s UCR files for 1992-94, 3,516 (19.1%)did not report for any month during the36-month period used in the formula andanother 3,197 (17.4%) reported between 1and 35 months. (See attached table 4.)Agencies reporting 0 months and agenciesreporting 1 to 35 months are examinedseparately below.
Agencies with 0 Months of Data
We looked first at the 3,516 agenciesreporting for no months during the 36 monthperiod used in the formula. Based on ouranalysis, we discovered that many of theagencies on the files are now “retired” or“inoperative.” This is less important forimputation purposes than for formulapurposes, where we need to be sure we arenot estimating data for agencies no longer inexistence. Despite the research described
Appendix E : Missing Data in UCR Files Used for the 1996 LLEBG Formula Calculations
Bridging Gaps 64 in Police Crime Data
1Earlier years data were used in the fiscal 1996 formula data set for Kansas, Illinois, andMontana because of their conversion to NIBRS. For those States, the fiscal 1996 analysis examineddata availability for those earlier years.

below, we are not in a position to say withcertainty which are inactive and which arenonreporting, although the research givessome idea of the relative sizes of each group.
As seen in table 5, almost half, 1,652,of those reporting no months were covered byanother reporting agency by the end of 1994,making them ineligible for an LLEBG grant byour interpretation of the legislation, and athird, or 1,221, are “zero population” agencies,meaning they are almost certainly Stateagencies or special police agencies (such astransit police) that probably are not eligible fora formula award. (194 of those were coveredby another reporting agency as well as beingzero population.)
Excluding all of these presumablyineligible agencies, we are left with 866agencies coded as reporting no months, mostof which are small jurisdictions. As seen intable 6, nearly 70% are cities with less than10,000 population. However, when looking atthe actual jurisdictions, there are 2 countiesand 1 city with over 100,000 population, 3cities with between 50,000 and 100,000, and199 cities and counties with over 10,000population. For formula allocation purposes, itis important to keep in mind that in lesspopulous States, cities with 10,000 populationreceive awards; thus, there is more of apotential impact here than we originallythought.
Jurisdictions with between 1 and 35 Months of Data
Table 4 shows that 17.4% of theagencies in the UCR files reported for at least1 month, but less than 36. This represents3,197 agencies. As seen in table 7, 17% ofthese, or 554, are zero population agencies,again meaning they are probably not eligible
jurisdictions, including 5 that were covered byanother reporting agency by the end of 1994.An additional 50 with populations are coveredby another reporting agency, again indicatingineligibility. Of the remaining 2,593 that mightbe eligible for an LLEBG grant, 10%, or 262jurisdictions, already exceeded their Statethreshold for an award; their awards wouldincrease if they reported for more of theperiod.2
Most of the 2,331 that did not get anaward would not reach the threshold if theyreported fully; 525 of them reported no violentcrime, so it is unlikely that they would haveenough violent crime in the months they didnot report to get an award.3 Of those reportingsome violent crime, the overwhelmingmajority are so far below the threshold for anaward in their States that it seems unlikelythat they would receive an award even if theyhad complete data. However, 28 of the 2,331had over 90% of the threshold amount, andanother 26 had between 80% and 90%, andmore complete data may have resulted in an award.
Impact of Incomplete Data
It is clear that a considerable numberof agencies are adversely affected in theformula by missing data in the UCR data sets;data that are missing for a variety of reasonsbeyond not participating in the UCR program.In the course of responding to State and localinquires, we heard some anecdotal evidencefrom individual police departments who claimthey submitted data to the State program thatare not showing up on the UCR files. Forformula purposes, the reason for missing datais a concern, but not necessarily forimputation purposes.
Bridging Gaps 65 in Police Crime Data
3Zero violent crime is a possibility; the agency may have reported property crime (which is not on the files supplied to us), or may have no crime at all but continues to participate in the UCR program. Interestingly, 792 fully-reporting agencies report no violent crime; 484 are zero population, and 308 have populations.
2This includes three State police barracks that were not “zeropop;” that is, unlike mostState-level agencies they had an entry other than zero in the “population covered” variable. See“Addendum on zeropop agencies” on page 64.

While estimating the total impact ofmissing data on the formula allocations is notattempted, a few facts are clear:
ù 262 jurisdictions that received anaward would get a larger award with morecomplete data coverage.
ù It is possible to estimate that, if allcities reported at the same rate as those thatdid for 36 months, an additional 84 citieswould receive an award.
ù Because of the configuration of theaward files, it is not possible to replicate thatcomputation for counties, but presumablysome of the 2,212 counties that did not get anaward would with more complete datacoverage.
Although the impact of incompletedata seems greatest for larger jurisdictionswhich may have hundreds of violent crimes ayear, each of which brings $216.62 in mostStates, small jurisdictions in those States withvery low thresholds such as Vermont (4violent crimes) and North Dakota (7 violentcrimes) might quickly become eligible for anaward with more complete data.4 In addition,the dollars per crime figures for those Statesare considerably higher: $2,321.17 per crimein Vermont and $1,509.17 in North Dakota.
In reviewing these results, it isnecessary to keep in mind that because theformula is relative and interdependent, anincrease in reporting (or in estimating missingdata) would result in an increase in thethresholds and a decrease in the dollar valueof a single crime.
Addendum on “Zeropop” Agencies
Agencies without an entry in the“population covered” variable on the UCRtapes were coded to be “zeropop” in thevariable by that name. This was used as asurrogate indicator to identify State police,special police, and similar agencies that werenot a city or county police or sheriff’s officethat might be eligible for a local lawenforcement formula award. This wasnecessary because the UCR coding schemedoes not allow the separation of State policeand university police from county and citypolice. In the process of examining the extentof missing data in the UCR files, it wasdiscovered that some of these agenciesactually had a population entry and thus werenot coded “zeropop.” A search of the file for“State Police” in the agency name uncovered136 of these with a population figure, about15% of agencies with “State Police” in thename. These are primarily State policebarracks in various counties reporting data for the county area.
This had no effect on the distributionof fiscal 1996 awards because any agency notcoded as a city was treated as reporting for acounty. It will not affect the fiscal 1997 awardsbecause they will rely on the Census Bureaugovernment identification number that is being added to the files to allow accurateidentification of city, county, and Stateagencies and special police forces.
This should have no impact on theimputation of county-level data because wewill be able to provide a crosswalk betweenthe FBI’s agency codes (ORI codes) and theCensus Bureau government identification,level-of- government, and type-of-agencycodes so that those doing the imputation cantreat those agencies any way they want.
Bridging Gaps 66 in Police Crime Data
4The LLEBG legislation establishes $10,000 as the minimum local award. Thus, a jurisdictionneeds a certain amount of violent crime to qualify for an award. In some States this amount is lowerthan the national average because the State-level formula establishes a minimum State awardregardless of violent crime levels.

Bridging Gaps 67 in Police Crime Data
63.00Montana98.24North Carolina65.35Delaware98.33Utah68.04Mississippi98.37Florida74.35Vermont98.45Kentucky74.56Iowa98.98Kansas75.81New Mexico99.13Washington82.29Indiana99.30North Dakota86.33Massachusetts99.31Maine87.37New Hampshire99.43Oregon89.27Louisiana99.66Arkansas89.65South Dakota99.70Wisconsin90.07Ohio99.73New York90.24Alabama99.81Virginia90.36Tennessee99.86Oklahoma94.13Michigan99.87California94.49Nevada99.89West Virginia94.99Pennsylvania99.97Texas95.32Illinois99.98Maryland95.41Missouri99.99New Jersey95.52Georgia100.00Hawaii96.39Alaska100.01Rhode Island97.48Nebraska100.01Connecticut97.50Arizona100.15Wyoming97.56Colorado100.49Idaho97.74%Minnesota%101.57South Carolina
PercentStatePercentState
in Crime in the U.S. )(Numbers on data file as percent of estimated amounts presented
Table 1. 1992-94 UCR Total Violent Crime Data for Input to 1996 LLEBG Formula
100%50100126Less than 80%8810580% to 89.99%7818990% to 95.99%6010596% to 97.99%5010598% to 98.99%40281499% to 99.99%12%12%6100% or more
Cumulative percent of estimated crime
Percent of estimatednumber of Part Iviolent crimes
Number of States
Part I violent crimes ondata files as a percentof published estimate
Table 2. 1992-94 Summary of Actual Counts of Violent Crime on LLEBG Data Files as a Percent of the Amount Estimated by the FBI

17.92%63.00%Minimum102.38%101.57%Maximum
-0.8199.34100.15Wyoming0.1399.8399.70Wisconsin0.0199.9099.89West Virginia
-3.2395.9099.13Washington0.0799.8899.81Virginia
16.2690.6174.35Vermont-2.4995.8498.33Utah-0.1999.7899.97Texas-2.7087.6690.36Tennessee-7.3082.3589.65South Dakota0.81102.38101.57South Carolina0.10100.11100.01Rhode Island
-11.0483.9594.99Pennsylvania-1.5397.9099.43Oregon-0.0299.8499.86Oklahoma-6.0983.9890.07Ohio-3.9895.3299.30North Dakota0.5998.8398.24North Carolina
-1.0398.7099.73New York-2.5773.2475.81New Mexico0.10100.0999.99New Jersey
-12.1875.1987.37New Hampshire4.8399.3294.49Nevada1.5999.0797.48Nebraska
-45.0817.9263.00Montana-0.6794.7495.41Missouri-6.6361.4168.04Mississippi1.7399.4797.74Minnesota0.8394.9694.13Michigan5.1691.4986.33Massachusetts0.0199.9999.98Maryland0.3299.6399.31Maine5.2394.5089.27Louisiana
-6.9491.5198.45Kentucky-64.7734.2198.98Kansas*
4.4779.0374.56Iowa-7.2475.0582.29Indiana
-32.2963.0395.32Illinois*-1.3299.17100.49Idaho0.00100.00100.00Hawaii0.8796.3995.52Georgia0.3898.7598.37Florida
-29.8435.5165.35Delaware-0.0999.92100.01Connecticut-0.4497.1297.56Colorado-2.6897.1999.87California0.1299.7899.66Arkansas
-0.6396.8797.50Arizona-2.2194.1896.39Alaska4.85%95.09%90.24%Alabama
from 1992-94 to 199519951992-94
Difference in thepercentages,
Part I violent crimes as percentof published estimates
(Numbers on data file as percent of estimated amounts present in Crime in the U.S .)
Table 3. Comparisons of UCR Violent Crime Data for Input to 1996 and 1997 LLEBG Formula
Bridging Gaps 68 in Police Crime Data

Bridging Gaps 69 in Police Crime Data
3,197553,142Total2,643502,593Non-zeropop
5545549ZeropopTotalYesNo
Covered by another agency
Covered by Another Reporting Agency by 1994 or "Zeropop"Table 7. A gencies Re portin g 1 to 35 Months , by Whether
100%18,413Total63.511,7003 full years7.01,29125 - 35 months2.95302 full years2.546413 - 23 months2.85081 full year2.24041 - 11 months
19.1%3,516No months
Percent of all agencies
Number ofreporting agencies
Table 4. Number of Months/Years Re portin g, All A gencies in UCR Files, 1992-94
3,5151,6521,863Total2,2941,458836Non-zeropop1,2211941,027Zeropop
TotalYesNoCovered by another agency
Table 5. Agencies Reporting Zero Months, by Whether Covered by Another Reporting Agency or "Zeropop"
100%866Total8.372County under 10,000
11.297County 10,000-25,0005.346County 25,000-100,0000.22County 100,000 or more
46.0398City under 2,50022.7197City 2,500-10,0004.438City 10,000-25,0001.412City 25,000-50,0000.33City 50,000-100,0000.1%1City 100,000-250,000
PercentFrequencyGovernment type and size
Table 6. Population Distribution of Agencies Reporting Zero Months and not Covered by Another Reporting Agency or “Zero pop”

Akiyama, Yoshio, and James Nolan (1999)."Methods for Understanding andAnalyzing NIBRS Data." Journal ofQuantitative Criminology, 15, 2,225-238.
Akiyama, Yoshio, and James Nolan (1999b).“UCR Data Imputation: Longitudinalvs Cross-Sectional Approaches.”Internal memorandum, FBI CriminalJustice Information Services Division,August 1999.
Biderman, Albert D., and James Lynch(1991). Understanding CrimeIncidence Statistics : Why the UCRDiverges from the NCS.Springer-Verlag, New York, NY.
Black, Dan A., and Daniel S. Nagin (1998)."Do Right-to-Carry Laws Deter ViolentCrime?" Journal of Legal Studies, 27,1, 209-220.
Block, Carolyn Rebecca (1998). AnEvaluation of the Completeness andAccuracy of SHR Data: Chicago,1993 and 1994. Illinois CriminalJustice Information Authority,Chicago, IL.
Block, Richard and Carolyn Rebecca Block,"Homicide Syndromes andVulnerability: Violence in ChicagoCommunity Areas over 25 Years."Studies on Crime & Crime Prevention1, 1992, 61-87.
Braga, Anthony A., Anne M. Piehl, and DavidM. Kennedy (1997). Youth Homicidesin Boston: An Assessment ofSupplementary Homicide ReportData. John F. Kennedy School ofGovernment, Harvard University,Cambridge, MA.
Chilton, Roland, and John Jarvis (1999)."Victims and Offenders in Two CrimeStatistics Programs: A Comparison ofthe National Incident-Based ReportingSystem (NIBRS) and the NationalCrime Victimization Survey (NCVS)."Journal of Quantitative Criminology,15, 2, 193-205.
Ehrlich, Isaac (1975). "The Deterrent Effect ofCapital Punishment: A Question ofLife and Death." American EconomicReview, 65, 397-417.
Federal Bureau of Investigation (annually).Crime in the United States. FederalBureau of Investigation, U.S.Department of Justice, Washington,DC.
Federal Bureau of Investigation (1958). Crimein the United States. Special Issue,containing the Report of theConsultant Committee. FederalBureau of Investigation, U.S.Department of Justice, Washington,DC.
Fox, James Alan (1996). Uniform CrimeReports: Supplementary HomicideReports, 1976-1994. [Computer fileand codebook]. ICPSR version.Northeastern University, College of Criminal Justice, Boston, MA [producer]. Inter-universityConsortium for Political and Social Research [distributor], Ann Arbor, MI.
Fox, James Alan (1996). Trends in JuvenileViolence: A Report to the UnitedStates Attorney General on Currentand Future Rates of JuvenileOffending. Northeastern University,Boston, MA.
Greenfeld, Lawrence A., and Steven K. Smith(1999). American Indians and Crime.BJS Report NCJ 173386, U.S.Department of Justice, Washington,DC. Available at http://www.ojp.usdoj.gov/bjs/pub/pdf/aic.pdf .
Illinois Criminal Justice Information Authority(1987). Trends and Issues: Criminaland Juvenile Justice in Illinois. IllinoisCriminal Justice Information Authority,Chicago, IL.
International Association of Chiefs of Police(1929). Uniform Crime Reporting.IACP, New York, NY
Kennedy, David M., Anne M. Piehl, andAnthony A. Braga (1996). "YouthViolence in Boston: Gun Markets,Serious Youth Offenders, and aUse-Reduction Strategy." Law andContemporary Problems, 59, 1,147-196.
References
Bridging Gaps 70 in Police Crime Data

Lattimore, Pamela K., James Trudeau, K.Jack Riley, Jordan Leiter, and StevenEdwards (1997). Homicide in EightAmerican Cities: Trends, Context,and Policy Implications. Report NCJ167262. National Institute of Justice,Washington, DC. Available athttp://ncjrs.org/pdffiles/167262-1.pdf .
Lott, John R., Jr. (1998). More Guns, LessCrime: Understanding Crime and GunControl Laws. University of ChicagoPress, Chicago, IL.
Lott, John R., Jr., and David B. Mustard(1997). "Crime, Deterrence, andRight-to-Carry Concealed Handguns."Journal of Legal Studies, 26, 1, 1-68.
Maltz, Michael D. (1972 [1999]). Evaluation of Crime Control Programs(monograph), National Institute ofLaw Enforcement and CriminalJustice, GPO: Washington. Internetversion, published in 1999, found athttp://www.uic.edu/~mikem/homepage.html
Maltz, Michael D. (1976). "Secondary Analysisof the UCR: An Index of the Risk ofDeath Due to Robbery," Journal ofCriminal Justice 4, 2, 153-56.
Maltz, Michael D. (1977). "Crime Statistics: AHistorical Perspective," Crime andDelinquency 23, 1, January, 32-40.Reprinted in Eric Monkkonen, Ed.,Crime And Justice in AmericanHistory, Meckler, 1990.
Maltz, Michael D. (1998). "VisualizingHomicide: A Research Note," Journalof Quantitative Criminology, 14, 4,397-410.
Maxfield, Michael G. (1989). "Circumstancesin Supplementary Homicide Reports:Variety and Validity." Criminology, 27, 4, 671-694.
Poggio, Eugene C., Stephen D. Kennedy, JanM. Chaiken, and Kenneth E. Carlson(1985). Blueprint for the Future of theUniform Crime Reporting Program.Bureau of Justice Statistics andFederal Bureau of Investigation, U.S.Department of Justice, Washington,DC.
Riedel, Marc (1990) "Nationwide HomicideData Sets: An Evaluation of theUniform Crime Reports and theNational Center for Health StatisticsData." Chp. 9 in Doris LaytonMacKenzie, Phyllis Jo Baunach, andRoy R. Roberg, Eds., MeasuringCrime: Large-Scale, Long-RangeEffects, State University of New YorkPress, Albany, NY.
Sherman, Lawrence W., Denise Gottfredson,Doris MacKenzie, John Eck, PeterReuter, Shawn Bushway, in collabo-ration with members of the GraduateProgram (1997). Preventing Crime:What Works, What Doesn't, What'sPromising. Department of Criminol-ogy and Criminal Justice, Universityof Maryland, College Park, MD.
Snyder, Howard (1996). National JuvenileViolent Crime Trends, 1980-1994.National Center for Juvenile Justice,Pittsburgh, PA.
Snyder, Howard (1999). "The Overrepresen-tation of Juvenile Crime Proportionsin Robbery Clearance Statistics."Journal of Quantitative Criminology,15, 2, 151-161.
Stamp, Sir Josiah (1929). Some EconomicFactors in Modern Life. P. S. King and Son, Ltd., London, UK.
Williams, Kirk and Robert L. Flewelling(1987). “Family, acquaintance, andstranger homicide: Alternateprocedures for rate calculations.”Criminology, 25: 543-560.
Zawitz, Marianne W., Ed. (1983). Report tothe Nation on Crime and Justice: TheData. BJS Report NCJ 87068, U.S.Department of Justice, Washington,DC.
Zawitz, Marianne W., Ed. (1988a). Report tothe Nation on Crime and Justice:Second Edition. BJS Report, NCJ105506, U.S. Department of Justice,Washington, DC.
Zawitz, Marianne W., Ed. (1988b). TechnicalAppendix, Report to the Nation onCrime and Justice: Second Edition.BJS Report, NCJ 112011, U.S.Department of Justice, Washington,DC.
Bridging Gaps 71 in Police Crime Data

BGP: Boston Gun Project, a multi-organization effort that served to reduce thenumber of youth homicides in Boston.
BJA : Bureau of Justice Assistance, one of theagencies of the Office of Justice Programsthat provides programmatic and financialassistance to State and local criminal justiceagencies.
BJS : Bureau of Justice Statistics, thestatistical arm of the U.S. Department ofJustice.
CCSPD: Cook County (Illinois) Sheriff's PoliceDepartment.
CHD: Chicago Homicide Dataset, a computerfile of homicides maintained by the IllinoisCriminal Justice Information Authority andavailable for downloading from NACJD.
CIUS: Crime in the United States, the annualreport on crime published by the FBI.
CJIS: Criminal Justice Information ServicesDivision of the FBI, responsible for thecollection, analysis, and publication of crime,arrest, and other police-related data.
DOJ: U.S. Department of Justice.
FBI: Federal Bureau of Investigation, theinvestigative arm of the U.S. Department ofJustice.
IACP: International Association of Chiefs ofPolice, the organization that initiated theUniform Crime Reporting Program.
ICPSR: Inter-university Consortium of Politicaland Social Research, an organizationestablished by colleges and universities tostore political and social data files so theymay be accessed by researchers for analysis.
LEAA : the Law Enforcement AssistanceAdministration, an agency established by the Omnibus Crime Control and SafeStreets Act of 1968, in which was housedmany of the agencies and functions now partof the Office of Justice Programs.
NACJD : National Archive of Criminal JusticeData, a unit within the Inter-universityConsortium of Political and Social Researchthat serves as a repository of criminal justicedata funded by BJS and NIJ and housing
data files produced by these agencies andtheir grantees/contractors, from which the filescan be obtained.
NCHS: National Center for Health Statistics, a statistical arm of the U.S. Department ofHealth and Human Services.
NIBRS: National Incident-Based ReportingSystem, the crime data collection system thatwill replace the UCR system.
NIJ: National Institute of Justice, the researcharm of the U.S. Department of Justice.
OJP: Office of Justice Programs, an officewithin DOJ that houses the Bureau of JusticeStatistics, Bureau of Justice Assistance,National Institute of Justice, and otheragencies that deal with State and local criminal justice agencies, issues andprograms.
ORI: Originating Agency Identifier, theidentification number used by the FBI to identify police agencies
PSS: Program Support Section, the section of the FBI's Criminal Justice InformationServices Division that deals with thecollection, analysis, and publication of crimedata.
SAC: Statistical Analysis Center, an agencyestablished in many States during the 1970's,often with funding from BJS.
SAS: Statistical Analysis System, computersoftware for data analysis.
SHR: Supplementary Homicide Reports, asupplement to the Uniform Crime ReportingProgram that collects information about eachhomicide incident, including victim andoffender characteristics, the relation betweenvictim(s) and offender(s), and incidentcircumstances.
SPSS: Statistical Program for the SocialSciences, computer software for dataanalysis.
UCR: Uniform Crime Reports or the UniformCrime Reporting Program, the FBI programthat collects, analyzes, and publishes crime,arrest and police personnel data from policeagencies throughout the United States.
Glossary
Bridging Gaps 72 in Police Crime Data