budget at a glance 2017-18 - blue valley schools at a glance 2017-18. table of contents summary of...
TRANSCRIPT

USD 229 - Blue Valley
School FinanceKansas State Department of EducationLandon State Office Building900 SW Jackson Street, Suite 356Topeka, Kansas 66612‐1212
www.ksde.org
Budget at a Glance2017-18
Table of Contents
Summary of Total Expenditures by Function (All Funds)……………………….………...…2
Total Expenditures by Function (All Funds)………….…………………………….…….. 3
Total Expenditures Amount per Pupil by Function (All Funds)……………….……………4
Summary of General and Supplemental General Fund Expenditures……………………5
Instruction Expenses…………………………………………………………………………………..………6
Sources of Revenue and Proposed Budget for 2017‐18…………………...…………………7
Enrollment and Low Income Students…………………………………………………………………8
Mill Rates by Fund………………………………………………………………..…………...…………..… 9
Assessed Valuation and Bonded Indebtedness…………………….………………………………10
Average Salary…………………………………………………………………………………....………………11
KSDE Website Information……………………………………………………………...…………………12
1

2
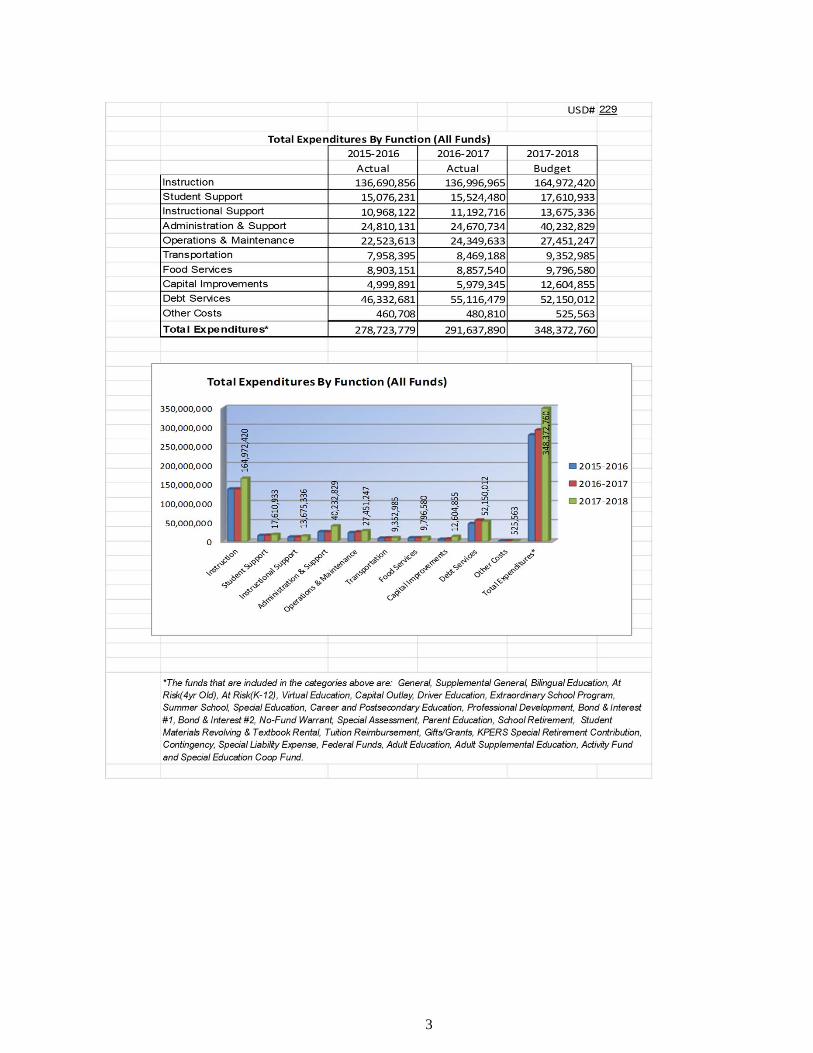
3
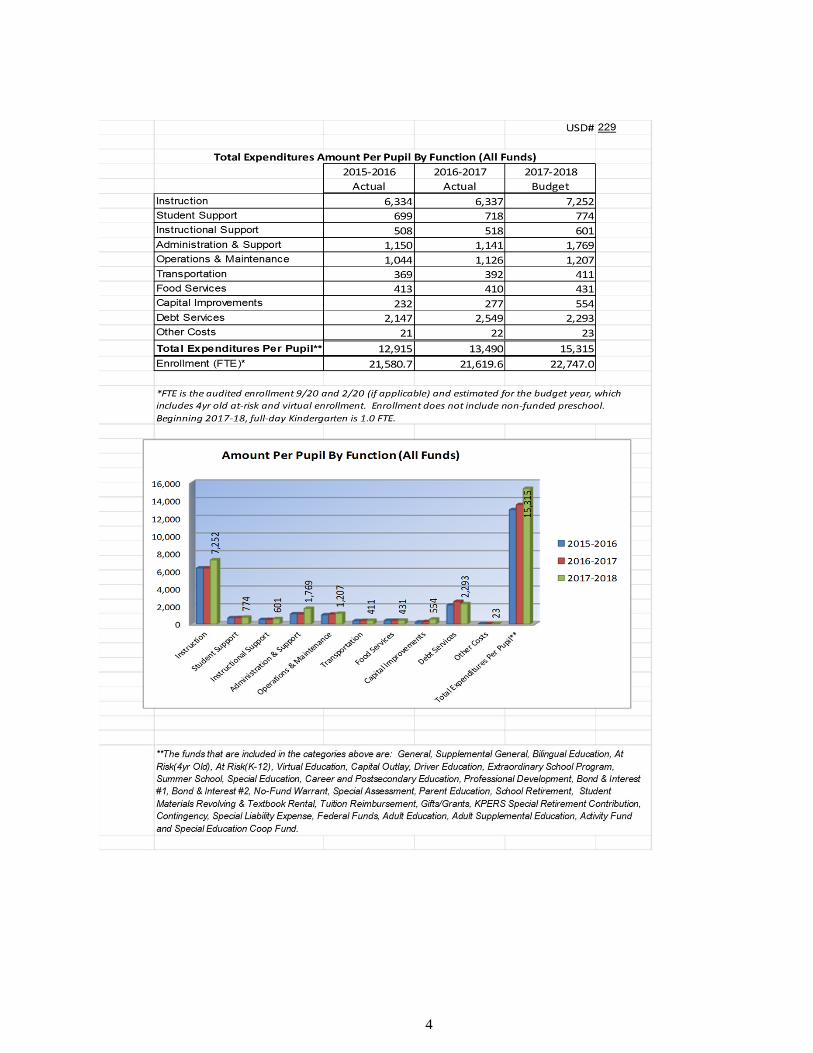
4

5
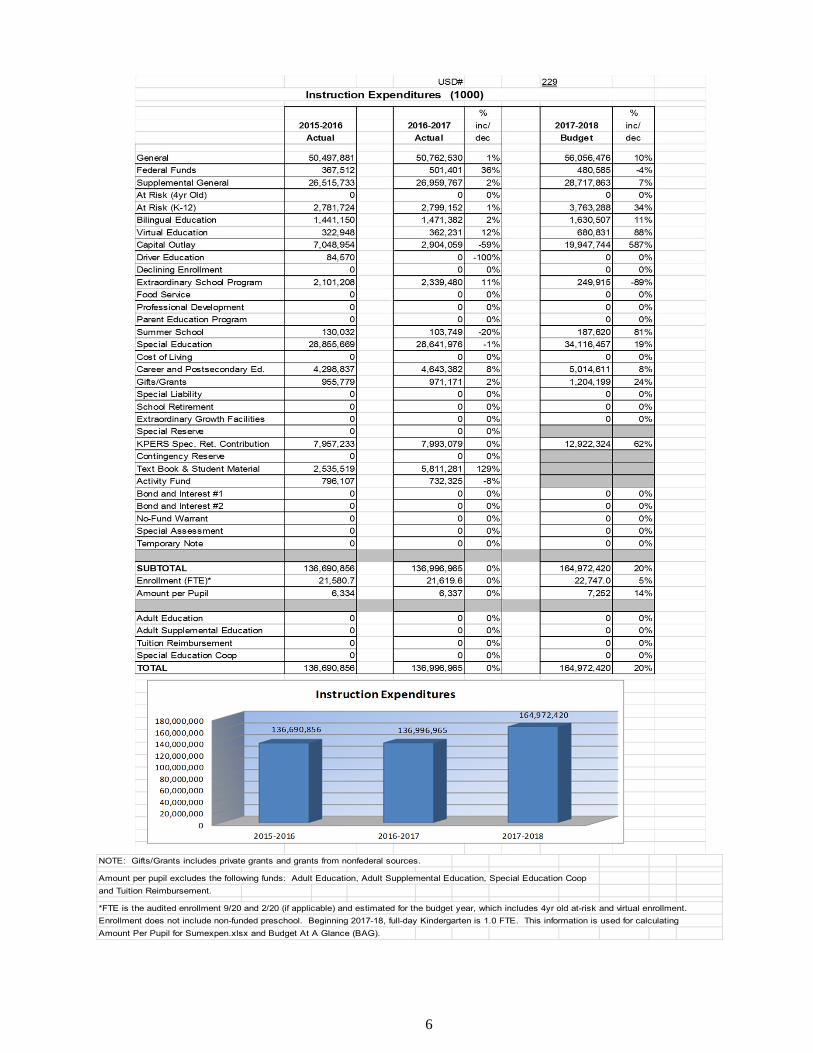
NOTE: Gifts/Grants includes private grants and grants from nonfederal sources.
Amount per pupil excludes the following funds: Adult Education, Adult Supplemental Education, Special Education Coop
and Tuition Reimbursement.
*FTE is the audited enrollment 9/20 and 2/20 (if applicable) and estimated for the budget year, which includes 4yr old at-risk and virtual enrollment.
Enrollment does not include non-funded preschool. Beginning 2017-18, full-day Kindergarten is 1.0 FTE. This information is used for calculating
Amount Per Pupil for Sumexpen.xlsx and Budget At A Glance (BAG).
6

USD 229
2017-18 Estimated Sources of Revenue--2017-18 Estimated
Amount July 1, 2017 State Federal Local July 1, 2018
Fund Budgeted Cash Balance Interest Transfers Other Cash Balance
General 141,616,346 0 141,549,226 0 XXXXXXXXXX 0 67,120 XXXXXXXXXX
Supplemental General 51,456,901 3,748,516 0 0 47,708,385 XXXXXXXX
Adult Education 0 0 0 0 0 0 0 0
At Risk (4yr Old) 0 0 0 0 0 0 0
Adult Supplemental Education 0 0 0 0 0 0
At Risk (K-12) 5,573,871 0 0 0 5,497,871 76,000 0
Bilingual Education 1,767,897 0 0 0 1,707,897 60,000 0
Virtual Education 729,529 372,037 0 268,493 485,950 396,951
Capital Outlay 55,699,807 60,701,452 0 0 330,000 0 25,755,132 31,086,777
Driver Training 0 0 0 0 0 0 0 0
Declining Enrollment 0 0 0 0 XXXXXXXX
Extraordinary School Program 249,915 1,040,721 0 0 0 0 790,806
Food Service 9,917,443 2,429,257 65,725 1,590,108 0 0 7,267,890 1,435,537
Professional Development 1,600,267 0 143,745 0 0 1,369,022 87,500 0
Parent Education Program 828,570 35,578 436,475 35,386 0 268,709 88,000 35,578
Summer School 192,921 148,580 0 0 0 116,575 72,234
Special Education 49,758,224 6,595,780 0 4,193,939 525,000 37,643,478 1,182,322 382,295
Career and Postsecondary Education 5,237,328 0 0 82,990 0 4,868,338 286,000 0
Special Liability Expense Fund 844,191 465,426 0 0 776,027 397,262
Special Reserve Fund 19,780,558 XXXXXXXX
Gifts and Grants 1,648,282 1,498,282 150,000 0
Textbook & Student Materials Revolving 2,286,633 XXXXXXXX
School Retirement 0 0 0 0 0
Extraordinary Growth Facilities 10,823,689 583,026 10,823,689 10,240,663 XXXXXXXXX
KPERS Special Retirement Contribution 19,122,772 0 19,122,772 XXXXXXXXXX XXXXXXXXX
Contingency Reserve 11,179,726 XXXXXXXXX
Activity Funds 222,331 XXXXXXXXX
Tuition Reimbursement 0 0 0 0 0
Bond and Interest #1 52,150,012 56,343,026 0 819,352 0 55,906,707 60,919,073
Bond and Interest #2 0 0 0 0 0 0 0
No Fund Warrant 0 0 0 0
Special Assessment 712,251 331755 716,156 335,660
Temporary Note 0 0 0 0 0
Coop Special Education 0 0 0 0 0 0 0
Federal Funds 890,041 0 xxxxxxxxxxx 890,041 xxxxxxxxxxxx xxxxxxxxxxxx xxxxxxxxxxx 0
Cost of Living 6,943,632 548,393 xxxxxxxxxxx xxxxxxxxxxx xxxxxxxxxxxx 6,943,632 6,395,239 XXXXXXXXX
SUBTOTAL 417,763,889 168,311,077 161,317,943 7,611,816 855,000 69,391,129 157,365,666 95,852,173
Less Transfers 69,391,129
TOTAL Budget Expenditures $348,372,760
2015-2016 2016-2017 2017-2018
State Revenues 145,010,295 141,748,503 161,317,943
Federal Revenues 7,597,548 8,108,668 7,611,816
Local Revenues* 181,771,347 189,585,309 158,220,666
Total Revenues 334,379,190 339,442,480 327,150,425
Revenues Per Pupil 15,494 15,701 14,382
*Excludes "Transfers" to avoid duplication of revenue.
Sources of Revenue and Proposed Budget for 2017-18
Sources of Revenue - - State, Federal, Local
Effective July 1, 2014 (2014-15 school year) KSA 72-6431 states proceeds from the
Ad Valorem taxes levied for the General Fund shall be remitted to the
State Treasurer. Such remittance shall be redistributed as state general aid.
7

*FTE is based on actual enrollment for 9/20 and 2/20, including 4yr old at‐risk. Beginning 2017‐18 school year, full‐day
kindergarten is funded as 1.0 FTE. Virtual enrollment is excluded.
USD# 229
2013-2014 2014-2015 % 2015-2016 % 2016-2017 % 2017-2018 %
Actual Actual inc/ Actual inc/ Actual inc/ Budget inc/
dec dec dec dec
Enrollment (FTE)* 21,371.0 21,375.1 0% 21,563.7 1% 21,600.3 0% 22,747.0 5%
Number of Students -
Free Meals 1,307 1,196 -8% 1,262 6% 1,165 -8% 1,200 3%
Number of Students -
Reduced Meals 551 635 15% 593 -7% 658 11% 630 -4%
Enrollment Information
8

USD# 229
Miscellaneous InformationMill Rates by Fund
2015-2016 2016-2017 2017-2018
Actual Actual Budget
General 20.000 20.000 20.000
Supplemental General 15.776 15.230 15.395
Adult Education 0.000 0.000 0.000
Capital Outlay 8.000 8.000 8.000
Declining Enrollment 0.000 0.000 0.000
Cost of Living 2.503 2.198 1.930
Special Liability 0.043 0.025 0.268
School Retirement 0.000 0.000 0.000
Extraordinary Growth Facilities 3.528 3.182 3.135
Bond and Interest #1 18.012 17.618 17.618
Bond and Interest #2 0.000 0.000 0.000
No Fund Warrant 0.000 0.000 0.000
Special Assessment 0.027 0.002 0.249
Temporary Note 0.000 0.000 0.000
TOTAL USD 67.889 66.255 66.595
Historical Museum 0.000 0.000 0.000
Public Library Board 0.000 0.000 0.000
Public Library Board & Employee Bnfts 0.000 0.000 0.000
Recreation Commission 1.810 1.798 1.748
Rec Comm Employee Bnfts 0.390 0.402 0.450
TOTAL OTHER 2.200 2.200 2.198
9

USD# 229
Other Information
2015-2016 2016-2017 2017-2018
Actual Actual Budget
Assessed Valuation $2,640,516,177 $2,844,211,225 $3,006,665,551
Bonded Indebtedness 326,205,000 381,230,000 341,240,000
10
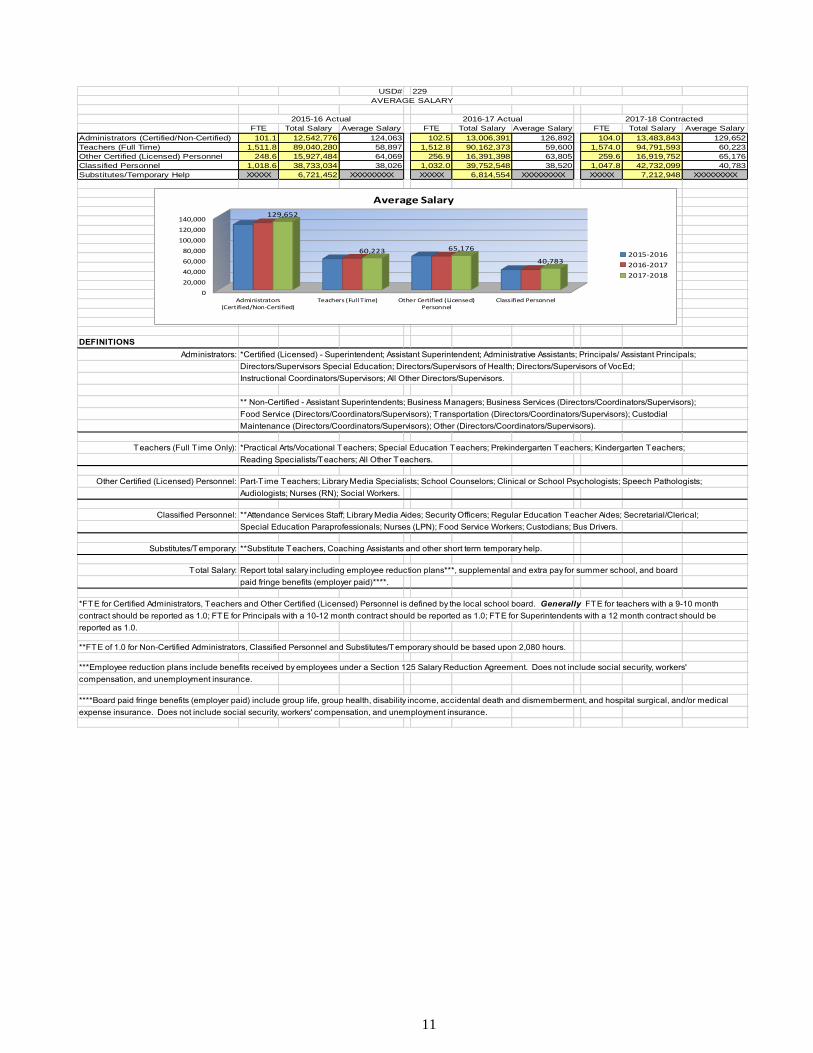
USD# 229
FTE Total Salary Average Salary FTE Total Salary Average Salary FTE Total Salary Average Salary
Administrators (Certified/Non-Certified) 101.1 12,542,776 124,063 102.5 13,006,391 126,892 104.0 13,483,843 129,652
Teachers (Full Time) 1,511.8 89,040,280 58,897 1,512.8 90,162,373 59,600 1,574.0 94,791,593 60,223
Other Certified (Licensed) Personnel 248.6 15,927,484 64,069 256.9 16,391,398 63,805 259.6 16,919,752 65,176
Classified Personnel 1,018.6 38,733,034 38,026 1,032.0 39,752,548 38,520 1,047.8 42,732,099 40,783
Substitutes/Temporary Help XXXXX 6,721,452 XXXXXXXXX XXXXX 6,814,554 XXXXXXXXX XXXXX 7,212,948 XXXXXXXXX
DEFINITIONS
Administrators: *Certified (Licensed) - Superintendent; Assistant Superintendent; Administrative Assistants; Principals/ Assistant Principals;
Directors/Supervisors Special Education; Directors/Supervisors of Health; Directors/Supervisors of VocEd;
Instructional Coordinators/Supervisors; All Other Directors/Supervisors.
** Non-Certified - Assistant Superintendents; Business Managers; Business Services (Directors/Coordinators/Supervisors);
Food Service (Directors/Coordinators/Supervisors); T ransportation (Directors/Coordinators/Supervisors); Custodial
Maintenance (Directors/Coordinators/Supervisors); Other (Directors/Coordinators/Supervisors).
Teachers (Full T ime Only): *Practical Arts/Vocational Teachers; Special Education Teachers; Prekindergarten Teachers; Kindergarten Teachers;
Reading Specialists/Teachers; All Other Teachers.
Other Certified (Licensed) Personnel: Part-T ime Teachers; Library Media Specialists; School Counselors; Clinical or School Psychologists; Speech Pathologists;
Audiologists; Nurses (RN); Social Workers.
Classified Personnel: **Attendance Services Staff; Library Media Aides; Security Officers; Regular Education Teacher Aides; Secretarial/Clerical;
Special Education Paraprofessionals; Nurses (LPN); Food Service Workers; Custodians; Bus Drivers.
Substitutes/Temporary: **Substitute Teachers, Coaching Assistants and other short term temporary help.
Total Salary: Report total salary including employee reduction plans***, supplemental and extra pay for summer school, and board
paid fringe benefits (employer paid)****.
*FTE for Certified Administrators, Teachers and Other Certified (Licensed) Personnel is defined by the local school board. Generally FTE for teachers with a 9-10 month
contract should be reported as 1.0; FTE for Principals with a 10-12 month contract should be reported as 1.0; FTE for Superintendents with a 12 month contract should be
reported as 1.0.
**FTE of 1.0 for Non-Certified Administrators, Classified Personnel and Substitutes/Temporary should be based upon 2,080 hours.
***Employee reduction plans include benefits received by employees under a Section 125 Salary Reduction Agreement. Does not include social security, workers'
compensation, and unemployment insurance.
****Board paid fringe benefits (employer paid) include group life, group health, disability income, accidental death and dismemberment, and hospital surgical, and/or medical
expense insurance. Does not include social security, workers' compensation, and unemployment insurance.
AVERAGE SALARY
2015-16 Actual 2016-17 Actual 2017-18 Contracted
0
20,000
40,000
60,000
80,000
100,000
120,000
140,000
Administrators(Certified/Non-Certified)
Teachers (Full Time) Other Certified (Licensed)Personnel
Classified Personnel
129,652
60,223 65,176
40,783
Average Salary
2015-2016
2016-2017
2017-2018
11
KSDE Website Information Available
K-12 Statistics (Building, District or State Totals) website below:http://svapp15586.ksde.org/k12/k12.aspx
• Attendance / Enrollment Reports• Staff Reports• Graduates / Dropouts Reports• Crime / Violence Reports
School Finance Reports and Publications website below:http://www.ksde.org/Agency/Fiscal‐and‐Administrative‐Services/School‐Finance/Reports‐and‐Publications
• Assessed Valuation• Cash Balances• Headcount Enrollment• Mill Levies• Personnel (Certified/Non-Certified)• Salary Reports
Kansas Building Report Card website below:http://ksreportcard.ksde.org/
• Attendance Rate• Graduation Rate• Dropout Rate• School Violence• Assessments • Reading • Mathematics • Writing
• Graduates Passing Adv. Science Courses• Graduates Passing Adv. Math Courses
12