c12.0 total maximum daily load (tmdl) development plan · pdf filec12.0 total maximum daily...
TRANSCRIPT

C12.0 Total Maximum Daily Load (TMDL) Development Plan for Mill Creek
162
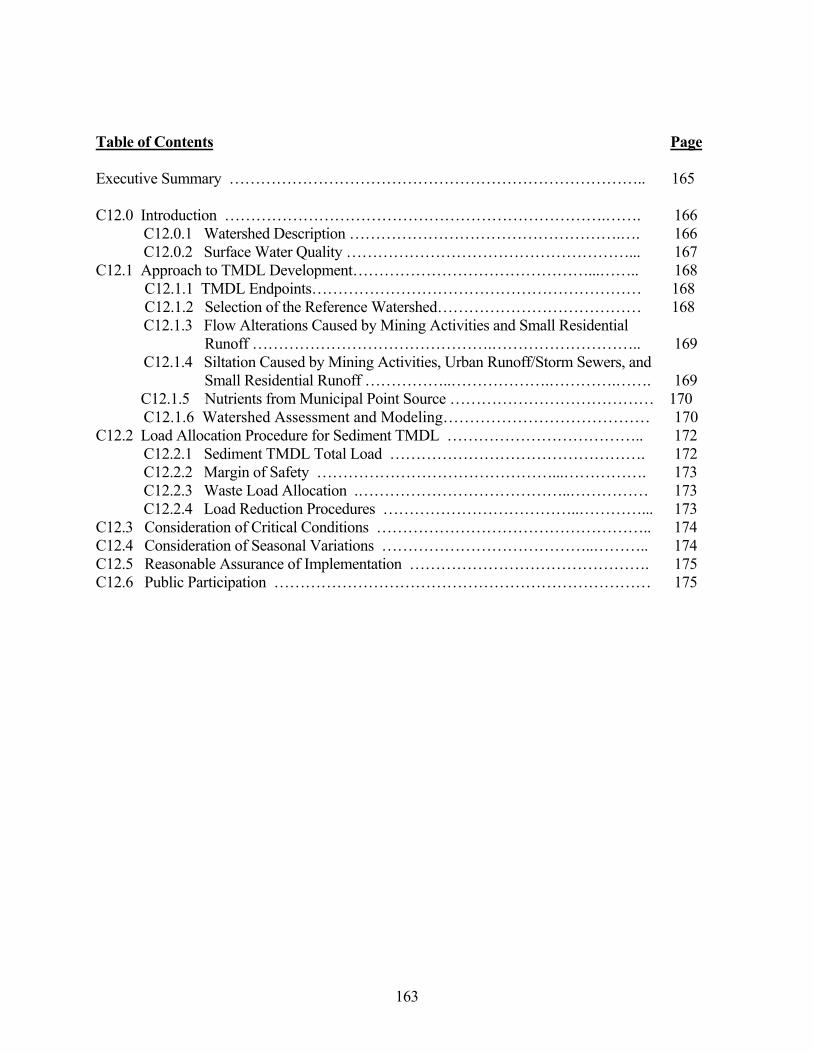
Table of Contents Page Executive Summary …………………………………………………………………….. 165 C12.0 Introduction ……………………………………………………………….……. 166 C12.0.1 Watershed Description …………………………………………….…. 166 C12.0.2 Surface Water Quality ………………………………………………... 167 C12.1 Approach to TMDL Development………………………………………...…….. 168 C12.1.1 TMDL Endpoints……………………………………………………… 168 C12.1.2 Selection of the Reference Watershed………………………………… 168 C12.1.3 Flow Alterations Caused by Mining Activities and Small Residential Runoff ……………………………………….……………………….. 169 C12.1.4 Siltation Caused by Mining Activities, Urban Runoff/Storm Sewers, and Small Residential Runoff ……………..……………….………….……. 169 C12.1.5 Nutrients from Municipal Point Source ………………………………… 170
C12.1.6 Watershed Assessment and Modeling………………………………… 170 C12.2 Load Allocation Procedure for Sediment TMDL ……………………………….. 172 C12.2.1 Sediment TMDL Total Load …………………………………………. 172 C12.2.2 Margin of Safety ………………………………………...……………. 173 C12.2.3 Waste Load Allocation .…………………………………..…………… 173 C12.2.4 Load Reduction Procedures ………………………………..…………... 173 C12.3 Consideration of Critical Conditions …………………………………………….. 174 C12.4 Consideration of Seasonal Variations …………………………………..……….. 174 C12.5 Reasonable Assurance of Implementation ………………………………………. 175 C12.6 Public Participation ……………………………………………………………… 175
163
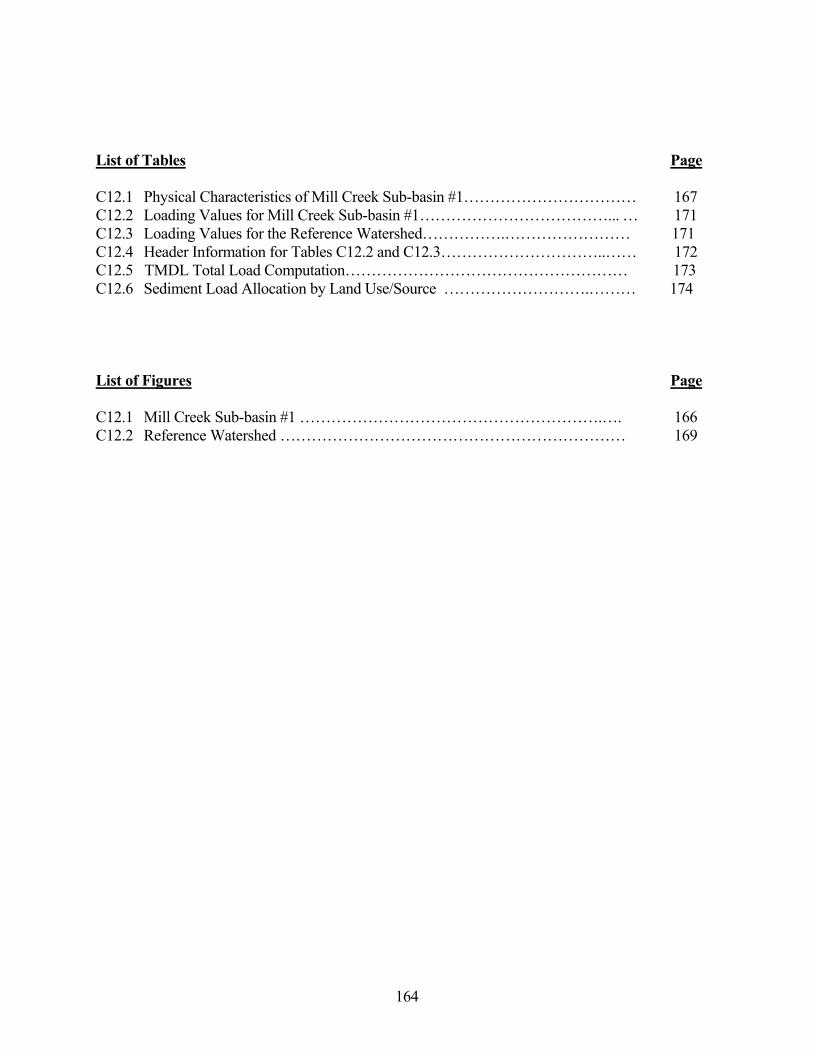
List of Tables Page C12.1 Physical Characteristics of Mill Creek Sub-basin #1…………………………… 167 C12.2 Loading Values for Mill Creek Sub-basin #1………………………………... … 171 C12.3 Loading Values for the Reference Watershed…………….…………………… 171 C12.4 Header Information for Tables C12.2 and C12.3…………………………..…… 172 C12.5 TMDL Total Load Computation……………………………………………… 173 C12.6 Sediment Load Allocation by Land Use/Source ……………………….……… 174 List of Figures Page C12.1 Mill Creek Sub-basin #1 ………………………………………………….…. 166 C12.2 Reference Watershed ………………………………………………………… 169
164

EXECUTIVE SUMMARY The Mill Creek sub-watershed is located in Bucks County and is about 4.7 square miles in size. The protected uses of the watershed are water supply, recreation, and aquatic life. Its aquatic use is cold water fishes and migratory fishes. Total Maximum Daily Loads (TMDLs) apply to 8.7 miles of streams in this sub-basin (Stream Segment ID#s 20000525-1017-GLW, 20010417-GLW, 20010426-1512-GLW, and 980609-1425-GLW). They were developed to address the impairments noted on the Pennsylvania’s 2002 Clean Water act Section 303(d) List. The listed impairments include siltation and flow alterations from surface mining, siltation and flow alterations from urban runoff/storm sewers, siltation and flow alterations from small residential runoff, and nutrients from a municipal point source. This TMDL focuses on control of sediments. A TMDL for flow alterations was not developed because neither the U.S. Environmental Protection Agency (EPA) or PaDEP currently have water quality criteria for this impairment. Furthermore, quantitative measures for water flow variability or alterations as “impairments” are not currently available. However, it was assumed for these segments that addressing sediment loads through the use of urban BMPs will at the same time reduce water flow variability or alterations within the watershed. The nutrient impairment from the municipal point source is dealt with in another section (Section D). Pennsylvania does not currently have water quality criteria for sediment. For this reason, we developed a reference watershed approach to identify the TMDL endpoints or water quality objectives for sediment in the impaired segments of the Mill Creek sub-watershed. Based upon comparison to a similar, non-impaired watershed, it was estimated that the sediment loading that will meet the water quality objectives for the Mill Creek sub-watershed is 1,735,682 pounds per year. It is assumed that the streams in this sub-basin will support designated aquatic life uses when this value is met. The TMDL for the sub-watershed is allocated as shown in the table below.
Summary of TMDL for the Mill Creek Sub-Watershed (lbs/yr)
Pollutant TMDL MOS WLA LA LNR ALA Sediment 1,735,682 173,568 1,562,114 - - -
The TMDL has been allocated to all non-point sources of upland and stream bank erosion, with 10% of the TMDL total load reserved as a margin of safety (MOS). In this case, all sediment loads were assigned to the waste load allocation (WLA) category. The TMDL covers a total of 8.7 miles of streams within the Mill Creek sub-watershed, and establishes a reduction for total sediment loading of 28% from the current annual loading of 2,181,460 pounds/year.
165
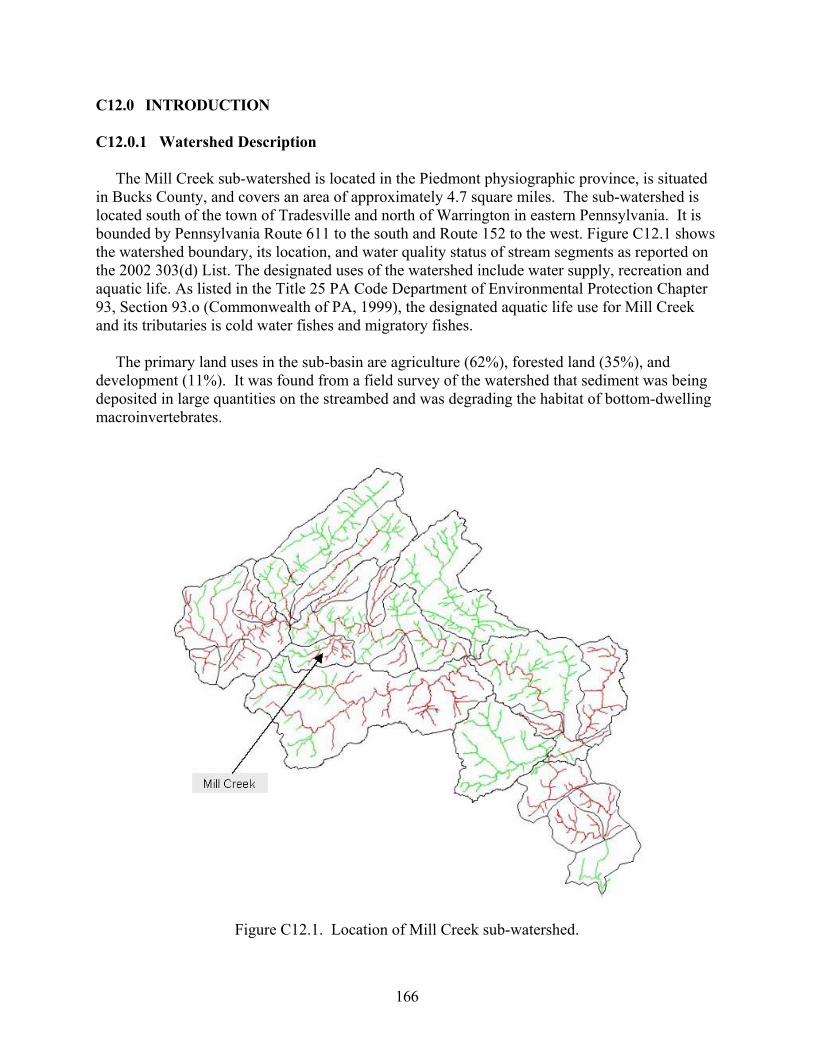
C12.0 INTRODUCTION C12.0.1 Watershed Description The Mill Creek sub-watershed is located in the Piedmont physiographic province, is situated in Bucks County, and covers an area of approximately 4.7 square miles. The sub-watershed is located south of the town of Tradesville and north of Warrington in eastern Pennsylvania. It is bounded by Pennsylvania Route 611 to the south and Route 152 to the west. Figure C12.1 shows the watershed boundary, its location, and water quality status of stream segments as reported on the 2002 303(d) List. The designated uses of the watershed include water supply, recreation and aquatic life. As listed in the Title 25 PA Code Department of Environmental Protection Chapter 93, Section 93.o (Commonwealth of PA, 1999), the designated aquatic life use for Mill Creek and its tributaries is cold water fishes and migratory fishes. The primary land uses in the sub-basin are agriculture (62%), forested land (35%), and development (11%). It was found from a field survey of the watershed that sediment was being deposited in large quantities on the streambed and was degrading the habitat of bottom-dwelling macroinvertebrates.
Figure C12.1. Location of Mill Creek sub-watershed.
166

The surficial geology of the Mill Creek sub-watershed consists of a shale formation. The bedrock geology primarily affects surface runoff and background nutrient loads through its influences on soils and landscape as well as fracture density and directional permeability. Soils are mostly sandy and very erodible, as indicated by a high average K factor (0.37). Watershed characteristics are summarized in Table C12.1.
Table C12.1. Physical Characteristic Comparisons between the Mill Creek
and Reference Watersheds
Attribute
Reference Watershed Mill Creek Watershed
Physiographic Province Piedmont Piedmont Area (square miles) 4.7 2.6 Predominant Land Uses -Agriculture (62%)
-Forested land (20%) -Developed (11%)
-Agriculture (48%) -Forested land (37%) -Developed (8%)
Predominant Geology Shale (100%) Sandstone (100%) C C Soils - Dominant HSG
- K Factor 0.37 0.37 20-Year Average Rainfall (in) 40.4 40.4
3.7 3.3 20-Year Average Runoff (in) C12.0.2 Surface Water Quality
Channel erosion and scour that occur in waterways and receiving waters located in urban and suburban areas may also be an important source of sediments. Channel erosion is primarily the
A Total Maximum Daily Load or TMDL was developed for the Mill Creek sub-watershed to address the impairments noted on the Pennsylvania’s 2002 Clean Water Act Section 303(d) List (see Table A1 in section A1.0). It was previously determined that Mill Creek and its tributaries were not meeting their designated water quality uses for protection of aquatic life in 2001. As a consequence, Pennsylvania listed 6.9 miles of streams in this sub-watershed (Stream Segment ID#s 20000525-1017-GLW, 20010426-1512-GLW, and 980609-1425-GLW) on the 2002 Section 303(d) List of Impaired Waters as being impaired by siltation and flow alteration from mining operations, urban runoff/storm sewers, and small residential development. Sediments, which are often the cause of stream impairment in urban and suburban areas, are primarily from two sources: disturbed land and unprotected soils at construction sites, and stream channel erosion. Transitional land uses, mainly new construction sites, are one of the main sources of sediments in streams draining newly developed areas. Sediment production and sedimentation in streams are typically important during the construction phase because soils are disturbed and exposed to detachment by raindrops and transported during storm events. Construction also renders landscapes unstable and cause soil to move in “sheets” and localized landslides during storm events.
167

result of elevated storm water runoff during storm events caused by increased impervious surfaces from residential, commercial and industrial areas; construction sites; roads; highways; and bridges in the watershed (Horner, 1994). Basically, impervious areas and disturbed land restrict water infiltration thus converting more rainfall into runoff during storm events. The visible impact of elevated storm runoff includes fallen trees, eroded and exposed stream banks, siltation, floating litter and debris, and turbid conditions in streams. All these conditions were observed during a reconnaissance survey of the watershed. In conclusion, addressing storm water runoff and sediment production at new construction sites through the use of management practices will assure that aquatic life use is achieved and maintained in the watershed. Without effective storm water management practices and sediment traps, build-up of sediments will continue to occur.
C12.1 APPROACH TO TMDL DEVELOPMENT C12.1.1 TMDL Endpoints The TMDL discussed herein address sediment. Because neither Pennsylvania nor EPA have water quality criteria for sediment, we had to develop a method to determine water quality objectives for these parameters that would result in the impaired stream segments attaining their designated uses. The method employed for this TMDL is termed the “reference watershed approach.” With the reference watershed approach, two watersheds are compared, with one attaining its uses and one that is impaired based on biological assessment. Both watersheds must have similar land use/cover distributions. Other features such as base geologic formation should be matched to the greatest extent possible; however, most variations can be adjusted in the model. The objective of the process is to reduce the loading rate of nutrients and sediments in the impaired stream segment to a level equivalent to or slightly lower than the loading rate in the non-impaired, reference stream segment. The underlying assumption is that this load reduction will allow the biological community to return to the impaired stream segments. The TMDL endpoints established for this analysis were determined using Watson Creek as the reference watershed. These endpoints are discussed in detail in the TMDL section. The listing for impairment caused by siltation is addressed through reduction of the sediment load. A detailed explanation of this process is included in the following section.
C12.1.2 Selection of the Reference Watershed In general, three factors should be considered when selecting a suitable reference watershed. The first factor is to use a watershed that has been assessed by the Department using the Unassessed Waters Protocol and has been determined to be attaining sufficient water quality to satisfy designated uses. The second factor is to find a watershed that closely resembles the Mill Creek subwatershed in terms of physical properties such as land cover/land use, physiographic province, and geology. Finally, the size of the reference watershed should be within 20-30% of the impaired watershed area. The search for a reference watershed that would satisfy the above characteristics was done by means of a desktop screening using several GIS coverages including the Multi-Resolution Land Characteristics (MRLC) Landsat-derived land cover/use grid, the Pennsylvania’s 305(b) assessed streams database, and geologic rock types.
168
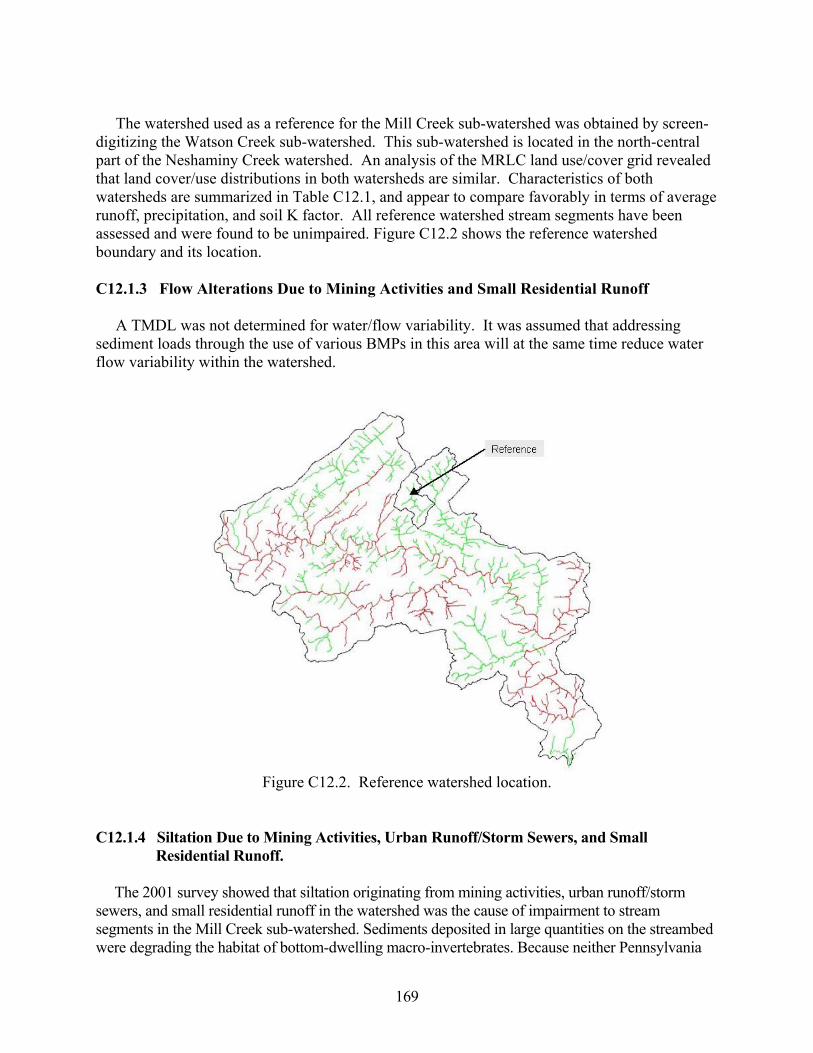
The watershed used as a reference for the Mill Creek sub-watershed was obtained by screen-digitizing the Watson Creek sub-watershed. This sub-watershed is located in the north-central part of the Neshaminy Creek watershed. An analysis of the MRLC land use/cover grid revealed that land cover/use distributions in both watersheds are similar. Characteristics of both watersheds are summarized in Table C12.1, and appear to compare favorably in terms of average runoff, precipitation, and soil K factor. All reference watershed stream segments have been assessed and were found to be unimpaired. Figure C12.2 shows the reference watershed boundary and its location. C12.1.3 Flow Alterations Due to Mining Activities and Small Residential Runoff A TMDL was not determined for water/flow variability. It was assumed that addressing sediment loads through the use of various BMPs in this area will at the same time reduce water flow variability within the watershed.
Figure C12.2. Reference watershed location.
C12.1.4 Siltation Due to Mining Activities, Urban Runoff/Storm Sewers, and Small Residential Runoff. The 2001 survey showed that siltation originating from mining activities, urban runoff/storm sewers, and small residential runoff in the watershed was the cause of impairment to stream segments in the Mill Creek sub-watershed. Sediments deposited in large quantities on the streambed were degrading the habitat of bottom-dwelling macro-invertebrates. Because neither Pennsylvania
169

nor EPA has water quality criteria for sediments, we had to develop a method to determine water quality objectives for this parameter that would result in the impaired stream segments attaining their designated uses. The objective of the TMDL process for this sub-watershed is to reduce the average loading rate of sediment to the impaired stream segments to levels equivalent to or slightly lower than the average loading rate in the reference watershed. It is assumed that this load reduction will allow the biological community to return to the impaired stream segments. The TMDL endpoints established for this analysis are discussed in detail in the TMDL section. The listing for impairments caused by siltation is addressed through reduction of the sediment loads. C12.1.5 Nutrients from Municipal Point Source Nutrient impairments due to a municipal point source in the sub-watershed are not addressed in this section. Rather, they are dealt with in a following section on point source impairments (Section D). C12.1.6 Watershed Assessment and Modeling The AVGWLF model was run for both the Mill Creek and reference watersheds to establish loading conditions under existing land use/cover conditions in each watershed using the refined parameter estimates based on the calibration results. Based on the use of 20 years of historical weather data, the mean annual sediment loads for the impaired and reference watersheds were calculated as shown in Tables C12.2 and C12.3, respectively. Table C12.4 presents an explanation of the header information contained in Tables C12.2 and C12.3. Modeling output for Mill Creek Sub-basin #1 and the reference watershed is presented in Appendix F.
170
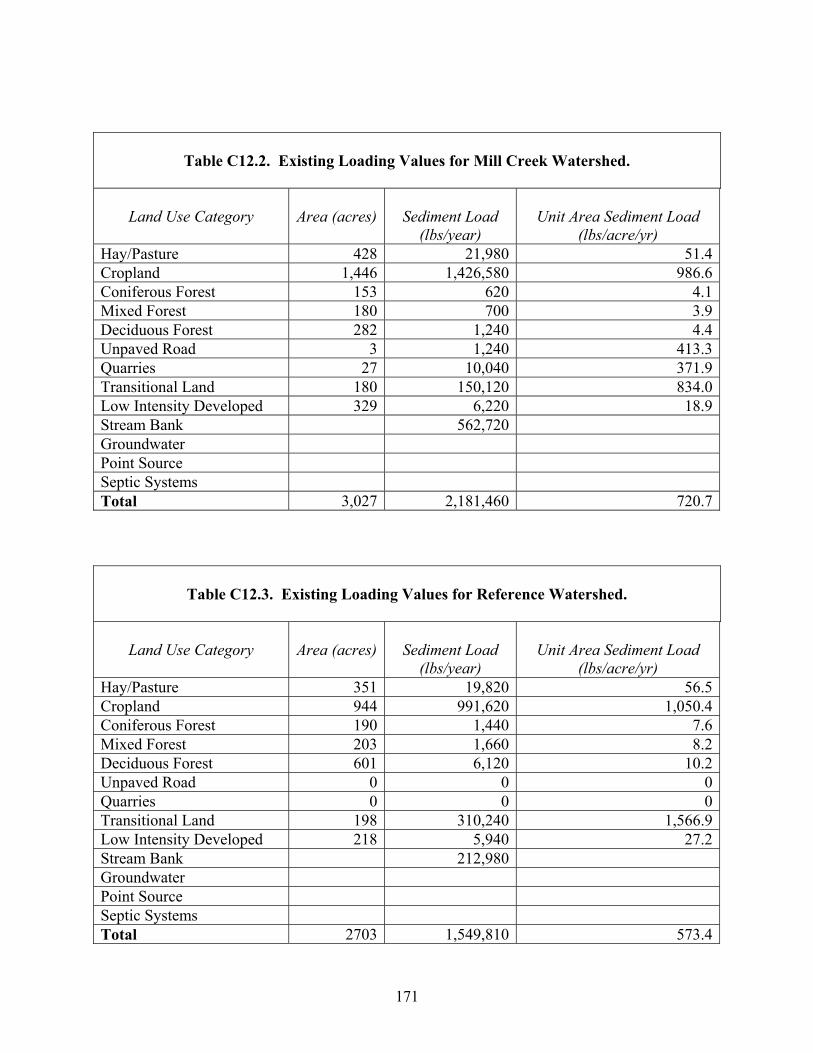
Table C12.2. Existing Loading Values for Mill Creek Watershed.
Land Use Category
Area (acres)
Sediment Load (lbs/year)
Unit Area Sediment Load
(lbs/acre/yr) Hay/Pasture 428 21,980 51.4Cropland 1,446 1,426,580 986.6Coniferous Forest 153 620 4.1Mixed Forest 180 700 3.9Deciduous Forest 282 1,240 4.4Unpaved Road 3 1,240 413.3Quarries 27 10,040 371.9Transitional Land 180 150,120 834.0Low Intensity Developed 329 6,220 18.9Stream Bank 562,720Groundwater Point Source Septic Systems Total 3,027 2,181,460 720.7
Table C12.3. Existing Loading Values for Reference Watershed.
Land Use Category
Area (acres)
Sediment Load (lbs/year)
Unit Area Sediment Load
(lbs/acre/yr) Hay/Pasture 351 19,820 56.5Cropland 944 991,620 1,050.4
190 1,440 7.6Mixed Forest 203 1,660 8.2Deciduous Forest 601 6,120 10.2Unpaved Road 0 0 0Quarries 0 0 0Transitional Land 198 310,240 1,566.9Low Intensity Developed 218 5,940 27.2Stream Bank 212,980Groundwater Point Source Septic Systems
2703 1,549,810 573.4
Coniferous Forest
Total
171

Table C12.4. Header Information for Tables C12.2 and C12.3.
Land Use Category The land cover classification that was obtained by from the MRLC
database Area (acres) The area of the specific land cover/land use category found in the
watershed. Sediment Load The estimated total sediment loading that reaches the outlet point of the
watershed that is being modeled. Expressed in lbs./year. Unit Area Sediment Load
The estimated loading rate for sediment for a specific land cover/land use category. Loading rate is expressed in lbs/acre/year
C12.2 LOAD ALLOCATION PROCEDURE FOR SEDIMENT TMDL
TMDL is the TMDL total load. The LA (load allocation) is the portion of Equation (1) that is typically assigned to non-point sources. The MOS (margin of safety) is the portion of loading that is reserved to account for any uncertainty in the data and computational methodology used for the analysis. The WLA (Waste Load Allocation) is the portion of this equation that is typically assigned to point sources. However, as described below, this category was used to reflect sediment loads from all sources in this particular watershed. This was done for two primary reasons: 1) because “urban runoff/storm sewers” and “small residential runoff” were listed as primary sources of sediment to impaired stream segments in this watershed, and 2) to be consistent with EPA guidance on how to handle sediment loads in urbanized watersheds. Details of how specific components of the overall TMDL calculation were derived are presented below.
The load allocation and reduction procedures were applied to the entire area of the Mill Creek sub-watershed. The load reduction calculations in this area are based on the current loading rates for sediment in the reference watershed. Based on biological assessment, it was determined that the reference watershed was attaining its designated uses. Sediment loading rates were computed for the reference watershed using the AVGWLF model. These loading rates were then used as the basis for establishing the TMDL for the Mill Creek sub-watershed. The basic equation defining a TMDL for sediment is as follows:
TMDL = MOS + LA + WLA (1)
C12.2.1 Sediment TMDL Total Load The first step was to determine the TMDL total target load for the impaired watershed. This value was obtained by multiplying the sediment unit area loading rate of the reference watershed by the total area of the Mill Creek sub-watershed. This information is presented in Table C12.5.
172

Table C12.5. TMDL Total Load Computation
Type of Pollutant
Unit Area Loading Rate in Reference Watershed
(lbs/acre/yr)
Total Watershed Area in Mill Creek Sub-basin #1
(acres)
TMDL Total Load
(lbs/yr) Sediment 573.4 3027 1,735,682
C12.2.2 Margin of Safety The Margin of Safety (MOS) for this analysis is explicit. Ten percent of the TMDL was reserved as the MOS. MOS (Sediment): 1,735,682 lbs/yr x 0.1 = 173,568 lbs/yr (2) C12.2.3 Waste Load Allocation For the purposes of this TMDL assessment, sediment loads from all sources have been assigned to the waste load allocation (WLA) category to be consistent with EPA guidance on how to handle sediment loads in urbanized watersheds to which MS4 regulations apply. Therefore, the load allocation (LA) in this caser is equal to zero. Allowing for an explicit 10% MOS, the target WLA is recomputed as: WLA (Sediment) = 1,735,682 lbs/yr – 173,568 lbs/yr = 1,562,114 lbs/yr (3) Tables that can be used to cross-reference sub-areas with municipalities in the Neshaminy Creek basin, as well as a summary of sediment-related WLAs, can be found in Appendix E. A map showing the overlap between sub-basin and municipal boundaries within the entire Neshaminy Creek basin is also included in this same appendix. C12.2.4 Load Reduction Procedures The allocation of sediment among contributing sources in the Mill Creek sub-watershed was done by reducing each source equally on a percentage basis. Based on the target WLA of 1,562,114 lbs/year described above, the computed load allocations are as shown in Table C12.4. The total allowable sediment loads to stream segments in the Mill Creek sub-watershed when all sources are considered is 1,562,114 pounds per year. In order for the stream segments to attain their specific uses, total sediment loads should be reduced from 2,181,460 pounds per year by a factor of 28%.
173
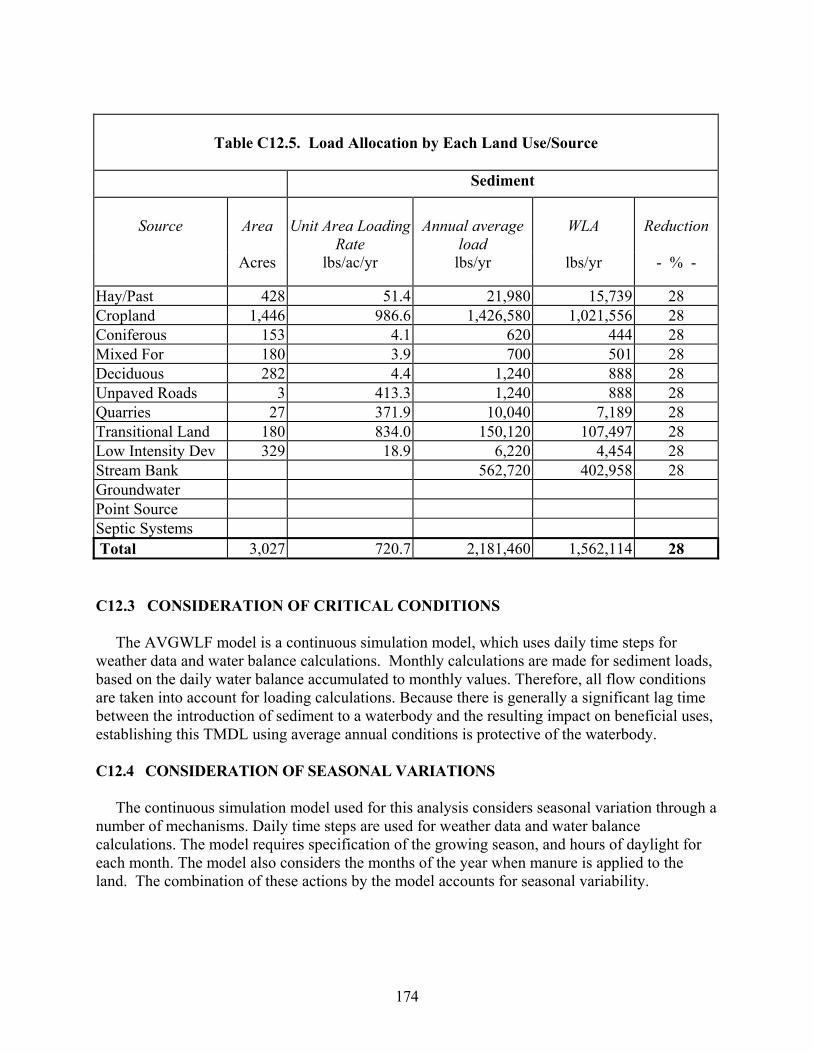
Table C12.5. Load Allocation by Each Land Use/Source
Sediment
Source
Area
Unit Area Loading
Rate
Annual average
load
WLA
Reduction
Acres lbs/ac/yr lbs/yr lbs/yr - % -
Hay/Past 428 51.4 21,980 15,739 28 Cropland 1,446 986.6 1,426,580 1,021,556 28
4.1 6203.9 700 28
Deciduous 282 888 28 4.4 1,240413.3 1,240 888 28
Quarries 27 371.9 10,040 7,189 28 Transitional Land 180 834.0 150,120 107,497 28 Low Intensity Dev 329 18.9 6,220 4,454 28 Stream Bank 562,720 28 402,958
Total 3,027 1,562,114 720.7 2,181,460 28
Coniferous 153 444 28 Mixed For 180 501
Unpaved Roads 3
Groundwater Point Source Septic Systems
C12.3 CONSIDERATION OF CRITICAL CONDITIONS The AVGWLF model is a continuous simulation model, which uses daily time steps for weather data and water balance calculations. Monthly calculations are made for sediment loads, based on the daily water balance accumulated to monthly values. Therefore, all flow conditions are taken into account for loading calculations. Because there is generally a significant lag time between the introduction of sediment to a waterbody and the resulting impact on beneficial uses, establishing this TMDL using average annual conditions is protective of the waterbody. C12.4 CONSIDERATION OF SEASONAL VARIATIONS The continuous simulation model used for this analysis considers seasonal variation through a number of mechanisms. Daily time steps are used for weather data and water balance calculations. The model requires specification of the growing season, and hours of daylight for each month. The model also considers the months of the year when manure is applied to the land. The combination of these actions by the model accounts for seasonal variability.
174

C12.5 REASONABLE ASSURANCE OF IMPLEMENTATION
Sediment reductions in the TMDL are allocated to all sources of upland and stream bank erosion in the watershed. Implementation of best management practices (BMPs) in the affected areas to increase infiltration and sediment control measures should achieve the loading reduction goals established in the TMDL. Substantial reductions in the amount of sediment reaching the streams can be made through the installation of drainage controls such as detention ponds, sediment ponds, infiltration pits, dikes, riparian buffers, stream bank stabilization and ditches in the watershed . These BMPs range in efficiency from 20% to 70% for sediment reduction. The implementation of such BMPs will likely occur in the watershed as a result of PaDEP’s Proposed Comprehensive Stormwater Management Policy. When approved, this new policy will require affected communities to implement BMPs to address stormwater control that will “reduce pollutant loadings to streams, recharge groundwater tables, enhance stream base flow during times of drought and reduce the threat of flooding and stream bank erosion resulting from storm events.” Over the next year and one-half, PaDEP will be developing a “Phase II” program for NPDES discharges from small construction sites, additional industrial activities, and for the 700 municipalities subject to the requirements for separate storm sewer systems (MS4). All of the municipalities located within the Mill Creek watershed will be affected by this policy, which has been included in Appendix E. Tables that can be used to cross-reference sub-areas with municipalities in the Neshaminy Creek basin, as well as a summary of sediment-related WLAs, can be found in Appendix E. A map showing the overlap between sub-basin and municipal boundaries within the entire Neshaminy Creek basin is also included in this same appendix. Implementation of BMPs aimed at sediment reduction will also assist in the reduction of phosphorus originating from transitional land uses and stream bank erosion. C12.6 PUBLIC PARTICIPATION Notice of the draft TMDL will be published in the PA Bulletin and local newspapers with a 30-day comment period provided. A public meeting with watershed residents will be held to discuss the TMDL. Notice of final TMDL approval will be posted on the Department website.
175

C13.0 Total Maximum Daily Load (TMDL) Development Plan for Core Creek
176

Table of Contents Page Executive Summary ……………………………………………………………….……. 179 C13.0 Introduction ……………………………………………………………….……. 180 C13.0.1 Watershed Description …………………………………………….…. 180
C13.2.3 Load Allocation……………………………………………………….. 186
C13.5 Reasonable Assurance of Implementation ………………………………………. 189
C13.0.2 Surface Water Quality ………………………………………………... 181 C13.1 Approach to TMDL Development………………………………………………. 181 C13.1.1 TMDL Endpoints……………………………………………………… 181 C13.1.2 Selection of the Reference Watershed………………………………… 182 C13.1.3 Siltation from Agricultural Activities………………………………… 182 C13.1.4 Watershed Assessment and Modeling…………………………………. 183 C13.2 Load Allocation Procedure for Sediment TMDLs ……………..………………… 185 C13.2.1 Sediment TMDL Total Load ………………………………………..… 185 C13.2.2 Margin of Safety ………………………………………...……………. 186
C13.2.4 Adjusted Load Allocation……………………………………………… 186 C13.2.5 Load Reduction Procedures……………………………………………. 187 C13.3 Consideration of Critical Conditions ……………………………………………. 188 C13.4 Consideration of Seasonal Variations …………………………………..……….. 189
C13.6 Public Participation ……………………………………………………………… 189
177
List of Tables Page C13.1 Physical Characteristic Comparisons between Core Creek and Reference Watersheds………………………….……………………….. 181 C13.2 Loading Values for Core Creek Watershed………………………………….. 184 C13.3 Loading Values for the Reference Watershed…………….…………………. 184 C13.4 Header Information for Tables C14.2 and C14.3………………………..…… 185
C13.6 Summary of TMDL for Core Creek Watershed ……………..…………....… 187
C13.5 TMDL Total Load Computation…………………………………………….. 186
C13.7 Load Allocation by Contributing Sources……………………………………. 188 C13.8 Load Allocation by Land Use/Sources……………………………………….. 188
List of Figures Page C13.1 Core Creek Watershed ……………….………………………………….…. 180 C13.2 Reference Watershed ……..………………………………………………… 183
178
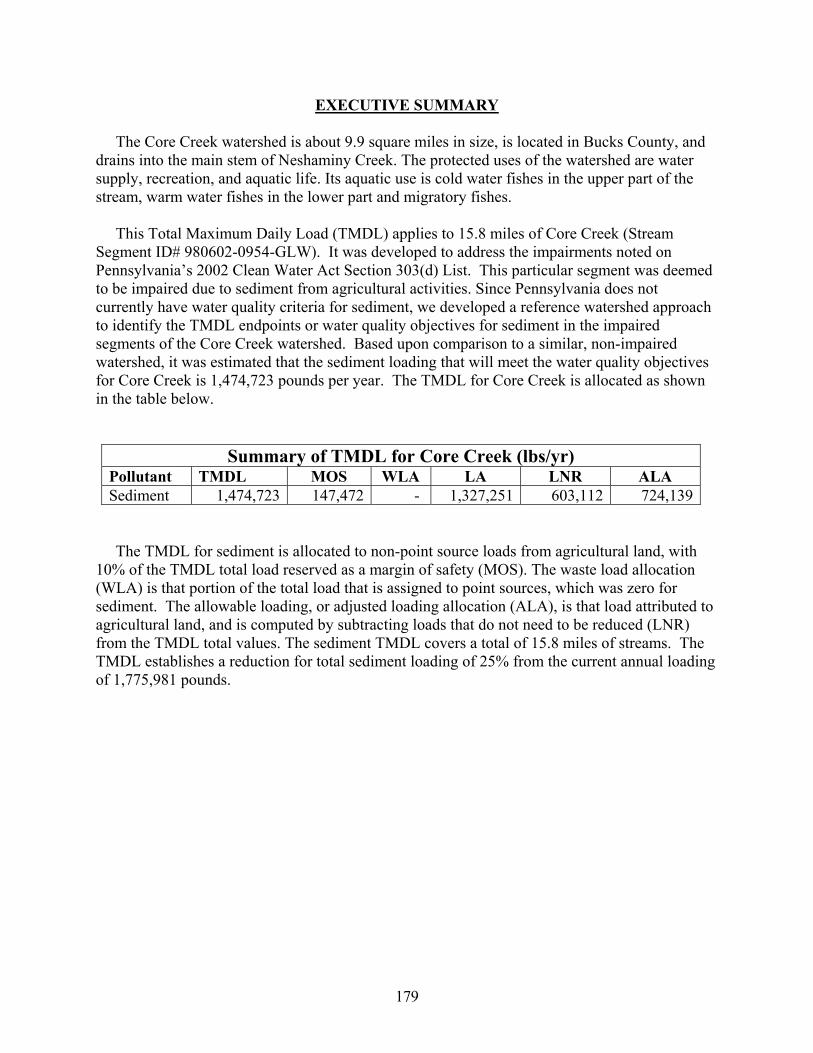
EXECUTIVE SUMMARY The Core Creek watershed is about 9.9 square miles in size, is located in Bucks County, and drains into the main stem of Neshaminy Creek. The protected uses of the watershed are water supply, recreation, and aquatic life. Its aquatic use is cold water fishes in the upper part of the stream, warm water fishes in the lower part and migratory fishes. This Total Maximum Daily Load (TMDL) applies to 15.8 miles of Core Creek (Stream Segment ID# 980602-0954-GLW). It was developed to address the impairments noted on Pennsylvania’s 2002 Clean Water Act Section 303(d) List. This particular segment was deemed to be impaired due to sediment from agricultural activities. Since Pennsylvania does not currently have water quality criteria for sediment, we developed a reference watershed approach to identify the TMDL endpoints or water quality objectives for sediment in the impaired segments of the Core Creek watershed. Based upon comparison to a similar, non-impaired watershed, it was estimated that the sediment loading that will meet the water quality objectives for Core Creek is 1,474,723 pounds per year. The TMDL for Core Creek is allocated as shown in the table below.
Summary of TMDL for Core Creek (lbs/yr) MOS WLA ALA
Sediment 1,474,723 603,112 147,472 - 1,327,251 724,139Pollutant TMDL LA LNR
The TMDL for sediment is allocated to non-point source loads from agricultural land, with 10% of the TMDL total load reserved as a margin of safety (MOS). The waste load allocation (WLA) is that portion of the total load that is assigned to point sources, which was zero for sediment. The allowable loading, or adjusted loading allocation (ALA), is that load attributed to agricultural land, and is computed by subtracting loads that do not need to be reduced (LNR) from the TMDL total values. The sediment TMDL covers a total of 15.8 miles of streams. The TMDL establishes a reduction for total sediment loading of 25% from the current annual loading of 1,775,981 pounds.
179
C13.0 INTRODUCTION
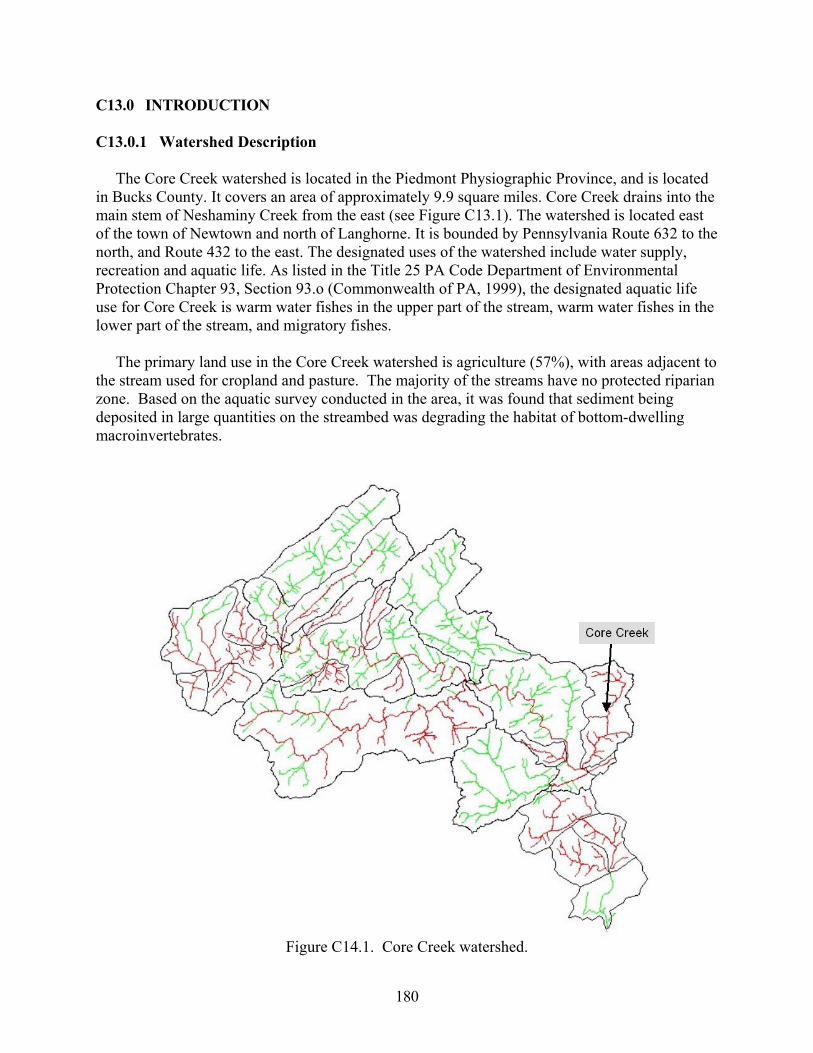
The Core Creek watershed is located in the Piedmont Physiographic Province, and is located in Bucks County. It covers an area of approximately 9.9 square miles. Core Creek drains into the main stem of Neshaminy Creek from the east (see Figure C13.1). The watershed is located east of the town of Newtown and north of Langhorne. It is bounded by Pennsylvania Route 632 to the north, and Route 432 to the east. The designated uses of the watershed include water supply, recreation and aquatic life. As listed in the Title 25 PA Code Department of Environmental Protection Chapter 93, Section 93.o (Commonwealth of PA, 1999), the designated aquatic life use for Core Creek is warm water fishes in the upper part of the stream, warm water fishes in the lower part of the stream, and migratory fishes.
C13.0.1 Watershed Description
The primary land use in the Core Creek watershed is agriculture (57%), with areas adjacent to the stream used for cropland and pasture. The majority of the streams have no protected riparian zone. Based on the aquatic survey conducted in the area, it was found that sediment being deposited in large quantities on the streambed was degrading the habitat of bottom-dwelling macroinvertebrates.
Figure C14.1. Core Creek watershed.
180

The surficial geology of Core Creek watershed consists of a sandstone formation. The bedrock geology primarily affects surface runoff and background nutrient loads through its influences on soils and landscape as well as fracture density and directional permeability. Soils are mostly sandy and very erodible, as indicated by a high average K factor (0.38). Watershed characteristics are summarized in Table C13.1.
Table C13.1. Physical Characteristic Comparisons between the Core Creek
and Reference Watersheds
Attribute
Core Creek Watershed
Reference Watershed
Physiographic Province Piedmont Piedmont 9.9 8.4
Predominant Land Uses Agriculture (57%) Agriculture (50%) Predominant Geology Sandstone (90%)
Shale (10%) Shale (90%) Carbonate (10%)
C C Soils - Dominant HSG - K Factor 0.38 0.37 20-Year Average Rainfall (in) 40.5 40.6 20-Year Average Runoff (in) 4.1
Area (square miles)
4.3 C13.0.2 Surface Water Quality A Total Maximum Daily Load or TMDL was developed for the Core Creek watershed to address the impairments noted on the Pennsylvania’s 2002 Clean Water Act Section 303(d) List (see Table A1 in section A1.0). The 2001 survey found that that the stream was impaired. As a consequence, Pennsylvania listed Core Creek on the 2002 Section 303(d) List of Impaired Waters. The 2002 303 (d) List reported 15.8 miles of Core Creek (Stream Segment ID# 980602-0954-GLW) to be impaired by siltation from agricultural activities in the watershed. C13.1 APPROACH TO TMDL DEVELOPMENT C13.1.1 TMDL Endpoints The TMDL described herein addresses sediment impairments. Because neither Pennsylvania nor EPA has water quality criteria for sediments, we had to develop a method to determine water quality objectives for this parameter that would result in the impaired stream segments attaining their designated uses. The method employed for this TMDL is termed the “reference watershed approach.” With the reference watershed approach, two watersheds are compared, with one attaining its uses and one that is impaired based on biological assessment. Both watersheds must have similar land use/cover distributions. Other features such as base geologic formation should be
181
matched to the greatest extent possible; however, most variations can be adjusted in the model. The objective of the process is to reduce the loading rate of sediments in the impaired stream segment to a level equivalent to or slightly lower than the loading rate in the non-impaired, reference stream segment. The underlying assumption is that this load reduction will allow the biological community to return to the impaired stream segments.
C13.1.2 Selection of the Reference Watershed In general, three factors should be considered when selecting a suitable reference watershed. The first factor is to use a watershed that has been assessed by the Department using the Unassessed Waters Protocol and has been determined to attain water quality standards. The second factor is to find a watershed that closely resembles the Core Creek watershed in physical properties such as land cover/land use, physiographic province, and geology. Finally, the size of the reference watershed should be within 20-30% of the impaired watershed area. The search for a reference watershed that would satisfy the above characteristics was done by means of a desktop screening using several GIS data layers including the Multi-Resolution Land Characteristics (MRLC) Landsat-derived land cover/use grid, the Pennsylvania’s 305(b) assessed streams database, and geologic rock types. The reference used for the Core Creek watershed is the Mill Creek watershed located in the north-central part of Neshaminy Creek (not to be confused with the other Mill Creek located farther upstream as discussed in the previous section). Both watersheds are located in the same physiographic Province and State Water Plan, and are tributaries of Neshaminy Creek. Table C13.1 compares the two watersheds in terms of their size, location, and other physical characteristics. All reference watershed stream segments have been assessed and were found to be unimpaired. Figure C13.2 shows the reference watershed boundary and its location in Bucks County. An analysis of the landuse/cover layer revealed that land cover/use distributions in both watersheds are similar. The surficial geology of the Core Creek and reference watersheds is somewhat different, but it is not expected that this would significantly affect sediment loads in either case.
C13.1.3 Siltation Due to Agricultural Sources The 2001 survey showed that siltation originating from agricultural activities in the watershed was the cause of impairment of Core Creek stream segments. Sediments deposited in large quantities on the streambed were degrading the habitat of bottom-dwelling macroinvertebrates. This TMDL addresses sediments from agricultural activities.
182
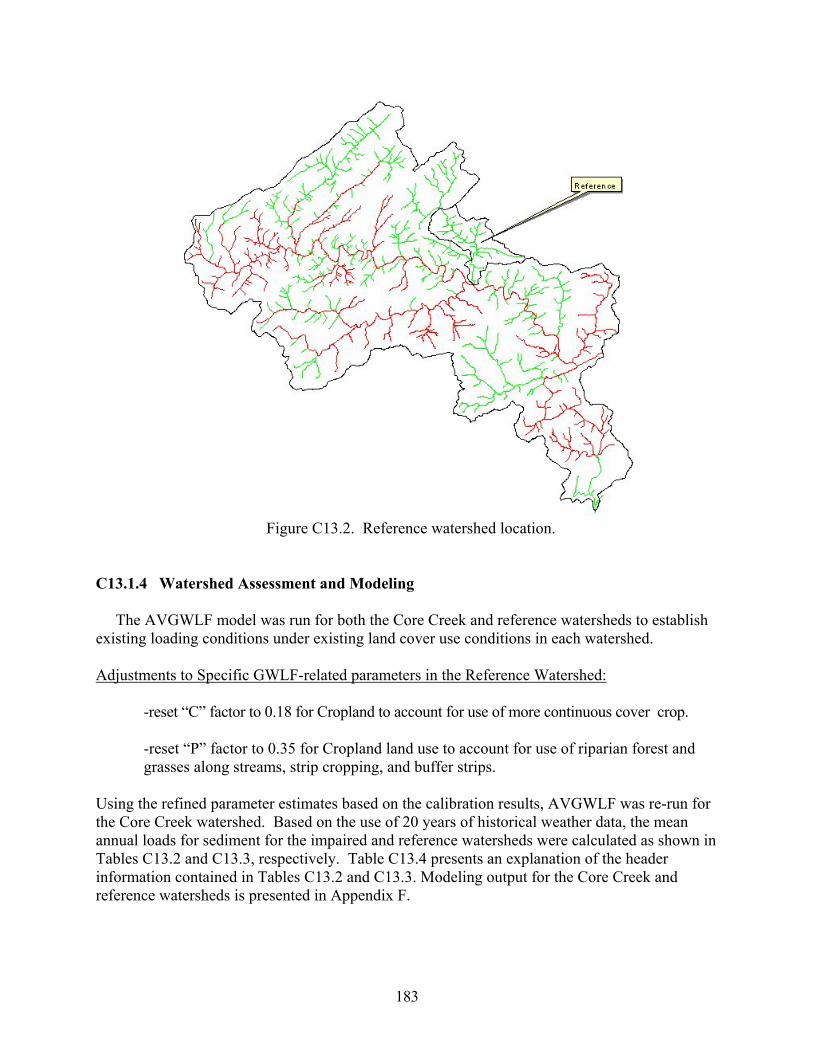
Figure C13.2. Reference watershed location.
C13.1.4 Watershed Assessment and Modeling The AVGWLF model was run for both the Core Creek and reference watersheds to establish existing loading conditions under existing land cover use conditions in each watershed.
Adjustments to Specific GWLF-related parameters in the Reference Watershed:
-reset “C” factor to 0.18 for Cropland to account for use of more continuous cover crop. -reset “P” factor to 0.35 for Cropland land use to account for use of riparian forest and grasses along streams, strip cropping, and buffer strips.
Using the refined parameter estimates based on the calibration results, AVGWLF was re-run for the Core Creek watershed. Based on the use of 20 years of historical weather data, the mean annual loads for sediment for the impaired and reference watersheds were calculated as shown in Tables C13.2 and C13.3, respectively. Table C13.4 presents an explanation of the header information contained in Tables C13.2 and C13.3. Modeling output for the Core Creek and reference watersheds is presented in Appendix F.
183

Table C13.2. Loading Values for Core Creek Watershed
Land Use Category
Area (acres) Sediment Load
(lbs/year) Unit Area Sediment Load
(lbs/acre/yr) Hay/Pasture 956 28,079 29.37Cropland 2,415 1,144,790 474.03Coniferous Forest 30 0.7322
7281,022 2,230
24,106 29.22Hi Intensity Developed 205 4,503 21.97Stream Bank 571,523
Point Source Septic Systems Total 5,889 1,775,981 301.58
Mixed Forest 437 1.67Deciduous Forest 2.18Lo Intensity Developed 825
Groundwater
Table C13.3. Loading Values for the Reference Watershed
Land Use Category Area (acres) Unit Area Sediment Load
(lbs/acre/yr) Sediment Load
(lbs/year) 464 18,168 39.16
2,202 331.37Coniferous Forest 12 110 9.17Mixed Forest
10,574 5.14Transition 2 1,766 883Lo Intensity Developed 136 4,790 35.22Hi Intensity Developed 18 287 15.94Stream Bank 557,616Groundwater Point Source Septic Systems Total 5,287 1,323,995 250.42
Hay/Pasture Cropland 729,669
336 1,015 3.02Deciduous Forest 2,057
184
Table C13.4. Header Information for Tables C13.2 and C13.3.
Land Use Category The land cover classification that was obtained by from the MRLC
database Area (acres) The area of the specific land cover/land use category found in the
watershed. The estimated total sediment loading that reaches the outlet point of the watershed that is being modeled. Expressed in lbs./year.
Unit Area Sediment Load
The estimated loading rate for sediment for a specific land cover/land use category. Loading rate is expressed in lbs/acre/year
Sediment Load
The equations defining TMDLs for sediment are as follows:
TMDL = MOS + LA + WLA (1) LA = ALA - LNR (2)
C13.2 LOAD ALLOCATION PROCEDURE FOR SEDIMENT TMDL
The load allocation and reduction procedures were applied to the entire Core Creek watershed. The watershed was too small to subdivide it into meaningful sub-watersheds. Therefore, sub-watershed load allocations were not performed. The load reduction calculations for the Core Creek watershed are based on the current loading rates for sediment in the reference watershed. Based on the biological assessment, it was determined that the reference watershed was attaining its designated uses. The sediment loading rate was computed for the reference watershed using the AVGWLF model. This loading rate was then used as the basis for establishing the TMDL for the Core Creek watershed.
TMDL is the TMDL total load. The LA (load allocation) is the portion of Equation (1) that is assigned to non-point sources. The MOS (margin of safety) is the portion of loading that is reserved to account for any uncertainty in the data and computational methodology used for the analysis. The WLA (Waste Load Allocation) is the portion of this equation that is assigned to point sources. The adjusted load allocation (ALA) is the load originating from sources (Equation 2) that needs to be reduced by the non-contributing sources (LNR) for Core Creek to meet water quality goals. Therefore, it is the load that originates from agricultural sources that have contributed to water quality problems encountered in the watershed. Details of TMDL, MOS, LA, LNR, and ALA computations are presented below. C13.2.1 Sediment TMDL Total Load
The first step was to determine the TMDL total target load for Core Creek, the impaired watershed. This value was obtained by multiplying the sediment unit area loading rate in the
185

reference watershed by the total watershed area of the Core Creek watershed. This information is presented in Table C13.5.
Table C13.5. TMDL Total Load Computation
Unit Area Loading Rate in Reference Watershed
(lbs/acre/yr)
Type of Pollutant Total Watershed Area for
Core Creek (acres)
TMDL Total Load
(lbs/yr) Sediment 250.42 5,889 1,474,723
C13.2.2 Margin of Safety The Margin of Safety (MOS) for this analysis is explicit. Ten percent of the TMDL was reserved as the MOS.
ALA (Sediments) = 1,327,251 lbs/yr – 603,112 lbs/yr = 724,139 lbs/yr (7)
Table C13.6 below presents TMDL results for the Core Creek watershed.
MOS (Sediment): 1,474,723 lbs/yr x 0.1 = 147,472 lbs/yr (4) C13.2.3 Load Allocation The load allocation (LA), consisting of all nonpoint source loads in the watershed, was computed by subtracting the margin of safety and the waste load allocation (WLA) from the TMDL total load. (Note that sediments do not have a waste load allocation in this case). LA (Sediments): 1,474,723 lbs/yr – 147,472 lbs/yr = 1,327,251 lbs/yr (5) C13.2.4 Adjusted Load Allocation The adjusted load allocation (ALA) is the actual load allocation for sources that will need reductions. It is computed by subtracting loads from non-point sources that are not considered in the reduction scenario (LNR). These are loads from all non-point sources in Table C13.2 except those from agricultural land uses (Hay/Pasture, Row Crops). Therefore, using data in Table C13.2, LNR (Sediments) = 22 lbs/yr + 728 lbs/yr 2230 lb/yr + 24,106 lb/yr + 4,503lbs/yr + 571,523 lbs/yr = 603,112 lbs/y r (6)
186

Table C13.6. Summary of TMDL for Core Creek (lbs/yr)
Pollutant TMDL MOS WLA LA LNR ALA Sediment 1,474,723 147,472 - 1,327,251 603,112 724,139
The ALA computed above is the portion of the load that is available to allocate among contributing sources (Hay/Pasture, Cropland) as described in the next step. Not all land use/source categories were included in the allocation because they are difficult to control, or provide an insignificant portion of the total load (e.g., transitional land use). The following section shows the allocation process in detail for the entire watershed. C13.2.5 Load Reduction Procedures Sediment loads obtained in the previous step were allocated among the remaining land use/sources of the impaired watershed according to the Equal Marginal Percent Reduction (EMPR) method. EMPR is carried out using an Excel Worksheet in the following manner:
3) Each land use/source load is compared with the total allocable load to determine if any contributor would exceed the allocable load by itself. The evaluation is
carried out as if each source is the only contributor to the pollutant load to the receiving waterbody. If the contributor exceeds the allocable load, that contributor would be reduced to the allocable load. This is the baseline portion of EMPR.
4) After any necessary reductions have been made in the baseline the multiple analysis is run. The multiple analysis will sum all of the baseline loads and compare them to the total allocable load. If the allocable load is exceeded, an
any necessary reductions in the multiple analysis, the final reduction percentage
The load allocation and EMPR procedures were performed using an Excel Worksheet, and results are presented in Appendix G. Results of the load allocation by contributing sources are presented in Table C13.7. Table C13.8 provides load allocation by considering all land uses in the Core Creek watershed. In this case, land uses/sources that were not part of the allocation are carried through at their existing loading values. (Again, it is important to note that Core Creek only has one stream segment. Therefore, sub-watersheds could not be delineated. As a result, load allocation by sub-watersheds was not performed.)
equal percent reduction will be made to all contributors’ baseline values. After
for each contributor can be computed.
187
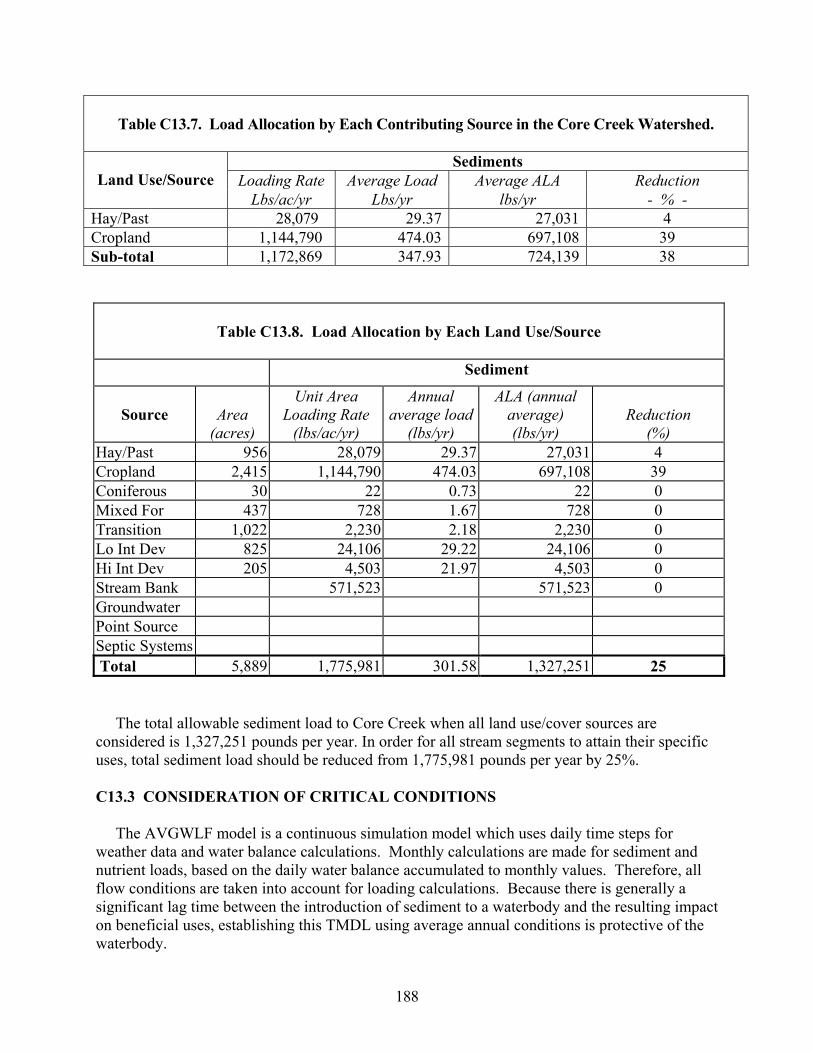
Table C13.7. Load Allocation by Each Contributing Source in the Core Creek Watershed.
Sediments Loading Rate Average Load Average ALA Reduction
Land Use/Source
Lbs/ac/yr Lbs/yr lbs/yr - % - Hay/Past 28,079 29.37 27,031 4 Cropland 1,144,790 697,108 474.03 39 Sub-total 1,172,869 347.93 724,139 38
Table C13.8. Load Allocation by Each Land Use/Source
Sediment
Source
Area
(acres)
ALA (annual average) (lbs/yr)
Unit Area Loading Rate
(lbs/ac/yr)
Annual average load
(lbs/yr)
Reduction
(%) 956 28,079 29.37 27,031
Cropland 2,415 1,144,790 474.03 697,108 39 Coniferous 30 22 0.73 22 0 Mixed For 437 728 728 0 1.67Transition 1,022 2,230 2.18 2,230 0 Lo Int Dev 825 24,106 29.22 24,106 0
4,503 21.97 4,503 0 Stream Bank 571,523
Point Source Septic Systems Total 5,889 1,775,981 301.58 1,327,251 25
Hay/Past 4
Hi Int Dev 205 571,523 0
Groundwater
The total allowable sediment load to Core Creek when all land use/cover sources are considered is 1,327,251 pounds per year. In order for all stream segments to attain their specific uses, total sediment load should be reduced from 1,775,981 pounds per year by 25%. C13.3 CONSIDERATION OF CRITICAL CONDITIONS The AVGWLF model is a continuous simulation model which uses daily time steps for weather data and water balance calculations. Monthly calculations are made for sediment and nutrient loads, based on the daily water balance accumulated to monthly values. Therefore, all flow conditions are taken into account for loading calculations. Because there is generally a significant lag time between the introduction of sediment to a waterbody and the resulting impact on beneficial uses, establishing this TMDL using average annual conditions is protective of the waterbody.
188
C13.4 CONSIDERATION OF SEASONAL VARIATIONS The continuous simulation model used for this analysis considers seasonal variation through a number of mechanisms. Daily time steps are used for weather data and water balance calculations. The model requires specification of the growing season, and hours of daylight for each month. The model also considers the months of the year when manure is applied to the land. The combination of these actions by the model accounts for seasonal variability. C13.5 REASONABLE ASSURANCE OF IMPLEMENTATION
C13.6 PUBLIC PARTICIPATION
Notice of the draft TMDL will be published in the PA Bulletin and local newspapers with a 30 day comment period provided. A public meeting with watershed residents will be held to discuss the TMDL. Notice of final TMDL approval will be posted on the Department website.
The pollutant reductions in the TMDL are allocated entirely to agricultural activities in the watershed. Implementation of best management practices (BMPs) in the affected areas should achieve the loading reduction goals established in the TMDL. Substantial reductions in the amount of sediment reaching the streams can be made through the planting of riparian buffer zones, contour strips, and cover crops. These BMPs range in efficiency from 20% to 70% for sediment reduction. Implementation of BMPs aimed at sediment reduction will also assist in the reduction of phosphorus. Other possibilities for attaining the desired reductions in sediment include streambank stabilization and fencing. Further field verification will be performed in order to assess both the extent of existing BMPs, and to determine the most cost-effective and environmentally protective combination of BMPs required to meet the sediment reductions outlined in this section.
189
C14.0 Total Maximum Daily Load (TMDL) Development Plan for Neshaminy Creek South #1 Watershed
190
Table of Contents Page Executive Summary …………………………………………………………………….. 193 C14.0 Introduction ……………………….……………………………………….……. 194 C14.0.1 Watershed Description …………………………………………….….. 194 C14.0.2 Surface Water Quality ……………………………………………….… 195 C14.1 Approach to TMDL development ………………………………………………. 195
C14.1.2 Selection of the Reference Watershed………………………………….. 196
C14.1.4 Watershed Assessment and Modeling…………………………………. 196
C14.1.1 TMDL Endpoints………………………………………………………. 195
C14.1.3 Siltation Due to Development………………………………………….. 196
C14.2 Load Allocation Procedure for Sediment TMDL ………………..……………… 199 C14.2.1 Sediment TMDL Total Load ………………………………………..… 199 C14.2.2 Margin of Safety ………………………………………………………. 200 C14.2.3 Waste Load Allocation ………………………………………………… 200 C14.2.4 Load Reduction Procedures …………………………………………… 200 C14.3 Consideration of Critical Conditions ……………………………………………. 201 C14.4 Consideration of Seasonal Variations …………………………………..……….. 201 C14.5 Reasonable Assurance of Implementation ………………………………………. 202 C14.6 Public Participation ………………………………………………….…………… 202
191
List of Tables Page C14.1 Physical Characteristic Comparisons Between Neshaminy Creek
South #1 and Reference Watersheds…...……………………………. …. 195 C14.2 Loading Values for Neshaminy Creek South #1 Watershed….…….……….….. 198 C14.3 Loading Values for the Reference Watershed…………….…………. ………… 198 C14.4 Header Information for Tables C15.2 and C15.3……………………………….. 199 C14.5 TMDL Total Load Computation………………………………………………… 200
C14.6 Load Allocation for each Land Use/Source…………………………………….. 201
List of Figures Page
C14.1 Neshaminy Creek South #1 Watershed ………………………..…………….… 194 C14.2 Reference Watershed …………………………………………..……………… 197
192

EXECUTIVE SUMMARY The Neshaminy Creek South #1 watershed is approximately 7.6 square miles in size. It is in Bucks County, and includes a portion of the main stem of Neshaminy Creek in the lower part of the Neshaminy Creek watershed, as well as several smaller tributaries that flow into it. The protected uses of streams in the watershed are water supply, recreation, and aquatic life. Their aquatic uses include warm water fishes and migratory fishes. The Total Maximum Daily Load (TMDL) applies to 7.6 miles of streams in this watershed (Stream Segment ID#s 20010525-1250-GLW). A TMDL was developed to address the impairments noted on Pennsylvania’s 2002 Clean Water Act Section 303(d) List. In this case, this segment was deemed to be impaired by siltation from development (“urban runoff/storm sewers”) in the watershed. Since Pennsylvania does not currently have water quality criteria for sediment, it was necessary to develop a reference watershed approach to identify the TMDL endpoints or water quality objectives for sediment in the impaired segments of the watershed. Based upon comparison to a similar, non-impaired watershed, it was estimated that the amount of sediment loading to the watershed that will meet the water quality objectives for streams therein is 2,394,456 pounds per year. The TMDL for the Neshaminy Creek South #1 watershed is allocated as shown in the table below.
Summary of TMDLs for Neshaminy Creek South #1 (lbs/yr)
Pollutant TMDL MOS WLA LA LNR ALA Sediments 2,394,456 239,446 2,155,010 - - -
The TMDL for sediment is allocated to all non-point sources of upland and stream bank erosion, with 10% of the TMDL total load reserved as a margin of safety (MOS). In this case, all sediment loads were assigned to the waste load allocation (WLA) category. The sediment TMDL covers a total of 7.6 miles of stream, and establishes a reduction for total sediment loading of 30% from the current annual loading of 3,073,400 pounds.
193

C14.0 INTRODUCTION C14.0.1 Watershed Description The watershed contains part of the main stem of Neshaminy Creek (Stream Segment ID# 467), as well as several small tributaries that flow into it. The watershed is located in the Piedmont Physiographic Province, is situated in Bucks County, and is approximately 7.4 square miles in size. The watershed covers the towns of South Hampton, Langhorne, and Middletown. It is bounded by Pennsylvania Route 213 to the north and Route 1 to the south. Figure C14.1 shows the watershed boundary and its location. The designated uses of the watershed include water supply, recreation and aquatic life. As listed in the Title 25 PA Code Department of Environmental Protection Chapter 93, Section 93.o (Commonwealth of PA, 1999), the designated aquatic life use for the Neshaminy Creek South #1 watershed is warm water fishes and migratory fishes. The primary land use in the watershed is development (65%). As a result of aquatic surveys completed in the area, it was found that sediment deposited in large quantities on the streambed was degrading the habitat of bottom-dwelling macroinvertebrates.
Figure C14.1. Neshaminy Creek South #1 watershed.
The surficial geology of the watershed consists of sandstone and metamorphic/gneiss formations. The bedrock geology primarily affects surface runoff and background nutrient loads through its influences on soils and landscape as well as fracture density and directional permeability. Soils are mostly sandy and very erodible, as indicated by a high average K factor (0.32). Watershed characteristics are summarized in Table C14.1.
194
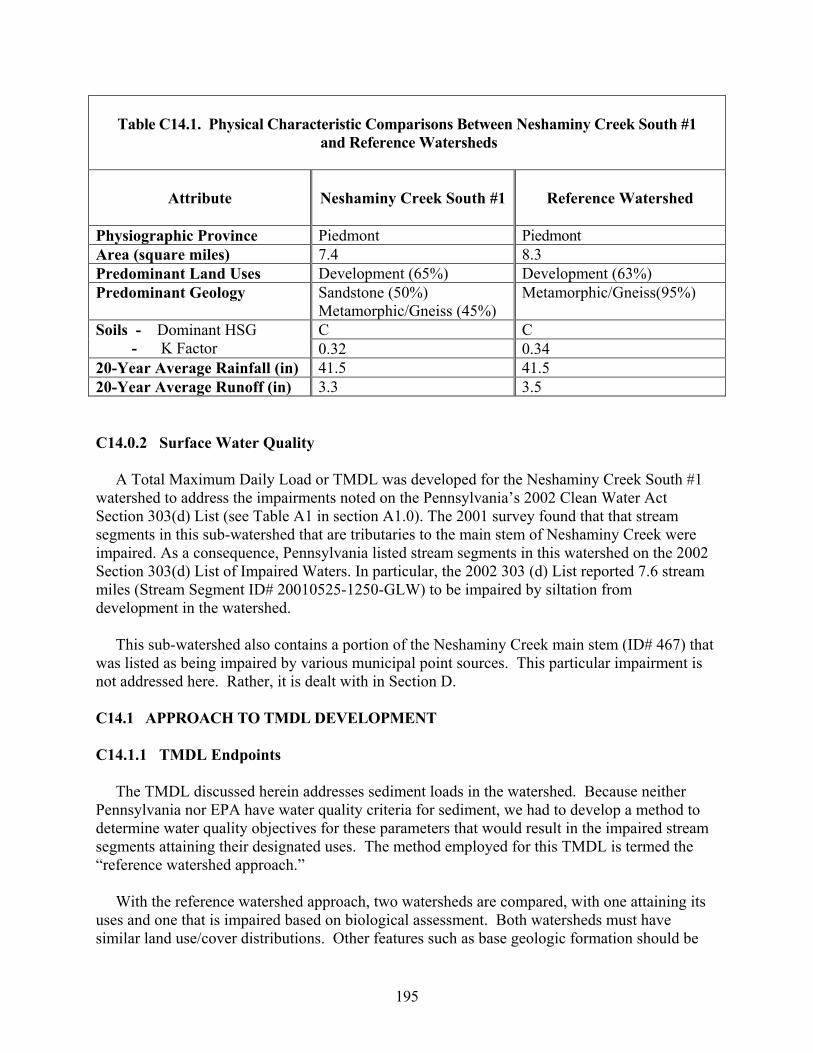
Table C14.1. Physical Characteristic Comparisons Between Neshaminy Creek South #1
and Reference Watersheds
Attribute
Neshaminy Creek South #1
Reference Watershed
Physiographic Province Piedmont Piedmont Area (square miles)
Development (65%) Sandstone (50%) Metamorphic/Gneiss(95%)
C C Soils - Dominant HSG - K Factor 0.32 0.34
41.5 41.5 20-Year Average Runoff (in)
7.4 8.3 Predominant Land Uses Development (63%) Predominant Geology
Metamorphic/Gneiss (45%)
20-Year Average Rainfall (in) 3.3 3.5
C14.0.2 Surface Water Quality A Total Maximum Daily Load or TMDL was developed for the Neshaminy Creek South #1 watershed to address the impairments noted on the Pennsylvania’s 2002 Clean Water Act Section 303(d) List (see Table A1 in section A1.0). The 2001 survey found that that stream segments in this sub-watershed that are tributaries to the main stem of Neshaminy Creek were impaired. As a consequence, Pennsylvania listed stream segments in this watershed on the 2002 Section 303(d) List of Impaired Waters. In particular, the 2002 303 (d) List reported 7.6 stream miles (Stream Segment ID# 20010525-1250-GLW) to be impaired by siltation from development in the watershed. This sub-watershed also contains a portion of the Neshaminy Creek main stem (ID# 467) that was listed as being impaired by various municipal point sources. This particular impairment is not addressed here. Rather, it is dealt with in Section D. C14.1 APPROACH TO TMDL DEVELOPMENT C14.1.1 TMDL Endpoints The TMDL discussed herein addresses sediment loads in the watershed. Because neither Pennsylvania nor EPA have water quality criteria for sediment, we had to develop a method to determine water quality objectives for these parameters that would result in the impaired stream segments attaining their designated uses. The method employed for this TMDL is termed the “reference watershed approach.” With the reference watershed approach, two watersheds are compared, with one attaining its uses and one that is impaired based on biological assessment. Both watersheds must have similar land use/cover distributions. Other features such as base geologic formation should be
195

matched to the greatest extent possible; however, most variations can be adjusted in the model. The objective of the process is to reduce the loading rate of sediments in the impaired stream segment to a level equivalent to or slightly lower than the loading rate in the non-impaired, reference stream segment. The underlying assumption is that this load reduction will allow the biological community to return to the impaired stream segments. C14.1.2 Selection of the Reference Watershed In general, three criteria should be considered when selecting a suitable reference watershed. The first criterion is to use a watershed that has been assessed by the Department using the Unassessed Waters Protocol and has been determined to attain water quality standards. The second criterion is to find a watershed that closely resembles impaired watershed in physical properties such as land cover/land use, physiographic province, and geology. Finally, the size of the reference watershed should be within 20-30% of the impaired watershed area. The search for a reference watershed that would satisfy the above characteristics was done by means of a desktop screening using several GIS coverages including the Multi-Resolution Land Characteristics (MRLC) Landsat-derived land cover/use grid, the Pennsylvania’s 305(b) assessed streams database, and geologic rock types. The watershed used as a reference for the Neshaminy Creek South #1 watershed is the Mill Creek watershed located in the lower part of the larger Neshaminy Creek watershed (not to be confused with the Mill Creek watershed located farther upstream discussed earlier in Sections 12.0 and 13.0). Both the impaired and reference watersheds are located in the same physiographic province and State Water Plan, and are tributaries of Neshaminy Creek. Table C14.1 compares the two watersheds in terms of their size, location, and other physical characteristics. All reference watershed stream segments have been assessed and were found to be unimpaired. Figure C14.2 shows the reference watershed boundary and its location in Bucks County. An analysis of the MRLC land use/cover GIS layer revealed that land cover/use distributions in both watersheds are similar. The major surficial geology in the two watersheds is somewhat different, but it is believed that this likely does not significantly affect sediment loads in either case. C14.1.3 Siltation Due to Development The 2001 survey showed that siltation originating from development was the cause of impairment of stream segments in this watershed. During the stream assessment, it was found that sediment deposited in large quantities on the streambed was degrading the habitat of bottom-dwelling macroinvertebrates. Stream bank erosion also occurred as a result of excess flow in the watershed due to a substantially high percentage of impervious areas (the watershed is 65% developed). Consequently, the TMDL discussed herein addresses sediment loads from development and from stream bank erosion. C14.1.4 Watershed Assessment and Modeling The AVGWLF model was run for both the Neshaminy Creek South #1 watershed and the reference watershed to establish existing loading conditions under existing land cover use
196

conditions in each case. Prior to running the model, historical stream water quality data for the period 4/89 to 3/96 were first used to calibrate various key parameters within the GWLF model. Such data sets are typically not available in AVGWLF-based TMDL assessments done elsewhere in Pennsylvania. In this case, however, it was felt that model calibration would provide for better simulation of localized watershed processes and conditions. A description of the calibration procedure used can be found in section B1.4 of this document.
Figure C14.2. Reference watershed location.
Using the refined parameter estimates based on the calibration results, AVGWLF was run for the both watersheds. Based on the use of 20 years of historical weather data, the mean annual sediment loads for the impaired and reference watersheds were calculated as shown in Tables C14.2 and C14.3, respectively. Table C14.4 presents an explanation of the header information contained in Tables C14.2 and C14.3. Modeling output for Neshaminy Creek South #1 watershed and the reference watershed is presented in Appendix F.
197

Table C14.2. Loading Values for Neshaminy Creek South #1 Watershed
Land Use Category
Area (acres)
Sediment Load
(lbs/year)
Unit Area Sediment Load
(lbs/acre/yr) Hay/Pasture 62 3,040 49.0Cropland 220 233,840 1,062.9Coniferous Forest 269 2,080 7.7Mixed Forest 267 2,760 10.3Deciduous Forest 699 8,600
1,255.42,355 65.5
Hi Intensity Develop 723 18,980 26.3Stream Bank 2,491,660
Total 4,720 3,073,400 651.1
12.3Transition 126 158,180Lo Intensity Develop 154,220
Groundwater Point Source Septic Systems
Table C14.3. Loading Values for the Reference Watershed
Land Use Category
(lbs/acre/yr) Area
(acres)
Sediment Load
(lbs/year)
Unit Area Sediment Load
Hay/Pasture 101 5,060 50.1Cropland 336 295,020 878.0
381 3,620Mixed Forest
754 7,580 10.1Unpaved Roads 3 1,920 640.0Transitional Land 126 168,280 1,335.6Lo Intensity Dev 3,077 221,240 71.9Hi Intensity Dev 267 8,140 30.5
Groundwater Point Source
Total 5,308 2,692,600 507.3
Coniferous Forest 9.5264 2,080 7.9
Deciduous Forest
Stream Bank 1,979,660
Septic Systems
198
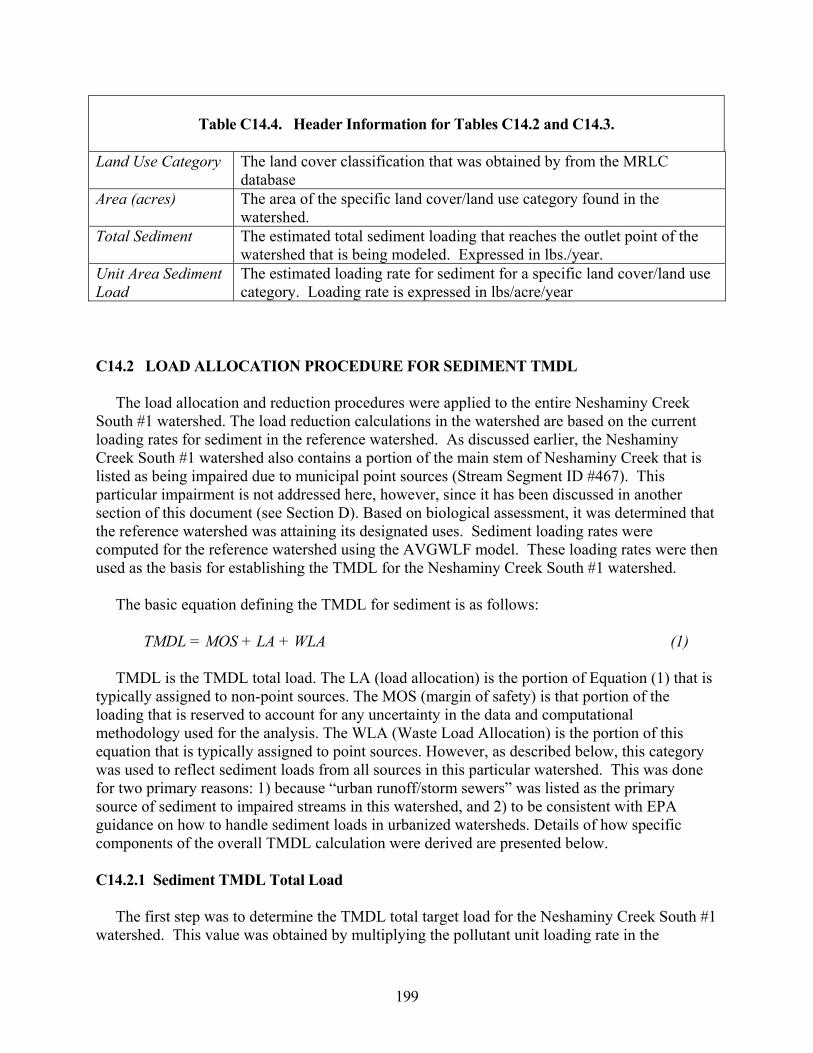
Table C14.4. Header Information for Tables C14.2 and C14.3.
Land Use Category The land cover classification that was obtained by from the MRLC
database The area of the specific land cover/land use category found in the watershed.
Total Sediment The estimated total sediment loading that reaches the outlet point of the watershed that is being modeled. Expressed in lbs./year.
Unit Area Sediment Load
The estimated loading rate for sediment for a specific land cover/land use category. Loading rate is expressed in lbs/acre/year
Area (acres)
TMDL = MOS + LA + WLA (1)
TMDL is the TMDL total load. The LA (load allocation) is the portion of Equation (1) that is typically assigned to non-point sources. The MOS (margin of safety) is that portion of the loading that is reserved to account for any uncertainty in the data and computational methodology used for the analysis. The WLA (Waste Load Allocation) is the portion of this equation that is typically assigned to point sources. However, as described below, this category was used to reflect sediment loads from all sources in this particular watershed. This was done for two primary reasons: 1) because “urban runoff/storm sewers” was listed as the primary source of sediment to impaired streams in this watershed, and 2) to be consistent with EPA guidance on how to handle sediment loads in urbanized watersheds. Details of how specific components of the overall TMDL calculation were derived are presented below.
C14.2 LOAD ALLOCATION PROCEDURE FOR SEDIMENT TMDL The load allocation and reduction procedures were applied to the entire Neshaminy Creek South #1 watershed. The load reduction calculations in the watershed are based on the current loading rates for sediment in the reference watershed. As discussed earlier, the Neshaminy Creek South #1 watershed also contains a portion of the main stem of Neshaminy Creek that is listed as being impaired due to municipal point sources (Stream Segment ID #467). This particular impairment is not addressed here, however, since it has been discussed in another section of this document (see Section D). Based on biological assessment, it was determined that the reference watershed was attaining its designated uses. Sediment loading rates were computed for the reference watershed using the AVGWLF model. These loading rates were then used as the basis for establishing the TMDL for the Neshaminy Creek South #1 watershed. The basic equation defining the TMDL for sediment is as follows:
C14.2.1 Sediment TMDL Total Load The first step was to determine the TMDL total target load for the Neshaminy Creek South #1 watershed. This value was obtained by multiplying the pollutant unit loading rate in the
199
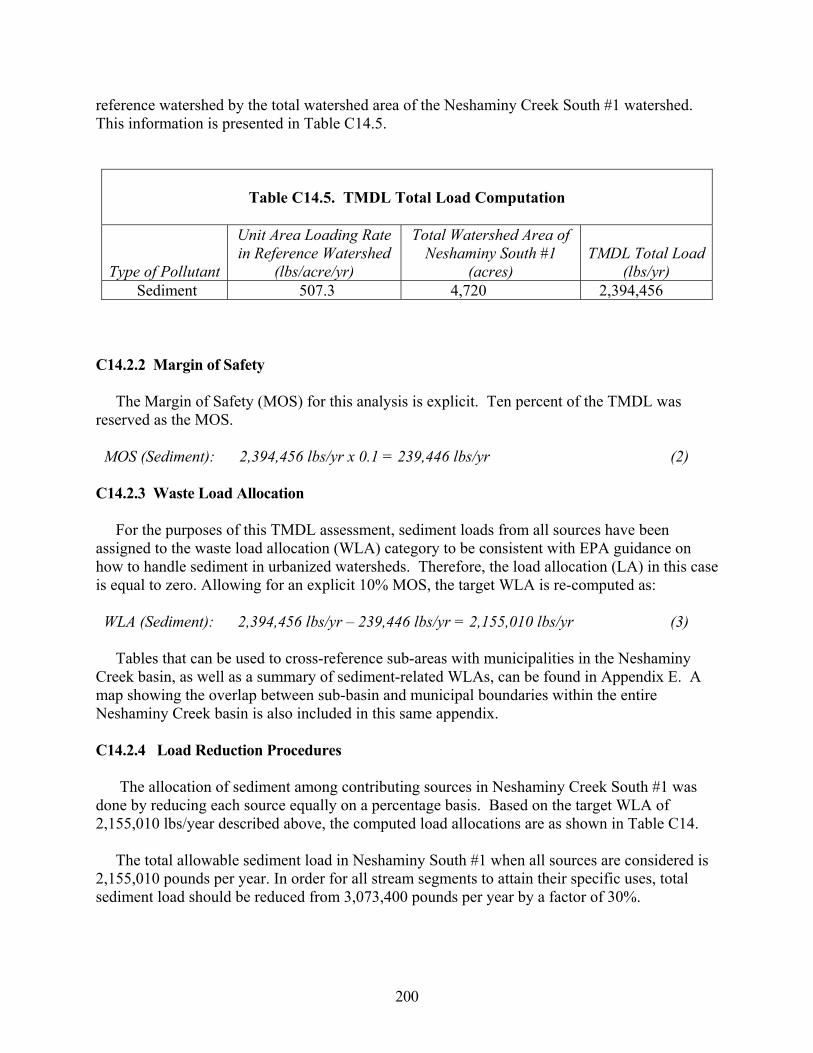
reference watershed by the total watershed area of the Neshaminy Creek South #1 watershed. This information is presented in Table C14.5.
Table C14.5. TMDL Total Load Computation
Type of Pollutant
Unit Area Loading Rate in Reference Watershed
(lbs/acre/yr)
Total Watershed Area of Neshaminy South #1
(acres)
TMDL Total Load
(lbs/yr) Sediment 507.3 4,720 2,394,456
C14.2.2 Margin of Safety
The Margin of Safety (MOS) for this analysis is explicit. Ten percent of the TMDL was reserved as the MOS.
MOS (Sediment): 2,394,456 lbs/yr x 0.1 = 239,446 lbs/yr (2)
C14.2.3 Waste Load Allocation For the purposes of this TMDL assessment, sediment loads from all sources have been assigned to the waste load allocation (WLA) category to be consistent with EPA guidance on how to handle sediment in urbanized watersheds. Therefore, the load allocation (LA) in this case is equal to zero. Allowing for an explicit 10% MOS, the target WLA is re-computed as:
WLA (Sediment): 2,394,456 lbs/yr – 239,446 lbs/yr = 2,155,010 lbs/yr (3) Tables that can be used to cross-reference sub-areas with municipalities in the Neshaminy Creek basin, as well as a summary of sediment-related WLAs, can be found in Appendix E. A map showing the overlap between sub-basin and municipal boundaries within the entire Neshaminy Creek basin is also included in this same appendix. C14.2.4 Load Reduction Procedures The allocation of sediment among contributing sources in Neshaminy Creek South #1 was done by reducing each source equally on a percentage basis. Based on the target WLA of 2,155,010 lbs/year described above, the computed load allocations are as shown in Table C14. The total allowable sediment load in Neshaminy South #1 when all sources are considered is 2,155,010 pounds per year. In order for all stream segments to attain their specific uses, total sediment load should be reduced from 3,073,400 pounds per year by a factor of 30%.
200

Table C14.6. Load Allocation by Each Land Use/Source
Source Area Annual average
load Reduction
(acres) (lbs/ac/yr) (lbs/yr) (lbs/yr) ( % )
49.0 3,040 30 1,062.9 163,964
269 2,080 1,459 Mixed Forest 267 10.3 2,760 1,934 30 Deciduous Forest 699 12.3 8,600 6,030 30 Transitional 126 1,255.4 158,180 110,136 30 Low Intensity Dev 2,355 65.5 154,220 108,136 30 High Intensity Dev 723 26.3 18,980 13,307 30 Stream Bank 2,491,660 1,747,137 30 Groundwater Point Source Septic Systems
4,720 651.1 3,073,400 2,155,010 30
Sediment
Unit Area Loading Rate
WLA (annual average)
Hay/Pasture 62 2,130 Cropland 220 233,840 30 Coniferous Forest 7.7 30
Total C14.3 CONSIDERATION OF CRITICAL CONDITIONS The AVGWLF model is a continuous simulation model which uses daily time steps for weather data and water balance calculations. Monthly calculations are made for sediment and nutrient loads, based on the daily water balance accumulated to monthly values. Therefore, all flow conditions are taken into account for loading calculations. Because there is generally a significant lag time between the introduction of sediment and nutrients to a waterbody and the resulting impact on beneficial uses, establishing these TMDLs using average annual conditions is protective of the waterbody. C14.4 CONSIDERATION OF SEASONAL VARIATIONS The continuous simulation model used for this analysis considers seasonal variation through a number of mechanisms. Daily time steps are used for weather data and water balance calculations. The model requires specification of the growing season, and hours of daylight for each month. The model also considers the months of the year when manure is applied to the land. The combination of these actions by the model accounts for seasonal variability.
201

C14.5 REASONABLE ASSURANCE OF IMPLEMENTATION
Sediment reductions in the TMDL are allocated to all sources of upland and stream bank erosion in the watershed. Implementation of best management practices (BMPs) in the affected areas to increase infiltration and sediment control measures should achieve the loading reduction goals established in the TMDL. Substantial reductions in the amount of sediment reaching the streams can be made through the installation of drainage controls such as detention ponds, sediment ponds, infiltration pits, dikes, riparian buffers, stream bank stabilization and ditches in the watershed . These BMPs range in efficiency from 20% to 70% for sediment reduction. The implementation of such BMPs will likely occur in the watershed as a result of PaDEP’s Proposed Comprehensive Stormwater Management Policy. When approved, this new policy will require affected communities to implement BMPs to address stormwater control that will “reduce pollutant loadings to streams, recharge groundwater tables, enhance stream base flow during times of drought and reduce the threat of flooding and stream bank erosion resulting from storm events.” Over the next year and one-half, PaDEP will be developing a “Phase II” program for NPDES discharges from small construction sites, additional industrial activities, and for the 700 municipalities subject to the requirements for separate storm sewer systems (MS4). All of the municipalities located within the Mill Creek watershed will be affected by this policy, which has been included in Appendix E. Tables that can be used to cross-reference sub-areas with municipalities in the Neshaminy Creek basin, as well as a summary of sediment-related WLAs, can be found in Appendix E. A map showing the overlap between sub-basin and municipal boundaries within the entire Neshaminy Creek basin is also included in this same appendix. Implementation of BMPs aimed at sediment reduction will also assist in the reduction of phosphorus originating from transitional land uses and stream bank erosion. C14.6 PUBLIC PARTICIPATION Notice of the draft TMDL will be published in the PA Bulletin and local newspapers with a 30 day comment period provided. A public meeting with watershed residents will be held to discuss the TMDL. Notice of final TMDL approval will be posted on the Department website.
202

C15.0 Total Maximum Daily Loads (TMDL) Development Plan for Neshaminy
Creek South #2 Watershed
203
Table of Contents Page Executive Summary ………………………………………………………….……… 206 C15.0 Introduction ………………………………………………………….……..… 207 C15.0.1 Watershed Description …………………………………..….……… 207 C15.0.2 Surface Water Quality ………………………………………..….... 208 C15.1 Approach to TMDL Development..………………………….………………. 208 C15.1.1 TMDL Endpoints…………………………………………………… 208 C15.1.2 Selection of the Reference Watershed………………………………. 209
C15.2.1 TMDL Total Loads ……..…..……………………………………. 213
C15.3 Consideration of Critical Conditions ………………………………………… 215
C15.1.3 Water/Flow Variability from Urban Runoff/Storm ……………….. 210 C15.1.4 Nutrients from Agricultural Sources..………………..……………… 210
C15.1.5 Watershed Assessment and Modeling………………………………. 210 C15.2 Load Allocation Procedure for Nutrients/Sediment TMDL ……….………….. 212
C15.2.2 Margin of Safety ………………………………………...………… 213 C15.2.3 Load Allocation …………………………………..……….……….. 213 C15.2.4 Adjusted Load Allocation…………………………………………… 213 C15.2.5 Load Reduction Procedures ………………………………..……… 214
C15.4 Consideration of Seasonal Variations …………………………………..……. 215 C15.5 Reasonable Assurance of Implementation …………………………………… 216 C15.6 Public Participation ………………………………………………………….. 216
204
List of Tables Page C15.1 Physical Characteristic comparisons between Neshaminy South #2
and Reference Watershed ……………..…………………….…….. 208 C15.2 Loading Values for West Branch Neshaminy South #2…………………… 211 C15.3 Loading Values for the Reference Watershed…….…………….…………. 211
C15.5 TMDL Total Load Computation …………………………………………... 213
C15.7 Load Allocation by each Land Use/Source………………………………… 215
C15.4 Header Information for Tables C15.2 and C15.3………………………..…. 212
C15.6 Summary of TMDL ………………………………………………………. 214
List of Figures Page C15.1 Neshaminy South #2……..………..…..…………………………………… 207 C15.2 Reference Watershed ….…………………………………………………… 210
205
EXECUTIVE SUMMARY
The Neshaminy South #2 sub-basin is about 5.4 square miles in size, and is located in southern Bucks County. This particular sub-basin consists of several unnamed tributaries to Neshaminy Creek. The protected uses of the watershed are water supply, recreation, and aquatic life. Its aquatic use is warm water fishes and migratory fishes.
The Total Maximum Daily Load (TMDL) applies to about 9.9 miles of streams within this basin (Stream Segment ID# 980713-1351-GLW). It was developed to address the impairments noted on Pennsylvania’s 1996 and 2002 Clean Water Act Section 303(d) Lists. The impairment addressed in this particular section is caused by sediment-related nutrient loads from agriculture in the watershed. A TMDL for the listed impairment of water/flow variability was not developed because neither the U.S. Environmental Protection Agency (EPA) nor PaDEP currently have water quality criteria for this impairment. Furthermore, quantitative measures for water flow variability or alterations as “impairments” are not currently available. However, it is assumed for these segments that addressing sediment loads through the use of urban BMPs will at the same time reduce water flow variability or alterations within the watershed. As discussed previously, all municipalities within the Neshaminy Creek watershed will be affected by PaDEP’s new stormwater management policy (MS4), a copy of which has been included in Appendix E.
Neshaminy South #2 (lbs/yr)
Pennsylvania does not currently have water quality criteria for sediment and nutrients. For this reason, we developed a reference watershed approach to identify the TMDL endpoints or water quality objectives for sediment and non-point source nutrients in the impaired segments of Neshaminy South #2. Since most of the phosphorus reaching impaired segments appears to be attached to sediment originating from eroded agricultural areas, it was determined that a reduction in sediment loads would also reduce phosphorus loads in this watershed. Based upon comparison to a similar, non-impaired watershed, it was estimated that the sediment loading that will meet the water quality objectives for this watershed is 1,205,913 per year. It is assumed that streams in the watershed will support their aquatic life uses when this value is met. The TMDL for Neshaminy South #2 is allocated as shown in the table below.
Summary of Sediment TMDLs for
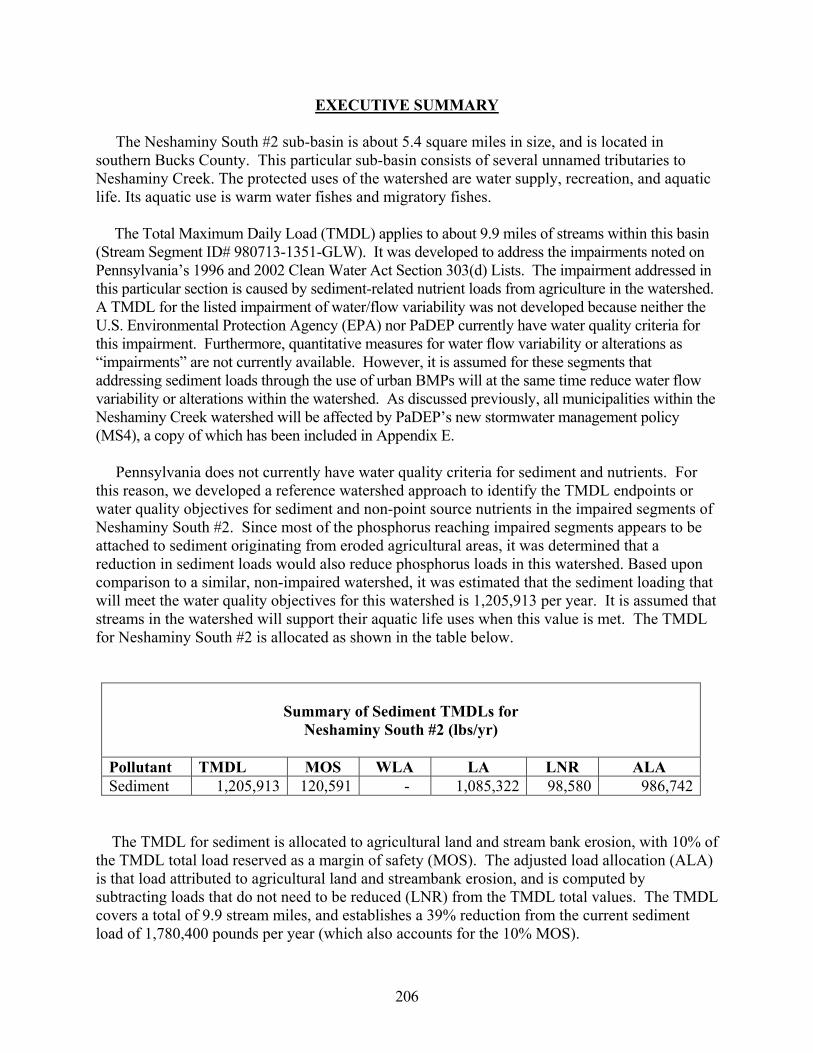
Pollutant TMDL MOS WLA LA LNR ALA Sediment 1,205,913 120,591 - 1,085,322 98,580 986,742
The TMDL for sediment is allocated to agricultural land and stream bank erosion, with 10% of the TMDL total load reserved as a margin of safety (MOS). The adjusted load allocation (ALA) is that load attributed to agricultural land and streambank erosion, and is computed by subtracting loads that do not need to be reduced (LNR) from the TMDL total values. The TMDL covers a total of 9.9 stream miles, and establishes a 39% reduction from the current sediment load of 1,780,400 pounds per year (which also accounts for the 10% MOS).
206
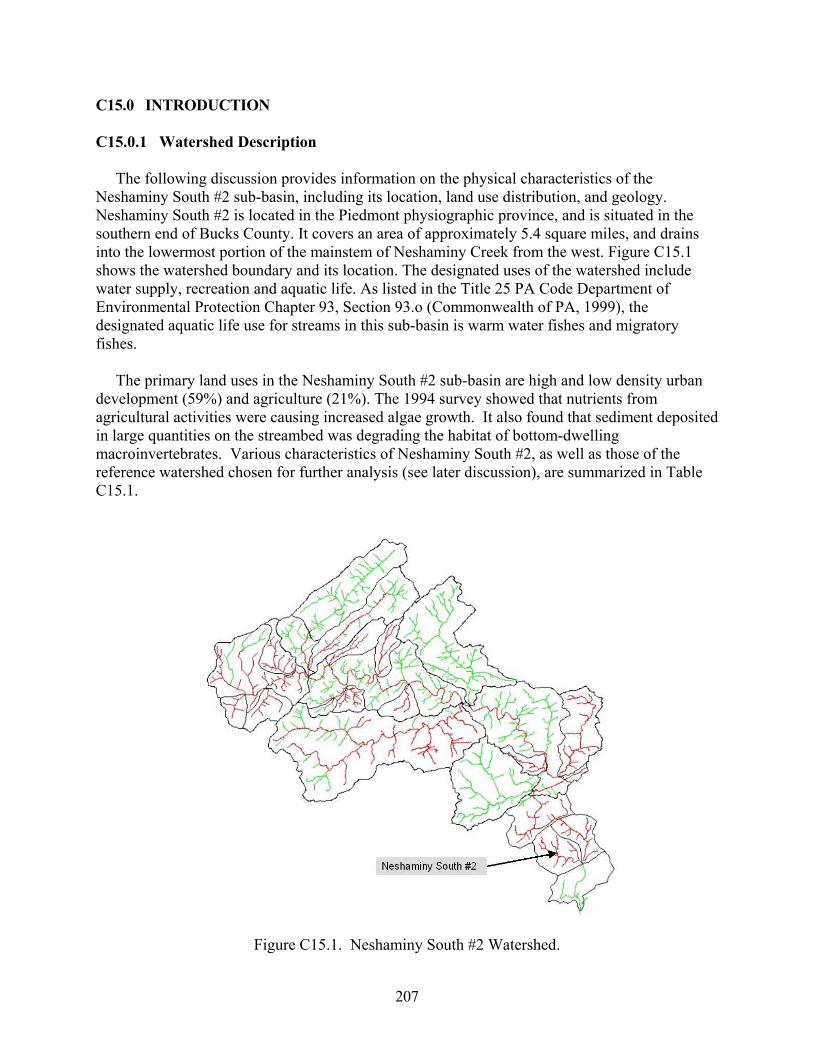
C15.0 INTRODUCTION C15.0.1 Watershed Description The following discussion provides information on the physical characteristics of the Neshaminy South #2 sub-basin, including its location, land use distribution, and geology. Neshaminy South #2 is located in the Piedmont physiographic province, and is situated in the southern end of Bucks County. It covers an area of approximately 5.4 square miles, and drains into the lowermost portion of the mainstem of Neshaminy Creek from the west. Figure C15.1 shows the watershed boundary and its location. The designated uses of the watershed include water supply, recreation and aquatic life. As listed in the Title 25 PA Code Department of Environmental Protection Chapter 93, Section 93.o (Commonwealth of PA, 1999), the designated aquatic life use for streams in this sub-basin is warm water fishes and migratory fishes. The primary land uses in the Neshaminy South #2 sub-basin are high and low density urban development (59%) and agriculture (21%). The 1994 survey showed that nutrients from agricultural activities were causing increased algae growth. It also found that sediment deposited in large quantities on the streambed was degrading the habitat of bottom-dwelling macroinvertebrates. Various characteristics of Neshaminy South #2, as well as those of the reference watershed chosen for further analysis (see later discussion), are summarized in Table C15.1.
Figure C15.1. Neshaminy South #2 Watershed.
207
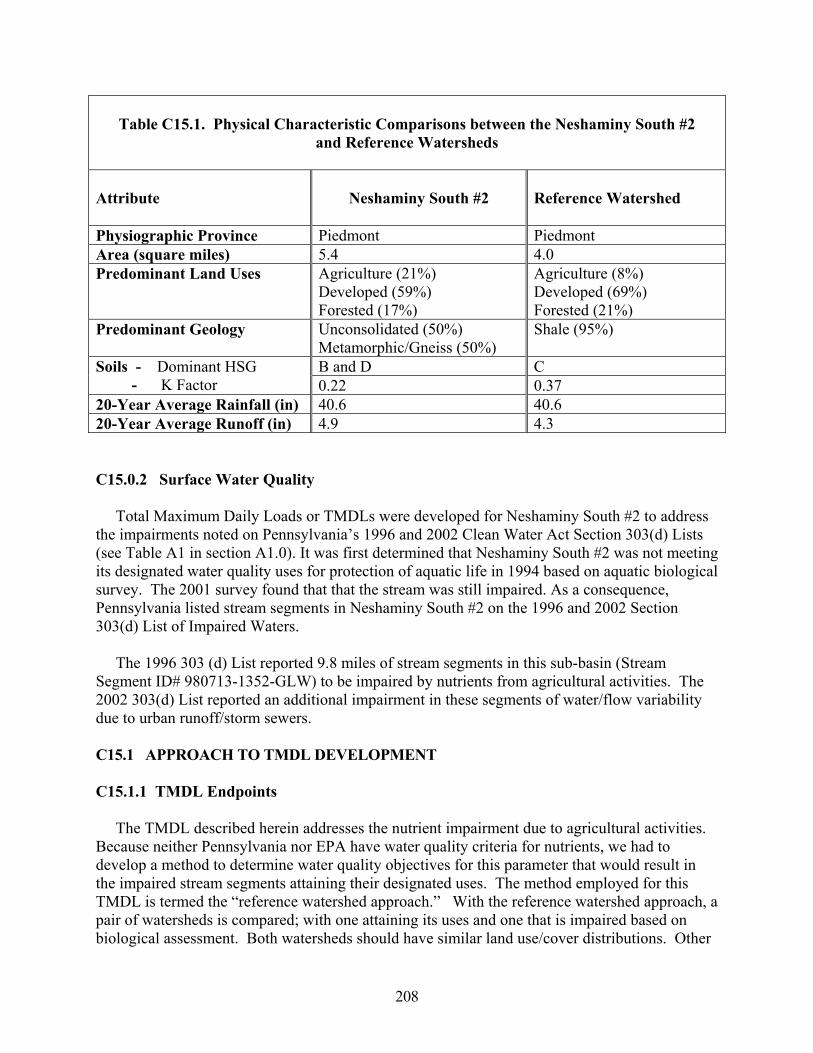
Table C15.1. Physical Characteristic Comparisons between the Neshaminy South #2
and Reference Watersheds
Attribute
Neshaminy South #2
Reference Watershed
Physiographic Province Piedmont Piedmont Area (square miles) 5.4 4.0 Predominant Land Uses Agriculture (21%)
Developed (59%) Forested (17%)
Agriculture (8%) Developed (69%) Forested (21%)
Predominant Geology Unconsolidated (50%) Metamorphic/Gneiss (50%)
Shale (95%)
B and D C Soils - Dominant HSG - K Factor 0.22 0.37 20-Year Average Rainfall (in) 40.6 40.6 20-Year Average Runoff (in) 4.9 4.3
C15.0.2 Surface Water Quality
The TMDL described herein addresses the nutrient impairment due to agricultural activities. Because neither Pennsylvania nor EPA have water quality criteria for nutrients, we had to develop a method to determine water quality objectives for this parameter that would result in the impaired stream segments attaining their designated uses. The method employed for this TMDL is termed the “reference watershed approach.” With the reference watershed approach, a pair of watersheds is compared; with one attaining its uses and one that is impaired based on biological assessment. Both watersheds should have similar land use/cover distributions. Other
Total Maximum Daily Loads or TMDLs were developed for Neshaminy South #2 to address the impairments noted on Pennsylvania’s 1996 and 2002 Clean Water Act Section 303(d) Lists (see Table A1 in section A1.0). It was first determined that Neshaminy South #2 was not meeting its designated water quality uses for protection of aquatic life in 1994 based on aquatic biological survey. The 2001 survey found that that the stream was still impaired. As a consequence, Pennsylvania listed stream segments in Neshaminy South #2 on the 1996 and 2002 Section 303(d) List of Impaired Waters. The 1996 303 (d) List reported 9.8 miles of stream segments in this sub-basin (Stream Segment ID# 980713-1352-GLW) to be impaired by nutrients from agricultural activities. The 2002 303(d) List reported an additional impairment in these segments of water/flow variability due to urban runoff/storm sewers. C15.1 APPROACH TO TMDL DEVELOPMENT C15.1.1 TMDL Endpoints
208

features such as base geologic formation should be matched to the greatest extent possible; however, most variations can be adjusted in the model. The objective of the process is to reduce the loading rate of nutrients and/or sediments in the watershed containing the impaired stream segment(s) to a level equivalent to or slightly lower than the loading rate in the watershed with the non-impaired, reference stream segment(s). The underlying assumption is that this load reduction will allow biological health to return to the impaired stream segments. The TMDL to be addressed in this section relates to the stream impairments found in the 1996 and 2002 303(d) Lists, and is described in greater detail below.
As discussed previously in Section B1.5, elevated nutrient loads to streams (nitrogen and phosphorus in particular) can lead to increased productivity of plants and other organisms (Novotny and Olem, 1994). As also described in Section D2.1, phosphorus was determined to be the limiting nutrient in the Neshaminy Creek watershed as a whole. Given that, phosphorus was the nutrient of focus in developing the TMDL for this sub-basin as well. Based on the field work undertaken as part of the initial aquatic biological surveys, it was determined that agricultural activities were the primary cause of non-point source-related impairments to streams in this watershed. Since most phosphorus transported from agricultural land is in the form of sediment-bound phosphorus, it is believed that the reduction of sediment from such areas will help mitigate problems with excessive algal growth and organic enrichment caused by elevated phosphorus levels. Consequently, the reduction of sediment was the focus of this particular TMDL.
C15.1.2 Selection of the Reference Watershed
In general, three factors should be considered when selecting a suitable reference watershed. The first factor is to use a watershed that has been assessed by the Department using the Unassessed Waters Protocol and has been determined to attain water quality standards. The second factor is to find a watershed that closely resembles the watershed being assessed (i.e., Neshaminy Creek South #2) with respect to physical properties such as land cover/land use, physiographic province, and geology. Finally, the size of the reference watershed should be within 20-30% of the impaired watershed area. The search for a reference watershed that would satisfy the above characteristics was done by means of a desktop screening using several GIS coverages including the Multi-Resolution Land Characteristics (MRLC) Landsat-derived land cover/use grid, the Pennsylvania’s 305(b) assessed streams database, and geologic rock types.
A watershed that would be similar to Neshaminy South #2 in terms of land use distribution could not be found due to the fact that other watersheds that have similar levels of agricultural land use and land development are typically also impaired. Therefore, the watershed used as a reference for Neshaminy South #2 has somewhat less agricultural land and urban development. The watershed used as a reference for the West Branch Sub-basin #4 is comprised of the Lashaka/Mill Creek watershed. This watershed is located in the same physiographic province and State Water Plan as Neshaminy South #2, and is in fact a sub-watershed of the Neshaminy Creek watershed. Table C15.1 compares the two watersheds in terms of their size, location, and other physical characteristics. All reference watershed stream segments have been assessed and were found to be unimpaired. Figure C15.2 shows the reference watershed boundary and its location in Bucks County.
209

Figure C15.2. Reference Watershed Location. C15.1.3 Water/Flow Variability Resulting from Urban Runoff/Storm Sewers TMDLs were not determined for water/flow variability. It was assumed that addressing sediment loads through the use of various BMPs will at the same time reduce water flow variability/alterations within the watershed. C15.1.4 Nutrients from Agricultural Sources The 1994 and 2001 surveys showed that nutrients originating from agricultural activities in the watershed was a primary cause of impairment of stream segments in the Neshaminy South #2 sub-basin. Since most phosphorus transported from agricultural land is in the form of sediment-bound phosphorus, it is believed that the reduction of sediment from such areas will help mitigate problems with excessive algal growth and organic enrichment caused by elevated phosphorus levels. Consequently, the reduction of sediment was the focus of this particular TMDL. C15.1.5 Watershed Assessment and Modeling Using the refined parameter estimates based on the calibration results, the AVGWLF model was run for both Neshaminy South #2 and the reference watershed to establish sediment loads under existing land cover use conditions in each watershed. Based on the use of 20 years of historical weather data, the mean annual sediment loads for the impaired and reference watersheds are shown Tables C15.2 and C15.3, respectively. Table C15.4 presents an
210

explanation of the header information contained in Tables C15.2 and C15.3. Modeling output for Neshaminy South #2 and the reference watershed is presented in Appendix F.
Table C15.2. Loading Values for Neshaminy South #2
Land Use Category
Area
(acres)
Sediment Load
(lbs/year)
Unit Area Sediment Load (lbs/acre/yr)
Hay/Pasture 148 4,861 32.8 Cropland 576 283,509 492.2 Coniferous For 101 361 3.6 Mixed Forest 158 501 3.2 Deciduous For 321 1,205 3.7 Transitional Land 87 56,580 650.3 Lo Intensity Dev 1,421 19.3 27,469Hi Intensity Dev 610 12,485 20.5 Stream Bank 1,393,429 Groundwater Point Source Septic Systems Total 3,422 1,780,400 520.3
Table C15.3. Loading Values for the Reference Watershed
Land Use Category
Area
(acres)
Sediment Load
(lbs/year)
Unit Area Sediment Load (lbs/acre/yr)
Hay/Pasture 52 3,520 67.7 Cropland 153 106,620 696.9 Coniferous Forest 104 520 5.0 Mixed Forest 84 680 8.1 Deciduous Forest 329 2,380 7.2 Transitional Land 64 72,920 1,139.4 Low Intensity Devel 1,698 135,120 79.6 High Intensity Devel 69 1,180 17.1 Stream Bank 576,680 Groundwater Point Source Septic Systems Total 2,553 899,620 352.4
211

Table C15.4. Header Information for Tables C15.2 and C15.3.
Land Use Category The land cover classification that was obtained by from the MRLC
database Area (acres) The area of the specific land cover/land use category found in the
watershed. Total P The estimated total phosphorus loading that reaches the outlet point of the
watershed that is being modeled. Expressed in lbs./year. Unit Area P Load The estimated loading rate for phosphorus for a specific land cover/land
use category. Loading rate is expressed in lbs/acre/year Total N The estimated total nitrogen loading that reaches the outlet point of the
watershed that is being modeled. Expressed in lbs./year. Unit Area N Load The estimated loading rate for nitrogen for a specific land cover/land use
category. Loading rate is expressed in lbs/acre/year Total Sediment The estimated total sediment loading that reaches the outlet point of the
watershed that is being modeled. Expressed in lbs./year. Unit Area Sediment Load
The estimated loading rate for sediment for a specific land cover/land use category. Loading rate is expressed in lbs/acre/year
C15.2 LOAD ALLOCATION PROCEDURE FOR SEDIMENT TMDL The load allocation and reduction procedures were applied to all of Neshaminy South #2. The load reduction calculations in this watershed are based on the current sediment loading rate in the reference watershed. Based on biological assessment, it was determined that the reference watershed was attaining its designated uses. This loading rate was then used as the basis for establishing the sediment TMDL for Neshaminy South #2. The basic equation defining TMDLs for sediments and nutrients are as follows:
TMDL = MOS + LA + WLA (1) LA = ALA – LNR (2) TMDL is the TMDL total load. The LA (load allocation) is the portion of Equation (1) that is typically assigned to non-point sources. The MOS (margin of safety) is the portion of loading that is reserved to account for any uncertainty in the data and computational methodology used for the analysis. The WLA (Waste Load Allocation) is the portion of this equation that is typically assigned to point sources. The adjusted load allocation (ALA) is the load originating from sources (Equation 2) that needs to be reduced by the non-contributing sources (LNR) for Neshaminy South #2 to meet water quality goals. Therefore, it is the load that originates from agricultural sources that have contributed to water quality problems identified in this watershed. Details of how specific components of the overall TMDL calculation were derived are presented below.
212

C15.2.1 TMDL Total Load The first step was to determine the TMDL total target load for Neshaminy South #2, the impaired watershed. This value was obtained by multiplying the unit area loading rate for sediment in the reference watershed by the total watershed area of Neshaminy South #2. This information is presented in Table C15.5.
Table C15.5. TMDL Total Load Computation
Type of Pollutant
Unit Area Loading Rate in Reference Watershed
(lbs/acre/yr)
Total Watershed Area in Neshaminy South #2
(acres)
TMDL Total Load (lbs/yr)
Sediment 352.4 3,422 1,205,913 C15.2.2 Margin of Safety The Margin of Safety (MOS) for this analysis is explicit. Ten percent of each of the TMDLs was reserved as the MOS. MOS (Sediment): 1,205,913 lbs/yr x 0.1 = 120,591 lbs/yr (3) C15.2.3 Load Allocation The load allocation (LA), consisting of all nonpoint source loads in the watershed, was computed by subtracting the margin of safety and the waste load allocation (which was zero for sediment in this case) from the TMDL total load. LA (Sediment): 1,205,913 lbs/yr – 120,591 lbs/yr = 1,085,322 lbs/yr (4)
The adjusted load allocation (ALA) is the actual load allocation for sources that will need reductions. It is computed by subtracting loads from non-point sources that are not considered in the reduction scenario (LNR). These are loads from all non-point sources in Table C15.2 except those from agricultural land uses (Hay/Pasture, Row Crops, and Streambank Erosion). (Note: Streambank erosion was included in the load allocation in this case since this problem typically occurs in agricultural areas, and is a source that can be controlled via the use of BMPs in agricultural areas). Therefore, using data in Table C15.2,
+ 27,460 lbs/yr + 12,480 lbs/yr = 98,580 lbs/yr (6)
C15.2.4 Adjusted Load Allocation
LNR (Sediments) = 360 lbs/yr + 500 lbs/yr + 1,200 lb/yr + 56,580 lb/yr
ALA (Sediments) = 1,085,322 lbs/yr – 98,580 lbs/yr = 986,742 lbs/yr (7)
213

Table C15.6 below presents TMDL results for the Neshaminy South #2 sub-basin.
Table C15.6. Summary of TMDL for Neshaminy South #2 (lbs/yr)
Pollutant TMDL MOS WLA LA LNR ALA Sediment 1,205,913 120,591 - 1,085,322 98,580 986,742
C15.2.5 Load Reduction Procedures
carried out as if each source is the only contributor to the pollutant load to the
compare them to the total allocable load. If the allocable load is exceeded, an
The ALA computed above is the portion of the load that is available to allocate among contributing sources (Hay/Pasture, Cropland, and streambank erosion) as described in the next step. Not all land use/source categories were included in the allocation because they are difficult to control, or provide an insignificant portion of the total load (e.g., forested areas). The following section shows the allocation process in detail for the entire watershed.
Sediment loads obtained in the previous step were allocated among the remaining land use/sources of the impaired watershed according to the Equal Marginal Percent Reduction (EMPR) method. EMPR is carried out using an Excel Worksheet in the following manner:
5) Each land use/source load is compared with the total allocable load to determine if any contributor would exceed the allocable load by itself. The evaluation is
receiving waterbody. If the contributor exceeds the allocable load, that contributor would be reduced to the allocable load. This is the baseline portion of EMPR.
6) After any necessary reductions have been made in the baseline the multiple analysis is run. The multiple analysis will sum all of the baseline loads and
equal percent reduction will be made to all contributors’ baseline values. After any necessary reductions in the multiple analysis, the final reduction percentage for each contributor can be computed. The load allocation and EMPR procedures were performed using an Excel Worksheet, and results are presented in Appendix G. Table C15.7 provides load allocation by considering all land uses in the watershed. In this case, land uses/sources that were not part of the allocation are carried through at their existing loading values. The total allowable sediment load in Neshaminy South #2 and its tributaries when all sources are considered (and including the 10% MOS) is 1,085,322 pounds per year. In order for all stream segments to attain their specific uses, the total sediment load should be reduced from 1,780,400 pounds per year by a factor of 39%.
214

Table C15.7 Load Allocation by Each Land Use/Source
Sediment
Source
Area (acres)
Unit Area Loading
Rate (lbs/ac/yr)
Annual average
load (lbs/yr)
ALA (lbs/yr)
Reduction (%)
Hay/Pasture 148 32.8 4,861 2,852 41 Cropland 576 492.2 283,509 166,336 41 Coniferous Forest 101 3.6 361 360 0 Mixed Forest 158 3.2 501 500 0 Deciduous Forest 321 3.7 1,205 1,200 0 Transitional 87 650.3 56,580 56,580 0 Lo Intensity Dev 1,421 19.3 27,469 27,460 0 Hi Intensity Dev 610 20.5 12,485 12,480 0 Stream Bank 1,393,429 817,533 41 Groundwater Point Source Septic Systems Total 3,422 520.3 1,780,400 1,085,322 39 C15.3 CONSIDERATION OF CRITICAL CONDITIONS The AVGWLF model is a continuous simulation model, which uses daily time steps for weather data and water balance calculations. Monthly calculations are made for sediment and nutrient loads, based on the daily water balance accumulated to monthly values. Therefore, all flow conditions are taken into account for loading calculations. Because there is generally a significant lag time between the introduction of sediment and nutrients to a waterbody and the resulting impact on beneficial uses, establishing these TMDLs using average annual conditions is protective of the waterbody. C15.4 CONSIDERATION OF SEASONAL VARIATIONS The continuous simulation model used for this analysis considers seasonal variation through a number of mechanisms. Daily time steps are used for weather data and water balance calculations. The model requires specification of the growing season, and hours of daylight for each month. The model also considers the months of the year when manure is applied to the land. The combination of these actions by the model accounts for seasonal variability.
215

C15.5 REASONABLE ASSURANCE OF IMPLEMENTATION Sediment reductions in the TMDL are allocated to agricultural areas and sources of stream bank erosion in the watershed. Implementation of agricultural best management practices (BMPs) in the affected areas to increase infiltration and sediment control measures should achieve the loading reduction goals established in the TMDL. Substantial reductions in the amount of sediment reaching the streams can be made through the planting of riparian buffer zones, contour strips, and cover crops, and conservation tillage. These BMPs range in efficiency from 20% to 70% for sediment reduction. Implementation of BMPs aimed at sediment reduction will also assist in the reduction of phosphorus, which is contributing to algal growth in the streams. Other possibilities for attaining the desired reductions in sediment include streambank stabilization and fencing. Further field verification will be performed in order to assess both the extent of existing BMPs, and to determine the most cost-effective and environmentally protective combination of BMPs required to meet the sediment reductions outlined in this section. C15.6 PUBLIC PARTICIPATION Notice of the draft TMDLs will be published in the PA Bulletin and local newspapers with a 30-day comment period provided. A public meeting with watershed residents will be held to discuss the TMDLs. Notice of final TMDL approval will be posted on the Department website.
216
C16.0 Total Maximum Daily Load (TMDL) Development Plan for Neshaminy Creek South #3
217
Table of Contents Page Executive Summary …………………………………………...……………………….. 220 C16.0 Introduction ……………………….……………………………………….……. 221
C16.1.1 TMDL Endpoints……………………………………………………….. 222
C16.1.4 Watershed Assessment and Modeling………………………………….. 224
C16.0.1 Watershed Description ………………………………….………….…. 221 C16.0.2 Surface Water Quality …………………………………….…………... 222 C16.1 Approach to TMDL Development ………………………………...……….……. 222
C16.1.2 Selection of the Reference Watershed…………………………………. . 223 C16.1.3 Siltation Due to Development …………………………………………. 223
C16.2 Load Allocation Procedure for Sediment TMDLs ………………..……………… 226 C16.2.1 Sediment TMDL Total Load ………………………………………..… 226 C16.2.2 Margin of Safety …………………………………...………..………… 227 C16.2.3 Waste Load Allocation .……………………………..………………... 227 C16.2.4 Load Reduction Procedures ……………………………..…..………… 227 C16.3 Consideration of Critical Conditions ………………………….………………… 228 C16.4 Consideration of Seasonal Variations …………………………………..………. 228 C16.5 Reasonable Assurance of Implementation ……………………………………… 229 C16.6 Public Participation …………………………………………………………….. 229
218
List of Tables Page C16.1 Physical Characteristic Comparisons Between Neshaminy Creek
South #3 and Reference Watershed ………………………………… 222 C16.2 Loading Values for Neshaminy Creek South #3……………………………. 225 C16.3 Loading Values for the Reference Watershed…………….…………. ……… 225 C16.4 Header Information for Tables C17.2 and C17.3………………………..…… 226 C16.5 TMDL Total Load Computation……………………………………………… 227 C16.4 Load Allocation by each Land Use/Source…………………………………. 228 List of Figures Page C16.1 Neshaminy Creek South #3 Watershed ………………………………….…. 221 C16.2 Reference Watershed ………………………………………………………. 224
219
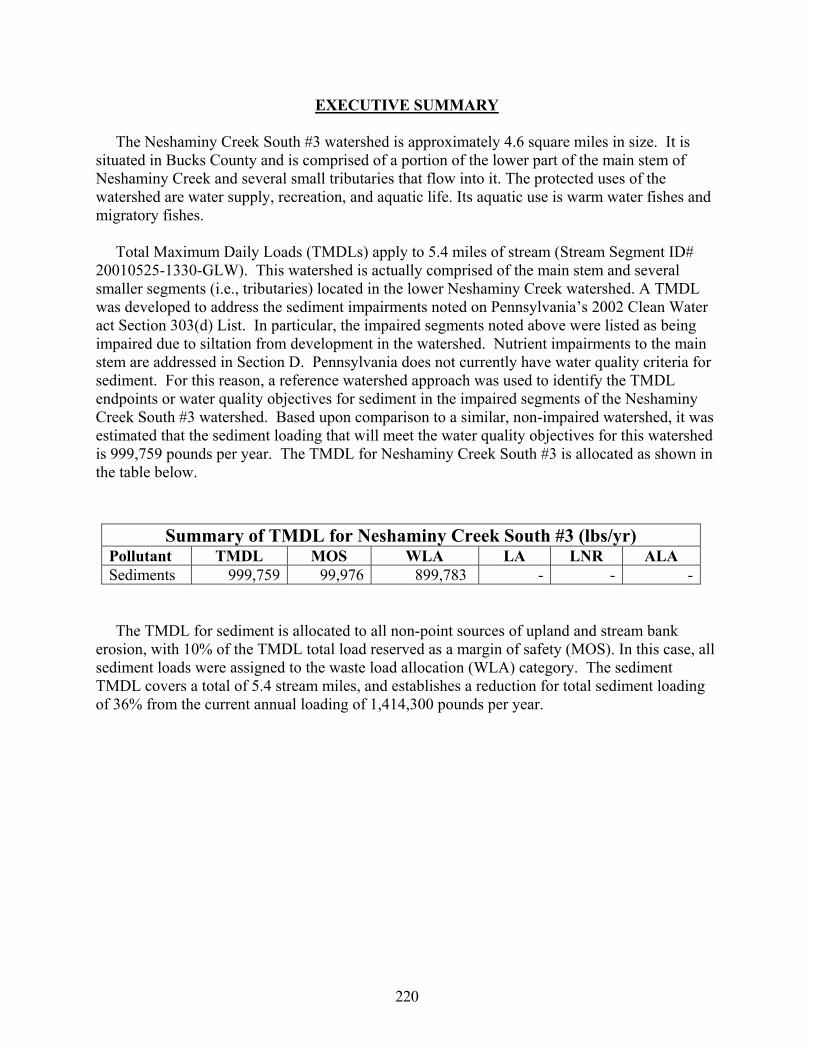
EXECUTIVE SUMMARY
Summary of TMDL for Neshaminy Creek South #3 (lbs/yr)
The Neshaminy Creek South #3 watershed is approximately 4.6 square miles in size. It is situated in Bucks County and is comprised of a portion of the lower part of the main stem of Neshaminy Creek and several small tributaries that flow into it. The protected uses of the watershed are water supply, recreation, and aquatic life. Its aquatic use is warm water fishes and migratory fishes. Total Maximum Daily Loads (TMDLs) apply to 5.4 miles of stream (Stream Segment ID# 20010525-1330-GLW). This watershed is actually comprised of the main stem and several smaller segments (i.e., tributaries) located in the lower Neshaminy Creek watershed. A TMDL was developed to address the sediment impairments noted on Pennsylvania’s 2002 Clean Water act Section 303(d) List. In particular, the impaired segments noted above were listed as being impaired due to siltation from development in the watershed. Nutrient impairments to the main stem are addressed in Section D. Pennsylvania does not currently have water quality criteria for sediment. For this reason, a reference watershed approach was used to identify the TMDL endpoints or water quality objectives for sediment in the impaired segments of the Neshaminy Creek South #3 watershed. Based upon comparison to a similar, non-impaired watershed, it was estimated that the sediment loading that will meet the water quality objectives for this watershed is 999,759 pounds per year. The TMDL for Neshaminy Creek South #3 is allocated as shown in the table below.
Pollutant TMDL MOS WLA LA LNR ALA Sediments 999,759 99,976 899,783 - - -
The TMDL for sediment is allocated to all non-point sources of upland and stream bank erosion, with 10% of the TMDL total load reserved as a margin of safety (MOS). In this case, all sediment loads were assigned to the waste load allocation (WLA) category. The sediment TMDL covers a total of 5.4 stream miles, and establishes a reduction for total sediment loading of 36% from the current annual loading of 1,414,300 pounds per year.
220

C16.0 INTRODUCTION
The watershed contains part of the lower main stem of Neshaminy Creek (Stream Segment ID# 467) as well as several small tributaries that flow into it (Stream Segment ID 20010525-1330-GLW). The watershed is located in the Piedmont Physiographic Province and is situated in Bucks County. It covers an area of approximately 4.5 square miles. The watershed is south of the towns of South Hampton, Langhorne, and Midletown. It is bounded by Pennsylvania Route 213 to the west and Route 1 to the east. Figure C17.1 shows the watershed boundary and its location. The designated uses of the watershed include water supply, recreation and aquatic life. As listed in the Title 25 PA Code Department of Environmental Protection Chapter 93, Section 93.o (Commonwealth of PA, 1999), the designated aquatic life use for the Neshaminy Creek South #3 watershed is warm water fishes and migratory fishes. The primary land use in the watershed is high and low intensity development (70%). During the stream assessment, it was found that sediment deposited in large quantities on the streambed was degrading the habitat of bottom-dwelling macroinvertebrates.
C16.0.1 Watershed Description
Figure C16.1. Neshaminy Creek South #3 watershed. The surficial geology of the watershed consists of unconsolidated and metamorphic/gneiss formations. The bedrock geology primarily affects surface runoff and background nutrient loads through its influences on soils and landscape as well as fracture density and directional permeability. Soils are mostly sandy and very erodible, as indicated by a predominantly high average K factor (0.32). Watershed characteristics are summarized in Table C16.1.
221
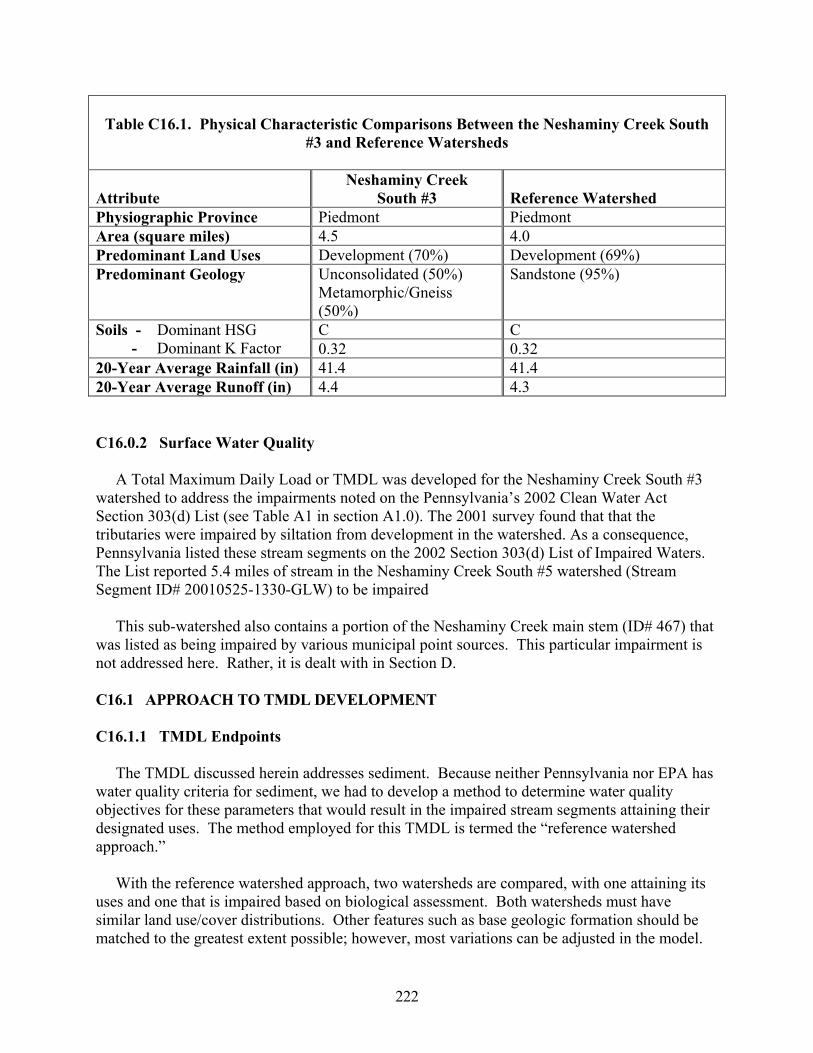
Table C16.1. Physical Characteristic Comparisons Between the Neshaminy Creek South
#3 and Reference Watersheds
Attribute Neshaminy Creek
South #3 Reference Watershed
Physiographic Province Piedmont Piedmont Area (square miles) 4.5 4.0 Predominant Land Uses Development (70%) Development (69%) Predominant Geology Unconsolidated (50%)
Metamorphic/Gneiss (50%)
Sandstone (95%)
C C Soils - Dominant HSG - Dominant K Factor 0.32 0.32 20-Year Average Rainfall (in) 41.4 41.4
20-Year Average Runoff (in) 4.4 4.3
A Total Maximum Daily Load or TMDL was developed for the Neshaminy Creek South #3 watershed to address the impairments noted on the Pennsylvania’s 2002 Clean Water Act Section 303(d) List (see Table A1 in section A1.0). The 2001 survey found that that the tributaries were impaired by siltation from development in the watershed. As a consequence, Pennsylvania listed these stream segments on the 2002 Section 303(d) List of Impaired Waters. The List reported 5.4 miles of stream in the Neshaminy Creek South #5 watershed (Stream Segment ID# 20010525-1330-GLW) to be impaired
This sub-watershed also contains a portion of the Neshaminy Creek main stem (ID# 467) that was listed as being impaired by various municipal point sources. This particular impairment is not addressed here. Rather, it is dealt with in Section D.
C16.0.2 Surface Water Quality
C16.1 APPROACH TO TMDL DEVELOPMENT
C16.1.1 TMDL Endpoints The TMDL discussed herein addresses sediment. Because neither Pennsylvania nor EPA has water quality criteria for sediment, we had to develop a method to determine water quality objectives for these parameters that would result in the impaired stream segments attaining their designated uses. The method employed for this TMDL is termed the “reference watershed approach.” With the reference watershed approach, two watersheds are compared, with one attaining its uses and one that is impaired based on biological assessment. Both watersheds must have similar land use/cover distributions. Other features such as base geologic formation should be matched to the greatest extent possible; however, most variations can be adjusted in the model.
222
The objective of the process is to reduce the loading rate for sediment in the impaired stream segment to a level equivalent to or slightly lower than the loading rate in the non-impaired, reference stream segment. The underlying assumption is that this load reduction will allow the biological community to return to the impaired stream segments. C16.1.2 Selection of the Reference Watershed In general, three factors should be considered when selecting a suitable reference watershed. The first factor is to use a watershed that has been assessed by the Department using the Unassessed Waters Protocol and has been determined to be attaining designated uses. The second factor is to find a watershed that closely resembles the Neshaminy Creek South #3 watershed in terms of physical properties such as land cover/land use, physiographic province, and geology. Finally, the size of the reference watershed should be within 20-30% of the impaired watershed area. The search for a reference watershed that would satisfy the above characteristics was done by means of a desktop screening using several GIS data layers including the Multi-Resolution Land Characteristics (MRLC) Landsat-derived land cover/use grid, the Pennsylvania’s 305(b) assessed streams database, and geologic rock types. The reference watershed used in this case is a part of the Mill Creek watershed located at the lower end of Neshaminy Creek. Both watersheds are located in the same physiographic province and State Water Plan, and include tributaries of Neshaminy Creek. Table C16.1 compares the two watersheds in terms of their size, location, and other physical characteristics. All reference watershed stream segments have been assessed and were found to be unimpaired. Figure C16.2 shows the reference watershed and its location within the larger Neshaminy Creek watershed. An analysis of the land use/cover grid revealed that land cover/use distributions in both watersheds are similar. The surficial geology in the two watersheds is different, but it is not expected that this would significantly affect the sediment loads in either case. C16.1.3 Siltation Due to Development The 2001 survey showed that siltation originating from development in the watershed was the cause of impairment to Neshaminy Creek South #3 stream segments. Sediments deposited in large quantities on the streambed were found to be degrading the habitat of bottom-dwelling macroinvertebrates. This TMDL addresses sediment from development (“urban runoff/storm sewers”) and from stream bank erosion. Stream bank erosion occurs as a result of excess flow in the watershed due to a significantly high percentage of impervious surface area (the watershed is 70% developed).
223

Figure C16.2. Reference watershed location.
C16.1.4 Watershed Assessment and Modeling The AVGWLF model was run for both the Neshaminy Creek South #3 and reference watersheds to establish existing loading conditions under existing land use/cover conditions. Prior to running the model, historical stream water quality data for the period 4/89 to 3/96 were first used to calibrate various key parameters within the GWLF model. Such data sets are typically not available in AVGWLF-based TMDL assessments done elsewhere in Pennsylvania. In this case, however, it was felt that model calibration would provide for better simulation of localized watershed processes and conditions. A description of the calibration procedure used can be found in section B1.4 of this document. Using the refined parameter estimates based on the calibration results, AVGWLF was run for both watersheds. Based on the use of 20 years of historical weather data, the mean annual loads for sediments for the impaired and reference watersheds were calculated as shown Tables C16.2 and C16.3, respectively. Table C16.4 presents an explanation of the header information contained in Tables C16.2 and C16.3. Modeling output for both watersheds is presented in Appendix F.
224

Table C16.2. Existing Loading Values for the Neshaminy Creek South #3 Watershed
Land Use Category Area
(acres) Sediment Load
(lbs/year) Unit Area Sediment Load
(lbs/acre/yr) Hay/Pasture 59 960 16.3Cropland 158 44,320 280.5Coniferous Forest 121 420 3.5Mixed Forest 124 300 2.4Deciduous Forest 321 1000 3.1Transitional 57 18,520 324.9Low Intensity Developed 1,643 34,120 20.8
353 2,300 6.5Stream Bank 1,312,360
Point Source
2,837 1,414,300 498.5
High Intensity Developed
Groundwater
Septic Systems Total
Table C16.3. Loading Values for the Reference Watershed
Land Use Category Area
(acres) Sediment Load
(lbs/year) Unit Area Sediment Load
(lbs/acre/yr) Hay/Pasture 52 3,520 67.7Cropland 153 106,620 696.9
520 5.0Mixed Forest 84 680 8.1Deciduous Forest 329 2,380 7.2Transitional 64 72,920 1,139.4Low Intensity Developed 1,698 135,120 79.6High Intensity Developed 69 1,180 17.1Stream Bank 576,680Groundwater Point Source Septic Systems Total 2,553 899,620 352.4
Coniferous Forest 104
225
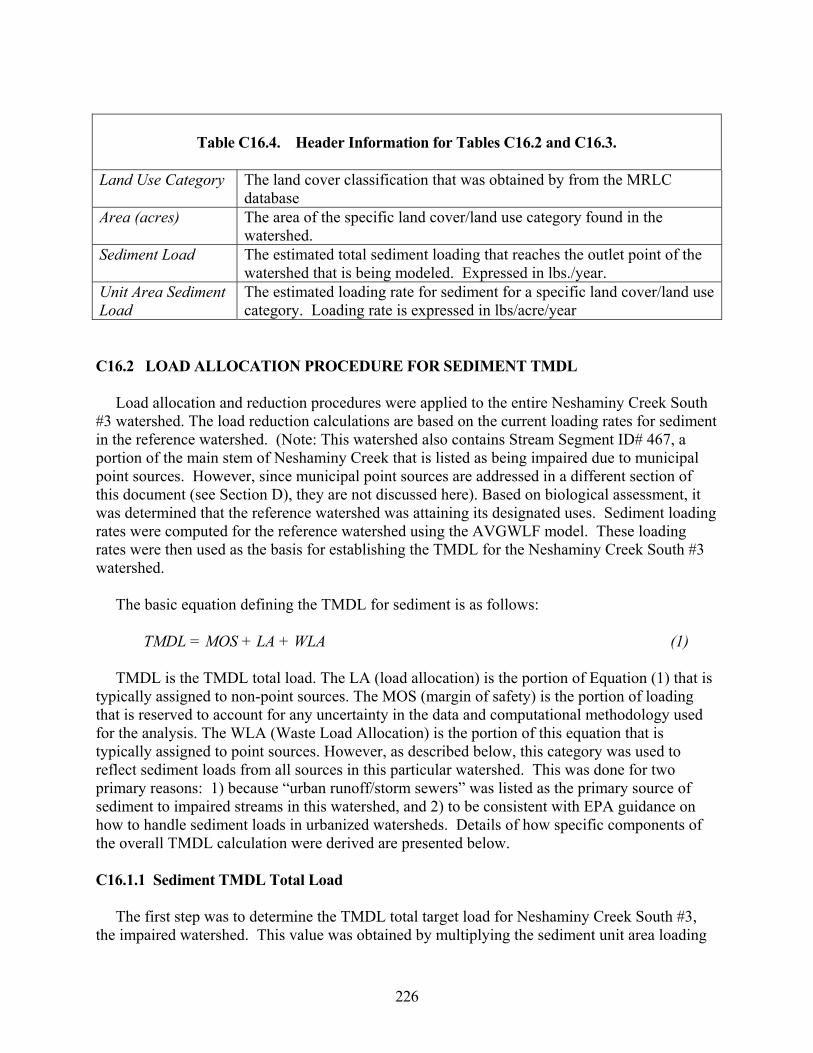
Table C16.4. Header Information for Tables C16.2 and C16.3.
Land Use Category The land cover classification that was obtained by from the MRLC database
Area (acres)
The estimated total sediment loading that reaches the outlet point of the watershed that is being modeled. Expressed in lbs./year.
Unit Area Sediment Load
The area of the specific land cover/land use category found in the watershed.
Sediment Load
The estimated loading rate for sediment for a specific land cover/land use category. Loading rate is expressed in lbs/acre/year
C16.2 LOAD ALLOCATION PROCEDURE FOR SEDIMENT TMDL
Load allocation and reduction procedures were applied to the entire Neshaminy Creek South #3 watershed. The load reduction calculations are based on the current loading rates for sediment in the reference watershed. (Note: This watershed also contains Stream Segment ID# 467, a portion of the main stem of Neshaminy Creek that is listed as being impaired due to municipal point sources. However, since municipal point sources are addressed in a different section of this document (see Section D), they are not discussed here). Based on biological assessment, it was determined that the reference watershed was attaining its designated uses. Sediment loading rates were computed for the reference watershed using the AVGWLF model. These loading rates were then used as the basis for establishing the TMDL for the Neshaminy Creek South #3 watershed.
The basic equation defining the TMDL for sediment is as follows:
TMDL = MOS + LA + WLA (1) TMDL is the TMDL total load. The LA (load allocation) is the portion of Equation (1) that is typically assigned to non-point sources. The MOS (margin of safety) is the portion of loading that is reserved to account for any uncertainty in the data and computational methodology used for the analysis. The WLA (Waste Load Allocation) is the portion of this equation that is typically assigned to point sources. However, as described below, this category was used to reflect sediment loads from all sources in this particular watershed. This was done for two primary reasons: 1) because “urban runoff/storm sewers” was listed as the primary source of sediment to impaired streams in this watershed, and 2) to be consistent with EPA guidance on how to handle sediment loads in urbanized watersheds. Details of how specific components of the overall TMDL calculation were derived are presented below.
C16.1.1 Sediment TMDL Total Load
The first step was to determine the TMDL total target load for Neshaminy Creek South #3, the impaired watershed. This value was obtained by multiplying the sediment unit area loading
226

rate in the reference watershed by the total watershed area of Neshaminy Creek South #3. This information is presented in Table C16.5.
Table C16.5. TMDL Total Load Computation
Type of Pollutant
Total Watershed Area of Neshaminy South #3
(acres)
TMDL Total Load (lbs/yr)
Sediment 352.4 2,837 999,759
Unit Area Loading Rate in Reference Watershed
(lbs/acre/yr)
C16.2.2 Margin of Safety The Margin of Safety (MOS) for this analysis is explicit. Ten percent of the TMDL was reserved as the MOS. MOS (Sediment): 999,759 lbs/yr x 0.1 = 99,976 lbs/yr (2) C16.2.3 Waste Load Allocation For the purposes of this TMDL assessment, sediment loads from all sources have been assigned to the waste load allocation (WLA) category to be consistent with EPA guidance on how to handle sediment in urbanized watersheds. Therefore, the load allocation (LA) in this case is equal to zero. Allowing for an explicit 10% MOS, the target WLA is re-computed as: WLA (Sediment): 999,759 lbs/yr – 99,976 lbs/yr = 899,783 lbs/yr (3) Tables that can be used to cross-reference sub-areas with municipalities in the Neshaminy Creek basin, as well as a summary of sediment-related WLAs, can be found in Appendix E. A map showing the overlap between sub-basin and municipal boundaries within the entire Neshaminy Creek basin is also included in this same appendix. C16.2.4 Load Reduction Procedures The allocation of sediment among contributing sources in Neshaminy Creek South #3 was done by reducing each source equally on a percentage basis. Based on the target WLA of 899,783 lbs/year described above, the computed load allocations are as shown in Table C2.6. The total allowable sediment load in Neshaminy Creek South #3 when sources are considered is 899,783 pounds per year. In order for all stream segments to attain their specific uses, total sediment load should be reduced from 1,414,300 pounds per year by a factor of 36%.
227

Table C16.6. Load Allocation by Each Land Use/Source
Sediment
Source
Area
Unit Area
Loading Rate
Annual average
load
WLA (annual
average)
Reduction (acres) (lbs/ac/yr) (lbs/yr) (lbs/yr) ( % )
Hay/Pasture 59 16.3 960 611 36 Cropland 158 280.5 44,320 28,196 36 Coniferous 121 3.5 420 267 36 Mixed Forest 124 2.4 300 191 36 Deciduous Forest 321 3.1 1000 636 36 Transition 57 324.9 18,520 11,783 36 Low Intensity Dev 1,643 20.8 34,120 21,708 36 High Intensity Dev 353 6.5 2,300 1,463 36 Stream Bank 1,312,360 834,928 36 Groundwater
Total 2,837 498.5 1,414,300 899,783 36
Point Source Septic Systems
C16.3 CONSIDERATION OF CRITICAL CONDITIONS
The AVGWLF model is a continuous simulation model, which uses daily time steps for weather data and water balance calculations. Monthly calculations are made for sediment and nutrient loads, based on the daily water balance accumulated to monthly values. Therefore, all flow conditions are taken into account for loading calculations. Because there is generally a significant lag time between the introduction of sediment and nutrients to a waterbody and the resulting impact on beneficial uses, establishing this TMDL using average annual conditions is protective of the waterbody.
The continuous simulation model used for this analysis considers seasonal variation through a number of mechanisms. Daily time steps are used for weather data and water balance calculations. The model requires specification of the growing season, and hours of daylight for each month. The model also considers the months of the year when manure is applied to the land. The combination of these actions by the model accounts for seasonal variability.
C16.4 CONSIDERATION OF SEASONAL VARIATIONS
228
C16.5 REASONABLE ASSURANCE OF IMPLEMENTATION
Sediment reductions in the TMDL are allocated to all sources of upland and stream bank erosion in the watershed. Implementation of best management practices (BMPs) in the affected areas to increase infiltration and sediment control measures should achieve the loading reduction goals established in the TMDL. Substantial reductions in the amount of sediment reaching the streams can be made through the installation of BMPs such as detention ponds, sediment ponds, infiltration pits, dikes, riparian buffers, stream bank stabilization and ditches in the watershed . These BMPs range in efficiency from 20% to 70% for sediment reduction.
C16.6 PUBLIC PARTICIPATION
The implementation of such BMPs will likely occur in the watershed as a result of PaDEP’s Proposed Comprehensive Stormwater Management Policy. When approved, this new policy will require affected communities to implement BMPs to address stormwater control that will “reduce pollutant loadings to streams, recharge groundwater tables, enhance stream base flow during times of drought and reduce the threat of flooding and stream bank erosion resulting from storm events.” Over the next year and one-half, PaDEP will be developing a “Phase II” program for NPDES discharges from small construction sites, additional industrial activities, and for the 700 municipalities subject to the requirements for separate storm sewer systems (MS4). All of the municipalities located within the Mill Creek watershed will be affected by this policy, which has been included in Appendix E. Tables that can be used to cross-reference sub-areas with municipalities in the Neshaminy Creek basin, as well as a summary of sediment-related WLAs, can be found in Appendix E. A map showing the overlap between sub-basin and municipal boundaries within the entire Neshaminy Creek basin is also included in this same appendix. Implementation of BMPs aimed at sediment reduction will also assist in the reduction of phosphorus originating from transitional land uses and stream bank erosion.
Notice of the draft TMDL will be published in the PA Bulletin and local newspapers with a 30 day comment period provided. A public meeting with watershed residents will be held to discuss the TMDL. Notice of final TMDL approval will be posted on the Department website.
229