chapter thirteen:
DESCRIPTION
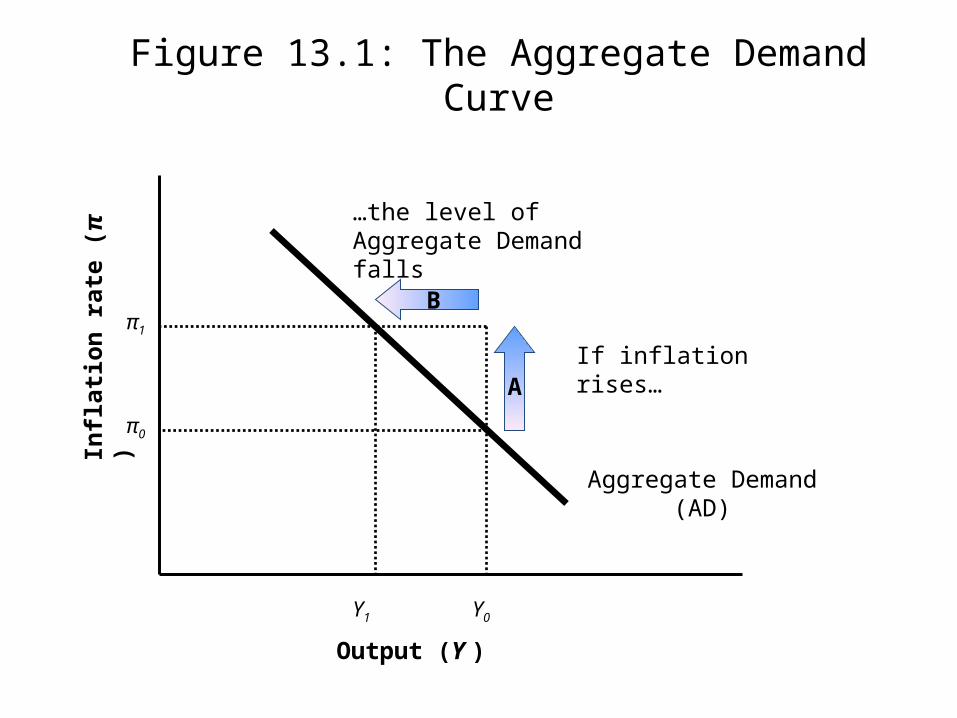
Chapter Thirteen:. Aggregate Supply, Aggregate Demand, and Inflation: Putting it All Together. Aggregate Demand and Inflation. Figure 13.1: The Aggregate Demand Curve. …the level of Aggregate Demand falls. B. π 1. Inflation rate ( π ). A. If inflation rises…. π 0. Aggregate Demand (AD). - PowerPoint PPT PresentationTRANSCRIPT

Chapter Thirteen:
Aggregate Supply, Aggregate
Demand, and Inflation: Putting it
All Together
Aggregate Demand and Inflation
Output (Y )
Infl
atio
n r
ate
(π )
Aggregate Demand(AD)
If inflation rises…
…the level of Aggregate Demand falls
Y1
π1
π0
Y0
A
B
Figure 13.1: The Aggregate Demand Curve
Output (Y )
Infl
atio
n r
ate
(π )
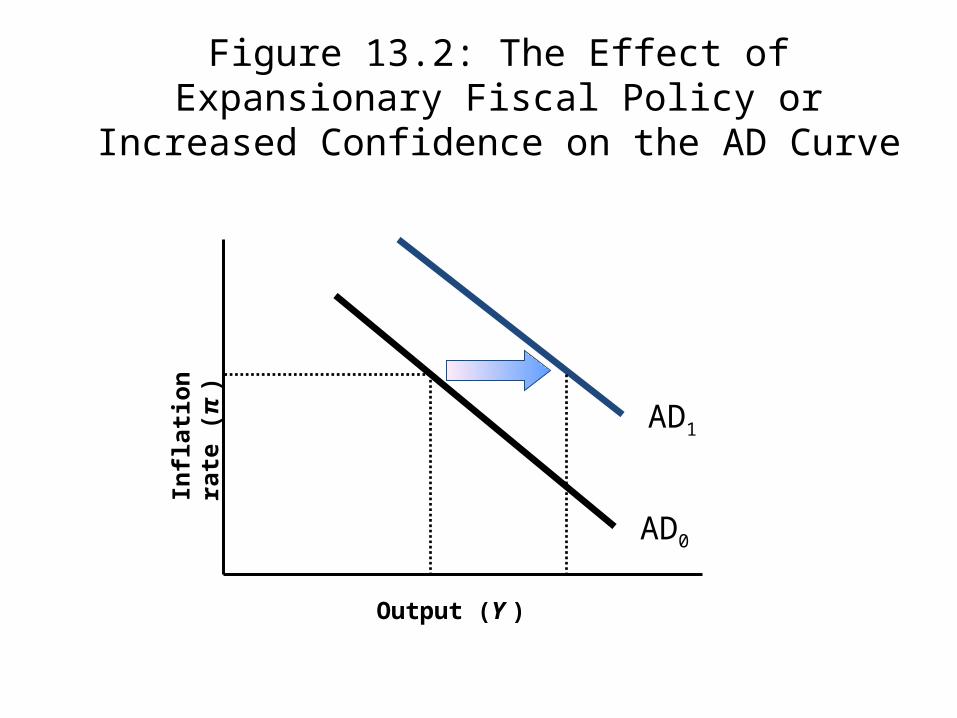
AD0
AD1
Figure 13.2: The Effect of Expansionary Fiscal Policy or Increased Confidence on the AD Curve

Aggregate Demand and Inflation

Output (Y )
Infl
atio
n r
ate
(π )
Aggregate Supply (AS)
Maximum Capacity
Y*
Unemployment
Wage-Price Spiral
Figure 13.3: The Aggregate Supply Curve

Output (Y )
Infl
atio
n r
ate
(π )
AS0
AS15 % -
3 % -
Figure 13.4: The Effect of an Increase in Inflationary Expectations on the Aggregate Supply Curve
Output (Y )
Infl
atio
n r
ate
(π )
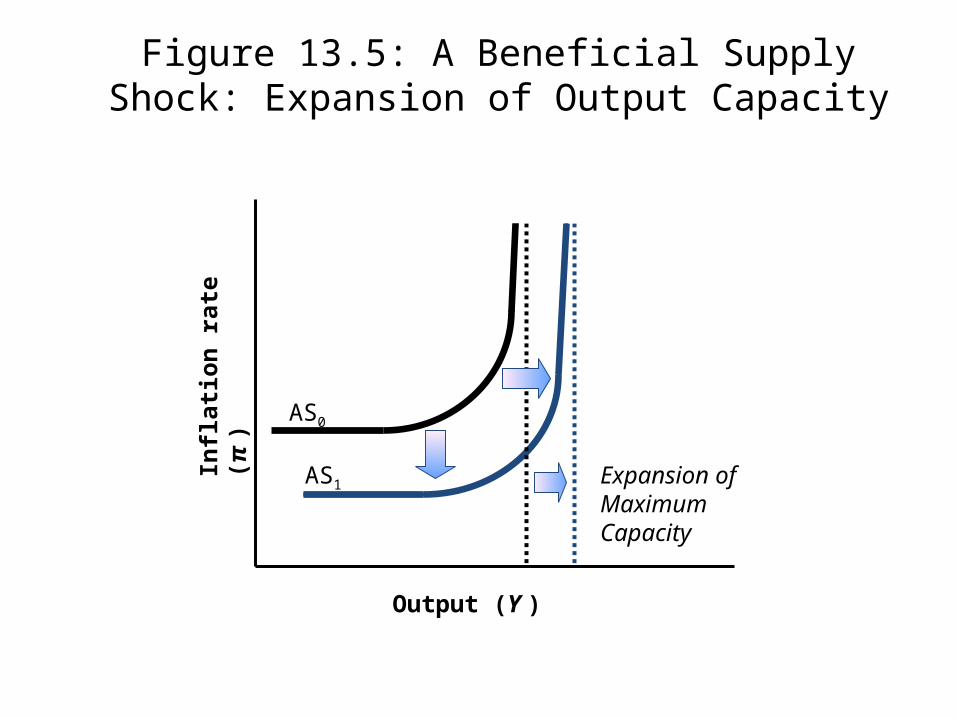
AS1
AS0
Expansion of Maximum Capacity
Figure 13.5: A Beneficial Supply Shock: Expansion of Output Capacity

Putting the AS/AD Model to Work
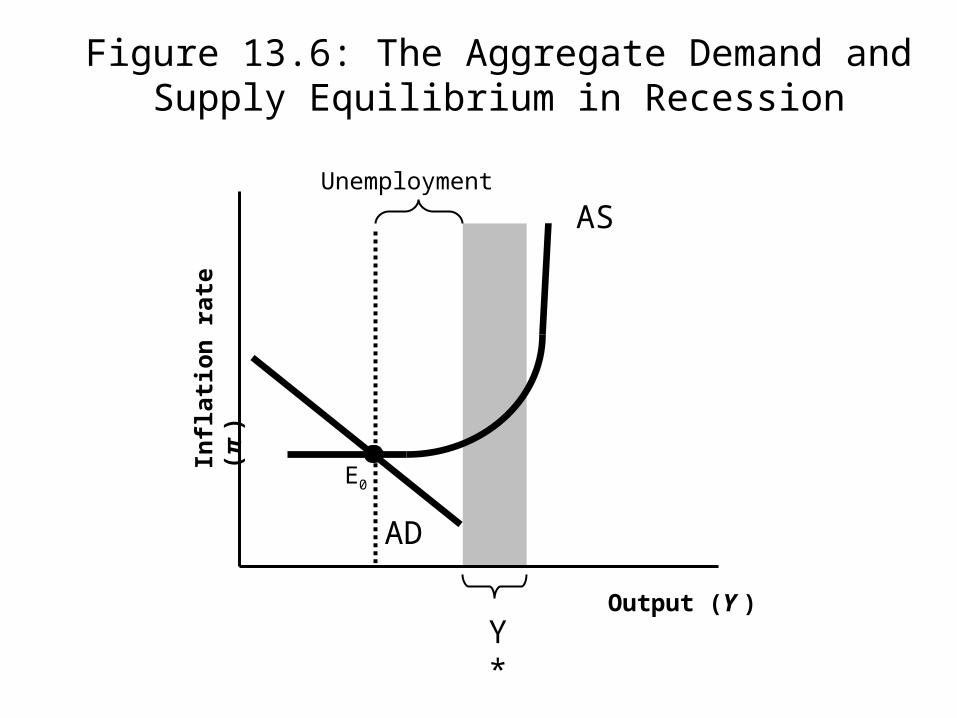
Output (Y )
Infl
atio
n r
ate
(π )
AS
Y*
AD
E0
Unemployment
Figure 13.6: The Aggregate Demand and Supply Equilibrium in Recession

Output (Y )
Infla
tion
rate
(π
) AS
Y*
AD1AD0
E1
E0
Unemployment
Figure 13.7: Expansionary Fiscal Policy in Response to a Recession
Output (Y )
Infla
tion
rate
(π
) AS
Y*
AD1
AD0
E1
E0
Unemployment
Figure 13.8: A Greater Expansion of Aggregate Demand
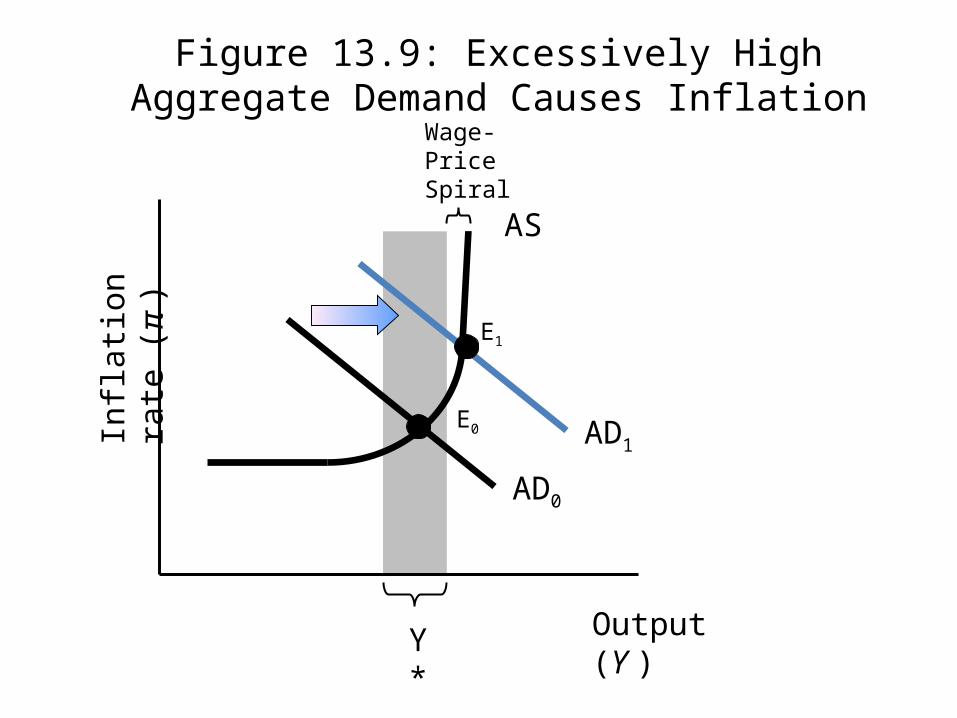
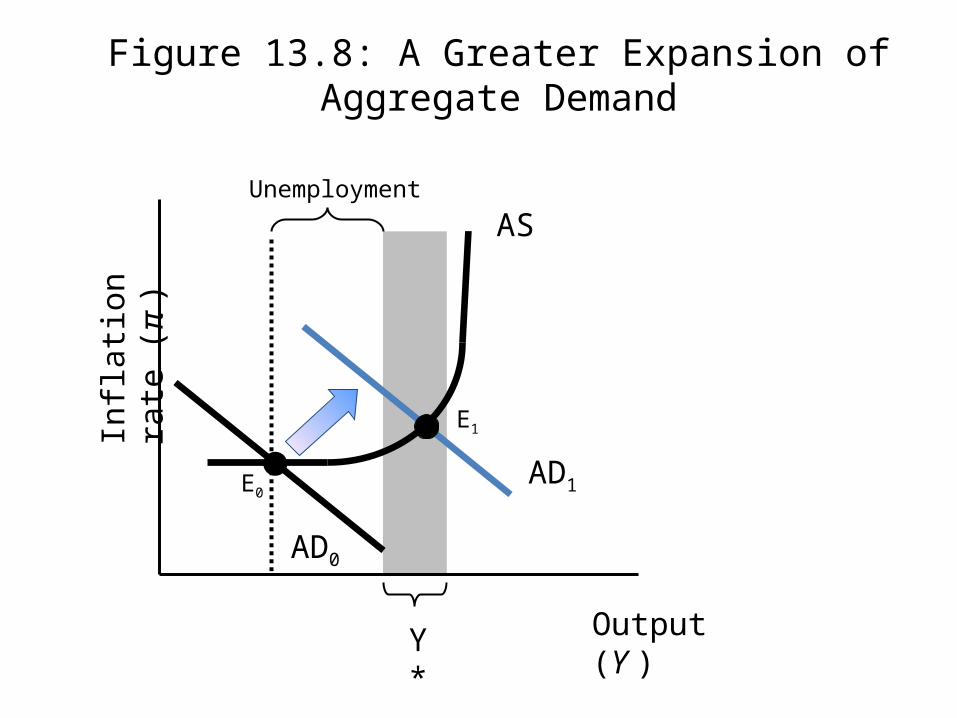
Output (Y )
Infla
tion
rate
(π
) AS
Y*
AD1
AD0
E1
E0
Wage-Price Spiral
Figure 13.9: Excessively High Aggregate Demand Causes Inflation
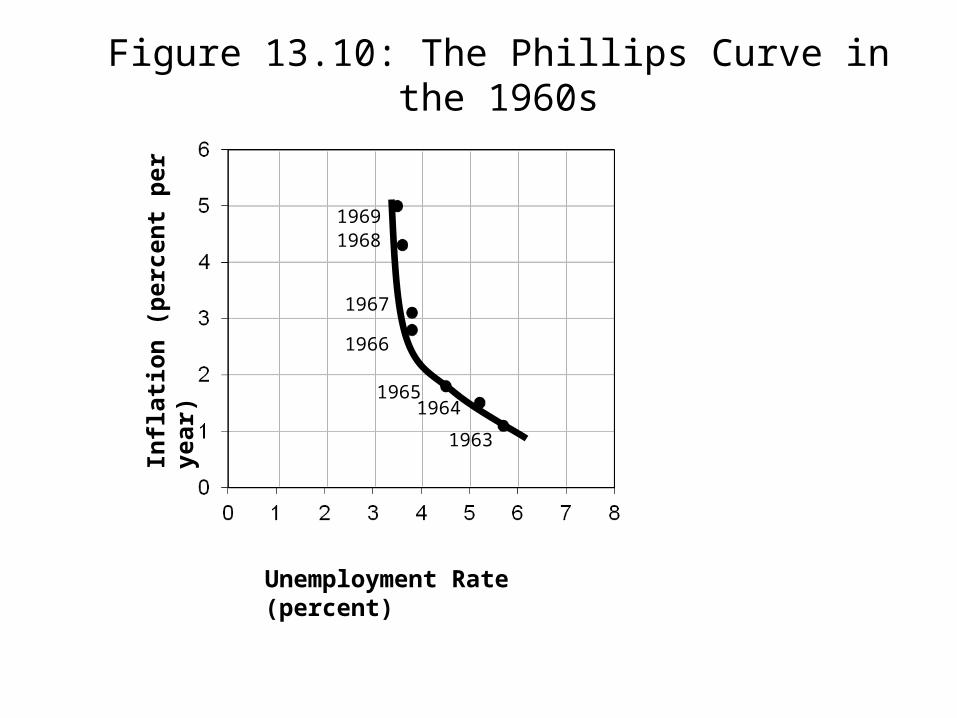
1963
19691968
1967
1966
19651964
Unemployment Rate (percent)
Infl
atio
n (
per
cen
t p
er y
ear)
Figure 13.10: The Phillips Curve in the 1960s
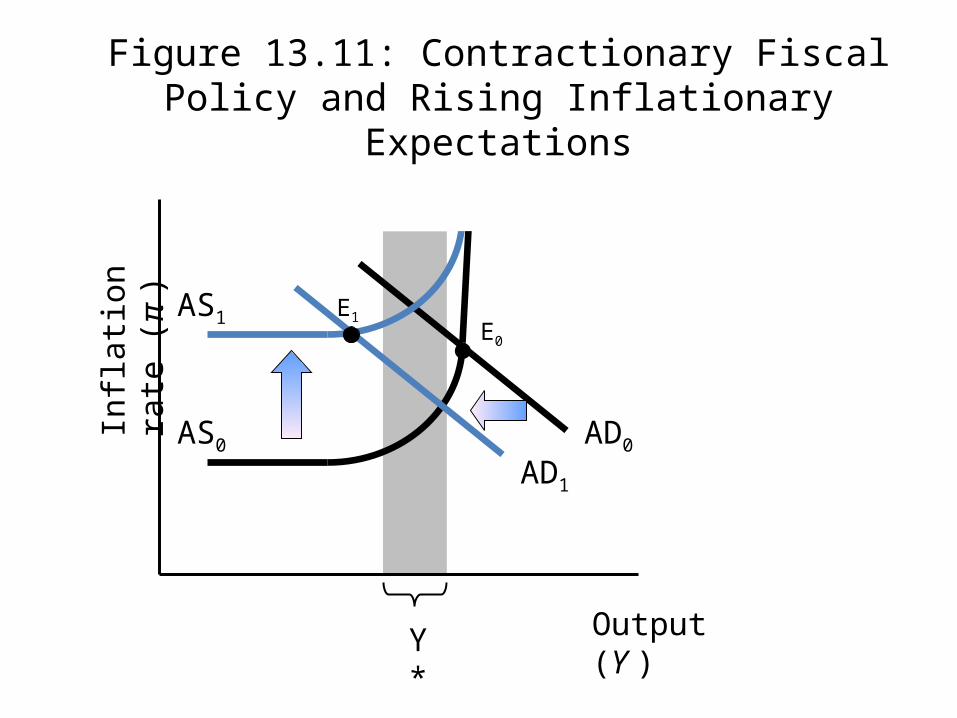
Output (Y )
Infla
tion
rate
(π
)
AS0
Y*
AD0
AD1
E0
E1AS1
Figure 13.11: Contractionary Fiscal Policy and Rising Inflationary Expectations

Output (Y )
Infla
tion
rate
(π
)
AS0
AS1
AD
E1
E0
Lower Capacity
Figure 13.12: The Effect of the Oil Price Shock of the 1970s
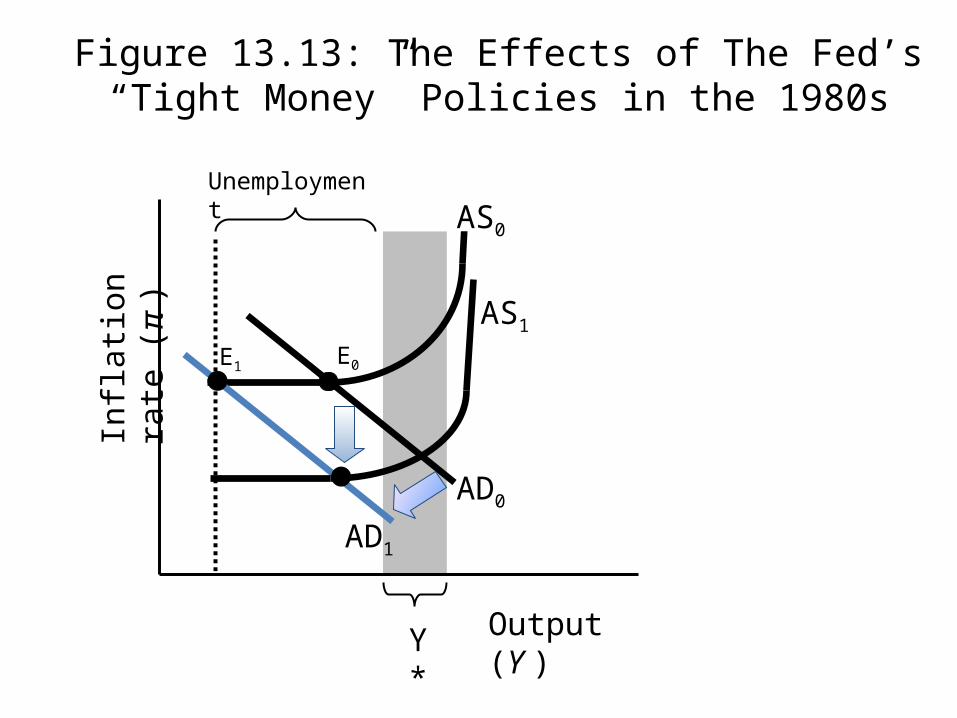
Output (Y )
Infla
tion
rate
(π
)
Y*
Unemployment
AD0
AD1
E0E1
AS1
AS0
Figure 13.13: The Effects of The Fed’s “Tight Money” Policies in the 1980s
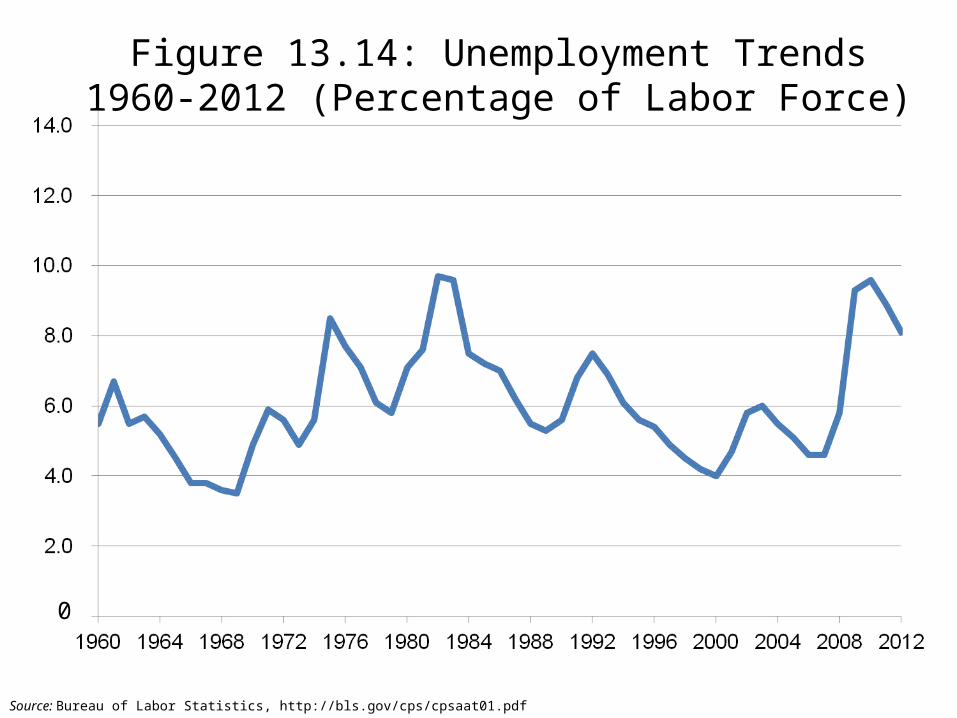
0
Figure 13.14: Unemployment Trends 1960-2012 (Percentage of Labor Force)
Source: Bureau of Labor Statistics, http://bls.gov/cps/cpsaat01.pdf

Figure 13.15: Inflation Trends 1960-2012
Source: Bureau of Labor Statistics, ftp://ftp.bls.gov/pub/special.requests/cpi/cpiai.txt

Output (Y )
Infla
tion
rate
(π
)
AS1
AS0
AS2
AD
E0
E2
E1
Higher Capacity
Figure 13.16: The Effects of Technological Innovation and Increased Efficiency

Competing Theories
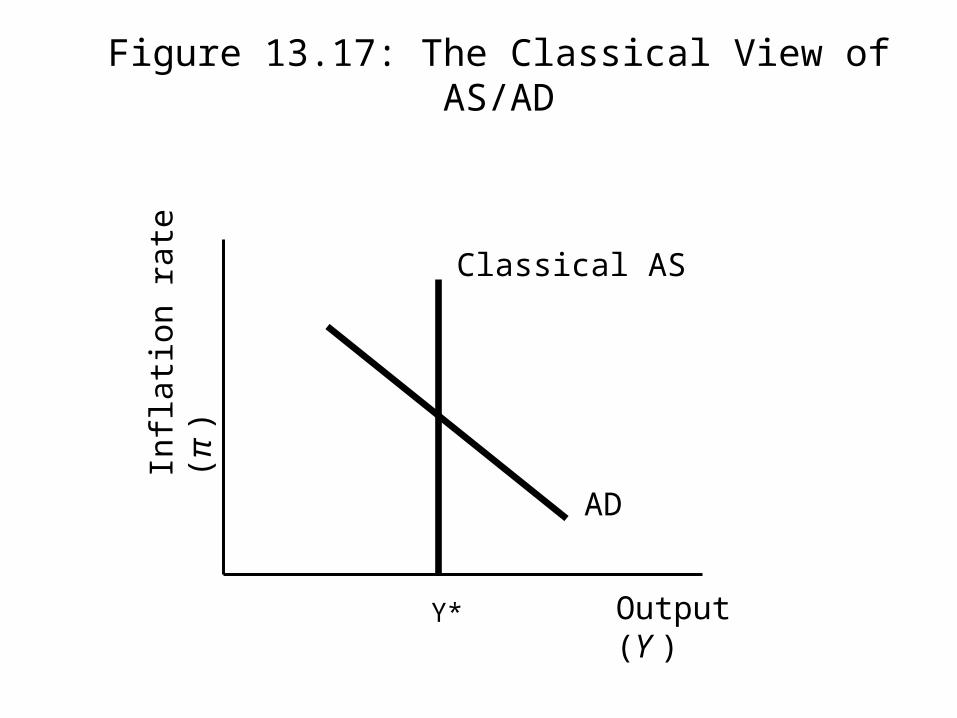
Output (Y )
Infla
tion
rate
(π
) Classical AS
Y*
AD
Figure 13.17: The Classical View of AS/AD

Output (Y )
Infla
tion
rate
(π
)
Y*
AE1
AD0
E1
E0
Classical ASR
AS1
AS0
Figure 13.18: A New Classical View of Economic Fluctuations