chapter3
TRANSCRIPT

8-1
TOPIC 3
INVENTORIES

8-2
PRE-LECTURE ASSIGNMENTS (PLEASE
ATTEMPT THESE QUESTIONS BEFORE
COMING TO CLASS):
BE8-8, BE8-13, E9-1, E9-14,
E9-22

8-3
1. Identify major classifications of inventory.
2. Distinguish between perpetual and periodic inventory
systems.
3. Identify the effects of inventory errors on the financial
statements.
4. Understand the items to include as inventory cost.
5. Describe and apply the lower-of-cost-or-net realizable
value rule.
Learning Objectives

8-4
6. Explain when companies value inventories at net realizable value.
7. Discuss accounting issues related to purchase commitments.
8. Determine ending inventory by applying the gross profit method.
9. Determine ending inventory by applying the retail inventory method.
10. Know what is consignment?
11. Explain how to report and analyze inventory.
Learning Objectives

8-5
Goods in transit
Consigned goods
Special sales
agreements
Inventory errors
Inventory Issues
Physical Goods
Included in
Inventory
Cost Included in
Inventory
Cost Flow
Assumptions
Classification
Cost flow
Control
Basic inventory
valuation
Product costs
Period costs
Purchase
discounts
Specific
identification
Average cost
FIFO
Summary analysis
Valuation of Inventories:
Cost-Basis Approach

8-6
Inventories are:
items held for sale, or
goods to be used in the production of goods to be sold.
FRS 102 defines::
- held for sale in the ordinary course of business
- in the process of production for such sale, or
- in the form of materials or supplies to be consumed in the production
process or in the rendering of services.
Inventory Issues
LO 1 Identify major classifications of inventory.
Classification

8-7Financial Accounting and Reporting 1 7
Inventory is one of the most important resources especially for trading companies.
Inventory accounting is very important because it affects the financial statement in two ways: the amount of inventory reported in the balance sheet
the determination of cost of goods sales and the net profit in the Income Statement. Cost of goods sold is usually the biggest type of expense incurred by a company

8-8
One inventory
account.
Purchase goods
in form ready for
sale.
Classification
Inventory Issues
LO 1 Identify major classifications of inventory.
Illustration 8-1

8-9
Three accounts
• Raw materials
• Work in process
• Finished goods
Classification
Inventory Issues
LO 1
Illustration 8-1
8-10Financial Accounting and Reporting 1 10
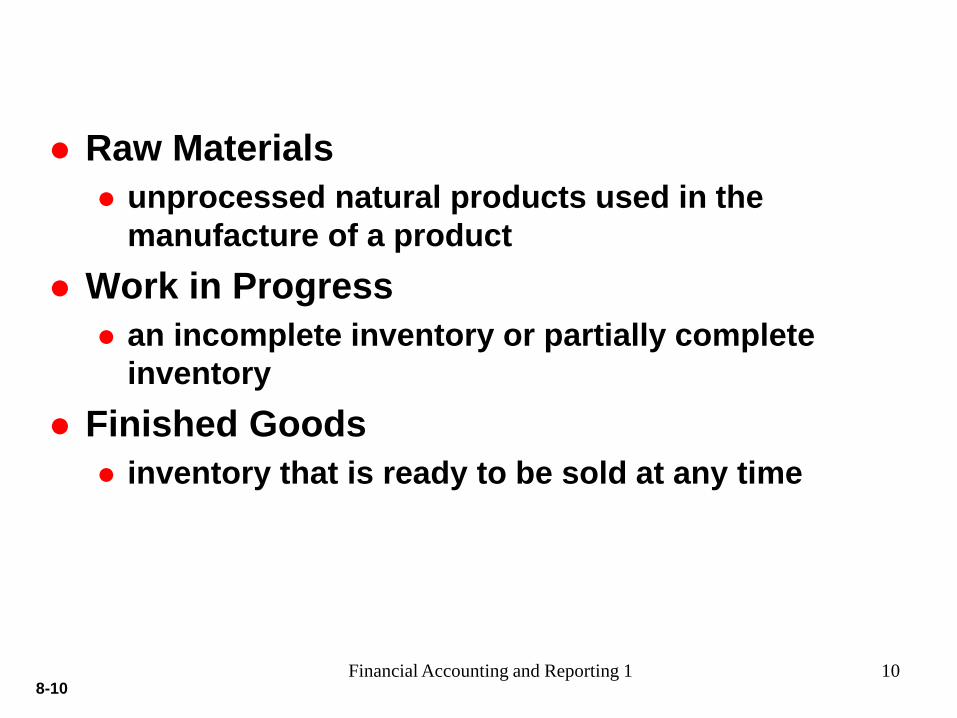
Raw Materials
unprocessed natural products used in the
manufacture of a product
Work in Progress
an incomplete inventory or partially complete
inventory
Finished Goods
inventory that is ready to be sold at any time

8-11
Inventory Cost Flow
Inventory Issues
Illustration 8-2
LO 1 Identify major classifications of inventory.

8-12Financial Accounting and Reporting 1 12
Costs of purchase
Costs of conversion
Other costs

8-13Financial Accounting and Reporting 1 13
Comprise the purchase price, import duties and other
taxes (other than those subsequently recoverable by
the entity from the taxing authorities), and transport,
handling and other costs directly attributable to the
acquisition of finished goods, materials, and services.
Trade discounts, rebates, and other similar items are
deducted in determining the costs of purchase.

8-14Financial Accounting and Reporting 1 14
Free On Board (FOB), is a transportation
term that indicates that the price of goods
includes delivery at the seller’s expense
to a specified point and no further.
8-15Financial Accounting and Reporting 1 15
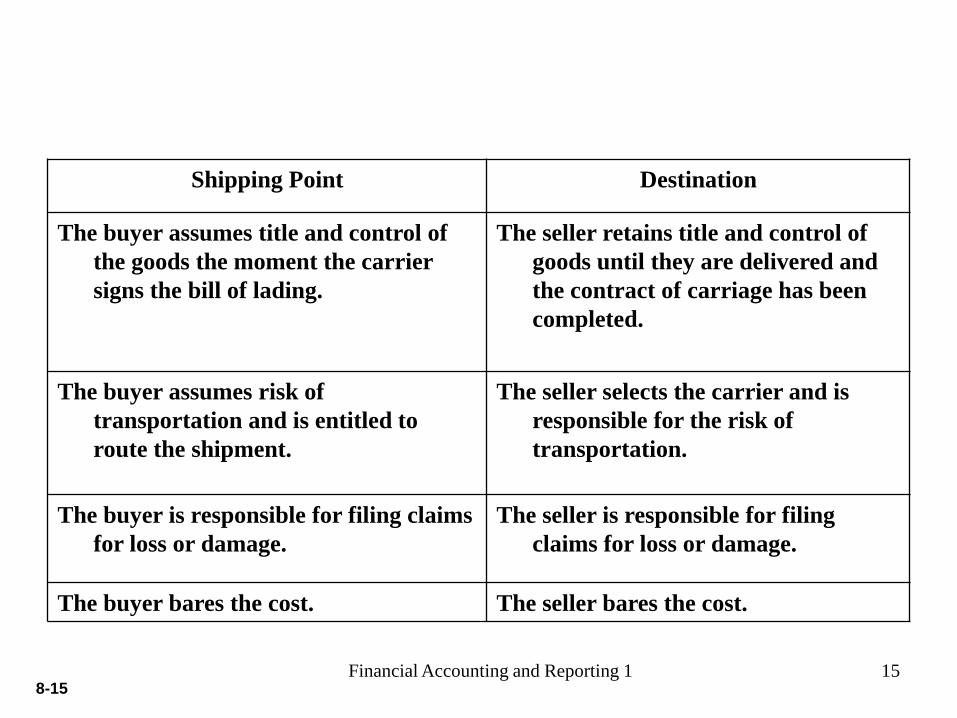
Shipping Point Destination
The buyer assumes title and control of
the goods the moment the carrier
signs the bill of lading.
The seller retains title and control of
goods until they are delivered and
the contract of carriage has been
completed.
The buyer assumes risk of
transportation and is entitled to
route the shipment.
The seller selects the carrier and is
responsible for the risk of
transportation.
The buyer is responsible for filing claims
for loss or damage.
The seller is responsible for filing
claims for loss or damage.
The buyer bares the cost. The seller bares the cost.

8-16Financial Accounting and Reporting 1 16
The costs of conversion of inventories include:
costs directly related to the units of production,
such as direct labor and direct material
a systematic allocation of fixed and variable
production overheads that are incurred in
converting materials into finished goods.

8-17Financial Accounting and Reporting 1 17
Examples of costs excluded from the cost of inventories and recognized as expenses in the period in which they are incurred are: abnormal amounts of wasted materials, labor or other
production costs
storage costs, unless those costs are necessary in the production process before a further production stage
administrative overheads that do not contribute to bringing inventories to their present location and condition, and
selling costs.

8-18
Inventory Cost Flow
Inventory Issues
Illustration 8-3
LO 1 Identify major classifications of inventory.
Companies use one of two types of systems for maintaining
inventory records — perpetual system or periodic system.

8-19
Inventory Cost Flow
LO 2 Distinguish between perpetual and periodic inventory systems.
Perpetual System
1. Purchases of merchandise are debited to Inventory.
2. Freight-in is debited to Inventory. Purchase returns and
allowances and purchase discounts are credited to Inventory.
3. Cost of goods sold is debited and Inventory is credited for each
sale.
4. Subsidiary records show quantity and cost of each type of
inventory on hand.
The perpetual inventory system provides a continuous
record of Inventory and Cost of Goods Sold.

8-20
Inventory Cost Flow
LO 2 Distinguish between perpetual and periodic inventory systems.
Periodic System
1. Purchases of merchandise are debited to Purchases.
2. Ending Inventory determined by physical count.
3. Calculation of Cost of Goods Sold:
Beginning inventory $ 100,000
Purchases, net 800,000
Goods available for sale 900,000
Ending inventory 125,000
Cost of goods sold $ 775,000
8-21Financial Accounting and Reporting 1 21
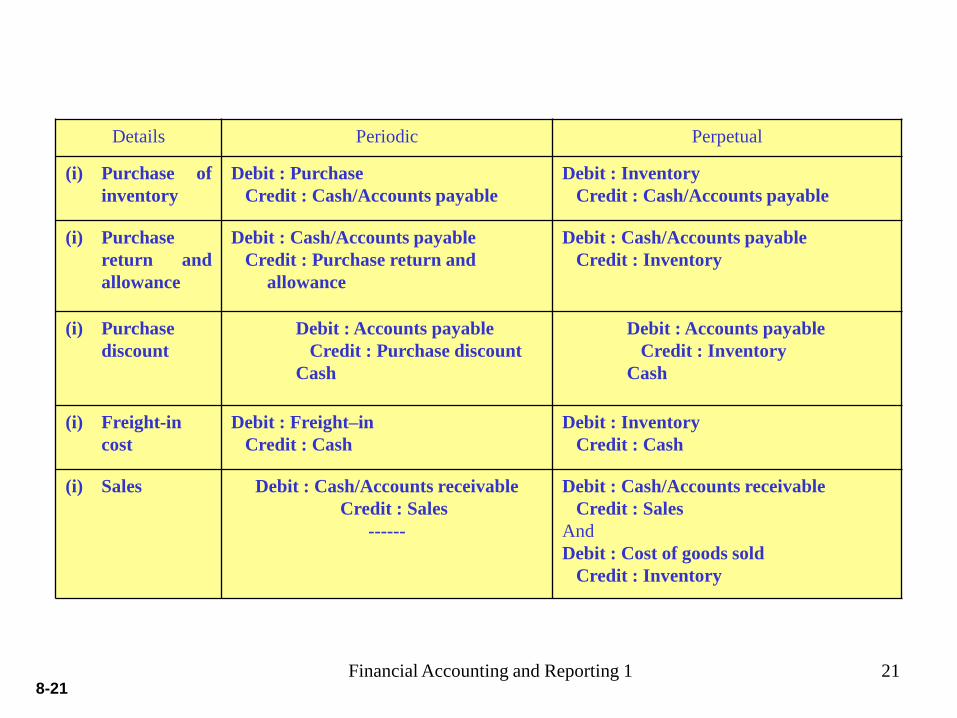
Details Periodic Perpetual
(i) Purchase of
inventory
Debit : Purchase
Credit : Cash/Accounts payable
Debit : Inventory
Credit : Cash/Accounts payable
(i) Purchase
return and
allowance
Debit : Cash/Accounts payable
Credit : Purchase return and
allowance
Debit : Cash/Accounts payable
Credit : Inventory
(i) Purchase
discount
Debit : Accounts payable
Credit : Purchase discount
Cash
Debit : Accounts payable
Credit : Inventory
Cash
(i) Freight-in
cost
Debit : Freight–in
Credit : Cash
Debit : Inventory
Credit : Cash
(i) Sales Debit : Cash/Accounts receivable
Credit : Sales
------
Debit : Cash/Accounts receivable
Credit : Sales
And
Debit : Cost of goods sold
Credit : Inventory
8-22Financial Accounting and Reporting 1 22
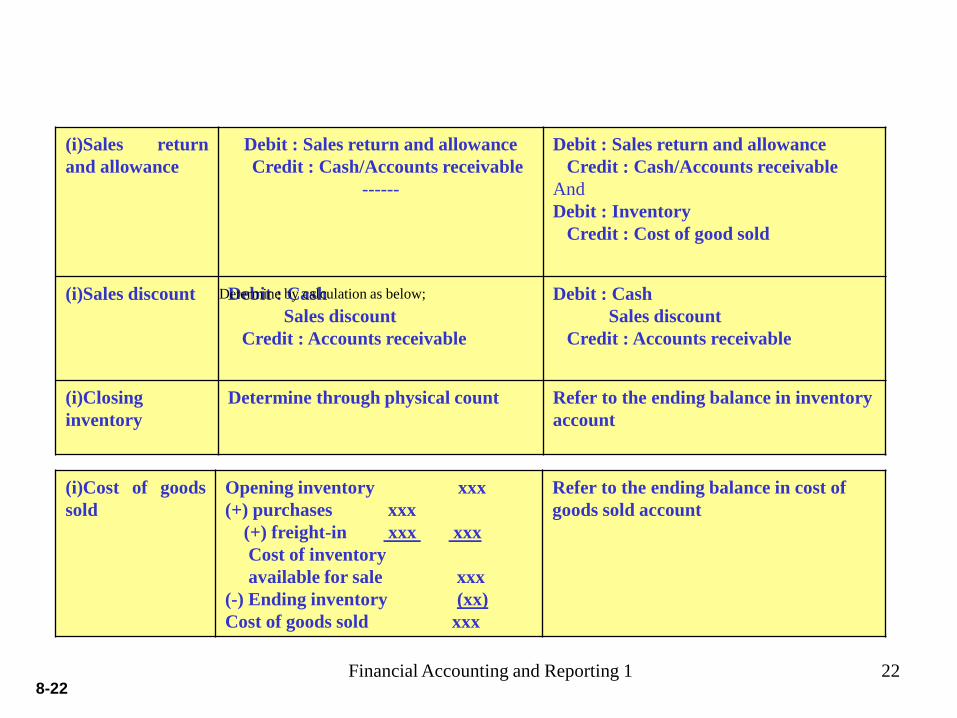
(i)Sales return
and allowance
Debit : Sales return and allowance
Credit : Cash/Accounts receivable
------
Debit : Sales return and allowance
Credit : Cash/Accounts receivable
And
Debit : Inventory
Credit : Cost of good sold
(i)Sales discount Debit : Cash
Sales discount
Credit : Accounts receivable
Debit : Cash
Sales discount
Credit : Accounts receivable
(i)Closing
inventory
Determine through physical count Refer to the ending balance in inventory
account
Determine by calculation as below;
(i)Cost of goods
sold
Opening inventory xxx
(+) purchases xxx
(+) freight-in xxx xxx
Cost of inventory
available for sale xxx
(-) Ending inventory (xx)
Cost of goods sold xxx
Refer to the ending balance in cost of
goods sold account

8-23Financial Accounting and Reporting 1 23
When a company uses the perpetual system, and a
difference between the recorded inventory and the
physical inventory is apparent at the end, adjustment
needs to be made.
Usually, the physical amount tends to be less that the
amount recorded. If this is the case, the adjusting
entry will be:
Debit: Inventory deficit/excess
Credit: Inventory

8-24Financial Accounting and Reporting 1 24
The inventory deficit/excess will affect the
cost of goods sold. Thus, the inventory/deficit
account will be closed to cost of goods sold
as follows:
Debit: COGS
Credit: Inventory deficit/excess

8-25
Inventory Cost Flow
LO 2 Distinguish between perpetual and periodic inventory systems.
Illustration: Fesmire Company had the following transactions
during the current year.
Record these transactions using the Perpetual and Periodic
systems.

8-26
Inventory Cost Flow
LO 2 Distinguish between perpetual and periodic inventory systems.
Illustration 8-4Illustration:

8-27
Inventory Cost Flow
LO 2 Distinguish between perpetual and periodic inventory systems.
Illustration: Assume that at the end of the reporting period,
the perpetual inventory account reported an inventory balance
of $4,000. However, a physical count indicates inventory of
$3,800 is actually on hand. The entry to record the necessary
write-down is as follows.
Inventory Over and Short 200
Inventory 200
Note: Inventory Over and Short adjusts Cost of Goods Sold. In practice, companies
sometimes report Inventory Over and Short in the “Other income and expense” section
of the income statement.
8-28
Inventory Control
Inventory Issues
LO 2 Distinguish between perpetual and periodic inventory systems.
All companies need periodic verification of the inventory
records by actual count, weight, or measurement, with the
counts compared with the detailed inventory records.
Companies should take the physical inventory near the
end of their fiscal year, to properly report inventory
quantities in their annual accounting reports.

8-29
Inventory Issues
LO 2 Distinguish between perpetual and periodic inventory systems.
Basic Issues in Inventory Valuation
Companies must allocate the cost of all the goods available
for sale (or use) between the goods that were sold or used
and those that are still on hand.
Illustration 8-5

8-30
Basic Issues in Inventory Valuation
LO 2 Distinguish between perpetual and periodic inventory systems.
The physical goods (goods on hand, goods in transit,
consigned goods, special sales agreements).
The costs to include (product vs. period costs).
The cost flow assumption (specific Identification,
average cost, FIFO, retail, etc.).
Valuation requires determining

8-31
A company should record purchases when it obtains
legal title to the goods.
Physical Goods Included in Inventory
LO 2 Distinguish between perpetual and periodic inventory systems.
Illustration 8-6
8-32
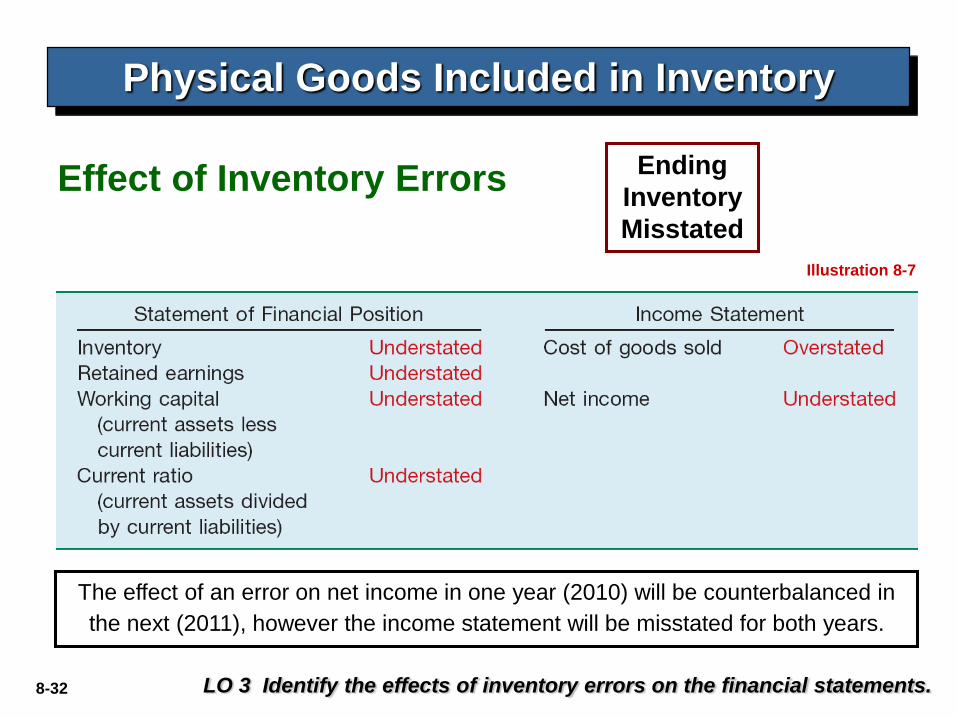
Physical Goods Included in Inventory
LO 3 Identify the effects of inventory errors on the financial statements.
Effect of Inventory Errors
The effect of an error on net income in one year (2010) will be counterbalanced in
the next (2011), however the income statement will be misstated for both years.
Illustration 8-7
Ending
Inventory
Misstated

8-33
Effect of Inventory Errors
Illustration: Yei Chen Corp. understates its ending inventory by
HK$10,000 in 2010; all other items are correctly stated.Illustration 8-8
LO 3

8-34
Physical Goods Included in Inventory
LO 3 Identify the effects of inventory errors on the financial statements.
Effect of Inventory Errors
The understatement does not affect cost of goods sold and net income because the
errors offset one another.
Illustration 8-9
Purchases
and Inventory
Misstated
8-35
Costs Included in Inventory
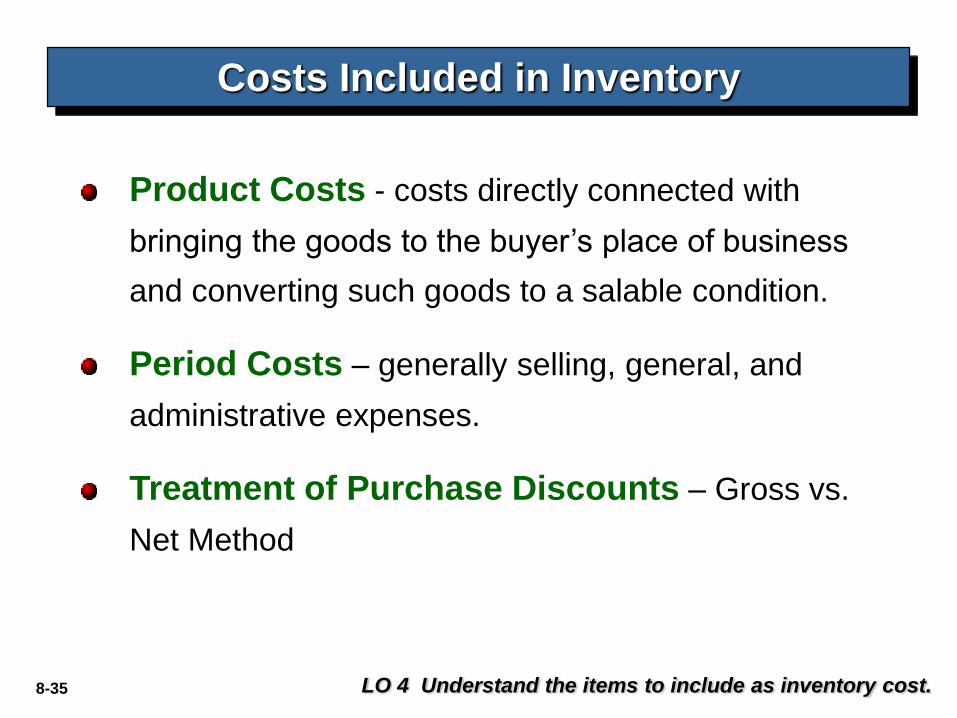
LO 4 Understand the items to include as inventory cost.
Product Costs - costs directly connected with
bringing the goods to the buyer’s place of business
and converting such goods to a salable condition.
Period Costs – generally selling, general, and
administrative expenses.
Treatment of Purchase Discounts – Gross vs.
Net Method

8-36
Costs Included in Inventory
LO 4 Understand the items to include as inventory cost.
Treatment of Purchase Discounts
Illustration 8-11
* $4,000 x 2% = $80
*
** $10,000 x 98% = $9,800
**

8-37
Method adopted should be one that most clearly reflects periodic income.
Cost Flow Assumption Adopted
does not need to equal
Physical Movement of Goods
Which Cost Flow Assumption to Adopt?
Specific Identification --- Average Cost --- LIFO
LO 5 Describe and compare the methods used to price inventories.
8-38
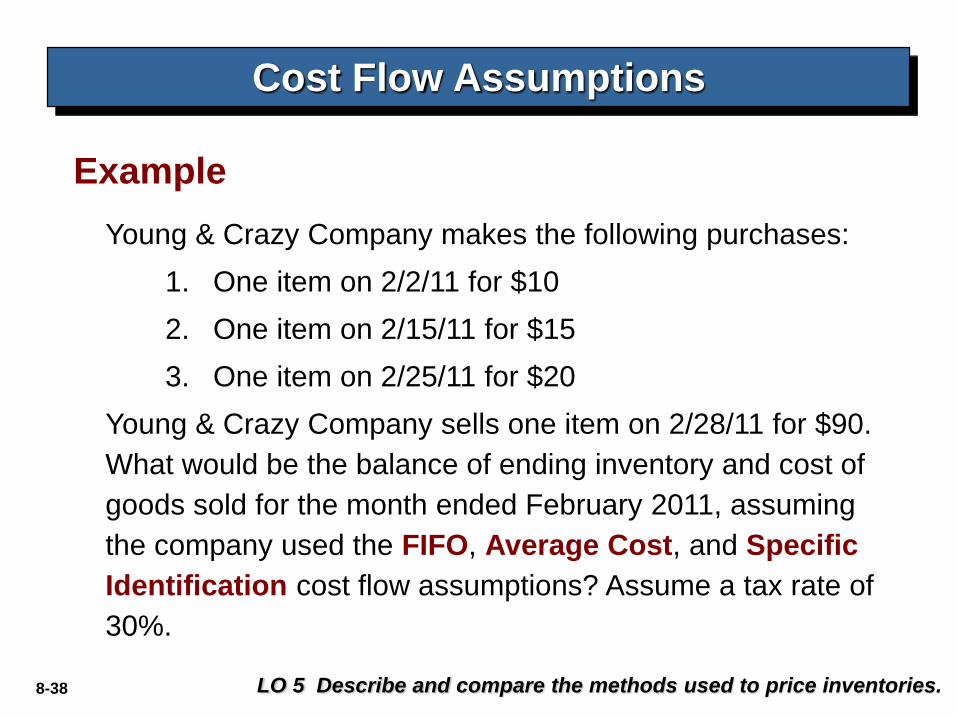
Young & Crazy Company makes the following purchases:
1. One item on 2/2/11 for $10
2. One item on 2/15/11 for $15
3. One item on 2/25/11 for $20
Young & Crazy Company sells one item on 2/28/11 for $90.
What would be the balance of ending inventory and cost of
goods sold for the month ended February 2011, assuming
the company used the FIFO, Average Cost, and Specific
Identification cost flow assumptions? Assume a tax rate of
30%.
Example
Cost Flow Assumptions
LO 5 Describe and compare the methods used to price inventories.

8-39
Purchase on
2/2/11 for $10
Purchase on
2/15/11 for $15
Purchase on
2/25/11 for $20
Inventory Balance
= $ 45
Young & Crazy Company
Income Statement
For the Month of Feb. 2011
Sales $ 90
Cost of goods sold 0
Gross profit 90
Expenses:
Administrative 14
Selling 12
Interest 7
Total expenses 33
Income before tax 57
Taxes 17
Net Income $ 40
Cost Flow Assumptions
“First-In-First-Out (FIFO)”
LO 5

8-40
Purchase on
2/2/11 for $10
Purchase on
2/15/11 for $15
Purchase on
2/25/11 for $20
Cost Flow Assumptions
Inventory Balance
= $ 35
Young & Crazy Company
Income Statement
For the Month of Feb. 2011
Sales $ 90
Cost of goods sold 10
Gross profit 80
Expenses:
Administrative 14
Selling 12
Interest 7
Total expenses 33
Income before tax 47
Taxes 14
Net Income $ 33
“First-In-First-Out (FIFO)”
LO 5

8-41
Purchase on
2/2/11 for $10
Purchase on
2/15/11 for $15
Purchase on
2/25/11 for $20
Inventory Balance
= $ 45
Young & Crazy Company
Income Statement
For the Month of Feb. 2011
Sales $ 90
Cost of goods sold 0
Gross profit 90
Expenses:
Administrative 14
Selling 12
Interest 7
Total expenses 33
Income before tax 57
Taxes 17
Net Income $ 40
Cost Flow Assumptions
“Average Cost”
LO 5

8-42
Purchase on
2/2/11 for $10
Purchase on
2/15/11 for $15
Purchase on
2/25/11 for $20
Inventory Balance
= $ 30
Cost Flow Assumptions
Young & Crazy Company
Income Statement
For the Month of Feb. 2011
Sales $ 90
Cost of goods sold 15
Gross profit 75
Expenses:
Administrative 14
Selling 12
Interest 7
Total expenses 33
Income before tax 42
Taxes 12
Net Income $ 30
“Average Cost”
LO 5

8-43
Purchase on
2/2/11 for $10
Purchase on
2/15/11 for $15
Purchase on
2/25/11 for $20
Inventory Balance
= $ 45
Young & Crazy Company
Income Statement
For the Month of Feb. 2011
Sales $ 90
Cost of goods sold 0
Gross profit 90
Expenses:
Administrative 14
Selling 12
Interest 7
Total expenses 33
Income before tax 57
Taxes 17
Net Income $ 40
Cost Flow Assumptions
“Specific Identification”
LO 5

8-44
Young & Crazy Company
Income Statement
For the Month of Feb. 2011
Sales $ 90
Cost of goods sold 0
Gross profit 90
Expenses:
Administrative 14
Selling 12
Interest 7
Total expenses 33
Income before tax 57
Taxes 17
Net Income $ 40
Depends which one is sold
Purchase on
2/2/11 for $10
Purchase on
2/15/11 for $15
Purchase on
2/25/11 for $20
Inventory Balance
= $ 45
Cost Flow Assumptions
“Specific Identification”
LO 5

8-45
Financial Statement Summary
FIFO Average
Sales 90$ 90$
Cost of goods sold 10 15
Gross profit 80 75
Operating expenses:
Administrative 14 14
Selling 12 12
Interest 7 7
Total expenses 33 33
Income before taxes 47 42
Income tax expense 14 12
Net income 33$ 30$
Inventory Balance 3035
Cost Flow Assumptions
LO 5

8-46
Cost Flow Assumptions
LO 5
Illustration: Call-Mart Inc. had the following transactions in
its first month of operations.
Beginning inventory (2,000 x $4) $ 8,000
Purchases:
6,000 x $4.40 26,400
2,000 x 4.75 9,500
Goods available for sale $43,900
Calculate Goods Available for Sale

8-47
Specific Identification
Illustration: Assume that Call-Mart Inc.’s 6,000 units of inventory
consists of 1,000 units from the March 2 purchase, 3,000 from the March
15 purchase, and 2,000 from the March 30 purchase. Compute the
amount of ending inventory and cost of goods sold.Illustration 8-12

8-48
Average Cost
Illustration 8-13Weighted-Average
LO 5 Describe and compare the methods used to price inventories.

8-49
Average Cost
Illustration 8-14
In this method, Call-Mart computes a new average unit
cost each time it makes a purchase.
Moving-Average
LO 5 Describe and compare the methods used to price inventories.

8-50
First-In, First-Out (FIFO)
Illustration 8-15
Periodic Method
Determine cost of ending inventory by taking the cost of the most recent
purchase and working back until it accounts for all units in the inventory.
LO 5 Describe and compare the methods used to price inventories.

8-51
First-In, First-Out (FIFO)
Illustration 8-16
Perpetual Method
In all cases where FIFO is used, the inventory and cost of goods sold would
be the same at the end of the month whether a perpetual or periodic system
is used.
LO 5 Describe and compare the methods used to price inventories.

8-52
Inventory Valuation Methods - Summary
Illustration 8-17
LO 5 Describe and compare the methods used to price inventories.

8-53
Inventory Valuation Methods - Summary
Illustration 8-18
Balances of Selected Items
under Alternative Inventory
Valuation Methods
LO 5 Describe and compare the methods used to price inventories.

8-54 LO 6 Describe the LIFO cost flow assumption.
Under IFRS, LIFO is not permitted for financial reporting
purposes.
Nonetheless, LIFO is permitted for financial reporting
purposes in the United States, it is permitted for tax purposes
in some countries, and its use can result in significant tax
savings.

8-55 LO 6
Illustration: Call-Mart Inc. had the following transactions in
its first month of operations.
Beginning inventory (2,000 x $4) $ 8,000
Purchases:
6,000 x $4.40 26,400
2,000 x 4.75 9,500
Goods available for sale $43,900
Calculate Goods Available for Sale
Last-In, First-Out (LIFO)

8-56
Last-In, First-Out (LIFO)
Illustration 8A-1
Periodic Method
The cost of the total quantity sold or issued during the month comes from the
most recent purchases.
LO 6 Describe the LIFO cost flow assumption.

8-57
Last-In, First-Out (LIFO)
Illustration 8A-2
Perpetual Method
The LIFO method results in different ending inventory and cost of goods sold
amounts than the amounts calculated under the periodic method.
LO 6 Describe the LIFO cost flow assumption.
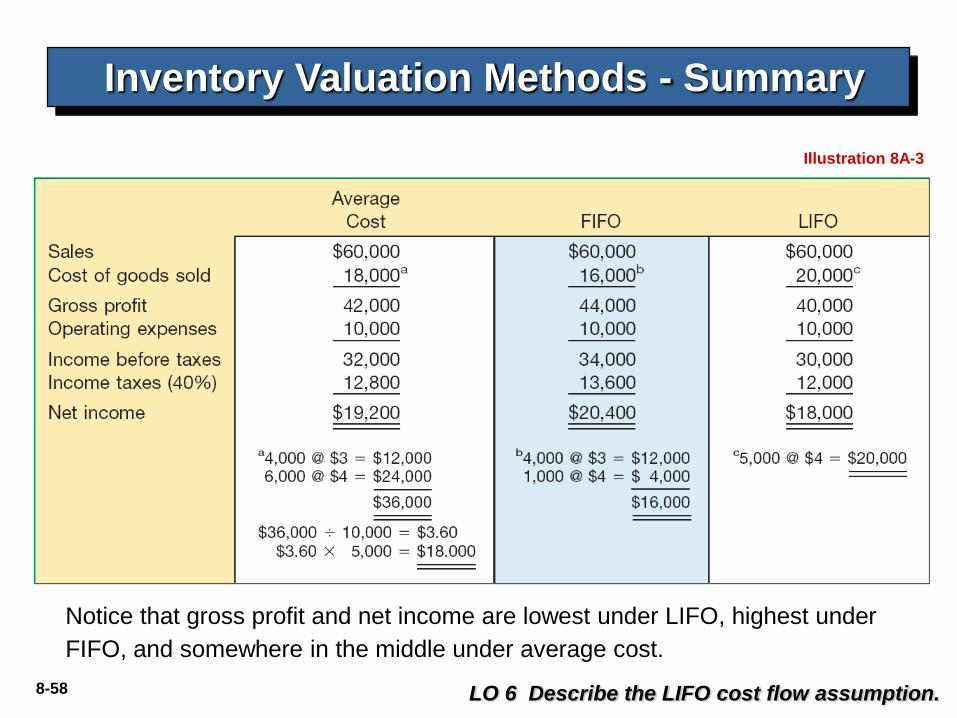
8-58
Illustration 8A-3
Inventory Valuation Methods - Summary
Notice that gross profit and net income are lowest under LIFO, highest under
FIFO, and somewhere in the middle under average cost.
LO 6 Describe the LIFO cost flow assumption.
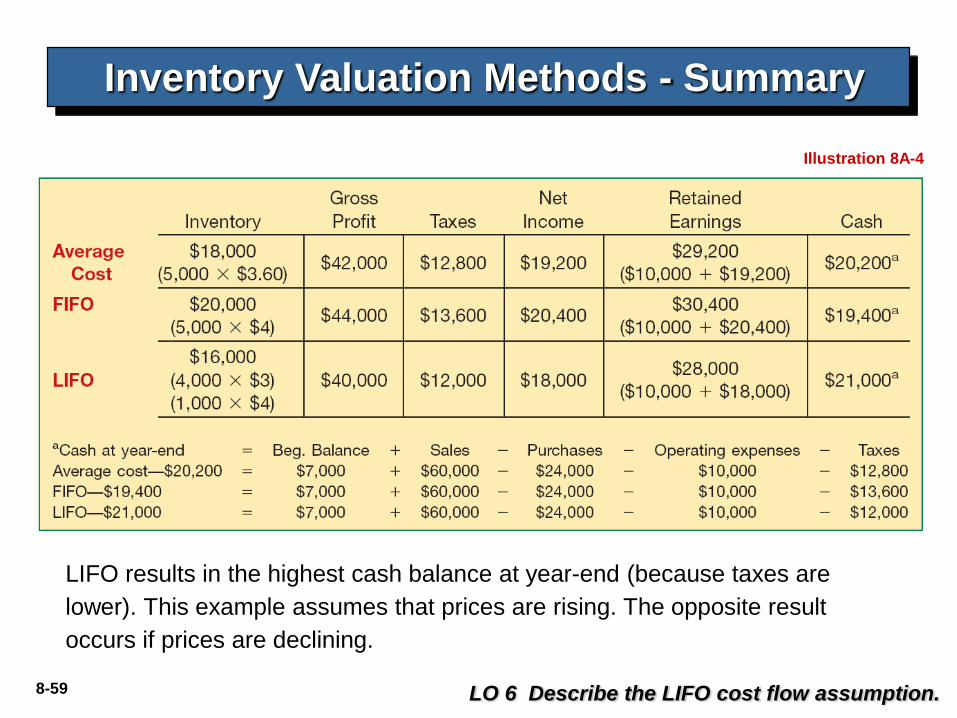
8-59
Illustration 8A-4
Inventory Valuation Methods - Summary
LIFO results in the highest cash balance at year-end (because taxes are
lower). This example assumes that prices are rising. The opposite result
occurs if prices are declining.
LO 6 Describe the LIFO cost flow assumption.

8-60Financial Accounting and Reporting 1 60
FRS 102 in paragraph 23 states that:
The cost of inventories of items that are not
ordinarily interchangeable and goods or
services produced and segregated for
specific projects shall be assigned by using
specific identification of their individual costs.
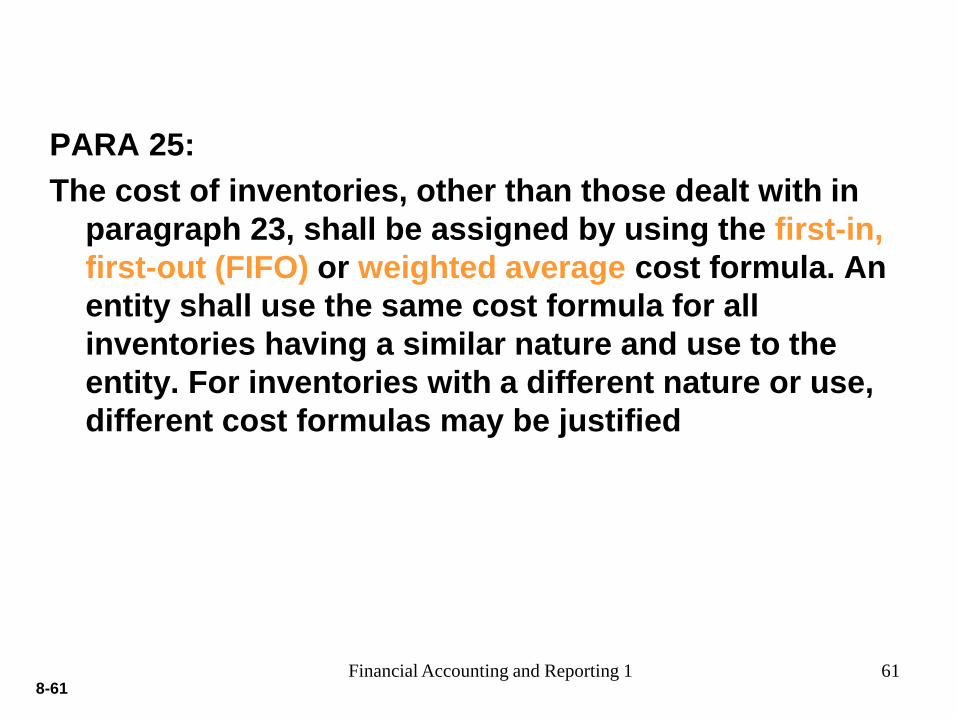
8-61Financial Accounting and Reporting 1 61
PARA 25:
The cost of inventories, other than those dealt with in
paragraph 23, shall be assigned by using the first-in,
first-out (FIFO) or weighted average cost formula. An
entity shall use the same cost formula for all
inventories having a similar nature and use to the
entity. For inventories with a different nature or use,
different cost formulas may be justified

8-62Financial Accounting and Reporting 1 62
FRS102 paragraph IN13:
“The Standard does not permit the use of the
last-in, first-out (LIFO) formula to measure the
cost of inventories.”
8-63
A company abandons the historical cost principle
when the future utility (revenue-producing ability)
of the asset drops below its original cost.
Lower-of-Cost-or-Net Realizable Value
LO 1 Describe and apply the lower-of-cost-or-net realizable value rule.
LCNRV

8-64
Net Realizable Value
LO 1 Describe and apply the lower-of-cost-or-net realizable value rule.
Estimated selling price in the normal course of
business less estimated costs to complete and
estimated costs to make a sale.
Illustration 9-1
Lower-of-Cost-or-Net Realizable Value

8-65
Net Realizable Value
LO 1 Describe and apply the lower-of-cost-or-net realizable value rule.
Illustration 9-2
LCNRV Disclosures
Lower-of-Cost-or-Net Realizable Value

8-66
Illustration of LCNRV: Regner Foods computes its
inventory at LCNRV.
LO 1 Describe and apply the lower-of-cost-or-net realizable value rule.
Illustration 9-3
Lower-of-Cost-or-Net Realizable Value
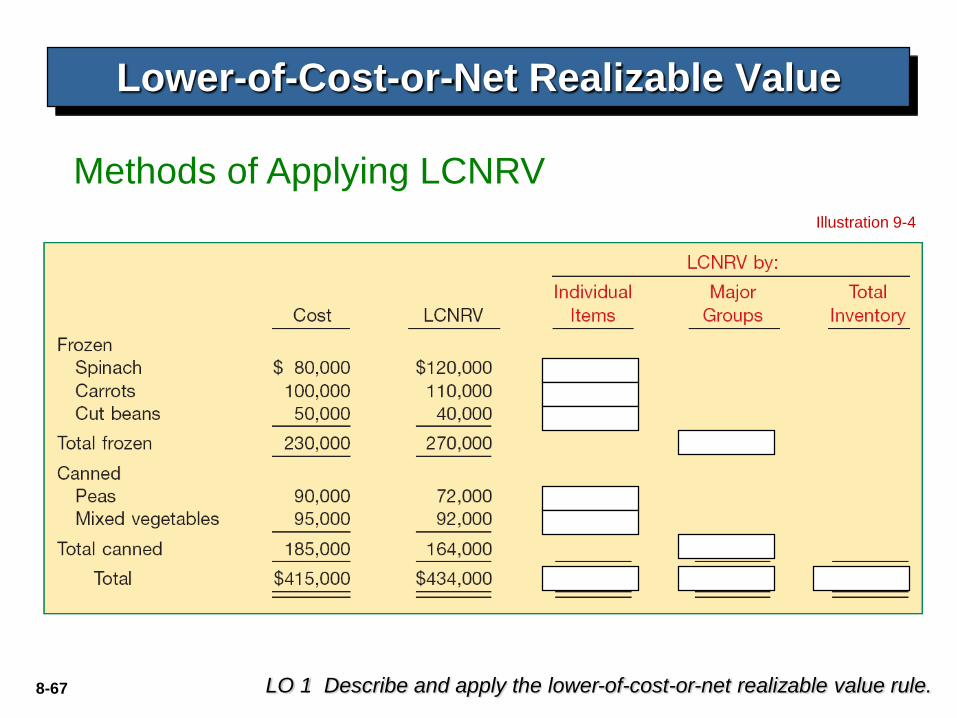
8-67
Illustration 9-4
Methods of Applying LCNRV
LO 1 Describe and apply the lower-of-cost-or-net realizable value rule.
Lower-of-Cost-or-Net Realizable Value
8-68
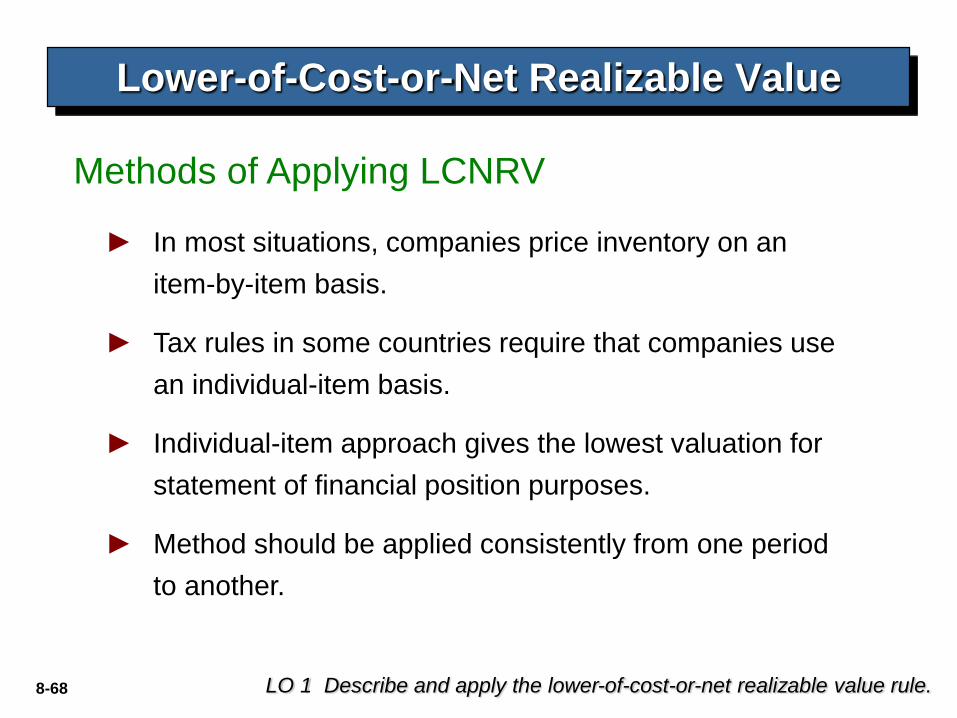
Methods of Applying LCNRV
LO 1 Describe and apply the lower-of-cost-or-net realizable value rule.
Lower-of-Cost-or-Net Realizable Value
► In most situations, companies price inventory on an
item-by-item basis.
► Tax rules in some countries require that companies use
an individual-item basis.
► Individual-item approach gives the lowest valuation for
statement of financial position purposes.
► Method should be applied consistently from one period
to another.

8-69
Cost of goods sold (before adj. to NRV) $ 108,000
Ending inventory (cost) 82,000
Ending inventory (at NRV) 70,000
Inventory 12,000
Loss due to decline to NRV 12,000
Inventory 12,000
Cost of goods sold 12,000
Loss
Method
COGS
Method
LO 1 Describe and apply the lower-of-cost-or-net realizable value rule.
Recording Net Realizable Value Instead of Cost
Lower-of-Cost-or-Net Realizable Value

8-70
COGS Loss
Method Method
Current assets:
Inventory 70,000$ 70,000$
Prepaids 20,000 20,000
Accounts receivable 350,000 350,000
Cash 100,000 100,000
Total current assets 540,000 540,000
Statement of Financial Position Presentation
LO 1 Describe and apply the lower-of-cost-or-net realizable value rule.
Lower-of-Cost-or-Net Realizable Value
Partial Statement

8-71
COGS Loss
Method Method
Sales 200,000$ 200,000$
Cost of goods sold 108,000 120,000
Gross profit 92,000 80,000
Operating expenses:
Selling 45,000 45,000
General and administrative 20,000 20,000
Total operating expenses 65,000 65,000
Other income and expense:
Loss due to NRV on inventory 12,000 -
Interest income 5,000 5,000
Total other (7,000) 5,000
Income from operations 20,000 20,000
Income tax expense 6,000 6,000
Net income 14,000$ 14,000$
Income Statement Presentation
LO 1
Lower-of-Cost-or-Net Realizable Value
8-72
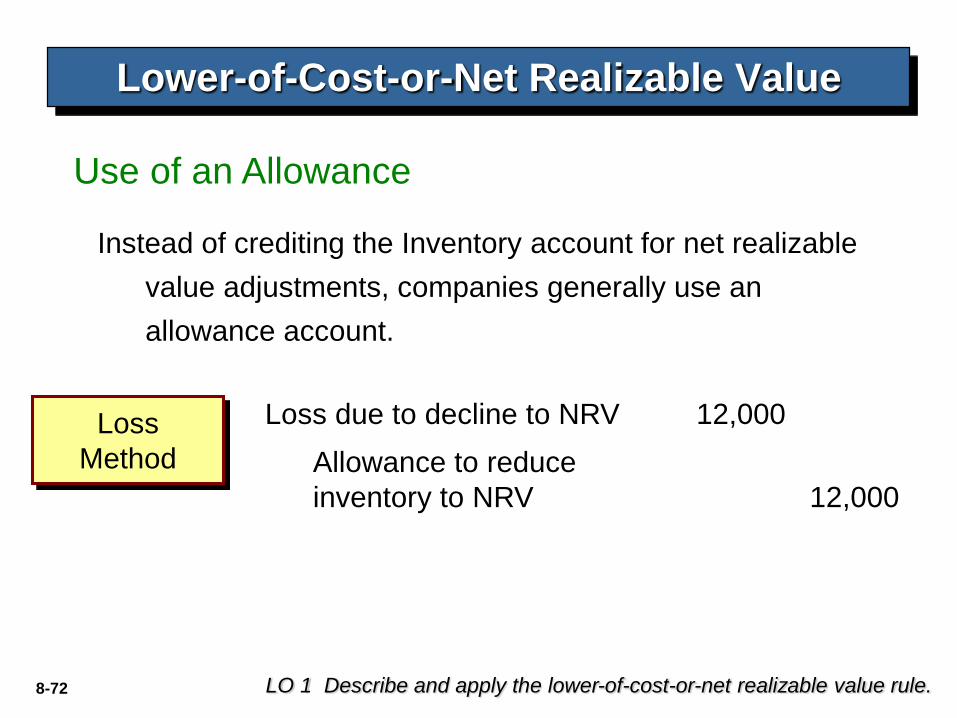
Use of an Allowance
LO 1 Describe and apply the lower-of-cost-or-net realizable value rule.
Lower-of-Cost-or-Net Realizable Value
Instead of crediting the Inventory account for net realizable
value adjustments, companies generally use an
allowance account.
Allowance to reduce
inventory to NRV 12,000
Loss due to decline to NRV 12,000Loss
Method

8-73
COGS Loss
Method Method
Current assets:
Inventory 70,000$ 82,000$
Allowance to reduce inventory (12,000)
Inventory at NRV 70,000
Prepaids 20,000 20,000
Accounts receivable 350,000 350,000
Cash 100,000 100,000
Total current assets 540,000 540,000
Statement of Financial Position Presentation
LO 1 Describe and apply the lower-of-cost-or-net realizable value rule.
Lower-of-Cost-or-Net Realizable Value
Partial Statement

8-74
Recovery of Inventory Loss
LO 1 Describe and apply the lower-of-cost-or-net realizable value rule.
Lower-of-Cost-or-Net Realizable Value
►Amount of write-down is reversed.
►Reversal limited to amount of original write-down.
Continuing the Ricardo example, assume the net realizable
value increases to $74,000 (an increase of $4,000). Ricardo
makes the following entry, using the loss method.
Recovery of inventory loss 4,000
Allowance to reduce inventory to NRV 4,000

8-75
Recovery of Inventory Loss
LO 1 Describe and apply the lower-of-cost-or-net realizable value rule.
Lower-of-Cost-or-Net Realizable Value
Allowance account is adjusted in subsequent periods,
such that inventory is reported at the LCNRV.
Illustration 9-8
Inventory should not be reported at a value
above original cost.

8-76
Decreases in the value of the asset and the charge to expense are
recognized in the period in which the loss in utility occurs—not in the
period of sale.
Increases in the value of the asset (in excess of original cost)
recognized only at the point of sale.
Inconsistency because a company may value inventory at cost in one
year and at net realizable value in the next year.
LCNRV values inventory conservatively. Net income for the year in
which a company takes the loss is definitely lower. Net income of the
subsequent period may be higher than normal if the expected
reductions in sales price do not materialize.
Some Deficiencies:
Lower-of-Cost-or-Net Realizable Value
Evaluation of LCM Rule
LO 1 Describe and apply the lower-of-cost-or-net realizable value rule.

8-77
P9-1: Remmers Company manufactures desks. Most of the
company’s desks are standard models and are sold on the basis of
catalog prices. At December 31, 2010, the following finished desks
appear in the company’s inventory.
Instructions: At what amount should the desks appear in the company’s
December 31, 2010, inventory, assuming that the company has adopted
a lower-of-FIFO-cost-or-net realizable value approach for valuation of
inventories on an individual-item basis?
Finished Desks A B C D
FIFO cost inventory at 12/31/10 470$ 450$ 830$ 960$
Est. cost to complete and sell 50 110 260 200
Catalog selling price 500 540 900 1,200
Lower-of-Cost-or-Net Realizable Value
LO 1 Describe and apply the lower-of-cost-or-net realizable value rule.

8-78
P9-1: Remmers Company manufactures desks. Most of the
company’s desks are standard models and are sold on the basis of
catalog prices. At December 31, 2010, the following finished desks
appear in the company’s inventory.
Finished Desks A B C D
FIFO cost inventory at 12/31/10 470$ 450$ 830$ 960$
Est. cost to complete and sell 50 110 260 200
Catalog selling price 500 540 900 1,200
Net realizable value 450 430 640 1,000
Lower-of-cost-or-NRV 450 430 640 960
Lower-of-Cost-or-Net Realizable Value
LO 1 Describe and apply the lower-of-cost-or-net realizable value rule.

8-79
Relies on Three Assumptions:
Gross Profit Method of Estimating Inventory
LO 5 Determine ending inventory by applying the gross profit method.
Substitute Measure to Approximate Inventory
(1) Beginning inventory plus purchases equal total goods to
be accounted for.
(2) Goods not sold must be on hand.
(3) The sales, reduced to cost, deducted from the sum of the
opening inventory plus purchases, equal ending
inventory.
8-80
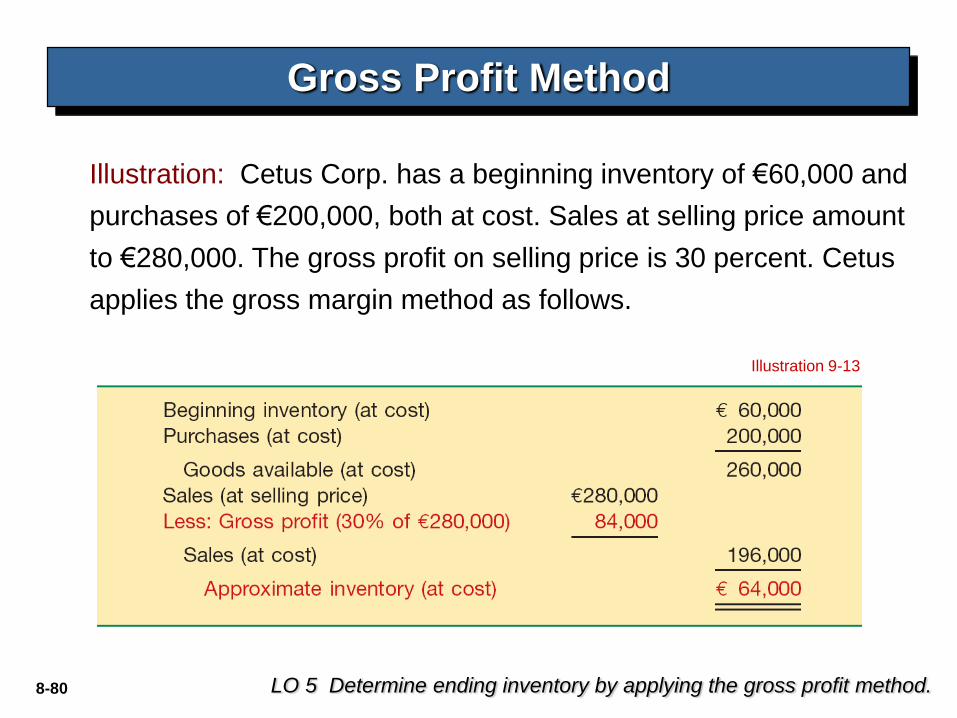
Gross Profit Method
LO 5 Determine ending inventory by applying the gross profit method.
Illustration: Cetus Corp. has a beginning inventory of €60,000 and
purchases of €200,000, both at cost. Sales at selling price amount
to €280,000. The gross profit on selling price is 30 percent. Cetus
applies the gross margin method as follows.
Illustration 9-13

8-81
Gross Profit Method
LO 5 Determine ending inventory by applying the gross profit method.
Computation of Gross Profit Percentage
Illustration 9-16

8-82
E9-14: Astaire Company uses the gross profit method to estimate
inventory for monthly reporting purposes. Presented below is
information for the month of May.
Instructions:
(a) Compute the estimated inventory at May 31, assuming that the
gross profit is 25% of sales.
(b) Compute the estimated inventory at May 31, assuming that the
gross profit is 25% of cost.
Inventory, May 1 € 160,000
Purchases (gross) 640,000
Freight-in 30,000
Sales 1,000,000
Sales returns 70,000
Purchase discounts 12,000
Gross Profit Method
LO 5

8-83
E9-14 (Solution):
Inventory, May 1 (at cost) € 160,000
Purchases (gross) (at cost) 640,000
Purchase discounts (12,000)
Freight-in 30,000
Goods available (at cost) 818,000
Sales (at selling price) € 1,000,000
Sales returns (at selling price) (70,000)
Net sales (at selling price) 930,000
Less gross profit (25% of €930,000) 232,500
Sales (at cost) 697,500
Approximate inventory, May 31 (at cost) € 120,500
(a) Compute the estimated inventory assuming gross profit is 25% of sales.
Gross Profit Method
LO 5 Determine ending inventory by applying the gross profit method.

8-84
(b) Compute the estimated inventory assuming gross profit is 25% of cost.
E9-14 (Solution):
Inventory, May 1 (at cost) € 160,000
Purchases (gross) (at cost) 640,000
Purchase discounts (12,000)
Freight-in 30,000
Goods available (at cost) 818,000
Sales (at selling price) € 1,000,000
Sales returns (at selling price) (70,000)
Net sales (at selling price) 930,000
Less gross profit (20% of €930,000) 186,000
Sales (at cost) 744,000
Approximate inventory, May 31 (at cost) € 74,000
Gross Profit Method
LO 5 Determine ending inventory by applying the gross profit method.
25%
100% + 25%= 20% of sales

8-85
Disadvantages:
Gross Profit Method
LO 5 Determine ending inventory by applying the gross profit method.
Evaluation
(1) Provides an estimate of ending inventory.
(2) Uses past percentages in calculation.
(3) A blanket gross profit rate may not be representative.
(4) Normally unacceptable for financial reporting purposes.
IFRS requires a physical inventory as additional
verification.

8-86
Retail Inventory Method
LO 6 Determine ending inventory by applying the retail inventory method.
A method used by retailers, to value inventory without a
physical count, by converting retail prices to cost.
(1) Total cost and retail value of goods purchased.
(2) Total cost and retail value of the goods available for sale.
(3) Sales for the period.
Requires retailers to keep:
Conventional Method or Cost Method
(based on
LCNRV)

8-87
P9-9: Fuque Inc. uses the retail inventory method to estimate
ending inventory for its monthly financial statements. The
following data pertain to a single department for the month of
October 2011.
Retail Inventory Method
COST RETAIL
Beg. inventory, Oct. 1 52,000$ 78,000$
Purchases 272,000 423,000
Freight in 16,600
Purchase returns 5,600 8,000
Additional markups 9,000
Markup cancellations 2,000
Markdowns (net) 3,600
Normal spoilage 10,000
Sales 390,000
Instructions:
Prepare a schedule
computing estimate
retail inventory using
the following
methods:
(1) Conventional
(2) Cost
LO 6 Determine ending inventory by applying the retail inventory method.

8-88
Retail Inventory Method
LO 6 Determine ending inventory by applying the retail inventory method.
P9-9 Solution - CONVENTIONAL Method:Cost to
COST RETAIL Retail %
Beg. inventory 52,000$ 78,000$
Purchases 272,000 423,000
Freight in 16,600
Purchase returns (5,600) (8,000)
Markups, net 7,000
Current year additions 283,000 422,000
Goods available for sale 335,000 500,000 67.00%
Markdowns, net (3,600)
Normal spoilage (10,000)
Sales (390,000)
Ending inventory at retail 96,400$
Ending inventory at Cost:
96,400$ x 67.00% = 64,588$
=/

8-89
Retail Inventory Method
LO 6 Determine ending inventory by applying the retail inventory method.
P9-9 Solution - Cost Method Cost to
COST RETAIL Retail %
Beg. inventory 52,000$ 78,000$
Purchases 272,000 423,000
Freight in 16,600
Purchase returns (5,600) (8,000)
Markdowns, net (3,600)
Markups, net 7,000
Current year additions 283,000 418,400
Goods available for sale 335,000 496,400 67.49%
Normal spoilage (10,000)
Sales (390,000)
Ending inventory at retail 96,400$
Ending inventory at Cost:
96,400$ x 67.49% = 65,056$
=/
8-90
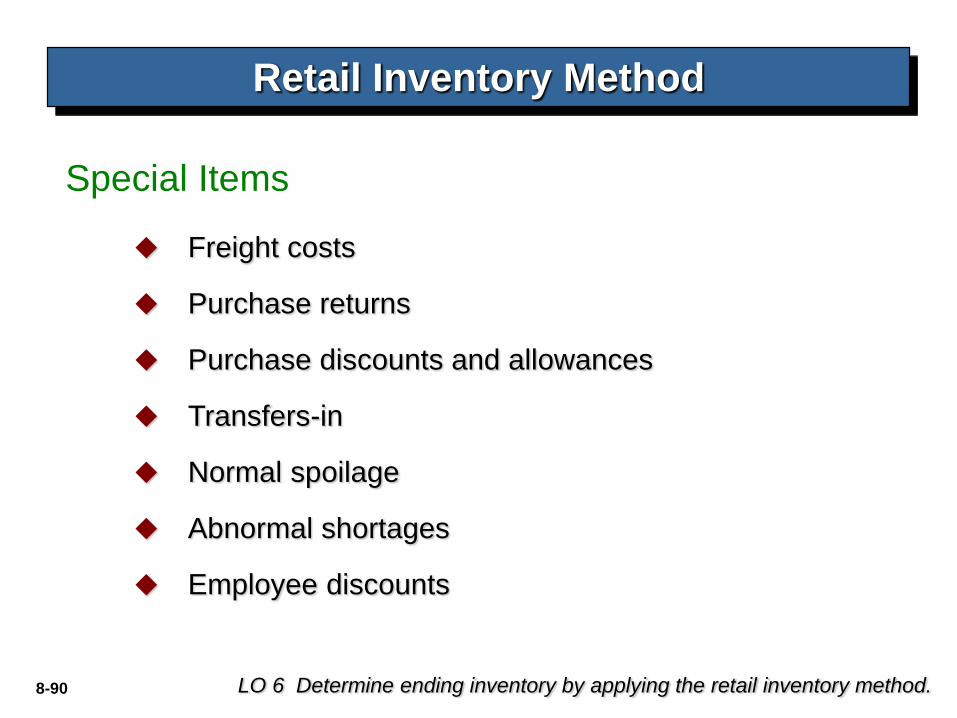
Special Items
Retail Inventory Method
LO 6 Determine ending inventory by applying the retail inventory method.
Freight costs
Purchase returns
Purchase discounts and allowances
Transfers-in
Normal spoilage
Abnormal shortages
Employee discounts

8-91
Special
Items
Retail Inventory Method
LO 6 Determine ending inventory by applying the retail inventory method.
Illustration 9-22

8-92
Widely used for the following reasons:
Evaluation
(1) To permit the computation of net income without a
physical count of inventory.
(2) Control measure in determining inventory shortages.
(3) Regulating quantities of merchandise on hand.
(4) Insurance information.
Retail Inventory Method
LO 6 Determine ending inventory by applying the retail inventory method.
Some companies refine the retail method by computing inventory
separately by departments or class of merchandise with similar gross
profits.

8-93Financial Accounting and Reporting 1 93
inventory cost is estimated through:
the ratio calculation between cost of goods
available for sale recorded at cost and
recorded at retail price (cost : retail), or
the percentage of goods available for sale at
cost over goods available for sale at retail
(cost/retail x 100)

8-94Financial Accounting and Reporting 1 94
In order to use this method we need the following information:
- the opening inventory value at cost and retail
- purchase of inventory at cost and retail
- sales value
- changes in sales price due to mark-up and markdown
Cost of ending inventory = Ending inventory at retail price x
Cost/Retail ratio

8-95Financial Accounting and Reporting 1 95
Original retail price - the initial retail price after taking into account the mark-up over cost.
Additional mark-up - the increase in selling price over original retail price
Mark-up cancellation - the reduction in selling price after the additional mark-up
Net mark-up - the additional mark-up minus the mark-up cancellation
Markdown - the reduction in selling price below original retail price
Markdown cancellation - the reduction in markdown (price increases, but not over the original retail price)
Net markdown - markdown minus markdown cancellation
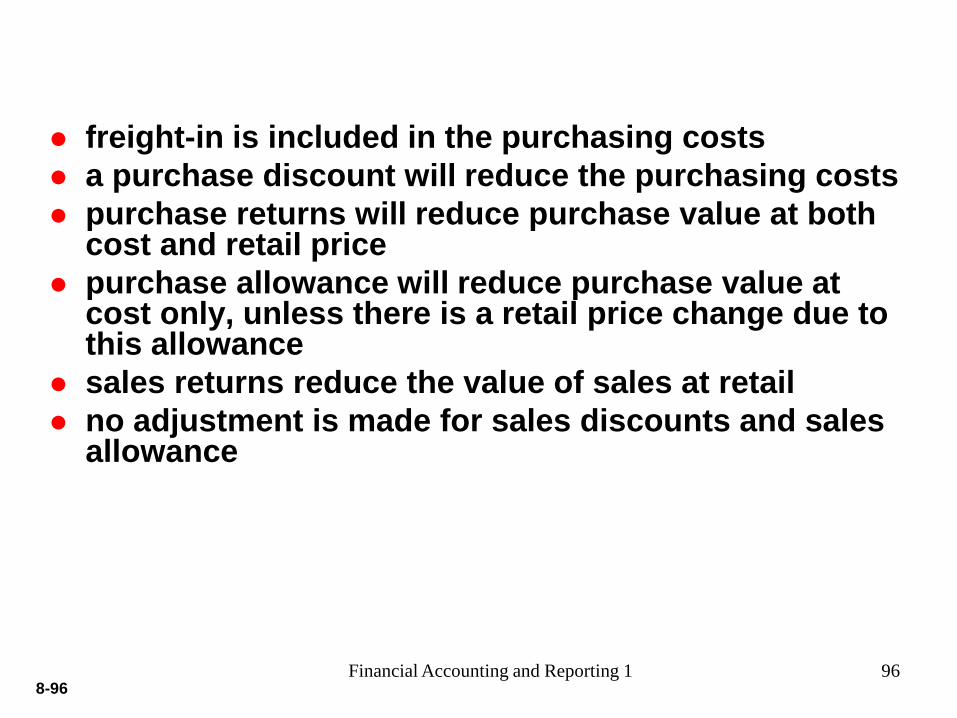
8-96Financial Accounting and Reporting 1 96
freight-in is included in the purchasing costs
a purchase discount will reduce the purchasing costs
purchase returns will reduce purchase value at both cost and retail price
purchase allowance will reduce purchase value at cost only, unless there is a retail price change due to this allowance
sales returns reduce the value of sales at retail
no adjustment is made for sales discounts and sales allowance

8-97Financial Accounting and Reporting 1 97
Under certain circumstances, valuation of inventory based on cost is impractical.
The cost of inventories may not be recoverable if those inventories are damaged, if they have become wholly or partially obsolete, or if their selling prices have declined.
The cost of inventories may also not be recoverable if the estimated costs of completion or the estimated costs to be incurred to make the sale have increased.
If the market price of goods drops below the purchase price, the lower of cost or market method of valuation is recommended.

8-98Financial Accounting and Reporting 1 98
FRS 102, paragraph 9 states that:
“Inventories shall be measured at the lower of
cost and net realizable value.”

8-99Financial Accounting and Reporting 1 99
Arrangement whereby merchandise owned by one
party (the consignor) is sold by another party (the
consignee), usually on a commission basis.
Consignment inventories are recorded in the
consignor’s books but not the consignee’s.
Since the consignor has full ownership of the goods,
he bears all related costs such as storage, damage,
and selling cost.

8-100Financial Accounting and Reporting 1 100
consignor holds ownership of goods until consignee sells them
consignee stores the goods until they are sold; cost incurred in relation to the sale of the goods will be refunded later by the consignor
consignee receives a commission for his work when the goods are sold.
consignee receives payment from buyer
consignee pays the consignor the balance of the amount received after deducting his expenses and commission
consignee produces an account sales (see Illustration 7) for the consignor; this is a statement that provides the details of the transactions.

8-101Financial Accounting and Reporting 1 101
Consignment - journal
Details Consignor Consignee
Goods consigned Dt Consignment a/c
Kt Goods sent on
consignment a/c
----
Expenses paid by consignor Dt Consigment a/c
Kt Cash
----
Consignee’s payment of
consignment expenses
Dt Consignment a/c
Kt Consignee’s a/c
Dt Consignor’s a/c
Kt Cash
Sales Dt Consignee’s a/c
Kt consignment a/c
Dt Cash
Kt Consignor’s a/c
Commission Dt Consignment a/c
Kt Consignee’s a/c
Dt Consignor’s a/c
Kt Consignment-in a/c
(commission earned)
Cash settlement Dt Cash
Kt Consignee’s a/c
(cash received)
Dt Consignor’s a/c
Kt Cash book
(balance settlement as per
account sales)

8-102Financial Accounting and Reporting 1 102
According to FRS 102, financial statements shall disclose:
accounting policies adopted in measuring inventories, including the cost formula used
the total carrying amount of inventories and the carrying amount in classifications appropriate to the entity
the carrying amount of inventories carried at fair value less costs to sell
the amount of inventories recognized as an expense during the period
the amount of any write-down of inventories recognized as an expense in the period
the amount of any reversal of any write-down that is recognized as a reduction in the amount of inventories recognized as expense in the period
the circumstances or events that led to the reversal of a write-down of inventories, and
the carrying amount of inventories pledged as security for liabilities

8-103
Accounting standards require disclosure of:
Presentation and Analysis
LO 7 Explain how to report and analyze inventory.
Presentation of Inventories
(1) Accounting policies adopted in measuring inventories,
including the cost formula used (weighted-average, FIFO).
(2) Total carrying amount of inventories and the carrying amount
in classifications (merchandise, production supplies, raw
materials, work in progress, and finished goods).
(3) Carrying amount of inventories carried at fair value less costs
to sell.
(4) Amount of inventories recognized as an expense during the
period.

8-104
Accounting standards require disclosure of:
Presentation and Analysis
LO 7 Explain how to report and analyze inventory.
Presentation of Inventories
(5) Amount of any write-down of inventories recognized as an
expense in the period and the amount of any reversal of
write-downs recognized as a reduction of expense in the
period.
(6) Circumstances or events that led to the reversal of a write-
down of inventories.
(7) Carrying amount of inventories pledged as security for
liabilities, if any.
8-105
Presentation and Analysis
LO 7 Explain how to report and analyze inventory.
Common ratios used in the management and evaluation of
inventory levels are inventory turnover and average days to
sell the inventory.
Analysis of Inventories

8-106
Measures the number of times on average a company
sells the inventory during the period.
Presentation and Analysis
LO 7 Explain how to report and analyze inventory.
Inventory Turnover Ratio
Illustration 9-25
Illustration: In its 2009 annual report Tate & Lyle plc (GBR)
reported a beginning inventory of £562 million, an ending inventory
of £538 million, and cost of goods sold of £2,019 million for the
year.

8-107
Measure represents the average number of days’ sales
for which a company has inventory on hand.
Presentation and Analysis
LO 7 Explain how to report and analyze inventory.
Average Days to Sell Inventory
365 days / 3.67 times = every 99.5 days
Average Days to Sell
Illustration 9-25

8-108
The requirements for accounting for and reporting inventories are more
principles-based under IFRS. That is, U.S. GAAP provides more
detailed guidelines in inventory accounting.
Who owns the goods—goods in transit, consigned goods, special sales
agreements—as well as the costs to include in inventory are essentially
accounted for the same under IFRS and U.S. GAAP.
U.S. GAAP permits the use of LIFO for inventory valuation. IFRS
prohibits its use. FIFO and average cost are the only two acceptable
cost flow assumptions permitted under IFRS. Both sets of standards
permit specific identification where appropriate.

8-109
In the lower-of-cost-or-market test for inventory valuation, IFRS defines
market as net realizable value. U.S. GAAP, on the other hand, defines
market as replacement cost subject to the constraints of net realizable
value (the ceiling) and net realizable value less a normal markup (the
floor). IFRS does not use a ceiling or a floor to determine market.
Under U.S. GAAP, if inventory is written down under the LCM valuation,
the new basis is now considered its cost. As a result, the inventory may
not be written back up to its original cost in a subsequent period. Under
IFRS, the write-down may be reversed in a subsequent period up to the
amount of the previous write-down. Both the write-down and any
subsequent reversal should be reported on the income statement.

8-110
Unlike property, plant, and equipment, IFRS
does not permit the option of valuing
inventories at fair value. As indicated above,
IFRS requires inventory to be written down,
but inventory cannot be written up above its
original cost.
As indicated, IFRS requires both biological
assets and agricultural produce at the point of

8-111
Copyright © 2011 John Wiley & Sons, Inc. All rights reserved.
Reproduction or translation of this work beyond that permitted in
Section 117 of the 1976 United States Copyright Act without the
express written permission of the copyright owner is unlawful.
Request for further information should be addressed to the
Permissions Department, John Wiley & Sons, Inc. The purchaser
may make back-up copies for his/her own use only and not for
distribution or resale. The Publisher assumes no responsibility for
errors, omissions, or damages, caused by the use of these
programs or from the use of the information contained herein.
Copyright