chp emissions calc
TRANSCRIPT

8/8/2019 Chp Emissions Calc
http://slidepdf.com/reader/full/chp-emissions-calc 1/21
INTRODUCTION AND PURPOSE
The Combined Heat and Power (CHP) Emissions Calculator is a tool that compares the
anticipated emissions from a CHP system to the emissions from systems using separate heat
and power (SHP). The CHP Emissions Calculator was originally developed with support from the
U.S. Department of Energy's Distributed Energy Program and Oak Ridge National Laboratory.
Enhancements have been supported by the U.S. Environmental Protection Agency's CHP
A user can select from a large number of different SHP system profiles, compare them to
from both systems and the corresponding emissions reductions achieved by the CHP
system. The CHP Emissions Calculator is intended to help CHP end users and other
interested parties calculate the emissions attributable to their CHP projects. In addition to
estimating emission reductions, the CHP Emissions Calculator presents the carbon equivalency
of these emissions reductions in terms of acres of trees planted and number of cars removed
The CHP Emissions Calculator is designed for users with at least a moderate understanding of
CHP technology and its terminology; therefore, a glossary of the terms that appear in the
Emissions Calculator is not provided here. If you would like to learn more about CHP
technologies, please visit
Please note that the results generated by the CHP Emissions Calculator are intended for
educational and outreach purposes only; it is not designed for use in developing emission
inventories or preparing air permit applications. All results achieved through the
independent use of the Calculator are subject to error and are not endorsed by the EPA
CHP Partnership. If you are interested in obtaining verified and endorsed Calculator
results for a specific project, please contact Anne Hampson at [email protected]
(technical support contractor to the CHP Partnership.)
DIRECTIONS FOR USE
worksheets. (Note: the CHP Emissions Calculator contains two additional worksheets
information about the use of these worksheets.)
Inputs
completing each of the 29 numbered subsections. Each subsection contains a question, at least
among three options:
1) Manually enter or select (from a pull-down menu) system-specific information.
2) Use default system information provided in the available MSExcel note (see below).
3) Skip the subsection.
The CHP Emissions Calculator provides concise instructions and default system information for
Partnership.1
a CHP system (characterized by the user), and estimate the carbon, CO2, SO
2and NO
Xemissions
from the road (see the Additional Information section below for more information).
www.epa.gov/chp.
The primary components of the CHP Emissions Calculator are the Inputs and Results
recommended for advanced users only. See the Additional Information section below for more
To use the Inputs worksheet, you will characterize a CHP system and an equivalent SHP by
one cell to complete or select, and a Submit button. To complete a subsection, you can choose

8/8/2019 Chp Emissions Calc
http://slidepdf.com/reader/full/chp-emissions-calc 2/21
each subsection in the form of MSExel notes. To view the notes, move the mouse cursor over
the cell with a red triangle in its upper right-hand corner. When typing an entry into a field, press
Note that some subsections are not applicable to the CHP system or displaced SHP and
the dropdown menu in subsection 15 regarding the existence of duct burners, you can then skip
subsections 16, 17 and 18.)
If you are having difficulty understanding how to complete the subsections, see the Example
below to view a diagram that explains the components of an example subsection.
Example
Results
Table 1 (colored white) presents a summary of the emissions information of the CHP
system, the displaced SHP, and the corresponding emission reductions and relational
benefits associated with the CHP system.
Table 2 (colored green) presents a summary of CHP system information.
Table 3 (colored blue) presents information about displaced thermal production.
Table 4 (colored yellow) presents information about the displaced electric production.
The remaining tables provide additional emissions information about the CHP system and the
present the inputs and outputs of the CHP system and displaced SHP.
the Enter key on your keyboard to complete your entry. After completing a subsection, click on
the corresponding Submit button before moving on to the next subsection.
therefore do not have to be addressed by the user. (For example, if you were to select No from
Once you have addressed all 31 subsections, click on one of the Check All Inputs and Go To
Results buttons located on the Inputs worksheet. This action will open the Results worksheet.
The Results worksheet consists of several tables:
displaced electric and thermal production. The Results worksheet also includes two diagrams that
Subsection number Subsection question
Cells to complete. In this case, a user maychoose an option provided by the pull-down menu OR enter the number of hours
per year as a percentage.
Submit button
Note that each of these cells has a redtriangle in the upper right-hand corner. Thismeans that additional information for thissubsection is available. View by moving themouse cursor over the cell.

8/8/2019 Chp Emissions Calc
http://slidepdf.com/reader/full/chp-emissions-calc 3/21
ADDITIONAL INFORMATION
More detailed documentation on the CHP Emissions Calculator is available by clicking on the
The U.S. Environmental Protection Agency supports CHP because of the significant cost-effective emissions reductions that can be achieved by increasing efficient energy supply. The
average efficiency of fossil-fueled power plants in the United States is 33 percent and has
remained virtually unchanged for 40 years. This means that two-thirds of the energy in the fuel is
lost-vented as heat-at most power plants in the United States. CHP systems achieve effective
electrical efficiencies of 50 percent to 70 percent. This improvement in efficiency translates into
that are more readily understood by the public. The CHP Emissions Calculator presents these
relational benefits in terms of acres of forest planted and numbers of cars removed from the road.
For example, when a CHP system is described as reducing emissions equivalent to planting
10,000 acres of forest, this means the difference in carbon emissions between the CHP system
and displaced SHP is equal to the atmospheric carbon annually sequestered by 10,000 acres of
forest. Likewise, when a CHP system is described as reducing emissions equivalent to 20,000cars, this means the difference in carbon emissions between the CHP system and displaced SHP
is equal to the carbon emissions produced by 20,000 cars each year.
HELP US IMPROVE THE CHP EMISSIONS CALCULATOR
We welcome your input on the CHP Emissions Calculator's usability and functionality. Should
you encounter any bugs when using the tool, please report them via e-mail to EPA Technical Support
Contractor Anne Hampson
Documentation: Emissions Calculator icon at the top of the Input worksheet.
emissions reductions. These reductions can be converted into terms (called relational benefits)

8/8/2019 Chp Emissions Calc
http://slidepdf.com/reader/full/chp-emissions-calc 4/21
49117899.xls, Inputs 01/06/2011
1. CHP: Type of System2
2. CHP: Electricity Generating Capacity (per unit)
Normal size range for this technology is 75 to 2,615 kW
1,250 kW
3. CHP: How Many Identical Units (i.e., engines) Does This System Have?
8
4. CHP: How Many Hours per Year Does the CHP System Operate?
3
As a number of hours per year 5,840
0%
5. CHP: Does the System Provide Heating or Cooling or Both?
1
If Heating and Cooling: How many of the 5,840 hours are in cooling mode?
As a number of hours per year 10
as a percentage of the 5,840 hours? 0%
If Heating and Cooling: Does the System Provide Simultaneous Heating and Cooling?
2
6. CHP: Fuel
Fuel Type 1
7. CHP: If Diesel, Distillate, Coal or Other: What is the Sulfur Content?
or
0
Enter Sulfur Content of Fuel as a percent 0.000%
- ppm
8. CHP: What is the CO2 Emission Rate for this Fuel? (default completed for fuel in Item 6)
Enter alternative value: 116.7 lb CO2/MMBtu
1,020 Btu/cubic foot (HHV)
OR - Btu/gallon (HHV)OR - Btu/lb (HHV)
10. CHP: Boiler Steam To Process (Steam Turbine CHP Only)
Boiler Steam to Process as lb Steam/hr 22,400
Boiler Steam to Process as MMBtu Steam/hr 0
11. CHP: Steam Turbine System Boiler Efficiency (Steam Turbine CHP Only)
OR As a percentage
OR ppm
9. CHP: What is the Heat Content of this Fuel? (Enter a value in only ONE of the boxes)
I will enter a value in oneof the following blocks
.
.
Document Document
Introduction:
Emissions Calculator
DocumentDocumentation:
Emissions Calculator
þÿ
þÿ
þÿ
þÿ
þÿ

8/8/2019 Chp Emissions Calc
http://slidepdf.com/reader/full/chp-emissions-calc 5/21
49117899.xls, Inputs 01/06/2011
Document DocumentIntroduction:
Emissions Calculator
DocumentDocumentation:
Emissions Calculator
Enter Boiler Efficiency as % 80%
12. CHP: Electric Efficiency
1
Enter Generating Efficiency as % 25% (HHV)
13,407 Btu/kWh (HHV)
12,200 Btu/kWh (LHV)
OR Enter Generating Efficiency as Btu/kWh HHV
OR Enter Generating Efficiency as Btu/kWh LHV
w en er an e c encyin one of the following
Use default for thistechnology
8/8/2019 Chp Emissions Calc
http://slidepdf.com/reader/full/chp-emissions-calc 6/21
49117899.xls, Inputs 01/06/2011
Document DocumentIntroduction:
Emissions Calculator
DocumentDocumentation:
Emissions Calculator
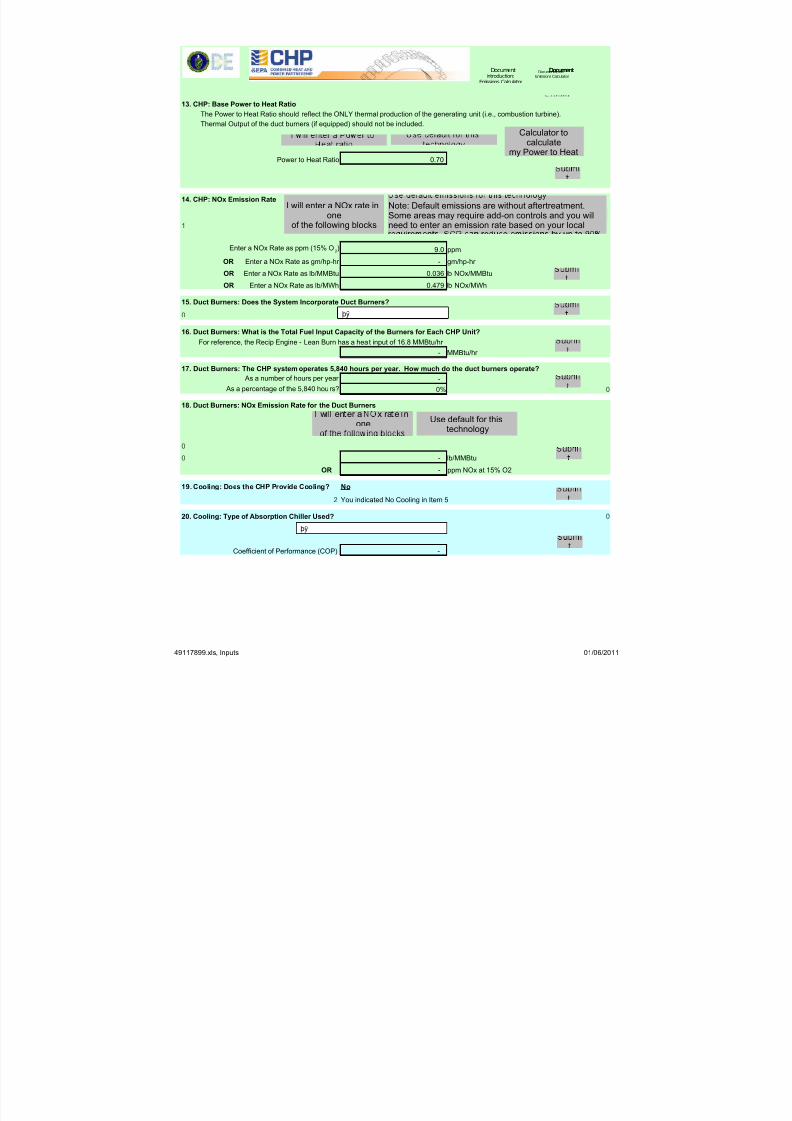
13. CHP: Base Power to Heat Ratio
The Power to Heat Ratio should reflect the ONLY thermal production of the generating unit (i.e., combustion turbine).
Thermal Output of the duct burners (if equipped) should not be included.
Power to Heat Ratio 0.70
14. CHP: NOx Emission Rate
1 2
9.0 ppm
- gm/hp-hr
0.036 lb NOx/MMBtu
0.479 lb NOx/MWh
15. Duct Burners: Does the System Incorporate Duct Burners?
0 2
16. Duct Burners: What is the Total Fuel Input Capacity of the Burners for Each CHP Unit?
For reference, the Recip Engine - Lean Burn has a heat input of 16.8 MMBtu/hr
- MMBtu/hr
17. Duct Burners: The CHP system operates 5,840 hours per year. How much do the duct burners operate?
As a number of hours per year -
As a percentage of the 5,840 hours? 0% 0
18. Duct Burners: NOx Emission Rate for the Duct Burners
2
0
0 - lb/MMBtu
OR - ppm NOx at 15% O2
19. Cooling: Does the CHP Provide Cooling? No
2 You indicated No Cooling in Item 5
20. Cooling: Type of Absorption Chiller Used? 0
-
Coefficient of Performance (COP) -
Enter a NOx Rate as ppm (15% O2)
OR Enter a NOx Rate as gm/hp-hr
OR Enter a NOx Rate as lb/MMBtu
OR Enter a NOx Rate as lb/MWh
I will enter a NOx rate inone
of the following blocks
. Note: Default emissions are without aftertreatment.Some areas may require add-on controls and you willneed to enter an emission rate based on your local
Calculator tocalculate
my Power to Heat
w en er a x ra e none
Use default for thistechnology
þÿ
þÿ

8/8/2019 Chp Emissions Calc
http://slidepdf.com/reader/full/chp-emissions-calc 7/21
49117899.xls, Inputs 01/06/2011
Document DocumentIntroduction:
Emissions Calculator
DocumentDocumentation:
Emissions Calculator
21. Cooling: What is the Cooling Capacity of the System? 0
Based on your other entries, the maximum cooling capacity is . tons or . MMBtu/hr of cooling
(Enter a value in only ONE of the boxes) - Cooling Tons
-
22. Displaced Cooling: What is the Efficiency of the Cooling System that is Being Displaced?
-
0
(Enter a value in only ONE of the boxes)
Electricity Demand (kW per ton) -
-
23. Displaced Thermal: Type of System:
12
24. Displaced Thermal: If not a Natural Gas System: What is the Sulfur Content?
1
or
0
Enter Sulfur Content as a percent 0.00%
- ppm
25. Displaced Thermal: What is the CO2 Emission Rate for this Fuel? (default completed for fuel in Item 23)
Enter alternative value: - lb CO2/MMBtu
- Btu/cubic foot (HHV)
OR - Btu/gallon (HHV)
OR - Btu/lb (HHV)
27. Displaced Thermal: Efficiency (usually a boiler)
Enter Generating Efficiency as % 80%
OR MMBtu per Hour of Cooling
OR Coefficient of Performance (COP)
OR ppm
26. Displaced Thermal: What is the Heat Content of this Fuel? (Enter a value in only ONE of the boxes)
w en er aCommercial coal: 1% sulfur
.
.
I will enter an efficiencyse e au or s erma
þÿ
þÿ

8/8/2019 Chp Emissions Calc
http://slidepdf.com/reader/full/chp-emissions-calc 8/21
49117899.xls, Inputs 01/06/2011
Document DocumentIntroduction:
Emissions Calculator
DocumentDocumentation:
Emissions Calculator
28. Displaced Thermal Production: NOx Emission Rate
NOx Rate 0.100 lb NOx/MMBtu
29. Displaced Electricity: Generation Profile
3
1
31. Displaced Electricity: Transmission Losses 7%
Link to EPA's eGRID (Emissions & Generation Resource Integrated Database)
30. Displaced Electricity: Select U.S. Average or individual state or NERC region/subregion for EGRID Data
Document
I will enter the NOx rate Use default for NOx rate
Modify one of theThree User-DefinedGenerating Sources
þÿ
þÿ
8/8/2019 Chp Emissions Calc
http://slidepdf.com/reader/full/chp-emissions-calc 9/21
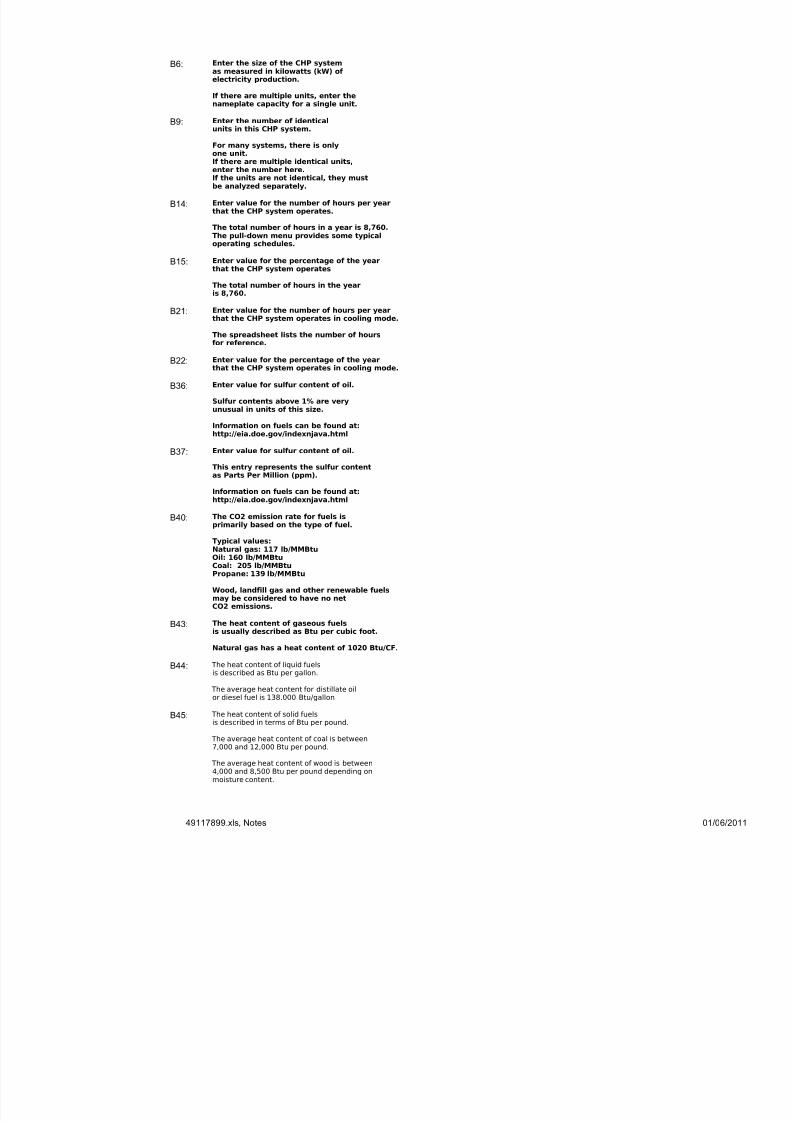
Enter the size of the CHP systemas measured in kilowatts (kW) of electricity production.
If there are multiple units, enter thenameplate capacity for a single unit.
B6:
Enter the number of identical
units in this CHP system.
For many systems, there is onlyone unit.If there are multiple identical units,enter the number here.If the units are not identical, they mustbe analyzed separately.
B9:
Enter value for the number of hours per yearthat the CHP system operates.
The total number of hours in a year is 8,760.The pull-down menu provides some typicaloperating schedules.
B14:
Enter value for the percentage of the yearthat the CHP system operates
The total number of hours in the yearis 8,760.
B15:
Enter value for the number of hours per yearthat the CHP system operates in cooling mode.
The spreadsheet lists the number of hoursfor reference.
B21:
Enter value for the percentage of the yearthat the CHP system operates in cooling mode.
B22:
Enter value for sulfur content of oil.
Sulfur contents above 1% are veryunusual in units of this size.
Information on fuels can be found at:http://eia.doe.gov/indexnjava.html
B36:
Enter value for sulfur content of oil.
This entry represents the sulfur contentas Parts Per Million (ppm).
Information on fuels can be found at:http://eia.doe.gov/indexnjava.html
B37:
The CO2 emission rate for fuels isprimarily based on the type of fuel.
Typical values:Natural gas: 117 lb/MMBtuOil: 160 lb/MMBtuCoal: 205 lb/MMBtuPropane: 139 lb/MMBtu
Wood, landfill gas and other renewable fuelsmay be considered to have no netCO2 emissions.
B40:
The heat content of gaseous fuelsis usually described as Btu per cubic foot.
Natural gas has a heat content of 1020 Btu/CF.
B43:
The heat content of liquid fuelsis described as Btu per gallon.
The average heat content for distillate oil
B44:

8/8/2019 Chp Emissions Calc
http://slidepdf.com/reader/full/chp-emissions-calc 10/21
Enter value for efficiency of the boiler.
The efficiency is the ratio of the useful thermaloutput divided by the fuel input.
Typical boiler efficiencies are between80% and 85%.
B57:
Enter value for electricity generatingefficiency of the CHP unit.
A percentage is most often used for engines.
The generating efficiency is equal to the electricityproduced divided by the fuel input. The units canbe converted by using the general conversion of 3,412 Btu per kilowatt-hour
B63:
Enter value for the heat rate of the CHP unit.
Higher Heating Value (HHV) heat rates are usually used with boilers.
The heat rate is the amount of fuel input needed toproduce 1 kWh of electricity. The fuel input is measuredin Btu's on a Higher Heating Value (HHV) basis.
B64:
Enter value for the heat rate of the CHP unit.
Lower Heating Value (LHV) Heat rates are usually used with turbines.
The heat rate is the amount of fuel input needed toproduce 1 kWh of electricity. The fuel input is measuredin Btu's on a Lower Heating Value (LHV) basis.
B65:
Enter the Power to Heat ratiofor the CHP system.
Power is the electricity output and Heat is theuseful thermal output.
There are several methods for calculating thepower to heat ratio and the "Thermal Calculator" may provideuseful guidance.
B72:
Enter NOx emission rate of theCHP system.
Parts per Million (ppm) values areused for some turbine and boiler systems.The ppm value represents the concentrationof NOx molecules in the exhaust.
B80:
Enter NOx emission rate of theCHP system.
Grams of NOx per Horsepower-hour of production(gm/hp-hr) are most commonly used with engines.
B81:
Enter NOx emission rate for theCHP system.
Pounds of NOx per MMBtu (lb/MMBtu) is mostcommonly used with boilers. The MMBtu representsthe fuel input rate of the CHP system.
B82:
Enter NOx emission rate for theCHP system.
Pounds of NOx per MegaWatt-Hour (lb/MWh) is occasionallyused with various CHP technologies. The MWh representsthe electrical output rating of the CHP system.
B83:
Enter the Fuel Input Capacity of the Duct Burner(s)
This value is the fuel supply rate to the duct burner(s)measured on a MMBtu per hour basis.
B90:
8/8/2019 Chp Emissions Calc
http://slidepdf.com/reader/full/chp-emissions-calc 11/21
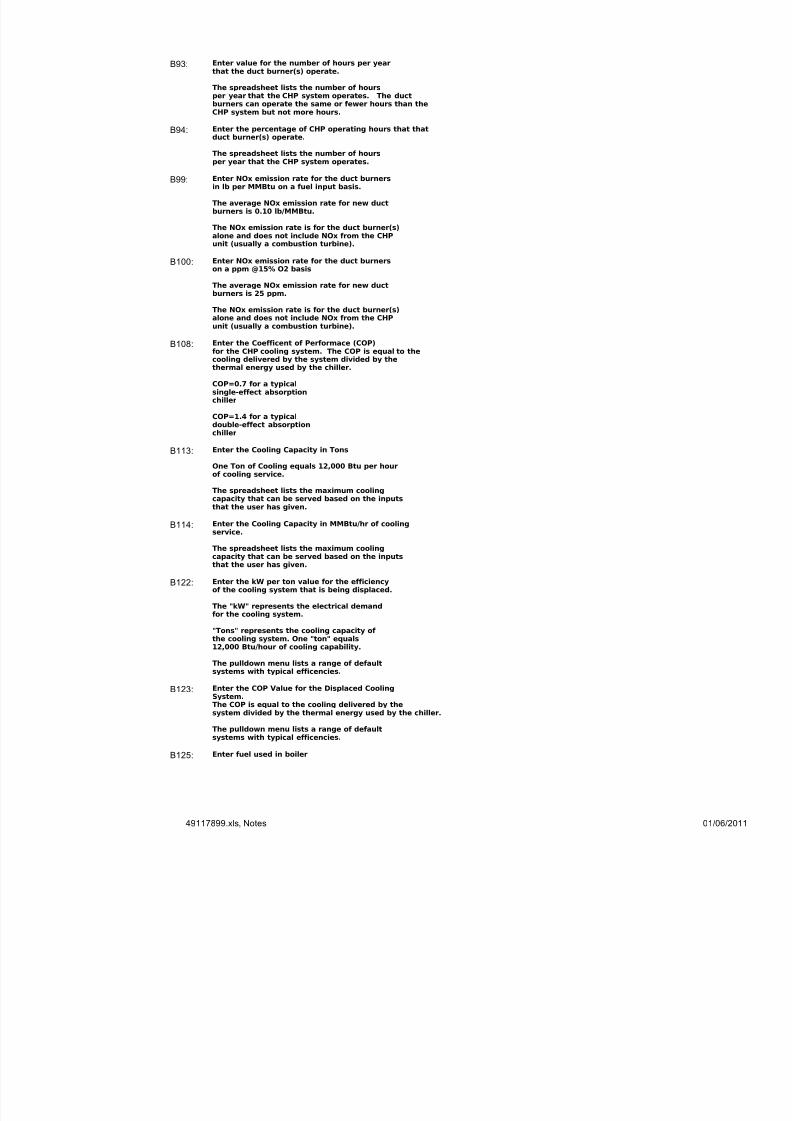
Enter value for the number of hours per yearthat the duct burner(s) operate.
The spreadsheet lists the number of hoursper year that the CHP system operates. The ductburners can operate the same or fewer hours than theCHP system but not more hours.
B93:
Enter the percentage of CHP operating hours that thatduct burner(s) operate.
The spreadsheet lists the number of hoursper year that the CHP system operates.
B94:
Enter NOx emission rate for the duct burnersin lb per MMBtu on a fuel input basis.
The average NOx emission rate for new ductburners is 0.10 lb/MMBtu.
The NOx emission rate is for the duct burner(s)alone and does not include NOx from the CHPunit (usually a combustion turbine).
B99:
Enter NOx emission rate for the duct burnerson a ppm @15% O2 basis
The average NOx emission rate for new ductburners is 25 ppm.
The NOx emission rate is for the duct burner(s)alone and does not include NOx from the CHPunit (usually a combustion turbine).
B100:
Enter the Coefficent of Performace (COP)for the CHP cooling system. The COP is equal to thecooling delivered by the system divided by thethermal energy used by the chiller.
COP=0.7 for a typicalsingle-effect absorption
chiller
COP=1.4 for a typicaldouble-effect absorptionchiller
B108:
Enter the Cooling Capacity in Tons
One Ton of Cooling equals 12,000 Btu per hourof cooling service.
The spreadsheet lists the maximum coolingcapacity that can be served based on the inputsthat the user has given.
B113:
Enter the Cooling Capacity in MMBtu/hr of cooling
service.
The spreadsheet lists the maximum coolingcapacity that can be served based on the inputsthat the user has given.
B114:
Enter the kW per ton value for the efficiencyof the cooling system that is being displaced.
The "kW" represents the electrical demandfor the cooling system.
"Tons" represents the cooling capacity of the cooling system. One "ton" equals12,000 Btu/hour of cooling capability.
The pulldown menu lists a range of defaultsystems with typical efficencies.
B122:
Enter the COP Value for the Displaced CoolingB123:
8/8/2019 Chp Emissions Calc
http://slidepdf.com/reader/full/chp-emissions-calc 12/21
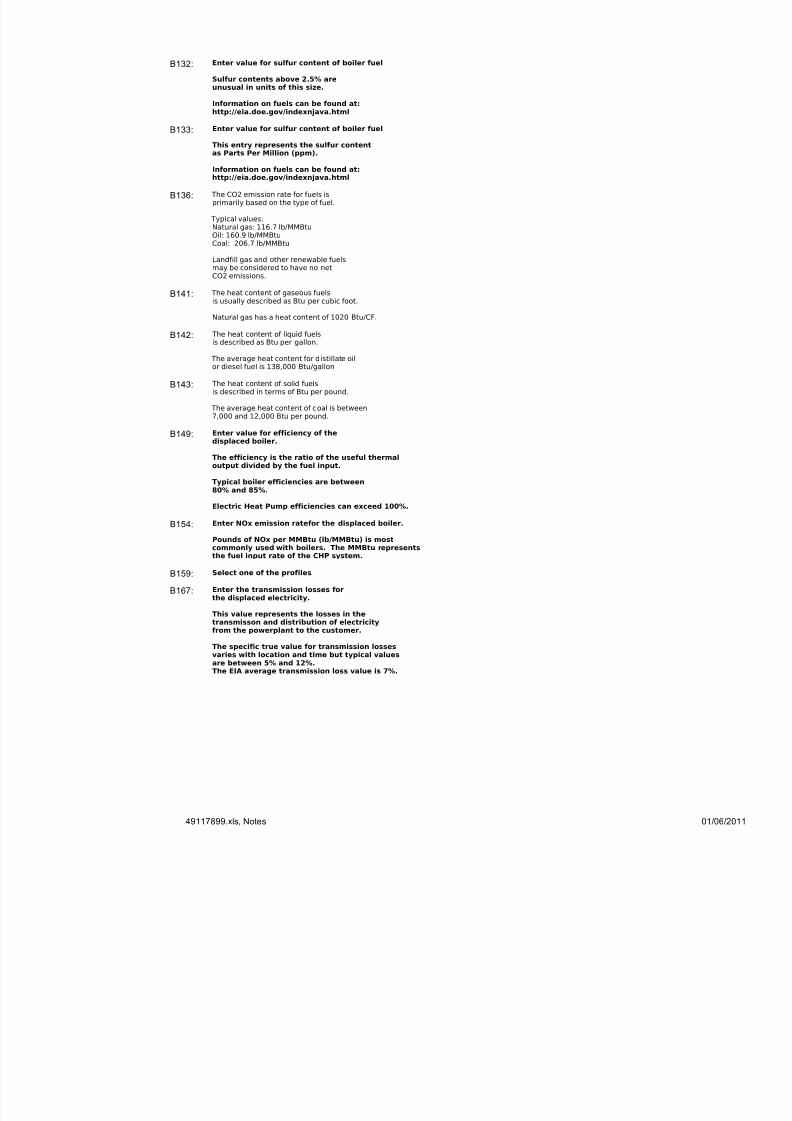
Enter value for sulfur content of boiler fuel
Sulfur contents above 2.5% areunusual in units of this size.
Information on fuels can be found at:http://eia.doe.gov/indexnjava.html
B132:
Enter value for sulfur content of boiler fuel
This entry represents the sulfur contentas Parts Per Million (ppm).
Information on fuels can be found at:http://eia.doe.gov/indexnjava.html
B133:
The CO2 emission rate for fuels isprimarily based on the type of fuel.
Typical values:Natural gas: 116.7 lb/MMBtuOil: 160.9 lb/MMBtuCoal: 206.7 lb/MMBtu
Landfill gas and other renewable fuels
may be considered to have no netCO2 emissions.
B136:
The heat content of gaseous fuelsis usually described as Btu per cubic foot.
Natural gas has a heat content of 1020 Btu/CF.
B141:
The heat content of liquid fuelsis described as Btu per gallon.
The average heat content for distillate oilor diesel fuel is 138,000 Btu/gallon
B142:
The heat content of solid fuelsis described in terms of Btu per pound.
The average heat content of coal is between7,000 and 12,000 Btu per pound.
B143:
Enter value for efficiency of thedisplaced boiler.
The efficiency is the ratio of the useful thermaloutput divided by the fuel input.
Typical boiler efficiencies are between80% and 85%.
Electric Heat Pump efficiencies can exceed 100%.
B149:
Enter NOx emission ratefor the displaced boiler.
Pounds of NOx per MMBtu (lb/MMBtu) is mostcommonly used with boilers. The MMBtu representsthe fuel input rate of the CHP system.
B154:
Select one of the profilesB159:
Enter the transmission losses forthe displaced electricity.
This value represents the losses in thetransmisson and distribution of electricityfrom the powerplant to the customer.
The specific true value for transmission lossesvaries with location and time but typical values
are between 5% and 12%.The EIA average transmission loss value is 7%.
B167:

8/8/2019 Chp Emissions Calc
http://slidepdf.com/reader/full/chp-emissions-calc 13/21
49117899.xls, Results Page 13 of 21
CHP Results
The results generated by the CHP Emissions Calculator are intended for eductional and outreach purposes only;
it is not designed for use in developing emission inventories or preparing air permit applications.
The results of this analysis have not been reviewed or endorsed by the EPA CHP Pa
Annual Emissions Analysis
CHP System
NOx (tons/year) 13.99 69.45 17.79 73.26
SO2 (tons/year) 0.23 192.58 - 192.35
CO2 (tons/year) 45,698 49,712 28,466 32,479
Carbon (metric tons/year) 11,299 12,292 7,038 8,031
Fuel Consumption (MMBtu/year) 783,175 536,485 355,823 109,133
Number of Cars Removed 5,365
This CHP project will reduce emissions of Carbon Dioxide (CO2) by 32,479 tons per ye
This is equal to 8,031 metric tons of carbon equivalent (MTCE) per year
This reduction is equal to
removing the carbon emissions
of 5,365 cars
DisplacedElectricityProduction
DisplacedThermal
ProductionEmissions/Fuel
Reduction

8/8/2019 Chp Emissions Calc
http://slidepdf.com/reader/full/chp-emissions-calc 14/21
49117899.xls, Results Page 14 of 21
CHP Results
The results of this analysis have not been reviewed or endorsed by the EPA CHP Pa
CHP Technology: Recip Engine - Lean Burn
Fuel:Natural Gas
Unit Capacity: 1,250 kW
Number of Units: 8
Total CHP Capacity: 10,000 kW
Operation: 5,840 hours per year
Heat Rate: 13,411 Btu/kWh HHV
CHP Fuel Consumption: 783,175 MMBtu/year
Duct Burner Fuel Consumption: - MMBtu/year
Total Fuel Consumption: 783,175 MMBtu/year
Total CHP Generation: 58,400 MWh/year
Useful CHP Thermal Output: 284,658 MMBtu/year for thermal applications (non-cooling)
- MMBtu/year for electric applications (cooling and ele
284,658 MMBtu/year Total
Displaced On-Site Production for Other
Thermal (non-cooling) Applications: 0.10 lb/MMBtu NOx
0.00% sulfur content
There is no displaced cooling service
Displaced Electricity Profile: eGRID Average Non-Baseload 2005
Egrid State: US Average
Distribution Losses: 7%
Displaced Electricity Production: 58,400 MWh/year CHP generation
- MWh/year Displaced Electric Demand (cooling)
- MWh/year Displaced Electric Demand (electric heat
4,396 MWh/year Transmission Losses
62,796 MWh/year Total
Displaced Electric Service (cooling and electricheating):

8/8/2019 Chp Emissions Calc
http://slidepdf.com/reader/full/chp-emissions-calc 15/21
49117899.xls, Results Page 15 of 21
CHP Results
The results of this analysis have not been reviewed or endorsed by the EPA CHP Pa
Annual Analysis for CHP
NOx (tons/year) 13.99 - 13.99
SO2 (tons/year) 0.23 - 0.23
CO2 (tons/year) 45,698 - 45,698
Carbon (metric tons/year) 11,299 - 11,299
Fuel Consumption (MMBtu/year) 783,175 - 783,175
Annual Analysis for Displaced Production for Thermal (non-cooling) Applications
NOx (tons/year) 17.79
SO2 (tons/year) -
CO2 (tons/year) 28,466
Carbon (metric tons/year) 7,038
Fuel Consumption (MMBtu/year) 355,823
Annual Analysis for Displaced Electricity Production
NOx (tons/year) 64.59 - - 4.86
SO2 (tons/year) 179.10 - - 13.48
CO2 (tons/year) 46,232 - - 3,479.81
Carbon (metric tons/year) 11,431 - - 860Fuel Consumption (MMBtu/year) 498,931 - - 37,554
CHP System:Recip Engine -
Lean BurnTotal Emissions
from CHP System
Total DisplacedEmissions from
Thermal
Production
Displaced CHPElectricity
Generation
DisplacedElectricity for
Cooling
DisplacedElectricity for
HeatingTransmission
Losses

8/8/2019 Chp Emissions Calc
http://slidepdf.com/reader/full/chp-emissions-calc 16/21
49117899.xls, Results Page 16 of 21
CHP Results
The results of this analysis have not been reviewed or endorsed by the EPA CHP P
Total Emissions for Conventional Production Total Emissions for CHP
87.24 tons of NOx 13.99 tons of N
192.58 tons of SO2 .23 tons of SO2
78,177 tons of CO2 45,698 tons of C
58,400 MWh
536,485 MMBtu Electricity to Facility 783,175 MMBtu
Fuel consumption Fuel Consumption
Central Station No Cooling CHP
Powerplant System
4,396 MWh
Transmission Losses
69.45 tons of NOx 13.99 tons of NO
192.58 tons of SO2 .23 tons of SO2
49,712 tons of CO2 45,698 tons of C
355,823 MMBtu
Fuel consumption
On-Site Thermal 284,658 MMBtu
Production Thermal to Facility Absorptio
Chiller
17.79 tons of NOx
. tons of SO2
28,466 tons of CO2
Emission Rates
NOx (lb/MWh) 0.48 0.48 2.21
SO2 (lb/MWh) 0.01 0.01 6.13
CO2 (lb/MWh) 1,565 1,565 1,583
Emission Rates
NOx (lb/MMBtu) 0.10
SO2 (lb/MMBtu) -
CHP Systemincluding Duct
Burners
Recip Engine -Lean Burn
AloneDisplacedElectricity
DisplacedThermal
Production

8/8/2019 Chp Emissions Calc
http://slidepdf.com/reader/full/chp-emissions-calc 17/21
49117899.xls, Results Page 17 of 21
CHP Results
CO2 (lb/MMBtu) 160

8/8/2019 Chp Emissions Calc
http://slidepdf.com/reader/full/chp-emissions-calc 18/21
Thermal Calculator
Value Units Description
Calculate the Power to Heat Ratio by completing the
entries in one of the following boxes:- MMBtu/hr Thermal output from a single unit
OR
30,000 lb/hr Steam consumed in process
1,000 Btu/lb Enthalpy (a common value is 1,000 Btu/lb)
30.0 MMBtu/hr calculated
OR
- MMBtu/hr Fuel consumed in thermal process (often a boiler)
0% Efficiency of thermal converter
- MMBtu/hr calculated
Results30.0 MMBtu/hr thermal output
8,790 kW thermal output
1,250 kW kW capacity of CHP system
0.142 Power to Heat ratio of CHP system
Reset Thermal Calculator Copy this Power to Heat Ratio
to the Input Screen

8/8/2019 Chp Emissions Calc
http://slidepdf.com/reader/full/chp-emissions-calc 19/21
Generation Sources
Existing Generation Sources Heat Rate
Name Code NOx lb/MWh SO2 lb/MWh CO2 lb/MWh Btu/kWh
EGrid Annual Average 1 1.94 5.26 1,329 7,292
EGrid Annual Fossil 2 2.59 7.14 1,841 9,934
EGrid Annual Coal 3 2.21 6.13 1,583 8,543
EGrid Annual Oil 4 3.36 9.77 2,136 10,432EGrid Annual Natural Gas 5 2.14 5.447 1,244 7,603
Coal Boiler 3.8 lb/MWh NOx 6 0.536 0.109 966 8,098
Coal Boiler 1.5 lb/MWh NOx 7 3.800 5.000 1,948 9,500
Coal Boiler with SCR 0.8 lb/MWh N 8 1.500 2.500 1,948 9,500
Gas Boiler 0.77 lb/MWh NOx 9 0.800 1.000 1,948 9,500
Gas Turbine Peaker 25 ppm 10 0.770 0.006 1,287 11,000
Gas combined-cycle 9 ppm 11 1.190 0.007 1,404 12,000
Gas combined-cycle 3 ppm 12 0.286 0.005 936 8,000
Please enter emission rates for the new generation sources:
User Defined Generation Sources Heat Rate
Name Code NOx lb/MWh SO2 lb/MWh CO2 lb/MWh Btu/kWh
User Source 1 13 - - - -
User Source 2 14 - - - -User Source 3 15 - - - -
Copy these Gener
Sources to theProfile Inputs
and Return to Input
Reset thisGeneration Sour
Screen

8/8/2019 Chp Emissions Calc
http://slidepdf.com/reader/full/chp-emissions-calc 20/21
Heat Content of Fuel (Btu/lb delivered)
Moisture Content of Biomass
Biomass Fuel Source Bone Dry 10% 20% 30% 40% 50%
Corn Stover 7,560 7,106 6,652 6,198 5,744 5,290
Wheat Straw 6,840 6,566 6,292 6,018 5,744 5,470
Forest Residue 8,570 7,884 7,198 6,512 5,826 5,140
Urban Wood Waste 6,150 5,840 5,530 5,220 4,910 4,600
Hybrid Poplar 8,200 7,380 6,560 5,740 4,920 4,100
Hybrid Willow 8,200 7,380 6,560 5,740 4,920 4,100
Switchgrass 8,670 8,148 7,626 7,104 6,582 6,060
Emission Rates
CO2 Emission Rate NOx Emission Rate Sulfur ContentBiomass Fuel Source
Corn Stover 0 lb/MMBtu lb/MMBtu
Wheat Straw 0 lb/MMBtu lb/MMBtu
Forest Residue 0 lb/MMBtu 0.17 lb/MMBtu 0.01 lb/MMBtu
Urban Wood Waste 0 lb/MMBtu 0.17 lb/MMBtu 0.01 lb/MMBtu
Hybrid Poplar 0 lb/MMBtu 0.17 lb/MMBtu 0.01 lb/MMBtu
Hybrid Willow 0 lb/MMBtu 0.17 lb/MMBtu 0.01 lb/MMBtu
Switchgrass 0 lb/MMBtu lb/MMBtu
*Emissions Data from AP-42

8/8/2019 Chp Emissions Calc
http://slidepdf.com/reader/full/chp-emissions-calc 21/21