community gravity: measuring bidirectional effects by trust and
TRANSCRIPT
Community Gravity: Measuring Bidirectional Effects byTrust and Rating on Online Social Networks
Yutaka MatsuoUniversity of Tokyo
2-11-16 Yayoi, Bunkyo-kuTokyo, Japan
Hikaru YamamotoSeikei University
3-3-1 Kichijoji Kitamachi, Musashino-shiTokyo, Japan 180-8633
ABSTRACTSeveral attempts have been made to analyze customer be-havior on online E-commerce sites. Some studies particu-larly emphasize the social networks of customers. Users’reviews and ratings of a product exert effects on other con-sumers’ purchasing behavior. Whether a user refers to otherusers’ ratings depends on the trust accorded by a user to thereviewer. On the other hand, the trust that is felt by a userfor another user correlates with the similarity of two users’ratings. This bidirectional interaction that involves trustand rating is an important aspect of understanding con-sumer behavior in online communities because it suggestsclustering of similar users and the evolution of strong com-munities. This paper presents a theoretical model along withanalyses of an actual online E-commerce site. We analyzeda large community site in Japan: @cosme. The noteworthycharacteristics of @cosme are that users can bookmark theirtrusted users; in addition, they can post their own ratingsof products, which facilitates our analyses of the ratings’bidirectional effects on trust and ratings. We describe anoverview of the data in @cosme, analyses of effects fromtrust to rating and vice versa, and our proposition of a mea-sure of of community gravity, which measures how strongly auser might be attracted to a community. Our study is basedon the @cosme dataset in addition to the Epinions dataset.It elucidates important insights and proposes a potentiallyimportant measure for mining online social networks.
Categories and Subject DescriptorsJ.4 [Social and Behavioral Sciences]: Sociology
General TermsAlgorithms, Human Factors
KeywordsSocial networks, Online community, Trust, Rating
1. INTRODUCTIONOnline social systems and knowledge-sharing sites have
attracted much attention as viral marketing media. Peopleshare their experiences and opinions about products and ser-vices in their blogs and knowledge-sharing sites [1]. Many
Copyright is held by the International World Wide Web Conference Com-mittee (IW3C2). Distribution of these papers is limited to classroom use,and personal use by others.WWW 2009, April 20–24, 2009, Madrid, Spain.ACM 978-1-60558-487-4/09/04.
studies have undertaken analyses of opinions in the blogo-sphere [16, 2]. Regarding knowledge-sharing sites, relationsamong customers are analyzed in various ways. An earlystudy by M. Richardson and P. Domingos provides a methodto calculate a network value of online customers [20]. Thenetwork value of a customer is high when the customer isexpected to influence other users’ probabilities of purchasingthe product both strongly and positively. Actually, D. Kempet al. follow this problem using several widely studied mod-els in social network analysis. The optimization problem ofselecting the most influential customer is NP-hard. Theyprovide a provable approximation for efficient algorithms[12]. A recent report describes techniques that decomposethe reviews into segments that evaluate the individual char-acteristics of a product, such as image quality and batterylife for a digital camera [4]. Revenue maximization (insteadof influence maximization) is proposed and optional pricingstrategies in social networks are discussed [11].
Information about customer experiences flows through so-cial relations. Users share their experiences with their friendsand colleagues. They might exchange that information withtheir friends online [22]. J. Leskovec et al. analyze recom-mendations among Amazon.com users [13]. Their resultsshow how the recommendation network grows over time.Moreover, they describe its effectiveness from the viewpointsof the sender and the receiver of the recommendations.
Users might trust some people more than others, andmight therefore be more influenced by them [6]. Even ifa certain user might make many recommendations, such aperson’s influence is limited: Users neither trust, nor arethey influenced by, such a person [13]. J. Golbeck et al. [8,25] describe that the similarity of profile attributes (suchas ratings of movies) induces trust among people. Theyanalyzed data from FilmTrust, finding that several profilefeatures beyond overall similarity affect the degree to whichsubjects trust other users. Another characteristic of trustis transitivity: If A trusts B, and B trusts C, then A canbe inferred to trust C to some degree. The calculation isvalidated through experimental studies. Guha et al. devel-ops a framework of a trust propagation scheme, and with itevaluates a large trust network using Epinions data. Theirresults show how trust and distrust exert considerable effectson trust propagation [10].
Considering those studies of the degree to which trust isformed, bidirectional effects on users’ trust and ratings arereadily apparent.
• Rating to trust: Users put trust in other members be-cause their ratings match another user’s ratings.
WWW 2009 MADRID! Track: Social Networks and Web 2.0 / Session: Interactions in Social Communities
751
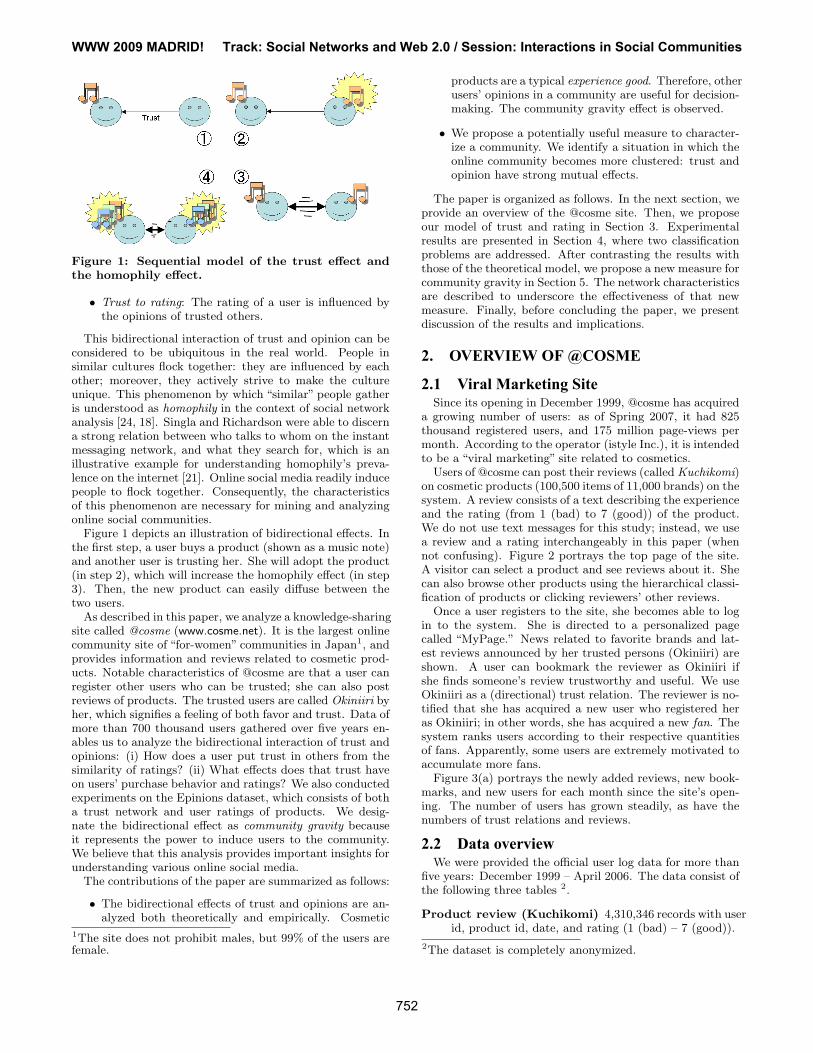
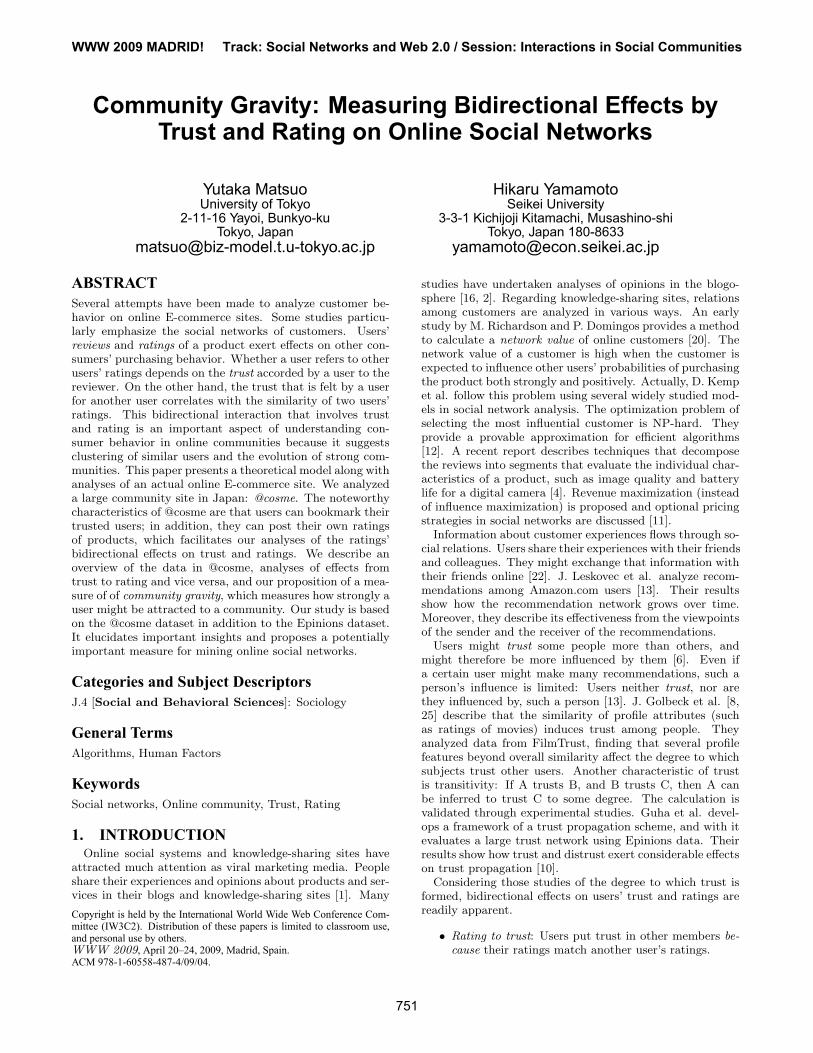
Figure 1: Sequential model of the trust effect andthe homophily effect.
• Trust to rating: The rating of a user is influenced bythe opinions of trusted others.
This bidirectional interaction of trust and opinion can beconsidered to be ubiquitous in the real world. People insimilar cultures flock together: they are influenced by eachother; moreover, they actively strive to make the cultureunique. This phenomenon by which “similar” people gatheris understood as homophily in the context of social networkanalysis [24, 18]. Singla and Richardson were able to discerna strong relation between who talks to whom on the instantmessaging network, and what they search for, which is anillustrative example for understanding homophily’s preva-lence on the internet [21]. Online social media readily inducepeople to flock together. Consequently, the characteristicsof this phenomenon are necessary for mining and analyzingonline social communities.
Figure 1 depicts an illustration of bidirectional effects. Inthe first step, a user buys a product (shown as a music note)and another user is trusting her. She will adopt the product(in step 2), which will increase the homophily effect (in step3). Then, the new product can easily diffuse between thetwo users.
As described in this paper, we analyze a knowledge-sharingsite called @cosme (www.cosme.net). It is the largest onlinecommunity site of “for-women” communities in Japan1, andprovides information and reviews related to cosmetic prod-ucts. Notable characteristics of @cosme are that a user canregister other users who can be trusted; she can also postreviews of products. The trusted users are called Okiniiri byher, which signifies a feeling of both favor and trust. Data ofmore than 700 thousand users gathered over five years en-ables us to analyze the bidirectional interaction of trust andopinions: (i) How does a user put trust in others from thesimilarity of ratings? (ii) What effects does that trust haveon users’ purchase behavior and ratings? We also conductedexperiments on the Epinions dataset, which consists of botha trust network and user ratings of products. We desig-nate the bidirectional effect as community gravity becauseit represents the power to induce users to the community.We believe that this analysis provides important insights forunderstanding various online social media.
The contributions of the paper are summarized as follows:
• The bidirectional effects of trust and opinions are an-alyzed both theoretically and empirically. Cosmetic
1The site does not prohibit males, but 99% of the users arefemale.
products are a typical experience good. Therefore, otherusers’ opinions in a community are useful for decision-making. The community gravity effect is observed.
• We propose a potentially useful measure to character-ize a community. We identify a situation in which theonline community becomes more clustered: trust andopinion have strong mutual effects.
The paper is organized as follows. In the next section, weprovide an overview of the @cosme site. Then, we proposeour model of trust and rating in Section 3. Experimentalresults are presented in Section 4, where two classificationproblems are addressed. After contrasting the results withthose of the theoretical model, we propose a new measure forcommunity gravity in Section 5. The network characteristicsare described to underscore the effectiveness of that newmeasure. Finally, before concluding the paper, we presentdiscussion of the results and implications.
2. OVERVIEW OF @COSME
2.1 Viral Marketing SiteSince its opening in December 1999, @cosme has acquired
a growing number of users: as of Spring 2007, it had 825thousand registered users, and 175 million page-views permonth. According to the operator (istyle Inc.), it is intendedto be a “viral marketing” site related to cosmetics.
Users of @cosme can post their reviews (called Kuchikomi)on cosmetic products (100,500 items of 11,000 brands) on thesystem. A review consists of a text describing the experienceand the rating (from 1 (bad) to 7 (good)) of the product.We do not use text messages for this study; instead, we usea review and a rating interchangeably in this paper (whennot confusing). Figure 2 portrays the top page of the site.A visitor can select a product and see reviews about it. Shecan also browse other products using the hierarchical classi-fication of products or clicking reviewers’ other reviews.
Once a user registers to the site, she becomes able to login to the system. She is directed to a personalized pagecalled “MyPage.” News related to favorite brands and lat-est reviews announced by her trusted persons (Okiniiri) areshown. A user can bookmark the reviewer as Okiniiri ifshe finds someone’s review trustworthy and useful. We useOkiniiri as a (directional) trust relation. The reviewer is no-tified that she has acquired a new user who registered heras Okiniiri; in other words, she has acquired a new fan. Thesystem ranks users according to their respective quantitiesof fans. Apparently, some users are extremely motivated toaccumulate more fans.
Figure 3(a) portrays the newly added reviews, new book-marks, and new users for each month since the site’s open-ing. The number of users has grown steadily, as have thenumbers of trust relations and reviews.
2.2 Data overviewWe were provided the official user log data for more than
five years: December 1999 – April 2006. The data consist ofthe following three tables 2.
Product review (Kuchikomi) 4,310,346 records with userid, product id, date, and rating (1 (bad) – 7 (good)).
2The dataset is completely anonymized.
WWW 2009 MADRID! Track: Social Networks and Web 2.0 / Session: Interactions in Social Communities
752

Figure 2: Screenshot of the top page at @cosme.
Trust relation (Okiniiri) 530,598 records with user id,(her trusted) user id, and date.
User profile 670,040 unique users with user id, registrationand birth date, type of skin. These personal profilesare visible to others. All the users have their personalprofiles, which are available for use in our analyses.
2.2.1 Product ReviewsWe introduce some additional information related to the
data. Among 4,310,346 reviews overall, 72,522 productshave at least one review. Therefore, one product has, onaverage, 59.4 reviews, which is quite a large number, re-flecting high activity among users in the community. Aboutone-third of users have written at least one review. On av-erage, a user posts 6.43 reviews. A user who posts at leastonce writes 20.47 reviews, on average.
Table 1 shows the most-reviewed products. Low-pricedand commonly used products are listed higher, such as nailpolish, cleansing oil, eye shadow, and lotion. The most ac-tive user (i.e., the user with the largest number of reviews)has posted 2179 reviews during the four years since 2002,which is about 1.5 reviews per day.
The distribution of the number of reviews apparently con-forms to a power law, as depicted in Fig. 3(b). A strangegap separates x = 9 and x = 10, which might be attributableto the fact that a user with 10 or more reviews can use apersonalized recommendation function by the system. Thisminimum requirement motivates users to post 10 or morereviews.
2.2.2 Trust RelationThe entire set of 530,598 trust relations comprises 49,685
users targeting 61,556 users. In other words, 7.4% of usersuse the bookmark function at least once, and 9.2% of usersare trusted by others. On average, 10.7 trust relations aremade by single users who have used the trust function atleast once.
It is particularly interesting that the correlation betweenthe number of fans and the number of her trusted users isnot high: the Spearman correlation between the number of
Table 1: Most-reviewed products.#reviews product name
1 18717 eyelash curler2 16599 nail polish3 15126 deep cleansing oil4 12287 hair oil Ohshima Tsubaki5 10877 cleansing oil6 10508 eye shadow7 10238 eyelash curler8 10086 liquid foundation9 9808 petroleum jelly10 9570 skin conditioner
0
20000
40000
60000
80000
100000
120000
140000
01/01/1999 01/01/2000 01/01/2001 01/01/2002 01/01/2003 01/01/2004 01/01/2005 01/01/2006 01/01/2007
#reviews#new bookmarks
#new users
(a) Numbers of new users,new bookmarks, and new re-views per month.
100
101
102
103
104
105
100 101 102 103 104
Cou
nt
Number of reviews
"res_dist.txt"
(b) Numbers of reviews byusers and their counts.
100
101
102
103
104
105
100 101 102 103 104
Cou
nt
Number of bookmarks
"res_dist_okini.txt"
(c) Outdegree distributionof bookmarks.
100
101
102
103
104
105
100 101 102 103 104
Cou
nt
Number of (in-)bookmarks
"res_dist_okini_in.txt"
(d) Indegree distribution ofbookmarks.
Figure 3: Overview of the network data on @cosme
fans and the number of reviews is as high as 0.658, but thatbetween the number of fans and the number of her trustedusers is only 0.067. Figures 3(c) and 3(d) portray the degreedistributions when considering a trust relation as a directededge. Both exhibit a linear relation on log–log plots.
3. THEORYBidirectional interaction of trust and rating can be un-
derstood as follows: In the first step, a user buys a cosmeticproduct and another user is trusting her. She will adopt theproduct, which will increase the homophily effect. Then, thenew product can easily diffuse between the two users.
Figure 4 portrays a community with strong gravity if weexamine phenomena on a community scale. A product is dif-fused through the trust network, which will result in moretightly connected community. Consequently, the new prod-uct can easily diffuse within the community, which will strengthenthe community further. A user will be induced to join thecommunity if she is connected to the community. This effectresembles gravitational force. For that reason, we designateit as community gravity in this paper.
If no bidirectional effects pertain in the community, the
WWW 2009 MADRID! Track: Social Networks and Web 2.0 / Session: Interactions in Social Communities
753

Figure 4: Strong gravity community vs. other com-munities.
interaction is simpler. In Fig. 4, the interaction of a trust-effective community is shown: a product can be diffusedwell through the trust network. Another product might bediffused similarly, but no cumulative effect occurs. On theother hand, in the homophily effective community, similarusers will share mutual trust. However, unless a trust rela-tion has an effect on the diffusion of a product, a productneither diffuses through the network, nor does the commu-nity become stronger. Therefore, to understand the commu-nity dynamics, it is important to consider effects from trustto rating and vice versa.
First, to show how a community grows with strong com-munity gravity, we model the interaction between rating of aproduct and trust relation. The rating of user x on producti at time t, denoted as sx,i(t) (0 ≤ sx,i(t) ≤ 1), is funda-mentally determined by the preference of user x to producti. It is also influenced by the rating of other users that userx trusts. Therefore, we model the rating as the summationof her original evaluation sx,i(0) and the ratings of users shetrusts. We denote the users who are trusted by user x asNx.
sx,i(t + 1) = λ0sx,i(t) + λ11
|Nx(t)|X
y∈Nx(t)
tx,y(t)sy,i(t) (1)
In the equation presented above, tx,y(t) represents the trustvalue [0,1] of user x to user y at time t and λ0 and λ1 areconstants. We divide the rating of trusted users by the num-ber of her trusted users |Nx(t)|, thereby taking the averageof ratings. (Otherwise, if a user trusts more users, her orig-inal evaluation is less weighted, which seems unreasonable.)We can write the expression in a more general form as
St+1 = λ0St + λ1TtSt = (λ0I + λ1Tt)St
where St = {sx,i(t)} and Tt = {tx,y(t)/|Nx(t)|}.Second, we model the trust relation of a user to another
user based on the similarity of ratings. As described in [9],trust is induced by the similarity of ratings between two
users.
tx,y(t + 1) = μ0tx,y(t) + μ1sim(sx,I(t), sy,I(t)) (2)
Therein, tx,y(0) is the original trust from user x to user y.A set of items is denoted as I, and sx,I(t) is the vector ofrating sx,i(t) (i ∈ I). A function sim(·) is used to calculatethe similarity between two vectors (e.g., cosine similarityand inner product), and μ0 and μ1 are constants3. We canalso write the expression using matrices, as
Tt+1 = μ0Tt + μ1STt XSt,
where X is a (Mahalonobis distance) matrix to calculatethe distance. Below we use an inner product as a similaritymeasure for simplicity. As described later, cosine similarityfunctions well as a similarity measure. The inner productcorresponds to cosine similarity if we assume that the vectors is normalized so that the vector length would be 1.
Formula 1 and Formula 2 are mutually dependent. If wesolve the two formulae, we can obtain4
tx,y(t + 1) =1
Kxy(t)
μ1λ1
|Nx(t)|
0@ X
z∈Nx(t),z �=y
tx,z(t)sy,i(t)sz,i(t)
1A ,
where
Kxy(t) = 1 − μ1λ1
|Nx(t)|Xi∈I
sy,i(t)2.
This formula shows that the trust of user x to user yis determined by the similarity of the rating and also thesimilarity among y to the other users. It is apparent thatKxy becomes large if s(y, i) gets large, meaning that userswith good ratings on many items might be less trusted.
Similarly, we can obtain
sx,i(t + 1) =
1
Kxy(x)
μ1λ21
|Nx(t)|2X
y∈Nx(t)
Xz∈Nx(t)z �=y
tx,z(t)sy,i(t)2sz,i(t).
This formula is complex, but we can understand it as fol-lows: we assume that user x increases her rating on producti with Δsxi. Then, tx,y increases by μ1Δsxisy,i; if user yhas a high rating on product i, the increase on sx,i increasesthe similarity, resulting in the increase of trust tx,y. If usery has a low (or zero) rating on product i, it does not bringmuch of an increase (sometimes even a decrease) of tx,y
5.Eventually, sx,i(t) is increased by
λ1μ1
|Nx| Δsxisy,i(t)2. (3)
Therefore, an increase of rating sx,i again brings the increaseof rating sx,i itself by order of λ1μ1s(y, i)2/|Nx(t)| throughneighboring user y. The user eventually obtains a higherincrease on sx,i(t) if user x has many neighbors with a high
3Trust can also be induced in a transitive manner using thetrust values of more distantly related users, as described in aprevious study [9, 10]. However, because similarity measuresusually have some transitivity, we use no explicit formulationof transitive trust.4Here for simplicity, we assume that tx,y(0) = 0 andsx,i(0) = 0. Complete formulae will be found in the longerversion of the paper.5Because we assume s to be normalized, in the case for whichsy,i(t) is low, tx,y(t) actually decreases.
WWW 2009 MADRID! Track: Social Networks and Web 2.0 / Session: Interactions in Social Communities
754

rating on product i. In this way, the ratings of users becomesimilar if they are closely connected, thereby producing acluster of users with similar preferences.
Depending on product and user characteristics, λ1 and μ1
differ. The opinions of users on a particular product tend tobe similar locally, which produces denser clusters than thosefor other products.
4. DATA ANALYSISFor the discussion presented in this section, we take a
practical approach to analyze bidirectional interaction be-tween trust and rating. By empirically examining each in-teraction, we can support the model of the previous section.
We build two prediction problems: prediction for trustand prediction for rating of the product. Trust prediction is,given two users x and y, to predict whether a trust relationfrom x to y exists. It can be considered as a link predictionproblem [7]. We use the features based on two users’ profiles,product ratings, and other trust relations.
Rating prediction is complementary: given a user and aproduct, we seek to predict the rating. Features are gen-erated using her profile, her ratings of the other product,then her trusted users. Both problem resolutions produce aprediction based on the data before the time point. Modelsto predict trust and ratings are learned using classificationalgorithms.
4.1 Trust Prediction
4.1.1 FeaturesTo predict the trust from user x to user y, we use features
of three kinds: each corresponds to a table in @cosme data.The overall features are presented in Table 2. The first typeof feature is based on a profile table; we use the propertiesof user x and user y, along with the properties’ differenceand correspondence.
The second type of feature uses the product-review ta-ble. The features are invented to measure the similaritiesof ratings of user x and user y on various products. Forexample if user x announces ratings on five products, then{(P1, 6), (P2, 4), (P3, 5), (P4, 2), (P5, 7)}, where Pi representsproduct i annotated using a rating of an integer [1,7]. As-sume that user y makes ratings of four products: {(P1, 5),(P2, 5), (P6, 7), (P6, 3)}. Then, we can calculate the similar-ity using various measures. In this case, P1, P2, and P5 arerated by both users. Therefore, the matching coefficient isthree. The value is 3/
√4√
5 = 0.67 if we perform calcula-tions using cosine similarity, denoting a set of items rated byuser x as Ix. The three measures we use are the following:
(i) Matching coefficient: |I(x) ∩ I(y)|,(ii) Cosine similarity: |I(x) ∩ I(y)|/(|I(x)||I(y)|), and
(iii) Jaccard coefficient: |I(x) ∩ I(y)|/|I(x) ∪ I(y)|.We also use (iv), a product for which I(x) is considered asa vector, and calculate I(x) · I(y).
Users might refer to reviews with good ratings more often,or reviews with a bad rating more often. Therefore, wedefine a set of items with good/bad reviews as Igood(x) andIbad(x) correspondingly. We define a good rating as one witha score of 6 points or more; a bad rating has 2 points or less.In the example, user x assigns a good rating on P1 and P5,
whereas user y assigns a good rating to P7. Then, we candefine the overlap of Igood(x) and Igood(y), or Ibad(x) andIbad(y) as well.
Users might not be familiar with a product. However,sometimes they make a purchase decision based on a brandor manufacturer. Users often have several preferred brandsor manufacturers. Therefore, we can calculate the overlapof rated items as categorized by brands, or as categorized bymanufacturers. Overall, we have 4 (#measures) × 3 (#sets)× 3 (product/brand/manufacturer) = 36 features.
The third type of feature is derived from trust relations(except the very relation from x to y, which we seek to pre-dict). Following the link prediction study [15], we build thefollowing attributes: (i) the number of neighbors for userx and y, (ii) distance on the network, (iii) common neigh-bors of user x and user y, (iv) Jaccard coefficient of neigh-bors of user x and y, (v) Adamic–Adar, which is definedas
Pz∈Nx∩Ny
1log |N(z| , and (vi) preferential attachment, de-
fined as |Nx||Ny|. The trust network comprises trust rela-tions of both directions (where we regard the trust relationfrom x to y as identical to trust relation from y to x), singlerelations (where we distinguish the relation from x to y andthe relation from y to x), and reciprocal relations (where weput a link from x to y if a trust relation from user y to user xexists). Therefore, we have three networks associated withrespective features.
4.1.2 ResultsWe randomly chose 1000 pairs of users with trust relations
and another 1000 pairs of unrelated users without relations;they correspond respectively to positive and negative sets.We used a support vector machine (SVM) with a linear ker-nel [23] as a classifier6.
Table 4 shows the performances of classifying trust rela-tions. Each group of attributes contributes to the classifica-tion. Trust features and ratings features contribute greatlyto the performance compared to profile features. The F1value is 82.46% if we use all three groups.
Table 5 shows features with the highest weights in theobtained model by the SVM classifier. It is apparent thatthe number of trusted users for y and the number of trustedusers by x are the two highest features, which might be read-ily apparent. Highly trusted users are likely to be trustedusing a particular user; a user who trusts many others islikely to trust another.
Some features in the table are of particular interest: Jaccard-directional is the overlap of user x’s trusted users andtrusted users by user y, which implies the transitivity oftrust relations. The all-product-cos is the similarity ofall rated items by user x and those by user y. This can beunderstood that the similarity can be well measured usingthe cosine of the rated product.
4.2 Rating PredictionNext, we build the rating prediction problem. The fea-
tures we used, as presented in Table 3, are categorized intoprofile, rating, and trust, as well as trust prediction.
Considering the rating by user x of product i, the profilefeatures are simply the properties of user x. The ratingfeatures are the number of ratings by user x, the average
6We compared it to several other classifiers including J4.8and Naive Bayes. They produced similar results overall.The results worsen by a few points.
WWW 2009 MADRID! Track: Social Networks and Web 2.0 / Session: Interactions in Social Communities
755

Table 2: Features for trust prediction (from user X to user Y ).Group type featuresProfile skin skin-same (binary), skin-X (category), skin-Y (category)
profession profession-same (binary), profession-X (category), profession-Y (category)age age-X, age-Y, age-difhistory history-X, history-Y, history-dif
Rating good rating good-product-matching, good-product-product, good-product-cos, good-product-Jaccard, good-brand-matching good-brand-product, good-brand-cos, good-brand-Jaccard, good-manufacturer-matching, good-manufacturer-product, good-manufacturer-cos, good-manufacturer-Jaccard
bad rating bad-product-matching, bad-product-product, bad-product-cos, bad-product-Jaccard, bad-brand-matching, bad-brand-product, bad-brand-cos, bad-brand-Jaccard, bad-manufacturer-matching, bad-manufacturer-product, bad-manufacturer-cos, bad-manufacturer-Jaccard
all rating all-product-matching, all-product-product, all-product-cos, all-product-Jaccard,all-brand-matching, all-brand-product, all-brand-cos, all-brand-Jaccard, all-manufacturer-matching, all-manufacturer-product, all-manufacturer-cos, all-manufacturer-Jaccard
stats review-n-X, rating-ave-X, rating-std-X, review-n-year-X, popularity-X, over6-X,under2-X, review-n-Y, rating-ave-Y, rating-std-Y, review-n-year-Y, popularity-Y,over6-Y, under2-Y
Trust stats trusted-n-X, trusting-n-X, trusted-n-Y, trusting-n-Ygraph distancesimilarity common-neighbors-directional, common-neighbors-reverse, common-neighbors-
undirectional, Jaccard-directional, Jaccard-reverse, Jaccard-both, Adamic–Adar-directional, Adamic–Adar-reverse, Adamic–Adar-undirectional, preferential-directional, preferential-reverse, preferential-undirectional
Note: All features are continuous (except some profile features). We were not able to explain all the features, but we did explain some:
The skin-same is 1 when the skin types of two users are the same. The age-dif is the difference of ages (days after the birthday) of
two users. The good-product-matching means the matching coefficient of reviews with good rating (6 or more score). The review-n-X
means the number of reviews by user X. The over6-Y is the number of good ratings (score of 6 or more) by user Y . The trusted-n-X is
the number of users whom user X trusts. The trusting-n-Y is the number of users who trust user Y . The Adamic-Adar-directional
means the similarity within the directional trust network measured using the Adamic–Adar index.
Table 4: Performance of trust prediction.Attributes Precision Recall F1
Profile 54.89% 53.18% 54.02%Rating 77.38% 65.29% 70.82%Trust 90.04% 71.33% 79.60%
Profile + Rating 77.55% 67.41% 72.12%Profile + Trust 89.78% 72.30% 80.10%Rating + Trust 88.73% 75.52% 81.60%
All 88.10% 77.51% 82.46%
of ratings by user x, the standard deviation of the ratingsby user x, the number of good ratings, and the number ofbad ratings. We also calculate these values for brands andmanufacturers. Then we produce summations of ratings onproduct i: the number of reviews, the average and standarddeviation of ratings, and so on.
As for the trust relation, we aggregate the ratings by userswho are trusted by user x. The number of ratings, the av-erage of ratings, and the standard deviation are calculatedto the product, the brand, and the manufacturer.
The rating prediction is reduced to classification. Thetask is to classify a review into a good review class (with 6points or more) and a non-good review class (with 5 pointsor less). The results are presented in Table 6. It is apparentthat ratings of features and trust features have comparableperformance. In addition, F1 is 86.8% using SVM if we useall the features.
The highly weighted features are presented in Table 7. Itis apparent that the number of reviews of products and thenumber of reviews by the user are important features. Par-ticularly interesting features include user-brand-ave and
Table 5: Highly weighted features in trust predic-tion.
1 trusting-n-Y 5.60752 trusted-n-X 5.33423 Jaccard-undirectional 3.82254 Jaccard-directional 3.70145 all-product-cos 2.82916 Jaccard-reverse 2.69437 Adamic–Adar-directional 1.74098 common-neighbors-directional 1.51829 all-product-Jaccard 1.485810 review-n-Y 1.194311 common-neighbors-undirectional 1.188312 bad-product-cos -1.171213 over6-X -1.074614 bad-product-Jaccard -1.030915 popularity-X -1.0119
okiniiri-rate-ave. A user has favorite brands. For thatreason, the average of ratings of the brand is a good fea-ture. The average of ratings of users whom the user trustsis also a good feature, justifying the effect of trusted usersin Formula 1.
4.3 Estimating ParametersTo investigate the correspondence between the practical
classifiers and the evolution model in the previous section,we select a few highly weighted features that represent re-spective terms in the theoretical formulae. Subsequently, weapply regression using SVM using the features to estimateparameters μ1 and λ1.
WWW 2009 MADRID! Track: Social Networks and Web 2.0 / Session: Interactions in Social Communities
756

Table 3: Features for rating prediction (by user X for product A)Group type featuresProfile skin-X (category), profession-X (category), age-X, history-XRating user stat user-total-n, user-total-ave, user-total-std, user-total-over6, user-total-under2,
user-oldest-review, user-latest-reviewuser user-brand-n, user-brand-ave, user-brand-std, user-brand-over6, user-brand-
under2, user-manufacturer-n, user-manufacturer-ave, user-manufacturer-std,user-manufacturer-over6, user-manufacturer-under2
product product-review-n, product-review-ave, product-review-std, product-review-over6,product-review-under2, product-oldest-review, product-latest-review
brand brand-review-n, brand-review-ave, brand-review-std, brand-review-over6, brand-review-under2
manufacturer manufacturer-review-n, manufacturer-review-ave, manufacturer-review-std,manufacturer-review-over6, manufacturer-review-under2,
Trust product trusted-review-n, trusted-rate-ave, trusted-rate-std, trusted-over6, trusted-under2
brand trusted-brand-review-n, trusted-brand-rate-ave, trusted-brand-rate-std, trusted-brand-over6, trusted-brand-under2
manufacturer trusted-manufacturer-review-n, trusted-manufacturer-rate-ave, trusted-manufacturer-rate-std, trusted-manufacturer-over6, trusted-manufacturer-under2
We explain some features hereinafter. The user-total-n is the number of reviews by user X. The user-total-ave and user-total-std
respectively signify the average and standard deviation of the ratings by user X. The user-latest-review is the number of days after
the latest review is posted by user x. The user-manufacturer-n is the number of reviews by user X of products made by the same
manufacturer of product A. The product-review-under2 is the number of ratings with a score of 2 or less on product A. The brand-
review-ave is the average rating of products with the same brand as product A. The trusted-review-n is the number of reviews posted
by users who are trusted by user A. The trusted-brand-ave is the average rating of the brand of product A by users who are trusted
by user X.
Table 6: Performance of rating prediction.Attributes Precision Recall F1
Profile 53.14% 64.36% 58.21%Rating 89.34% 79.73% 84.26%Trust 83.27% 46.39% 59.59%
Profile + Rating 89.32% 79.62% 84.19%Profile + Trust 81.77% 46.86% 59.58%Rating + Trust 90.01% 83.76% 86.77%
All 89.85% 81.85% 85.66%
For trust prediction, by selecting four highly weighted fea-tures and applying regression, we can obtain the followingformula.
tx,y(t + 1) = μ0tx,y(t) + μ1sim(sx,I(t), sy,I(t))
∼ 0.34 × trusting n Y + 0.31 × trusting n X
+0.25 × Jaccard directional
+0.09 × all product cos (4)
The first three terms can be attributed to tx,y(t). We can es-timate μ1 as 0.09 if we take all-product-cos as a similaritymeasure.
Regarding rating prediction, by selecting four highly weightedfeatures, we can construct the following model.
sx,i(t + 1) = λ0sx,i(t) + λ11
Nx
Xy∈Trustedx
tx,y(t)sy,i(t)
∼ 0.27 × user total n + 0.42 × product review n
+0.16 × user brand ave
+0.14 × trusted rate ave (5)
Similarly, the first three terms are attributed to sx,i(t). Byselecting trusted-rate-ave as a rating measure, we can es-timate λ1 as 0.14.
Table 7: Highly weighted features in rating predic-tion.
1 product-review-n 4.51352 product-review-over6 3.88163 user-total-n 2.56224 product-latest-review -2.0755 product-review-under2 1.89626 user-brand-ave 1.7067 trusted-rate-ave 1.69098 trusted-under2 1.59269 trusted-brand-review-n -1.469310 user-manufacturer-ave 1.447711 user-total-over6 1.222812 user-manufacturer-n 1.054313 brand-review-std -1.042914 trusted-manufacturer-review-n -1.024115 trusted-review-n 1.015
5. COMMUNITY GRAVITY
5.1 Measuring Bidirectional EffectFor the analysis described above, we can infer that μ0 =
0.09 and λ1 = 0.14 for overall users and products in @cosme.However, this value varies depending on the product. Someproducts, brands, and manufacturers might have a large μ0
and λ1, i.e., strong community gravity. Especially, from amarketing perspective, when a brand has a large bidirec-tional effect, it generates a strong community: users be-come more connected, and a new product prevails easilyin the community. Each cosmetics manufacturer strives toestablish and strengthen its own brands. Therefore, it is rea-sonable to consider a brand as an important medium of thebidirectional effects. Below, we present analyses of the bidi-rectional effect, particularly addressing cosmetics brands.
The parameters μ1 and λ1 can be estimated for each
WWW 2009 MADRID! Track: Social Networks and Web 2.0 / Session: Interactions in Social Communities
757
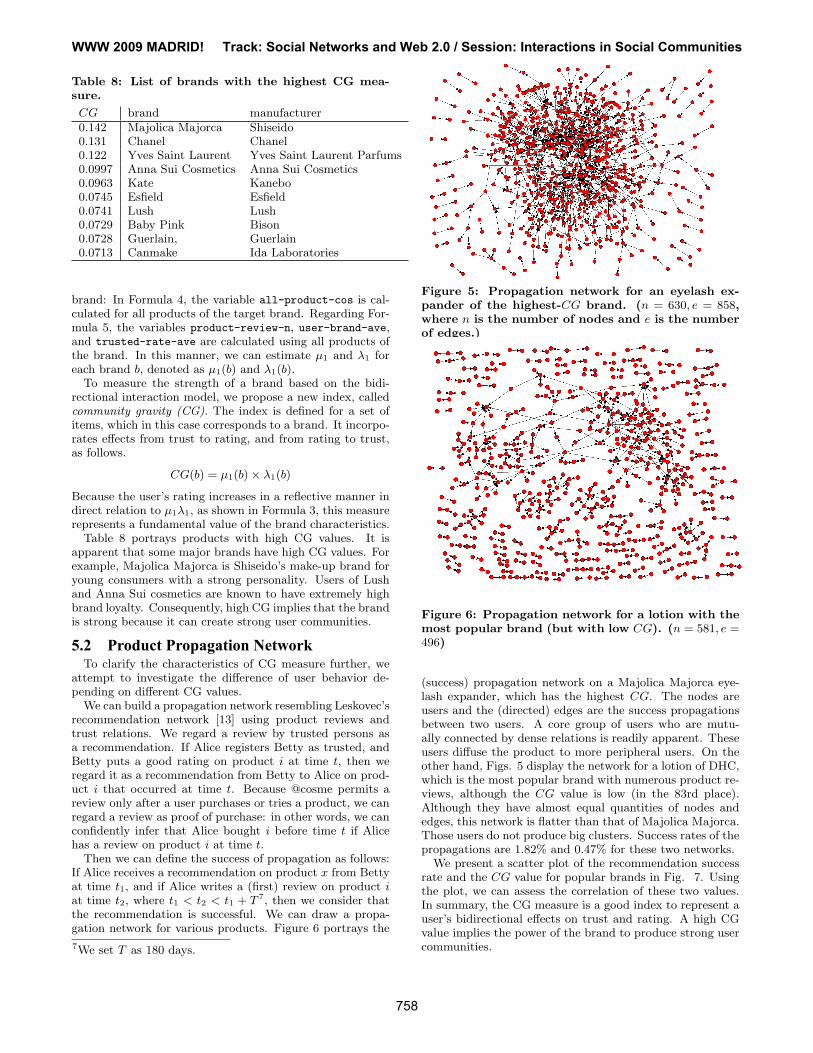
Table 8: List of brands with the highest CG mea-sure.
CG brand manufacturer0.142 Majolica Majorca Shiseido0.131 Chanel Chanel0.122 Yves Saint Laurent Yves Saint Laurent Parfums0.0997 Anna Sui Cosmetics Anna Sui Cosmetics0.0963 Kate Kanebo0.0745 Esfield Esfield0.0741 Lush Lush0.0729 Baby Pink Bison0.0728 Guerlain, Guerlain0.0713 Canmake Ida Laboratories
brand: In Formula 4, the variable all-product-cos is cal-culated for all products of the target brand. Regarding For-mula 5, the variables product-review-n, user-brand-ave,and trusted-rate-ave are calculated using all products ofthe brand. In this manner, we can estimate μ1 and λ1 foreach brand b, denoted as μ1(b) and λ1(b).
To measure the strength of a brand based on the bidi-rectional interaction model, we propose a new index, calledcommunity gravity (CG). The index is defined for a set ofitems, which in this case corresponds to a brand. It incorpo-rates effects from trust to rating, and from rating to trust,as follows.
CG(b) = μ1(b) × λ1(b)
Because the user’s rating increases in a reflective manner indirect relation to μ1λ1, as shown in Formula 3, this measurerepresents a fundamental value of the brand characteristics.
Table 8 portrays products with high CG values. It isapparent that some major brands have high CG values. Forexample, Majolica Majorca is Shiseido’s make-up brand foryoung consumers with a strong personality. Users of Lushand Anna Sui cosmetics are known to have extremely highbrand loyalty. Consequently, high CG implies that the brandis strong because it can create strong user communities.
5.2 Product Propagation NetworkTo clarify the characteristics of CG measure further, we
attempt to investigate the difference of user behavior de-pending on different CG values.
We can build a propagation network resembling Leskovec’srecommendation network [13] using product reviews andtrust relations. We regard a review by trusted persons asa recommendation. If Alice registers Betty as trusted, andBetty puts a good rating on product i at time t, then weregard it as a recommendation from Betty to Alice on prod-uct i that occurred at time t. Because @cosme permits areview only after a user purchases or tries a product, we canregard a review as proof of purchase: in other words, we canconfidently infer that Alice bought i before time t if Alicehas a review on product i at time t.
Then we can define the success of propagation as follows:If Alice receives a recommendation on product x from Bettyat time t1, and if Alice writes a (first) review on product iat time t2, where t1 < t2 < t1 + T 7, then we consider thatthe recommendation is successful. We can draw a propa-gation network for various products. Figure 6 portrays the
7We set T as 180 days.
Figure 5: Propagation network for an eyelash ex-pander of the highest-CG brand. (n = 630, e = 858,where n is the number of nodes and e is the numberof edges.)
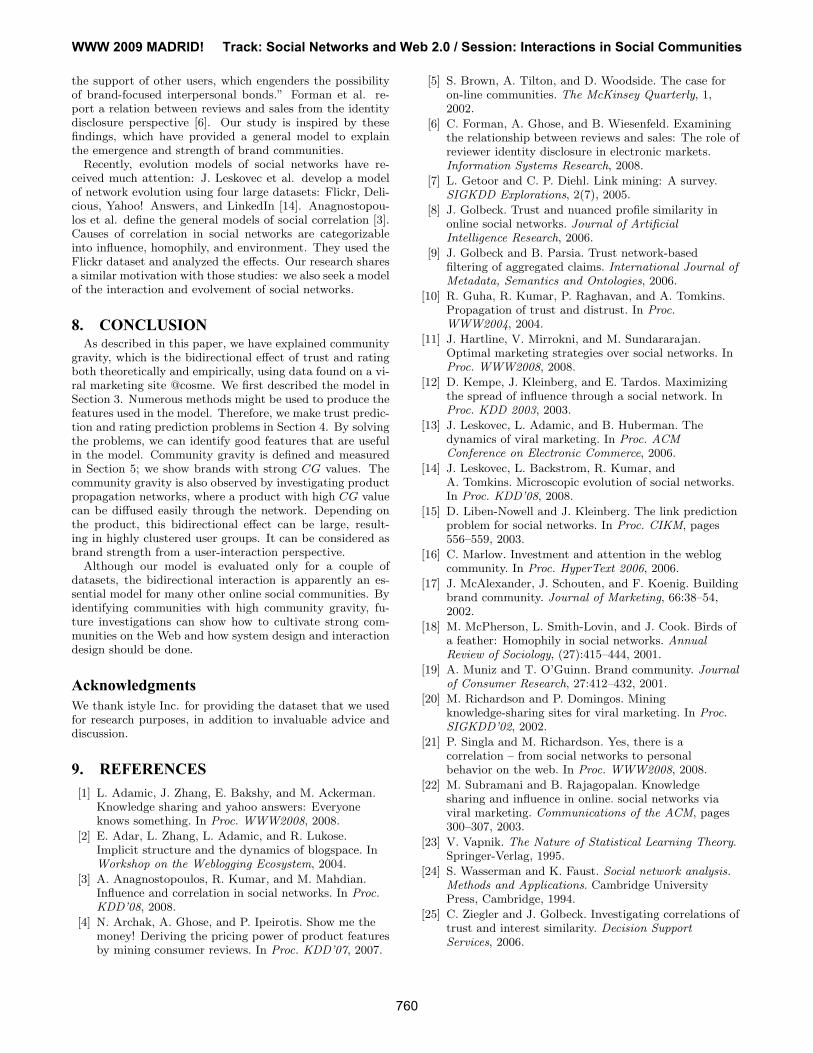
Figure 6: Propagation network for a lotion with themost popular brand (but with low CG). (n = 581, e =496)
(success) propagation network on a Majolica Majorca eye-lash expander, which has the highest CG. The nodes areusers and the (directed) edges are the success propagationsbetween two users. A core group of users who are mutu-ally connected by dense relations is readily apparent. Theseusers diffuse the product to more peripheral users. On theother hand, Figs. 5 display the network for a lotion of DHC,which is the most popular brand with numerous product re-views, although the CG value is low (in the 83rd place).Although they have almost equal quantities of nodes andedges, this network is flatter than that of Majolica Majorca.Those users do not produce big clusters. Success rates of thepropagations are 1.82% and 0.47% for these two networks.
We present a scatter plot of the recommendation successrate and the CG value for popular brands in Fig. 7. Usingthe plot, we can assess the correlation of these two values.In summary, the CG measure is a good index to represent auser’s bidirectional effects on trust and rating. A high CGvalue implies the power of the brand to produce strong usercommunities.
WWW 2009 MADRID! Track: Social Networks and Web 2.0 / Session: Interactions in Social Communities
758

0
1
2
3
4
5
6
0 0.05 0.1 0.15 0.2 0.25 0.3 0.35 0.4 0.45
succ
ess
rate
of r
ecom
men
datio
n
CG
Figure 7: Plot of CG and the recommendation suc-cess rate.
6. DISCUSSION
6.1 Static ModelWe must describe the evolution model of trust and rating
in Section 3. Alternatively, we can consider a static modelwith which data analysis can be done easily. Below we de-scribe the model briefly.
Assuming that we have two matrices S and T, then S isan n×n trust matrix, representing who trusts whom. In ad-dition, T is an n×m rating matrix, representing one’s ratingfor each product. Then we can calculate the bidirectionaleffect using the matrices on a (set of) products.
We denote trustx,y if user x has trust with user y, andratex,i if user x rated product i high. Then the probabilityto rate product i is represented as P (ratey,i|trusty,x, ratex,i),and the ratio to P (ratey,i|ratex,i) can be an index to repre-sent the degree to which trust affects the ratings.
In contrast, the probability for user x to trust user y basedon purchased products is represented as P (trusty,x|ratey,i, ratex,i),which can be compared with P (trusty,x). Consequently,both effects can be an index by multiplying two figures as8
P (ratey,i|trusty,x, ratex,i)
P (ratey,i|ratex,i)· P (trusty,x|ratey,i, ratex,i)
P (trusty,x)
=
jP (trusty,x, ratey,i, ratex,i)
P (trusty,x)P (ratey,i, ratex,i)
ff2
The denominator is calculable by counting non-zero valuesin T and the number of non-zero values in SST. Therefore,the bidirectional effect on product i can be approximatedusing the two matrices Tt and St. This model can be con-sidered as a simple variant (discarding the evolution aspect)of the community gravity measure described in Section 5.However, because the evolutionary aspect is important tounderstand community behavior, we adopt the evolutionmodel in this paper.
6.2 Analysis of the Epinions datasetOur algorithm is applicable if we have trust data (among
users) and rating data. We also conducted analysis of thedataset of Epinions, which is a website where people canreview products.
8We assume that P (trusty,x|ratex,i) = P (trusty,x). In thisstatic model, the time of purchase and trust is discarded.
Table 9: Performance of trust prediction (Epiniondataset).
Attributes Precision Recall F1Rating 79.75% 74.12% 76.83%Trust 96.72% 69.41% 80.82%
Rating + Trust 92.21% 86.03% 89.01%
Table 10: Performance of rating prediction (Epiniondataset).
Attributes Precision Recall F1Rating 78.11% 63.89% 70.69%Trust 57.57% 83.61% 68.19%
Rating + Trust 72.61% 7769.% 75.07%
We used the extended Epinions dataset9, which containsabout 132,000 users and 840,000 trust statements, to con-duct the same experiment. Figures 9 and 10 present resultsof trust prediction and rating prediction, as we have donewith the @cosme dataset. The Epinions dataset does notinclude user profiles. For that reason, we cannot use theattributes derived from user profiles.
Both the rating and trust information are important forthe performance. Particularly, Jaccard-undirectional,Jaccard-directional, trusting-n-X, and trusted-n-Y arethe useful features for trust prediction, and user-total-n,user-total-over4, trusted-review-n, and product-review-
n are useful features for rating prediction. Overall, the ten-dency resembles that of the @cosme dataset very well, whichis evidence of the robustness of our algorithm.
The algorithm might be applicable to online shopping sites(such as Amazon.com, Epinions, and eBay) if we were ableto use trust (or bookmarking) data. We show that a smallnumber of instances of expressed trust per individual enablesus to predict trust between any two people in the systemwith high accuracy. The development of social networkingservices might enable the use of social network data at onlineshopping sites, thereby providing the opportunity to use ouralgorithm to elucidate the bidirectional effects of products.Our algorithm is also applicable to existing data of severaltypes: e.g., published data (e.g. DBLP, Citeseer, and Coradatabase) have information about papers presented at con-ferences (which corresponds to purchase of a product), andthe co-authorship of a paper or co-affiliation to an institute(which corresponds to trust in a person). Consequently, thebrand value of a conference, a journal, or an academic fieldis measurable.
7. RELATED WORKNumerous attempts have been undertaken to investigate
brand communities in the marketing science field. For ex-ample, Brown et al. compare members and non-members ofvirtual communities and report that the community mem-bers are more likely to engage in online shopping and havehigher propensity to re-visit the website [5]. Muniz andO’Guinn expand the traditional model of “customer-brand”relation to a “customer-brand-customer” triad [19]. The re-sults of field research and in-depth interviews reflect thatthe brand community is a powerful tool to strengthen brandloyalty. McAlexander, Schouten, and Koenig also describethe impact of brand community [17]. They show that cus-tomers who purchase a branded product “often do so with
9Data are available fromwww.trustlet.org/wiki/Extended Epinions dataset.
WWW 2009 MADRID! Track: Social Networks and Web 2.0 / Session: Interactions in Social Communities
759
the support of other users, which engenders the possibilityof brand-focused interpersonal bonds.” Forman et al. re-port a relation between reviews and sales from the identitydisclosure perspective [6]. Our study is inspired by thesefindings, which have provided a general model to explainthe emergence and strength of brand communities.
Recently, evolution models of social networks have re-ceived much attention: J. Leskovec et al. develop a modelof network evolution using four large datasets: Flickr, Deli-cious, Yahoo! Answers, and LinkedIn [14]. Anagnostopou-los et al. define the general models of social correlation [3].Causes of correlation in social networks are categorizableinto influence, homophily, and environment. They used theFlickr dataset and analyzed the effects. Our research sharesa similar motivation with those studies: we also seek a modelof the interaction and evolvement of social networks.
8. CONCLUSIONAs described in this paper, we have explained community
gravity, which is the bidirectional effect of trust and ratingboth theoretically and empirically, using data found on a vi-ral marketing site @cosme. We first described the model inSection 3. Numerous methods might be used to produce thefeatures used in the model. Therefore, we make trust predic-tion and rating prediction problems in Section 4. By solvingthe problems, we can identify good features that are usefulin the model. Community gravity is defined and measuredin Section 5; we show brands with strong CG values. Thecommunity gravity is also observed by investigating productpropagation networks, where a product with high CG valuecan be diffused easily through the network. Depending onthe product, this bidirectional effect can be large, result-ing in highly clustered user groups. It can be considered asbrand strength from a user-interaction perspective.
Although our model is evaluated only for a couple ofdatasets, the bidirectional interaction is apparently an es-sential model for many other online social communities. Byidentifying communities with high community gravity, fu-ture investigations can show how to cultivate strong com-munities on the Web and how system design and interactiondesign should be done.
AcknowledgmentsWe thank istyle Inc. for providing the dataset that we usedfor research purposes, in addition to invaluable advice anddiscussion.
9. REFERENCES[1] L. Adamic, J. Zhang, E. Bakshy, and M. Ackerman.
Knowledge sharing and yahoo answers: Everyoneknows something. In Proc. WWW2008, 2008.
[2] E. Adar, L. Zhang, L. Adamic, and R. Lukose.Implicit structure and the dynamics of blogspace. InWorkshop on the Weblogging Ecosystem, 2004.
[3] A. Anagnostopoulos, R. Kumar, and M. Mahdian.Influence and correlation in social networks. In Proc.KDD’08, 2008.
[4] N. Archak, A. Ghose, and P. Ipeirotis. Show me themoney! Deriving the pricing power of product featuresby mining consumer reviews. In Proc. KDD’07, 2007.
[5] S. Brown, A. Tilton, and D. Woodside. The case foron-line communities. The McKinsey Quarterly, 1,2002.
[6] C. Forman, A. Ghose, and B. Wiesenfeld. Examiningthe relationship between reviews and sales: The role ofreviewer identity disclosure in electronic markets.Information Systems Research, 2008.
[7] L. Getoor and C. P. Diehl. Link mining: A survey.SIGKDD Explorations, 2(7), 2005.
[8] J. Golbeck. Trust and nuanced profile similarity inonline social networks. Journal of ArtificialIntelligence Research, 2006.
[9] J. Golbeck and B. Parsia. Trust network-basedfiltering of aggregated claims. International Journal ofMetadata, Semantics and Ontologies, 2006.
[10] R. Guha, R. Kumar, P. Raghavan, and A. Tomkins.Propagation of trust and distrust. In Proc.WWW2004, 2004.
[11] J. Hartline, V. Mirrokni, and M. Sundararajan.Optimal marketing strategies over social networks. InProc. WWW2008, 2008.
[12] D. Kempe, J. Kleinberg, and E. Tardos. Maximizingthe spread of influence through a social network. InProc. KDD 2003, 2003.
[13] J. Leskovec, L. Adamic, and B. Huberman. Thedynamics of viral marketing. In Proc. ACMConference on Electronic Commerce, 2006.
[14] J. Leskovec, L. Backstrom, R. Kumar, andA. Tomkins. Microscopic evolution of social networks.In Proc. KDD’08, 2008.
[15] D. Liben-Nowell and J. Kleinberg. The link predictionproblem for social networks. In Proc. CIKM, pages556–559, 2003.
[16] C. Marlow. Investment and attention in the weblogcommunity. In Proc. HyperText 2006, 2006.
[17] J. McAlexander, J. Schouten, and F. Koenig. Buildingbrand community. Journal of Marketing, 66:38–54,2002.
[18] M. McPherson, L. Smith-Lovin, and J. Cook. Birds ofa feather: Homophily in social networks. AnnualReview of Sociology, (27):415–444, 2001.
[19] A. Muniz and T. O’Guinn. Brand community. Journalof Consumer Research, 27:412–432, 2001.
[20] M. Richardson and P. Domingos. Miningknowledge-sharing sites for viral marketing. In Proc.SIGKDD’02, 2002.
[21] P. Singla and M. Richardson. Yes, there is acorrelation – from social networks to personalbehavior on the web. In Proc. WWW2008, 2008.
[22] M. Subramani and B. Rajagopalan. Knowledgesharing and influence in online. social networks viaviral marketing. Communications of the ACM, pages300–307, 2003.
[23] V. Vapnik. The Nature of Statistical Learning Theory.Springer-Verlag, 1995.
[24] S. Wasserman and K. Faust. Social network analysis.Methods and Applications. Cambridge UniversityPress, Cambridge, 1994.
[25] C. Ziegler and J. Golbeck. Investigating correlations oftrust and interest similarity. Decision SupportServices, 2006.
WWW 2009 MADRID! Track: Social Networks and Web 2.0 / Session: Interactions in Social Communities
760