core.ac.uk · 1 the further description of the methodology of generational accounting is mainly...
TRANSCRIPT
econstor www.econstor.eu
Der Open-Access-Publikationsserver der ZBW – Leibniz-Informationszentrum WirtschaftThe Open Access Publication Server of the ZBW – Leibniz Information Centre for Economics
Standard-Nutzungsbedingungen:
Die Dokumente auf EconStor dürfen zu eigenen wissenschaftlichenZwecken und zum Privatgebrauch gespeichert und kopiert werden.
Sie dürfen die Dokumente nicht für öffentliche oder kommerzielleZwecke vervielfältigen, öffentlich ausstellen, öffentlich zugänglichmachen, vertreiben oder anderweitig nutzen.
Sofern die Verfasser die Dokumente unter Open-Content-Lizenzen(insbesondere CC-Lizenzen) zur Verfügung gestellt haben sollten,gelten abweichend von diesen Nutzungsbedingungen die in der dortgenannten Lizenz gewährten Nutzungsrechte.
Terms of use:
Documents in EconStor may be saved and copied for yourpersonal and scholarly purposes.
You are not to copy documents for public or commercialpurposes, to exhibit the documents publicly, to make thempublicly available on the internet, or to distribute or otherwiseuse the documents in public.
If the documents have been made available under an OpenContent Licence (especially Creative Commons Licences), youmay exercise further usage rights as specified in the indicatedlicence.
zbw Leibniz-Informationszentrum WirtschaftLeibniz Information Centre for Economics
Hagist, Christian; Raffelhüschen, Bernd; Risa, Alf Erling; Vårdal, Erling
Working Paper
Long-term fiscal effects of public pension reform inNorway: A generational accounting analysis
Diskussionsbeiträge / Forschungszentrum Generationenverträge der Albert-Ludwigs-Universität Freiburg, No. 49
Provided in Cooperation with:Research Center for Generational Contracts (FZG), University ofFreiburg
Suggested Citation: Hagist, Christian; Raffelhüschen, Bernd; Risa, Alf Erling; Vårdal, Erling(2011) : Long-term fiscal effects of public pension reform in Norway: A generational accountinganalysis, Diskussionsbeiträge / Forschungszentrum Generationenverträge der Albert-Ludwigs-Universität Freiburg, No. 49
This Version is available at:http://hdl.handle.net/10419/45788
DISKUSSIONSBEITRÄGE DISCUSSION PAPERS
Long-Term Fiscal Effects of Public Pension Reform in Norway – A Generational Accounting Analysis
de
r A
lbe
rt-L
ud
wig
s-U
niv
ers
itä
t F
reib
urg
Christian HagistBernd Raffelhüschen Alf Erling Risa Erling Vårdal No. 49 – März 2011

Long-Term Fiscal Effects of Public Pension Reform in
Norway – A Generational Accounting Analysis *
Christian Hagist
Bernd Raffelhüschen
Research Center for Generational Contracts, Freiburg University (Germany)
and Alf Erling Risa Erling Vårdal
University of Bergen (Norway)
August 2010 Revised: March 2011
Abstract Generational Accounts (GAs) measure the fiscal sustainability of the public sector. We ask whether the contributions from the Government Pension Fund and remaining oil and gas wealth in the ground, together with the pension reform taking effect in 2011, are sufficiently large to secure generational balance in Norway. Our results show that the pension reform has a substantial effect, and contributes as much to generational balance as the total petroleum wealth. Neither increased economic growth per se nor increased fertility contribute to improve the GAs. The structural characteristics of higher employment and lower transfer payments typical for cyclical upturns, improve the GAs substantially. Optimistic assumptions regarding these structural characteristics do not remove the need for further reforms to obtain fiscal sustainability of the Norwegian public sector. Generational Accounting, Norway, Fiscal Policy, Intergenerational redistribution JEL Classification: H50, J10
* Corresponding author: Christian Hagist, Forschungszentrum Generationenverträge (Research Center for Generational Contracts), Universität Freiburg (Freiburg University), D-79085 Freiburg, Germany (Fax +49-761-203-2290, [email protected]). We would like to thank Astrid Grasdal, Yngvar Dyvi, Erling Holmøy, Pål Knudsen, Stefan Moog, Christoph Müller, Vibeke Nielsen, Bjørn Sandvik and participants of the Statistics Norway Research Seminar for valuable comments. All errors remain our own.
1. Introduction
In an almost twenty year old study, Auerbach et al. (1993) asked the question: “Norway: Is
the nation over-consuming its petroleum wealth?” They analyzed this question with the
method of Generational Accounting and their answer was: yes, Norway did over-consume.
This result was partly confirmed in a later study by Steigum (1996). In this paper we first
examine whether the Auerbach-conclusion still holds. There are indications that it does.
Foremost, Norway has experienced a significant rise in life expectancy at birth from 77.3 to
80.7 years. In addition, the share of the younger part of the population that are not working
has increased. However, net migration has increased over the period. Many of the
immigrants are relatively young and well educated, alleviating long-term fiscal challenges.
Furthermore, since 2000 oil prices have risen sharply, and the petroleum wealth has
increased accordingly.
Instead of consuming the petroleum wealth right away, the Norwegian Parliament
has chosen a fiscal rule to inject the Petroleum wealth into the economy along a moderate
path. It has been a stated policy objective to pursue moderation in the sense that the
petroleum wealth should be perpetuated to benefit all future generations. The newly
enacted pension reform is a major political effort to bolster such a policy of
intergenerational distribution of the petroleum wealth. The second purpose of this paper is
to inquire whether this reform secures such an aim.
The pension reform is to take effect from 2011. It seeks to neutralize the
expenditure effect due to population ageing in general, and to the recent increased growth
in life expectancy. The reform strengthens ties between former earnings, retirement
decisions, and pension benefits, thus providing work incentives particularly for elderly
workers.
As in the Auerbach et al. (1993) paper, our evaluation tool is Generational
Accounting. This method was introduced during the early nineties to estimate both explicit
and implicit public debt in the long run. In Section 2 we describe the method of
Generational Accounting and the calculation of the sustainability indicators used. The
sources of data used for these calculations are reported in Section 3. Generational
Accounting needs three kinds of data; a population projection, age- and sex-specific
profiles and a general government budget of a certain base-year. Furthermore, we discuss
in Section 3 our choice for global parameters (growth and discount rates) and the influence
of the public oil-revenues on the general budget. In Section 4 we provide the results of the
1
Generational Accounting analyses using different kinds of sustainability indicators.
Furthermore, we illustrate the findings of the sensitivity analyses, wherein we analyze the
effects of different population scenarios and the choice of several parameters. In Section 5
the current Pension Reform is analyzed, and Section 6 concludes.
2. The Methodology of Generational Accounting
To measure the sustainability of a country’s public sector we use the method of
Generational Accounting developed by Auerbach, Gokhale and Kotlikoff (1991, 1992 and
1994). In contrast to traditional budget indicators which are based on annual cash flow
budgets, Generational Accounting is founded on the intertemporal budget constraint and
therefore the long-term implications of a current policy can be computed.1 The
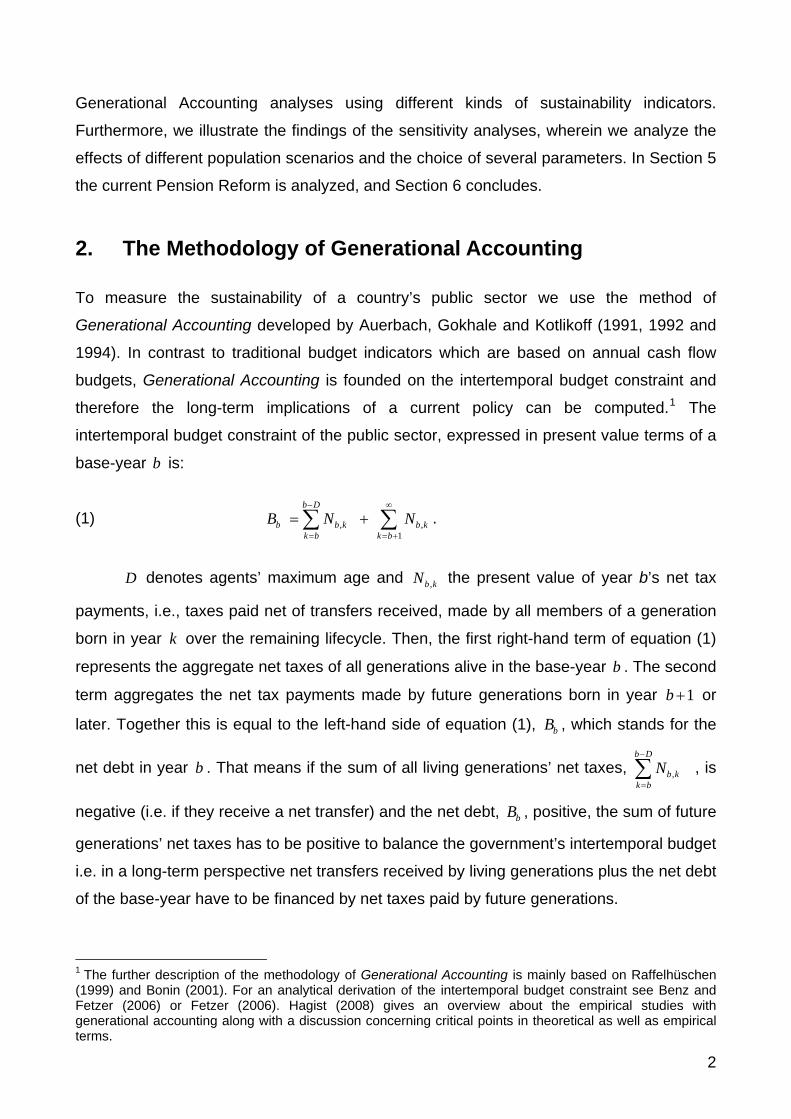
intertemporal budget constraint of the public sector, expressed in present value terms of a
base-year b is:
(1) , ,1
b D
b b kk b k b
b kB N N− ∞
= = +
= +∑ ∑ .
D denotes agents’ maximum age and the present value of year b’s net tax
payments, i.e., taxes paid net of transfers received, made by all members of a generation
born in year over the remaining lifecycle. Then, the first right-hand term of equation (1)
represents the aggregate net taxes of all generations alive in the base-year b . The second
term aggregates the net tax payments made by future generations born in year
,b kN
k
1b + or
later. Together this is equal to the left-hand side of equation (1), , which stands for the
net debt in year b . That means if the sum of all living generations’ net taxes, , is
negative (i.e. if they receive a net transfer) and the net debt, , positive, the sum of future
generations’ net taxes has to be positive to balance the government’s intertemporal budget
i.e. in a long-term perspective net transfers received by living generations plus the net debt
of the base-year have to be financed by net taxes paid by future generations.
bB
,b kNb D
k b
−
=∑
bB
1 The further description of the methodology of Generational Accounting is mainly based on Raffelhüschen (1999) and Bonin (2001). For an analytical derivation of the intertemporal budget constraint see Benz and Fetzer (2006) or Fetzer (2006). Hagist (2008) gives an overview about the empirical studies with generational accounting along with a discussion concerning critical points in theoretical as well as empirical terms.
2
To calculate generations’ aggregated lifecycle net tax payments, the net payment
terms in equation (1) are decomposed into:
(2) . ( )}{
, , ,max ,
1k D
b sb k s k s k
s b k
N T P+
−
=
= +∑ r
,
In equation (2), denotes the average net tax paid in year by a representative
member of the generation born in year , whereas stands for the number of members
of a generation born in year who survives until year . To compute the remaining
lifetime net payments of living generations, the future demographic structure is specified
conducting long-term population forecasts.
ksT , s
k ksP ,
k s
Typically, Generational Accountants disaggregate equation (2) even further. To
incorporate gender-specific differences in average tax payments and transfer receipts by
age, separate aggregation of the average net taxes paid by male and female cohort
members is required. The products aggregated in equation (2) represent the net taxes
paid by all members of generation k in year . For generations born prior to the base-year
the summation starts from year b, while for future born cohorts, the summation starts in
year . Irrespective of the year of birth, all payments are discounted back to the base-
year b by application of a real interest rate .
s
k b>
r
The age-specific net tax payment in year of agents born in year can be
decomposed as
s k
(3) , ,s k s k ii
T h= ∑ .
iksh ,, stands for the average tax or transfer of type i paid or received in year by
agents born in year , thus of age
s
k s k− .2 In equation (3), indicates a tax payment,
whereas defines a transfer.
0h >
0<h
Applying the method of Generational Accounting it is conventionally assumed that
initial fiscal policy and economic behavior are constant over time. Under this condition it is
possible to project future average tax payments and transfer receipts per capita from the
base-year age profile of payments according to
2 In case of an isolated analysis of public subsystems like health care or public pension as conducted in the following chapters, i is just chosen so that all relevant payment streams are included in the analysis.
3
(4) ( ) ( ), , , ,1 s b
s k i b b s k ih h g −
− −= + .
where g represents the annual rate of productivity growth. Equation (4) assigns to each
agent of age s-k in year s the tax and transfer payment observed for agents of the same
age in base-year b, uprated for gains in productivity. The base-year cross section of age-
specific tax and transfer payments per capita is generally determined in two steps. First,
the relative position of age cohorts between themselves in the tax and transfer system is
estimated from micro-data profiles. In a second step the relative age profiles are re-
evaluated proportionally to fit the expenditure and tax revenues of the base-year.
For living and future generations, division of the aggregate remaining lifetime net tax
payments by the number of cohort members alive in year s defines the cohort’s
Generational Account in year s:
(5) ,,
,
s ks k
s k
NGA
P= .
Generational Accounts are constructed in a purely forward-looking manner, only the
taxes paid and the transfers received in or after the base-year are considered. As a
consequence, Generational Accounts cannot be compared across living generations
because they incorporate effects of differential lifetime. One may compare, however, the
Generational Accounts of base-year and future born agents, who are observed over their
entire lifecycle.
To illustrate the fiscal burden of current fiscal policy we use seven sustainability
indicators:3 The starting point for the first indicators are the intertemporal public liabilities
which can be computed by the assumption that the intertemporal budget constraint of the
public sector (1) is violated:
(6) ,b bk b D
b kIPL B N∞
= −
= − ∑ .
The amount of intertemporal public liabilities measures aggregate unfunded claims
on future budgets, assuming that the present policy will hold for the future. The first
sustainability indicator, the fiscal gap ( ), can be derived if the intertemporal public bFG
3 For a discussion of measuring fiscal sustainability and the development of sustainability indicators, see Raffelhüschen (1999) and Benz and Fetzer (2006).
4
liabilities are set in relation to base-year’s GDP ( ). This indicator is akin to the debt
quota well known since the Maastricht treaty but it addresses the total debt, i.e. the debt
which will occur in the future added to the debt inherited from the past:
bGDP
(7) bb
b
IPLFGGDP
= .
How the policy adjustment required to redeem intertemporal public liabilities will
affect generations’ fiscal burdens is uncertain. For illustrative purposes, Generational
Accounting typically assigns the entire adjustment to future generations which is
equivalent to k > b. All tax payments made by members of future born cohorts are
adjusted proportionally with the help of a uniform scaling factor θ . The factor θ is set to
ensure balance of the intertemporal public budget defined in equation (1):
((8) ( ) ), , , ,1 s b
s k i b b s kh hθ g
i
−
− −= × +
for and instead of equation (4). Computing the average age-specific net taxes paid by
representative future born agents, the burden for future generations can be illustrated as
an absolute difference between the Generational Account of the base-year agent and the
Generational Account of the one year after base-year born agent. This is our second
sustainability indicator, the future generations’ burden:
(9) , ,b b b bFGB GA GA +
θ= − 1
The third indicator that illustrates the burden of current fiscal policy is the revenue
gap. In this case the scaling factor revθ θ= reflects the enhancement of age-specific
revenues in per cent for all generations which is necessary to close the intertemporal
public budget constraint. It can also be interpreted as the ratio of the intertemporal public
liabilities to the present value of all age-specific revenues of the fiscal system :
(10) ( )
1Re(1 )
brev
s s bs b
IPL
vr
θ ∝
−=
=⋅
+∑
with Re sv referring to the sum of revenues in year by all living generations in year .
Analogous to the revenue gap, we compute also the so-called transfer gap. In this case
s s
5
the scaling factor trfθ θ= reflects the necessary decrement of age-specific public
transfers (Trf) like health benefits in per cent for all generations that is necessary to close
the intertemporal public budget constraint. Constructing the revenue and transfer gap, we
implicitly assume that the government is able to enforce an immediate adjustment of all
taxes and contributions or transfers respectively.
All used indicators are defined using an infinite time horizon. In the practical
calculation all relevant variables like population or cohorts’ tax payments are projected for
300 years from the base-year on. Afterwards a geometrical serial is used to determine the
remaining net tax payments. The choice of 300 periods is nearly completely arbitrary and
just reflects a good approximation point for our analysis.
3. Data and Assumptions
To compute Generational Accounts and to calculate the described indicators, a population
projection is needed. Furthermore the calculations require the expenditures and revenues
of the Norwegian public sector in 2009, age-sex-profiles for the different expenditure and
revenue types and a growth rate of the productivity as well as a discount rate. The
population projection in the following is calculated with a demographic program developed
by Bonin (2001).
3.1 Population Projection
Generational Accounting requires detailed population projections, which distinguish
between three possible scenarios titled medium variant, high variant and low variant.
Based on different assumptions about the three parameters life expectancy, fertility and
migration it is possible to derive a population projection for each of the demographic
scenarios. Own calculations are necessary for the reason of Generational Accounting’s
assumed infinite time horizon: The official projections end in 2060 while we need a 300
years projection period. In these calculations we use for the parameters of the year 2009
the given data of Statistics Norway. The projected parameters until year 2060 in the
different scenarios originate from the assumptions made by Statistics Norway (2010a).
Table 1 shows those central assumptions of the three scenarios.
6
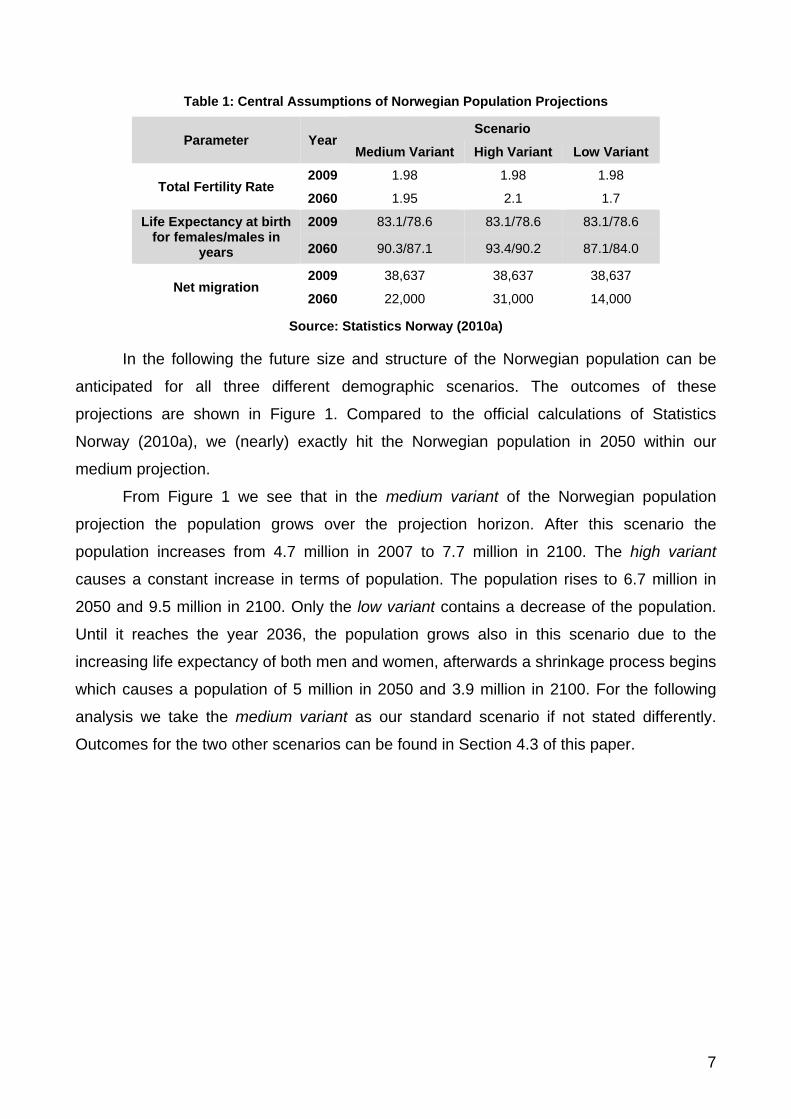
Table 1: Central Assumptions of Norwegian Population Projections
Parameter Year Scenario
Medium Variant High Variant Low Variant
Total Fertility Rate 2009 1.98 1.98 1.98
2060 1.95 2.1 1.7
Life Expectancy at birth for females/males in
years
2009 83.1/78.6 83.1/78.6 83.1/78.6
2060 90.3/87.1 93.4/90.2 87.1/84.0
Net migration 2009 38,637 38,637 38,637
2060 22,000 31,000 14,000
Source: Statistics Norway (2010a)
In the following the future size and structure of the Norwegian population can be
anticipated for all three different demographic scenarios. The outcomes of these
projections are shown in Figure 1. Compared to the official calculations of Statistics
Norway (2010a), we (nearly) exactly hit the Norwegian population in 2050 within our
medium projection.
From Figure 1 we see that in the medium variant of the Norwegian population
projection the population grows over the projection horizon. After this scenario the
population increases from 4.7 million in 2007 to 7.7 million in 2100. The high variant
causes a constant increase in terms of population. The population rises to 6.7 million in
2050 and 9.5 million in 2100. Only the low variant contains a decrease of the population.
Until it reaches the year 2036, the population grows also in this scenario due to the
increasing life expectancy of both men and women, afterwards a shrinkage process begins
which causes a population of 5 million in 2050 and 3.9 million in 2100. For the following
analysis we take the medium variant as our standard scenario if not stated differently.
Outcomes for the two other scenarios can be found in Section 4.3 of this paper.
7
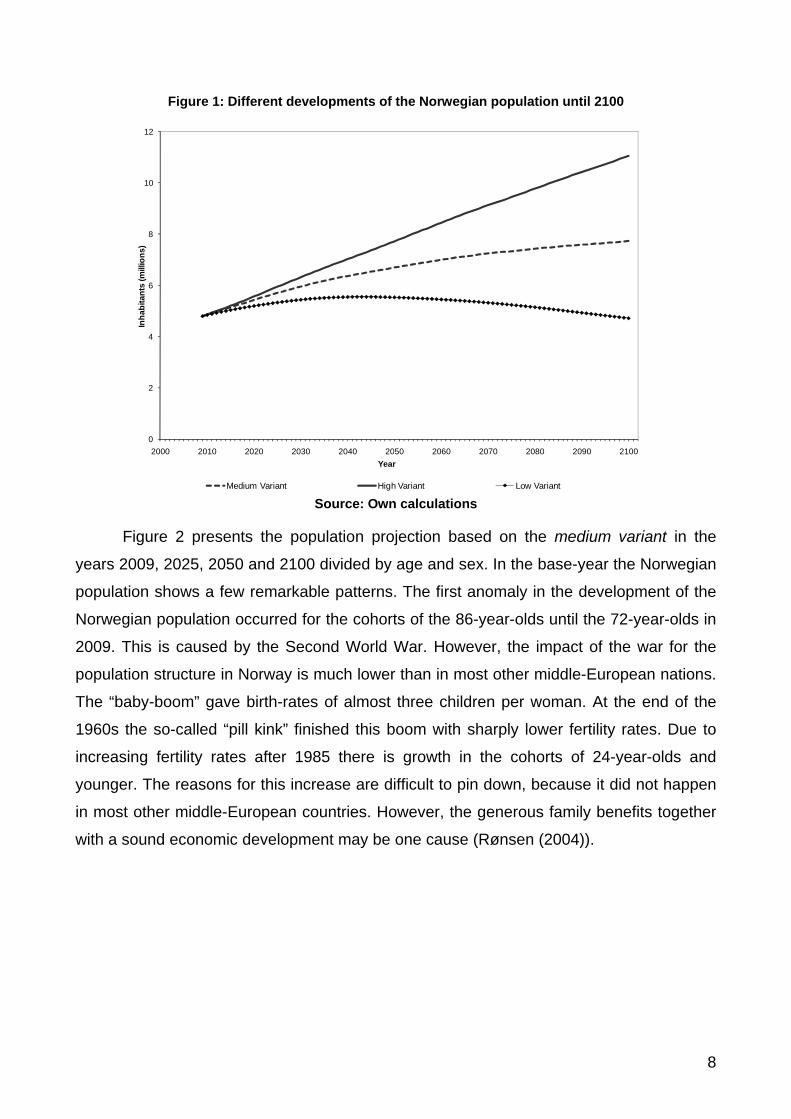
Figure 1: Different developments of the Norwegian population until 2100
Source: Own calculations
0
2
4
6
8
10
12
2000 2010 2020 2030 2040 2050 2060 2070 2080 2090 2100
Inha
bita
nts
(mill
ions
)
Year
Medium Variant High Variant Low Variant
Figure 2 presents the population projection based on the medium variant in the
years 2009, 2025, 2050 and 2100 divided by age and sex. In the base-year the Norwegian
population shows a few remarkable patterns. The first anomaly in the development of the
Norwegian population occurred for the cohorts of the 86-year-olds until the 72-year-olds in
2009. This is caused by the Second World War. However, the impact of the war for the
population structure in Norway is much lower than in most other middle-European nations.
The “baby-boom” gave birth-rates of almost three children per woman. At the end of the
1960s the so-called “pill kink” finished this boom with sharply lower fertility rates. Due to
increasing fertility rates after 1985 there is growth in the cohorts of 24-year-olds and
younger. The reasons for this increase are difficult to pin down, because it did not happen
in most other middle-European countries. However, the generous family benefits together
with a sound economic development may be one cause (Rønsen (2004)).
8
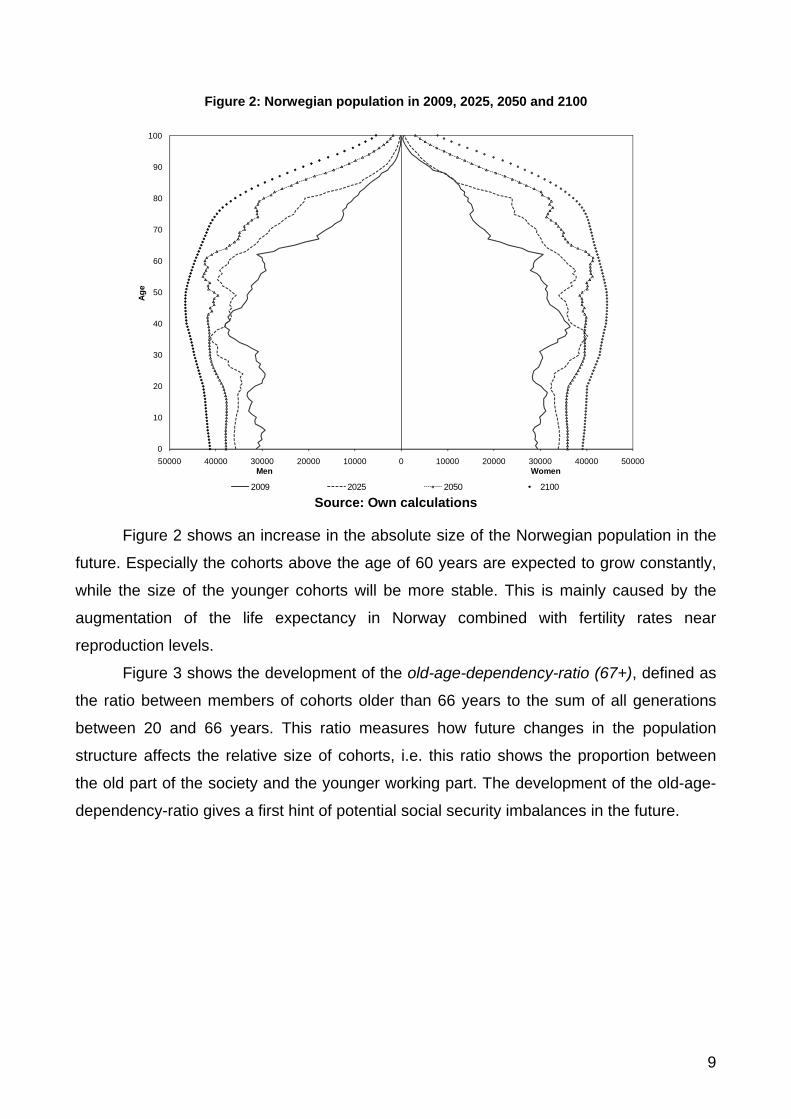
Figure 2: Norwegian population in 2009, 2025, 2050 and 2100
Source: Own calculations
0
10
20
30
40
50
60
70
80
90
100
50000 40000 30000 20000 10000 0 10000 20000 30000 40000 50000
Age
Men Women
2009 2025 2050 2100
Figure 2 shows an increase in the absolute size of the Norwegian population in the
future. Especially the cohorts above the age of 60 years are expected to grow constantly,
while the size of the younger cohorts will be more stable. This is mainly caused by the
augmentation of the life expectancy in Norway combined with fertility rates near
reproduction levels.
Figure 3 shows the development of the old-age-dependency-ratio (67+), defined as
the ratio between members of cohorts older than 66 years to the sum of all generations
between 20 and 66 years. This ratio measures how future changes in the population
structure affects the relative size of cohorts, i.e. this ratio shows the proportion between
the old part of the society and the younger working part. The development of the old-age-
dependency-ratio gives a first hint of potential social security imbalances in the future.
9

Figure 3: Development of the old-age-dependency-ratio until 2100 in Norway
Source: Own calculations
20%
25%
30%
35%
40%
45%
50%
55%
2000 2010 2020 2030 2040 2050 2060 2070 2080 2090 2100
Old
-age
-dep
ende
ncy-
ratio
(67
+)
Year
Medium Variant High Variant Low Variant
3.2 Public Sector Finances and Petroleum Revenues
The budget of the Norwegian general government, which is shown in Table 2 based on
Statistics Norway (2010b) is characterized by a few remarkable patterns. The aggregates
for revenues and expenditures which are discussed in the following are taken from
Statistics Norway (2010b). Revenues include taxes on labor and capital incomes, value
added tax, property tax and social insurance contributions. The largest part on the
revenue-side of the Norwegian budget is given by the earnings out of the oil resources of
the country. The public expenditures contain expenses for general public services,
defense, public order and safety, economic affairs, and environmental protection, housing
and cultural activities which are aggregated in the budget item “Governmental
Consumption”. The aggregate health expenditures on the one hand is divided into four
different subcategories according to Statistics Norway (2010c). The entry disability and
sickness (in the original budget of Statistics Norway (2010b)) on the other hand is divided
into again four subcategories after Ministry of Finance (2008) such as disability pensions,
sickness benefits, vocational training and the early retirement scheme AFP.
10

Table 2: Public expenditures and revenues of the Norwegian General Government in 2009
Public Expenditure (Billion NOK) Public Revenues (Billion NOK) Government Consumption 297.7 Non-Oil Property Income 101.7
Oil related expenditures 16.2 Dividend GPF 74.9
Interest Payments 34.0 Property Income from Oil 98.3
Outpatient Medical Care 40.7 VAT 187.0
Inpatient Medical Care 64.4 Customs duties 2.4
Pharmaceuticals 22.6 Indirect Taxes on Oil 3.7
Health Administration 5.3 Alcohol Tax 11.3
Long-Term-Care 49.4 Tobacco Tax 8.1
Primary Education 59.7 Gas and Pollution Tax 53.9
Secondary Education 29.6 Real estate tax 6.5
Tertiary Education 36.3 Other indirect taxes 12.3
General Education Expenditures 16.7 Social Security Contributions 234.6
Old Age Pension 131.6 Income Tax without petrol 305.3
Survivor Benefits 6.1 Income Tax on petrol activities 149.0
Early Retirement Scheme (AFP) 12.7 Motorvehicle Tax 6.9
Disability Benefits 92.3 Other income 75.7
Sickness Benefits 23.97
Vocational Training 30.2
Family Benefits 84.9
Unemployment Benefits 10.8
Housing 2.7
Social Welfare 31.1
Total Expenditures 1098.6
Surplus 232.9
SUM 1331.5 SUM 1331.5
Source: Own calculations based on Statistics Norway (2010b,c)
Public coffers in Norway are remarkable compared to other OECD countries. In
2009 Norway was blessed with a primary surplus of 232.9 billion NOK, nearly a fourth of
what the public sector spends. Four budget items should be highlighted concerning this
number. Norway pays 34.0 billion NOK on interest for its public debt of 59.2% of GDP in
2009 while receiving 74.9 billion NOK in interest and dividends from the Government
Pension Fund (GPF). These figures show that the Norwegian governmental sector has a
booking net wealth. Furthermore, oil revenues either from taxes or dividends contributed a
total of 251.0 billion NOK. However, petroleum revenues will not be sustainable in the
future. According to official prognoses of the OECD (2007) revenues will shrink to 0.4% of
their 2005 level until 2060, taking into account price as well as output effects. Figure 4
11
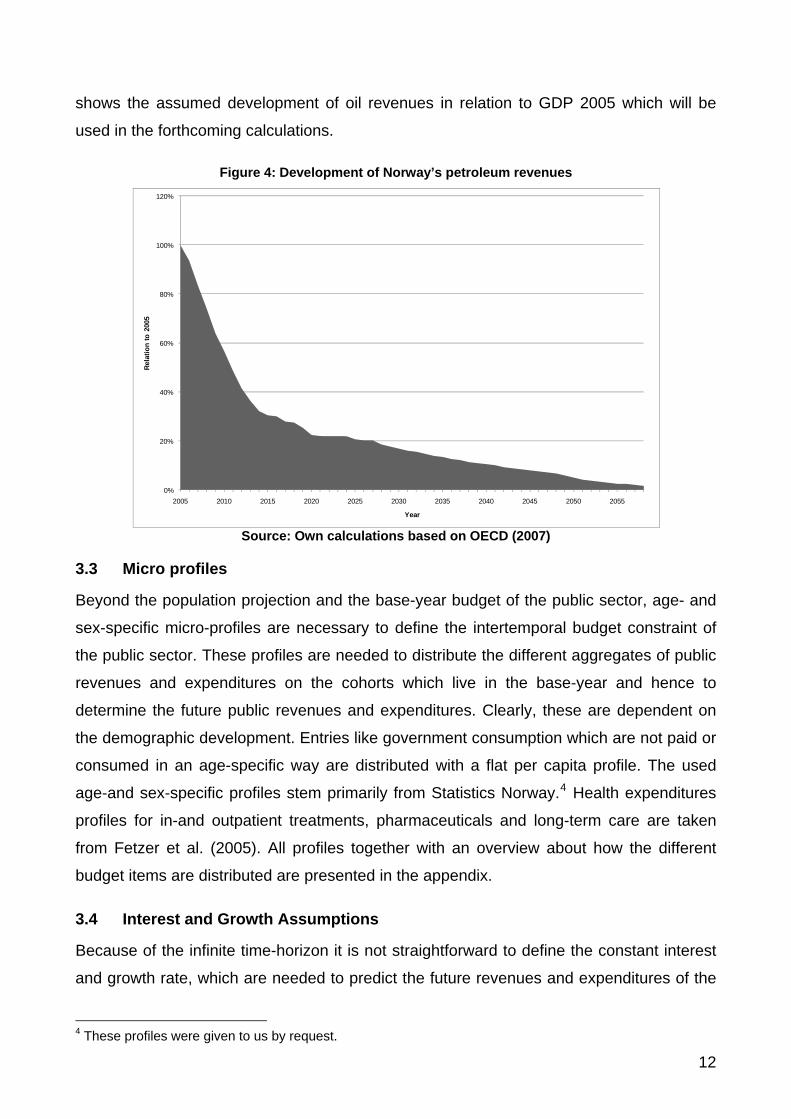
shows the assumed development of oil revenues in relation to GDP 2005 which will be
used in the forthcoming calculations.
Figure 4: Development of Norway’s petroleum revenues
Source: Own calculations based on OECD (2007)
0%
20%
40%
60%
80%
100%
120%
2005 2010 2015 2020 2025 2030 2035 2040 2045 2050 2055
Rela
tion
to 2
005
Year
3.3 Micro profiles
Beyond the population projection and the base-year budget of the public sector, age- and
sex-specific micro-profiles are necessary to define the intertemporal budget constraint of
the public sector. These profiles are needed to distribute the different aggregates of public
revenues and expenditures on the cohorts which live in the base-year and hence to
determine the future public revenues and expenditures. Clearly, these are dependent on
the demographic development. Entries like government consumption which are not paid or
consumed in an age-specific way are distributed with a flat per capita profile. The used
age-and sex-specific profiles stem primarily from Statistics Norway.4 Health expenditures
profiles for in-and outpatient treatments, pharmaceuticals and long-term care are taken
from Fetzer et al. (2005). All profiles together with an overview about how the different
budget items are distributed are presented in the appendix.
3.4 Interest and Growth Assumptions
Because of the infinite time-horizon it is not straightforward to define the constant interest
and growth rate, which are needed to predict the future revenues and expenditures of the
4 These profiles were given to us by request.
12

public sector and to analyze the sustainability of this system. Norway’s government
assumes for its calculation of the present value of the GPF a standardized growth rate (g)
of 1.5% and a discount rate (r) of 3.0% which we apply in our standard scenario with one
exception, i.e. oil revenues (see above).
4. The sustainability of Norway’s fiscal system
As described above, the Norwegian state is in the comfortable situation to have an explicit
budget surplus at present. But this is mainly caused by the high oil revenues of the public
sector and it is unrealistic to assume that this will be constant in the future. Furthermore,
an expanding number of retirees is expected. These are entitled to benefits in the public
pension system and they will receive a major part of the public health care transfers.
Public pensions as well as public health care transfers are therefore expected to increase.
The financial consequences of the described revenue-effect and the ageing-effect can be
calculated by the method of Generational Accounting. The results of these calculations are
shown in the following.
4.1 Generational Accounts
Figure 5 presents the Generational Accounts of Norwegians by gender in our base year,
2009, according to our standard scenario (medium variant, g=1.5%, r=3%). The sinus-
shaped pattern is very common in OECD countries with strong pay-as-you-go systems.
The young between 16 and 33 years finance the elderly generations from 34 years and
older. Generational Accounts on average begin with minus 1,318,920 NOK for the present
newborn and are at a maximum of 538,389 NOK paid by the representative 22 years old.
This means that a 22 years old Norwegian (nearly half male/female) pays 538,389 NOK
more in taxes and contributions over his/her remaining life-cycle than he/she will receive in
transfers and subsidies from the Norwegian general government. This includes assigned
oil revenues which are distributed evenly by (living) capita each year. The generation of 34
years is the first one which receives more than he/she pays in taxes over his/her remaining
life-cycle. However, one should keep in mind that Generational Accounting is strict forward
looking so living generations’ accounts are not comparable. The major receiver is the
generation of 65 years olds because after 65 years discounting lowers the Generational
Accounts significantly. This pattern can generally be observed in many developed
countries.
13
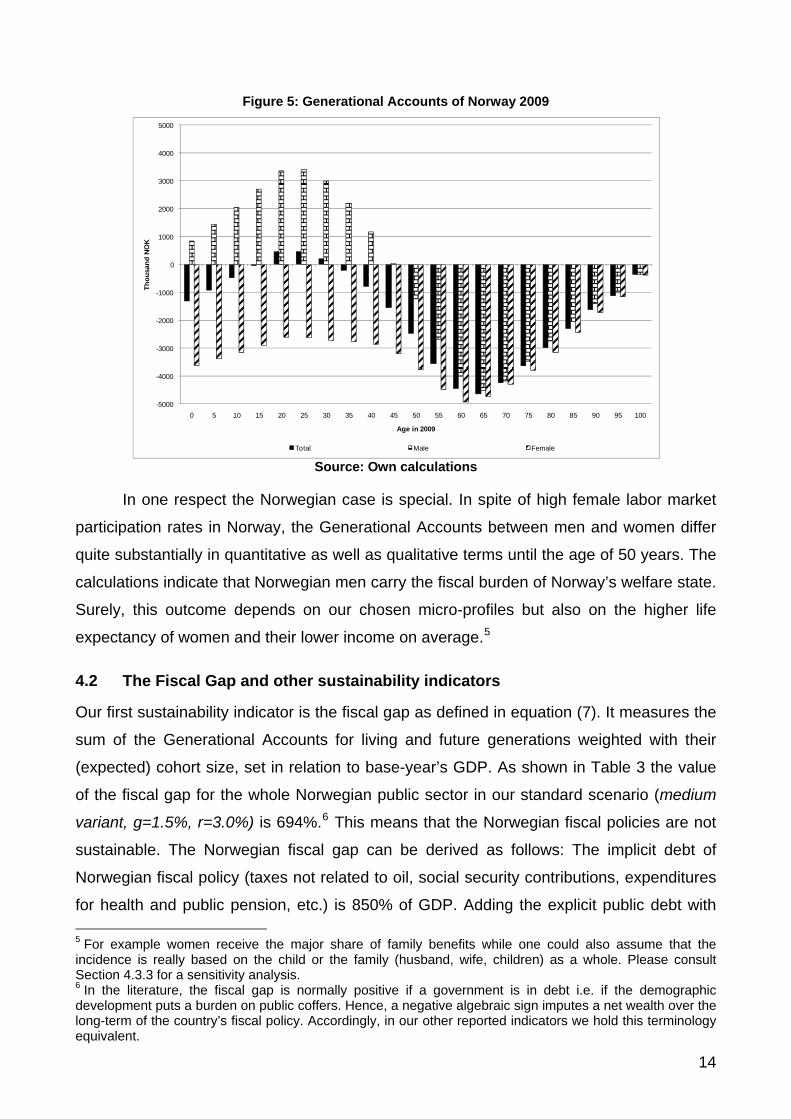
Figure 5: Generational Accounts of Norway 2009
Source: Own calculations
-5000
-4000
-3000
-2000
-1000
0
1000
2000
3000
4000
5000
0 5 10 15 20 25 30 35 40 45 50 55 60 65 70 75 80 85 90 95 100
Thou
sand
NO
K
Age in 2009
Total Male Female
In one respect the Norwegian case is special. In spite of high female labor market
participation rates in Norway, the Generational Accounts between men and women differ
quite substantially in quantitative as well as qualitative terms until the age of 50 years. The
calculations indicate that Norwegian men carry the fiscal burden of Norway’s welfare state.
Surely, this outcome depends on our chosen micro-profiles but also on the higher life
expectancy of women and their lower income on average.5
4.2 The Fiscal Gap and other sustainability indicators
Our first sustainability indicator is the fiscal gap as defined in equation (7). It measures the
sum of the Generational Accounts for living and future generations weighted with their
(expected) cohort size, set in relation to base-year’s GDP. As shown in Table 3 the value
of the fiscal gap for the whole Norwegian public sector in our standard scenario (medium
variant, g=1.5%, r=3.0%) is 694%.6 This means that the Norwegian fiscal policies are not
sustainable. The Norwegian fiscal gap can be derived as follows: The implicit debt of
Norwegian fiscal policy (taxes not related to oil, social security contributions, expenditures
for health and public pension, etc.) is 850% of GDP. Adding the explicit public debt with 5 For example women receive the major share of family benefits while one could also assume that the incidence is really based on the child or the family (husband, wife, children) as a whole. Please consult Section 4.3.3 for a sensitivity analysis. 6 In the literature, the fiscal gap is normally positive if a government is in debt i.e. if the demographic development puts a burden on public coffers. Hence, a negative algebraic sign imputes a net wealth over the long-term of the country’s fiscal policy. Accordingly, in our other reported indicators we hold this terminology equivalent.
14

59% of GDP in 2009 results in a gross debt of 909% of GDP. One has to subtract from this
amount the assets of the GPF worth 95% of GDP in 2009 and the present value of
petroleum related future revenues which amount to 121%.
Table 3: Overview of components of the fiscal gap and other sustainability indicators 2009 (Population Scenario Medium Variant, g=1.5%, r=3.0%)
Sustainability Indicators Public Sector
in %
of G
DP
of
2009
Implicit Debt 850
Explicit Debt in 2009 59
Petroleum Wealth -121
Fund Assets in 2009 -95
Fiscal Gap 694
Future Generations’ Burden (in
NOK) 2,831,500
in %
Revenue Gap 17.0 Transfer Gap 14.4
Source: Own calculations
Our second indicator is the future generations’ burden. To calculate this indicator,
the intertemporal public liabilities and the number of people in future generations are set in
proportion to each other (equation 9). This indicator implies that the entire adjustment is
borne by future generations. The burden for future generations can be illustrated as an
absolute difference between the generational account of the base-year and the
generational account of the one year after base-year born agent. The future born
generation in Norway would have to pay about 1,500,000 NOK per person more in taxes
over their entire life-cycle than they would receive in transfers. On the other hand, the
base-year born agent gets a net-transfer over his/her remaining life cycle of about
1,300,000 NOK. Therefore, the future born agent has to carry a high burden compared to
the corresponding living generation. This is also reflected in our last two sustainability
indicators, the revenue and transfer gap. Norway’s government would have to raise all
taxes (except those on petroleum activities) by 17.0% or could decrease all transfers by
14.4%.
4.3 Sensitivity analysis
We now turn to robustness checks where we relax assumptions regarding choice of base
year, discounting, economic and population growth, and the constant fiscal policy
15
assumption. While unusual in generational accounting exercises, the latter sensitivity
analysis is natural since the Norwegian parliament has already passed legislation on a
pension reform taking effect in 2011. We return to this issue in Chapter 5.
4.3.1 The fiscal gap over time
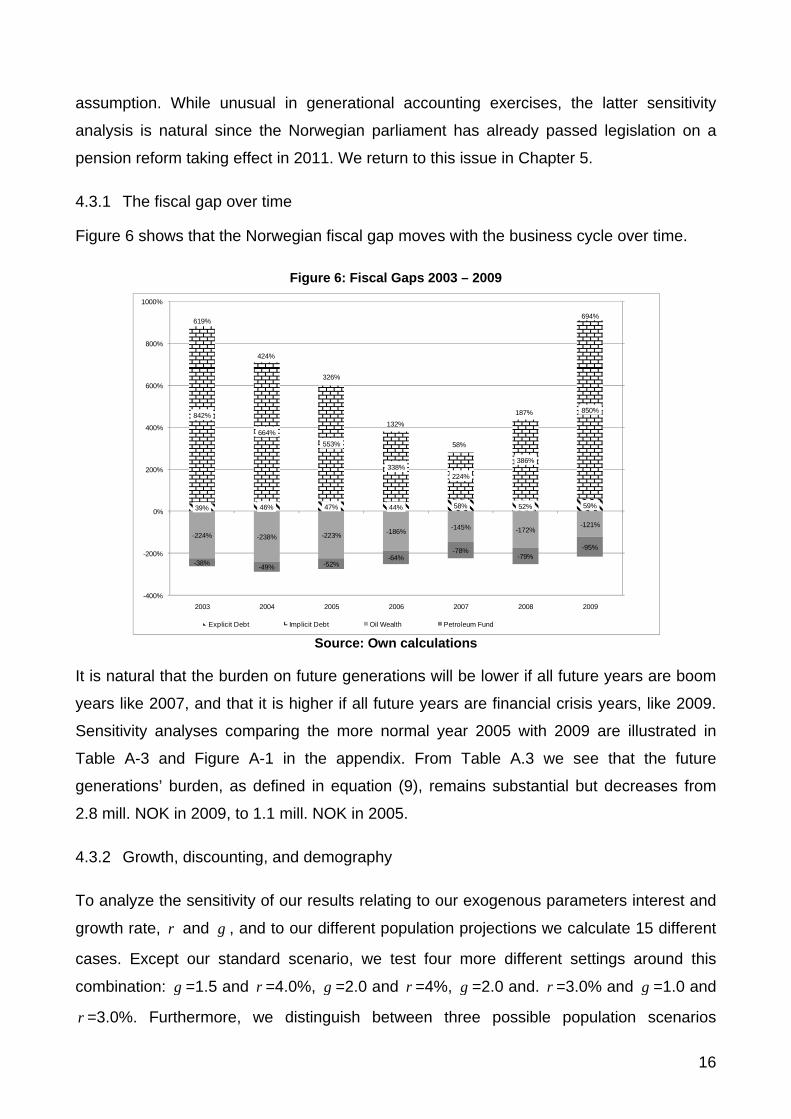
Figure 6 shows that the Norwegian fiscal gap moves with the business cycle over time.
Figure 6: Fiscal Gaps 2003 – 2009
Source: Own calculations
39% 46% 47% 44% 58% 52% 59%
842%
664%553%
338%224%
386%
850%
-224% -238% -223% -186% -145% -172%-121%
-38% -49% -52%-64%
-78%-79%
-95%
619%
424%
326%
132%
58%
187%
694%
-400%
-200%
0%
200%
400%
600%
800%
1000%
-400%
-200%
0%
200%
400%
600%
800%
1000%
2003 2004 2005 2006 2007 2008 2009
Explicit Debt Implicit Debt Oil Wealth Petroleum Fund Sustainability Gap
It is natural that the burden on future generations will be lower if all future years are boom
years like 2007, and that it is higher if all future years are financial crisis years, like 2009.
Sensitivity analyses comparing the more normal year 2005 with 2009 are illustrated in
Table A-3 and Figure A-1 in the appendix. From Table A.3 we see that the future
generations’ burden, as defined in equation (9), remains substantial but decreases from
2.8 mill. NOK in 2009, to 1.1 mill. NOK in 2005.
4.3.2 Growth, discounting, and demography
To analyze the sensitivity of our results relating to our exogenous parameters interest and
growth rate, and r g , and to our different population projections we calculate 15 different
cases. Except our standard scenario, we test four more different settings around this
combination: g =1.5 and =4.0%, r g =2.0 and =4%, r g =2.0 and. =3.0% and r g =1.0 and
=3.0%. Furthermore, we distinguish between three possible population scenarios r
16

medium, high and low variant, as discussed above. Table 4 shows the sustainability gap
for all possible population scenarios combined with the described growth and interest rate
settings.
Table 4: Sensitivity Analysis of the Fiscal Gap (in % of GDP of 2009)
Medium Variant High Variant Low Variant g=1.5% r=4.0% 250.1 375.9 146.8
g=2.0% r=4.0% 423.9 648.3 251.1
g=1.5% r=3.0% 693.8 1126.5 389.0
g=2.0% r=3.0% 1381.7 2465.3 703.3
g=1.0% r=3.0% 387.1 599.4 223.8
Source: Own calculations
The basic interpretation of the results in Table 4 is straightforward. Increasing
interest rates discounts future public liabilities more heavily, giving them lower weight, and
thus reducing the present value of future generations’ burden, and the fiscal gap.
Increasing economic growth will increase both taxes and transfers. However, the
generational account of a newborn is negative, indicating that transfers have a larger
share of the expanding economy than taxes. Expanding the economic base through
economic growth will therefore exacerbate the fiscal gap in the absence of policy changes
to increase taxes relative to transfers.
The demographic profiles depend on migration, longevity, and fertility. Detailed
impacts of migration lies outside the scope of the present analysis. Increased longevity
clearly increases the fiscal gap through the need for higher transfers. Sometimes it is
argued as if intergenerational economic imbalances can be alleviated through higher
fertility rates. Again it turns out that when newborns have negative generational accounts,
burdens on future generations increase with higher fertility. This effect is counteracted for
a country with high explicit debt, since the explicit debt can be shared on a larger
population. The Norwegian situation is different. The petroleum-wealth of the country
implies that the smaller the future population is, the higher is the petroleum-wealth per
person, and therefore the lower is the future burden per person.
17

4.3.2 Growth, discounting, and demography
A complete sensitivity analysis concerning our incidence assumptions (via the micro-
profiles) is not possible even given the good Norwegian data available.
Figure 7: Generational Accounts with different scenarios concerning family benefits
Source: Own calculations
-5000
-4000
-3000
-2000
-1000
0
1000
2000
3000
4000
5000
0 5 10 15 20 25 30 35 40 45 50 55 60 65 70 75 80 85 90 95 100
Thou
sand
NO
K
Age in 2009
Male Standard Female StandardMale Mixed Family Benef its Female Mixed Family Benef itsMale Standard Reversed Female Standard Reversed
However, to further check the robustness of male vs. female generational accounts, we
have built two new scenarios in Figure 7. Scenario “Mixed Family Benefits” distributes the
family benefits in equal shares over men and women. This probably overestimates the
male share since most single parents are single mothers. A final, more extreme, scenario
“Standard Reversed” reverses the standard assumption. Here we use the female profiles
for the males and vice versa. The generic result that men are the main contributors to the
welfare state holds in every scenario.
5. The Norwegian Pension Reform
The Norwegian pension reform is to take effect from 2011. It seeks to dampen the
expenditure effect due to growth in life expectancy, and to strengthen ties between former
earnings, retirement decisions, and pension benefits, thus providing work incentives in
particular for elderly workers. The reform comprises two major elements.7 First, one tries
to control for the growth in expenditures by applying the following set of indexing rules:
7 For a comprehensive overview of all reform details see Risku and Vidlund (2008) and Ministry of Labour and Social Inclusion (2009).
18
Indexing Rule 1: Income dependent pension entitlements will be indexed by wage growth
until retirement. The pension benefits, however, will be adjusted by wage growth minus
0.75 percentage points only. Pensions will thus not be increased completely in step with
national wage increase rates. In other words, the purchasing power of a standard pension
will be lower over time.
Indexing Rule 2: Pension payments will be adjusted with the life expectancy of the
population at large. If life expectancy increases, a quasi-actuarial mechanism kicks in and
reduces annual benefits as the expected length of the retirement period increases.8 The
indexation of pension benefits to changes in national life expectancy cuts pension
generosity.9
The next element is to stimulate labor supply. This will be done by lowering the
implicit tax by making the supplementary (income based) pension more actuarially fair with
benefits calibrated to the entire working life. Furthermore, the new flexible retirement age
(starting from 62 years) will be based on an actuarial adjustment of the yearly benefit. As it
is not clear how individuals will behave to this new policy instruments,10 we will follow the
standard procedure of generational accounting and abstract from these reform elements in
our calculations of fiscal sustainability.
Figure 8 shows the sustainability and redistribution effects resulting from Indexing
Rule 1 and 2. Our simulations are made using the average gains in life expectancy with
reference to the 56-year-old cohort in 2010. The reason for this choice is that the Reform
is going to be effectuated from the generation born in 1954, i.e. for people that are 56 in
2010.11 12
8 The mechanism implemented is only quasi-actuarially fair, as the indexing of benefits does not include an actuarial consideration of life expectancy but only a consideration of average gains in life expectancy. 9 If the average life expectancy rate increases, employees will have to stay longer in employment to be entitled to the same present value of total pension, or accept lower annual pension payments and thus a lower present value of total pension benefits. An increase in the expected number of retirement years reduces the annual benefit such that the present value of total pension benefits is nearly invariant to changes in current remaining life expectancy and retirement age. 10 See Holmøy and Stensnes (2008) for a further discussion. 11 Concerning the reference point, i.e. the 56-year-olds in 2010 for indexing pension payments with average gains in life expectancy, we want to remark that in the original pension reform plan the group of 67-year-olds was earmarked as reference. The effects of taking a younger reference group are smaller cuts in pension generosity but as a direct consequence also less sustainability. The reason for lesser cuts in generosity due to an indexing with average gains in life expectancy is straightforward as the gains in years of life are bigger when comparing the cohort passing into retirement with the group of 67-year-olds compared to the 56-year-olds. 12 In the following analysis, the pension reform elements employed are in some respect idealized as the actual reform plan envisages a less brisk proceeding. The indexing with average gains in life expectancy e.g. is only to be installed as of 2018. In order to exemplify the reform-induced intragenerational effects, we nevertheless choose to completely implement the reform from 2010 onwards, as this illustrates (today) what actually happens on the intragenerational level (tomorrow). The intergenerational dimension is affected by
19
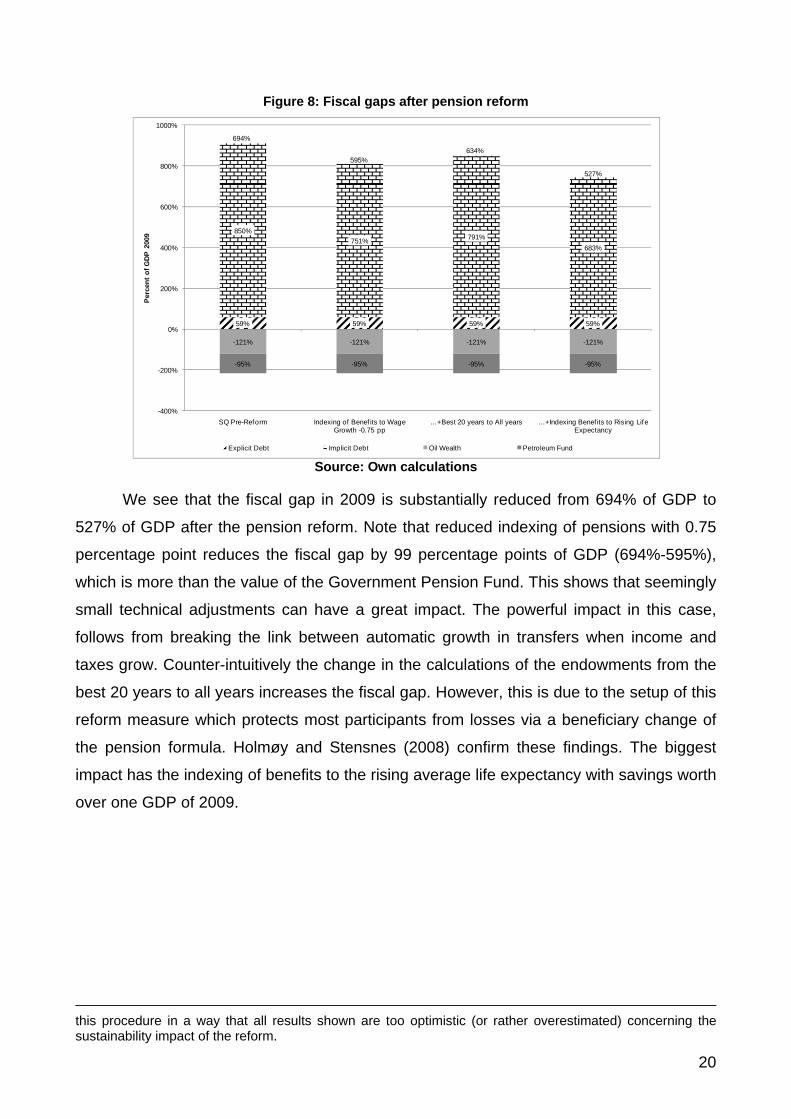
Figure 8: Fiscal gaps after pension reform
Source: Own calculations
59% 59% 59% 59%
850%751% 791%
683%
-121% -121% -121% -121%
-95% -95% -95% -95%
694%
595%634%
527%
-400%
-200%
0%
200%
400%
600%
800%
1000%
SQ Pre-Reform Indexing of Benef its to Wage Growth -0.75 pp
…+Best 20 years to All years …+Indexing Benef its to Rising Life Expectancy
Perc
ent o
f GDP
200
9
Explicit Debt Implicit Debt Oil Wealth Petroleum Fund
We see that the fiscal gap in 2009 is substantially reduced from 694% of GDP to
527% of GDP after the pension reform. Note that reduced indexing of pensions with 0.75
percentage point reduces the fiscal gap by 99 percentage points of GDP (694%-595%),
which is more than the value of the Government Pension Fund. This shows that seemingly
small technical adjustments can have a great impact. The powerful impact in this case,
follows from breaking the link between automatic growth in transfers when income and
taxes grow. Counter-intuitively the change in the calculations of the endowments from the
best 20 years to all years increases the fiscal gap. However, this is due to the setup of this
reform measure which protects most participants from losses via a beneficiary change of
the pension formula. Holmøy and Stensnes (2008) confirm these findings. The biggest
impact has the indexing of benefits to the rising average life expectancy with savings worth
over one GDP of 2009.
this procedure in a way that all results shown are too optimistic (or rather overestimated) concerning the sustainability impact of the reform.
20

Figure 9: Induced Burden of the pension reform per cohort in annuities
Source: Own calculations
0
5
10
15
20
25
0 5 10 15 20 25 30 35 40 45 50 55 60 65 70 75 80 85 90 95 100
Thou
sand
NO
K
Age
As we have shown in the last paragraphs, the Norwegian pension reform reduces
the burden for future generations significantly. However, this implies that living generations
have to take some of the burden i.e. lower pension benefits. Figure 9 shows the level of
this redistribution in annuities per cohorts. Interestingly, the picture is not clear cut.
Laymen’s intuition would probably state that the pensioners are hit the hardest by a
pension reform but they are not. In fact pensioners over 80 years are the ones hit the
least. Another surprisingly result is that next to the younger cohorts between 15 and 35
years the cohorts around 65 years face a relatively high burden. This can be explained by
the different reform measures. The first new index rule is hitting the generations just before
entering the benefit phase particularly because they face the longest benefit period while
their entitlements do not increase much more. Secondly the generous change from the 20
best to all years in the benefit formula is not reducing the burden for those who are just
entering the benefit phase. Thirdly the postponement of the second index rule is especially
favorable for the cohorts around 55 years while the 65 years olds are not benefiting that
much. However the largest burden is still borne by the even younger cohorts.
6. Summary and Conclusion
Norway is expected to face relatively strong pressure on its public finances due to an
ageing population and the resulting increase in age-related public expenditure. A
continuation of the current policy (as of 2009) will end in a long run gap between
21
government incomes and expenses. To close the gap, a 17% increase in taxes would be
needed. However, this estimate is sensitive to the underlying assumptions taken. In
particular, the estimate is changing for the choice of the base year. For example, if 2005 is
chosen instead of 2009, the computed gap would be an 8 percentage point increase in
taxes. With the pension reform enacted in 2011, Norway takes a step towards long-term
fiscal sustainability. Due to life expectancy adjustment in benefits the pension scheme
expenditure will in practice remain unaffected by the increased longevity. This is
undoubtedly an effective way to retain fiscal sustainability. According to our results, the
needed 17% increase in taxes (2009) is decreased to 12%. If 2005 is chosen as base year
the needed 8% increase is diminished to 5%.
We have also looked at the intragenerational distribution. Here we find that men as
a group bear the fiscal burden. They receive most pensions, but as a group they pay
relatively more in the form of taxes. This conclusion holds even if men are attributed
benefits connected to children. However, all our calculations are sensitive to assumptions
regarding population projections. In our calculations we assume a fertility rate of 1.9.
Increasing this birth rate worsen the fiscal balance. The same holds for increasing the
assumed GDP-growth rate.
We started by asking whether Norway is overconsuming its petroleum wealth. This
is a reasonable question to ask also in the light of the broad political consensus of trying to
perpetuate the Government Pension Fund (GPF) to make the transitory petroleum income
available also to future generations. In all our sensitivity analyses, there are no scenario
where the GPF is not depleted. On the other hand, the recent pension reform shows that
substantial improvements in the long term fiscal balance are possible. During some
decades Norway has experienced a lucky streak with improving terms of trade in the new
world economy, typically influenced by Chinese demand for inputs and strong competition
in manufactured goods. Being an exporter of natural resources like oil, gas and fish, and a
beneficiary of lower prices on manufactured goods, Norway has enjoyed a very favorable
position. Our analyses suggest that Norway may be close to intergenerational fiscal
balance provided that the luckiest of circumstances continue in the decades to come. Even
under such favorable conditions, both the petroleum wealth and pension reform are
necessary to secure sustainability. However, it is reasonable to believe that the lucky
streak will come to an end also in the case of Norway. In that case it is necessary to keep
on a continuous reform process to promote efficient markets, and to align expenditures
and revenues to short- and long term constraints.
22
References
Auerbach, A., J. Gokhale and L. Kotlikoff (1994), Generational Accounts: a meaningful way to evaluate fiscal policy, The Journal of Economic Perspectives, 8 (1), 73-94. Auerbach, A., J. Gokhale, L. Kotlikoff and E. Steigum (1993), Generational Accounting in Norway: Is the Nation Overconsuming its Petroleum Wealth?, Working paper series of the Federal Reserve Bank of Cleveland, 9305. Auerbach, A., J. Gokhale and L. Kotlikoff (1992), Social security and Medicare policy from the perspective of generational accounting, Tax Policy and the Economy, 6, 129-145. Auerbach, A., J. Gokhale and L. Kotlikoff (1991), Generational Accounts: a meaningful alternative to deficit accounting, Tax policy and the economy, 5, 55-110. Benz, U. and C. Hagist (2008), Konjunktur und Generationenbilanz - Eine Analyse anhand des HP-Filters, Jahrbücher für Nationalökonomie und Statistik, 228(4), 299-316. Benz, U. and S. Fetzer (2006), Indicators for Measuring Fiscal sustainability: A Comparison of the OECD Method and Generational Accounting, FinanzArchiv, 62 (3), 367-391. Bonin, H. (2001), Generational Accounting: Theory and Application, Berlin: Springer. Fetzer, S. (2006), Zur nachhaltigen Finanzierung des gesetzlichen Gesundheitssystems, Frankfurt: Peter Lang. Fetzer, S., A. Grasdal and B. Raffelhüschen (2005), Health and Demography in Norway, mimeo. Gjersem, C. (2002), A Presentation of Generational Accounting in Norway, in: Nordic Journal of Political Economy, 28, 61-73. Hagist, C. (2008), Demography and Social Health Insurance: An International Comparison Using Generational Accounting, Baden-Baden: Nomos. Holmøy, E. and K. Stensnes (2008): Will the Norwegian pension reform reach its goals? An integrated micro-macro assessment. Discussion Papers No. 557, Statistics Norway. Ministry of Finance (2008), The Revised National Budget 2008, Oslo. Ministry of Finance (2006), Storting melding nr. 1 (2006-2007) Nasjonalbudsjettet 2007, Oslo. Ministry of Labour and Social Inclusion (2009): Governmental White Paper No. 5 (2006-2007), http://www.regjeringen.no/en/dep/aid/Topics/pensions, 05/18/2009. OECD (2007), OECD Economic Surveys: Norway, Paris. Raffelhüschen, B. (1999), Generational Accounting: Method, Data and Limitations, in: European Commission (eds.), European Economy, Reports and Studies, 6, Brussels, 17-28. Risku, I. and M. Vidlund (2008): Finnish and Norwegian pension reform: Implications for preparing aged society. Finnish Centre for Pensions Working Papers No. 4. Rønsen, M. (2004), Fertility and family policy in Norway - A reflection on trends and possible connections, Demographic Research, 10, 265-286.
23
Statistics Norway (2010a), Population, http://www.ssb.no/befolkning_en/, 10/18/2008. Statistics Norway (2010b), Public Finance, http://www.ssb.no/off_finans_en/, 10/18/2008. Statistics Norway (2010c), Health, http://www.ssb.no/helsetilstand_en/, 10/18/2008. Steigum, E. (2002), Oil Price Risk, Prudent Fiscal Policy, and Generational Accounting, SNF Report, Institute for Research in Economics and Business Administration, 22, Bergen. Steigum, E. (1996), Okonomisk politikk og pensionssystem i et flergenerasjonsperspektiv, in: Norman, V. (ed.): Næringspolitikk og økonomisk utvikling: Norge fra gjenreisning til gjenreisning, Oslo: Universitaets-Forlag, 167-192. Steigum, E. and Gjersem, C. (1999), Generational Accounting and Deployable Natural Resources: The Case of Norway, in: Auerbach, A. J., Kotlikoff, L. J. and Leibfritz, W. (eds.), Generational Accounting around the World, Chicago: University of Chicago Press, 369-395.
24
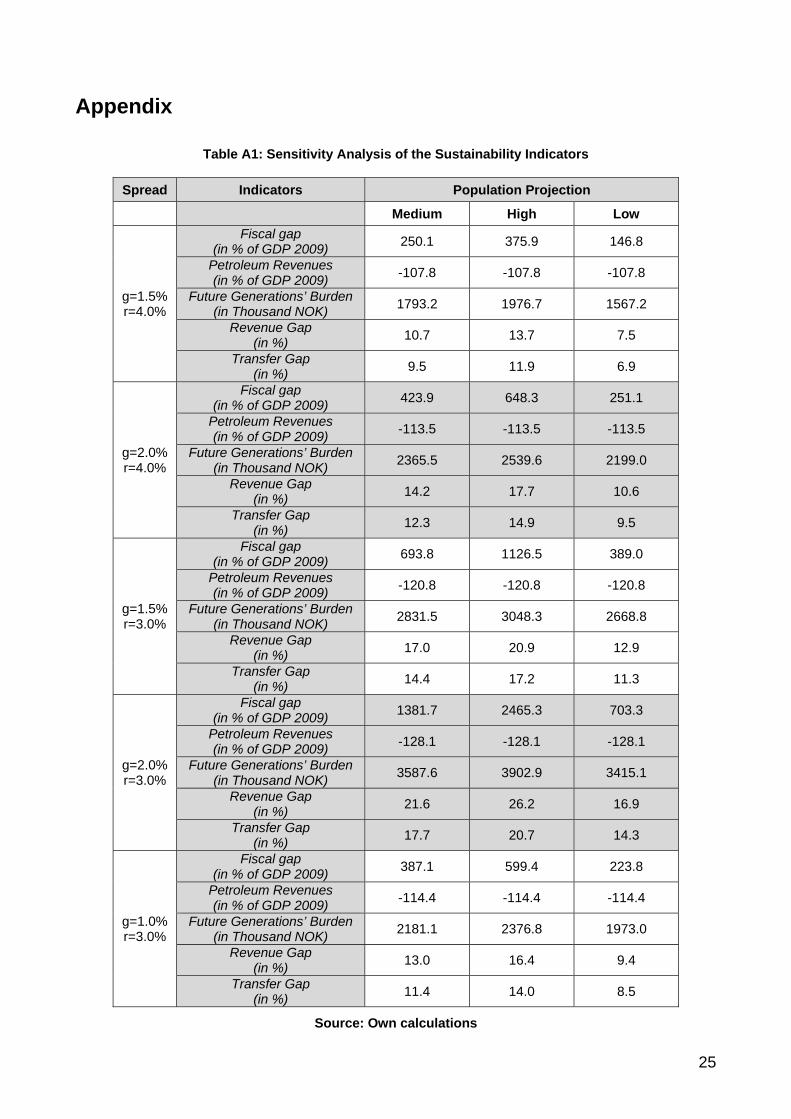
Appendix
Table A1: Sensitivity Analysis of the Sustainability Indicators
Spread Indicators Population Projection
Medium High Low
g=1.5% r=4.0%
Fiscal gap (in % of GDP 2009) 250.1 375.9 146.8
Petroleum Revenues (in % of GDP 2009) -107.8 -107.8 -107.8
Future Generations’ Burden(in Thousand NOK) 1793.2 1976.7 1567.2
Revenue Gap (in %) 10.7 13.7 7.5
Transfer Gap (in %) 9.5 11.9 6.9
g=2.0% r=4.0%
Fiscal gap (in % of GDP 2009) 423.9 648.3 251.1
Petroleum Revenues (in % of GDP 2009) -113.5 -113.5 -113.5
Future Generations’ Burden(in Thousand NOK) 2365.5 2539.6 2199.0
Revenue Gap (in %) 14.2 17.7 10.6
Transfer Gap (in %) 12.3 14.9 9.5
g=1.5% r=3.0%
Fiscal gap (in % of GDP 2009) 693.8 1126.5 389.0
Petroleum Revenues (in % of GDP 2009) -120.8 -120.8 -120.8
Future Generations’ Burden(in Thousand NOK) 2831.5 3048.3 2668.8
Revenue Gap (in %) 17.0 20.9 12.9
Transfer Gap (in %) 14.4 17.2 11.3
g=2.0% r=3.0%
Fiscal gap (in % of GDP 2009) 1381.7 2465.3 703.3
Petroleum Revenues (in % of GDP 2009) -128.1 -128.1 -128.1
Future Generations’ Burden(in Thousand NOK) 3587.6 3902.9 3415.1
Revenue Gap (in %) 21.6 26.2 16.9
Transfer Gap (in %) 17.7 20.7 14.3
g=1.0% r=3.0%
Fiscal gap (in % of GDP 2009) 387.1 599.4 223.8
Petroleum Revenues (in % of GDP 2009) -114.4 -114.4 -114.4
Future Generations’ Burden(in Thousand NOK) 2181.1 2376.8 1973.0
Revenue Gap (in %) 13.0 16.4 9.4
Transfer Gap (in %) 11.4 14.0 8.5
Source: Own calculations
25
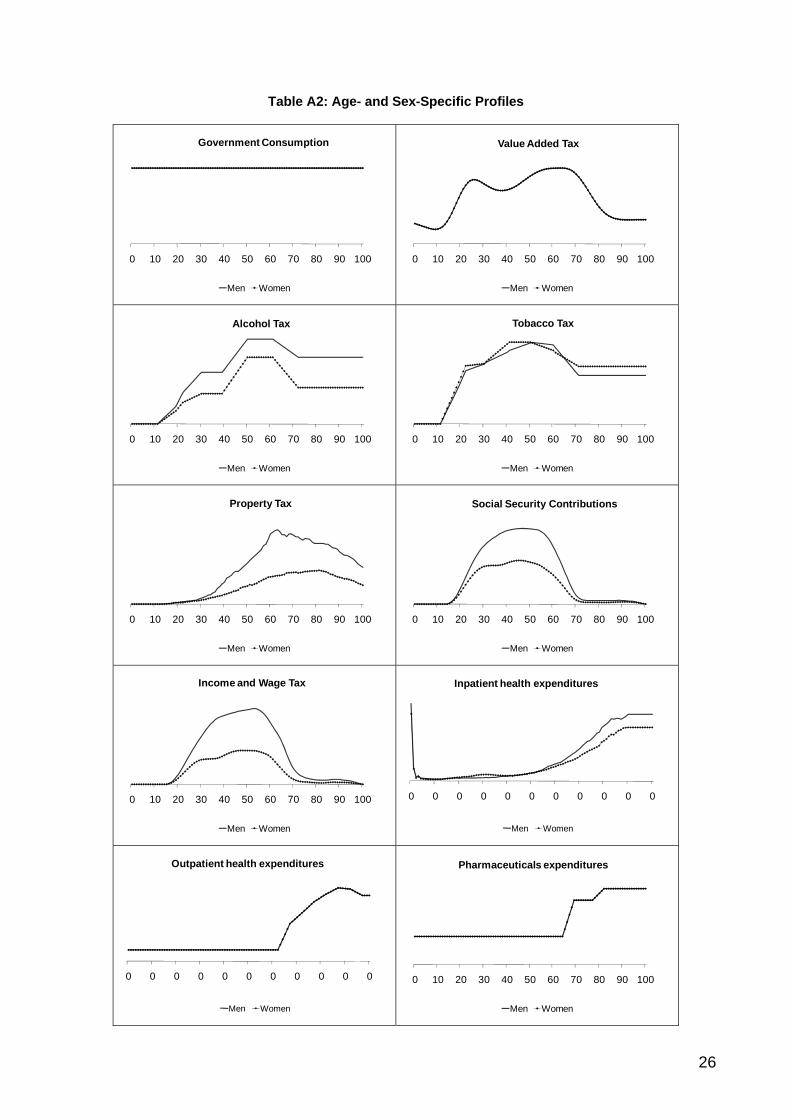
Table A2: Age- and Sex-Specific Profiles
0 10 20 30 40 50 60 70 80 90 100
Government Consumption
Men Women
0 10 20 30 40 50 60 70 80 90 100
Value Added Tax
Men Women
0 10 20 30 40 50 60 70 80 90 100
Alcohol Tax
Men Women
0 10 20 30 40 50 60 70 80 90 100
Tobacco Tax
Men Women
0 10 20 30 40 50 60 70 80 90 100
Property Tax
Men Women
0 10 20 30 40 50 60 70 80 90 100
Social Security Contributions
Men Women
0 10 20 30 40 50 60 70 80 90 100
Income and Wage Tax
Men Women
0 0 0 0 0 0 0 0 0 0 0
Inpatient health expenditures
Men Women
0 0 0 0 0 0 0 0 0 0 0
Outpatient health expenditures
Men Women
0 10 20 30 40 50 60 70 80 90 100
Pharmaceuticals expenditures
Men Women
26
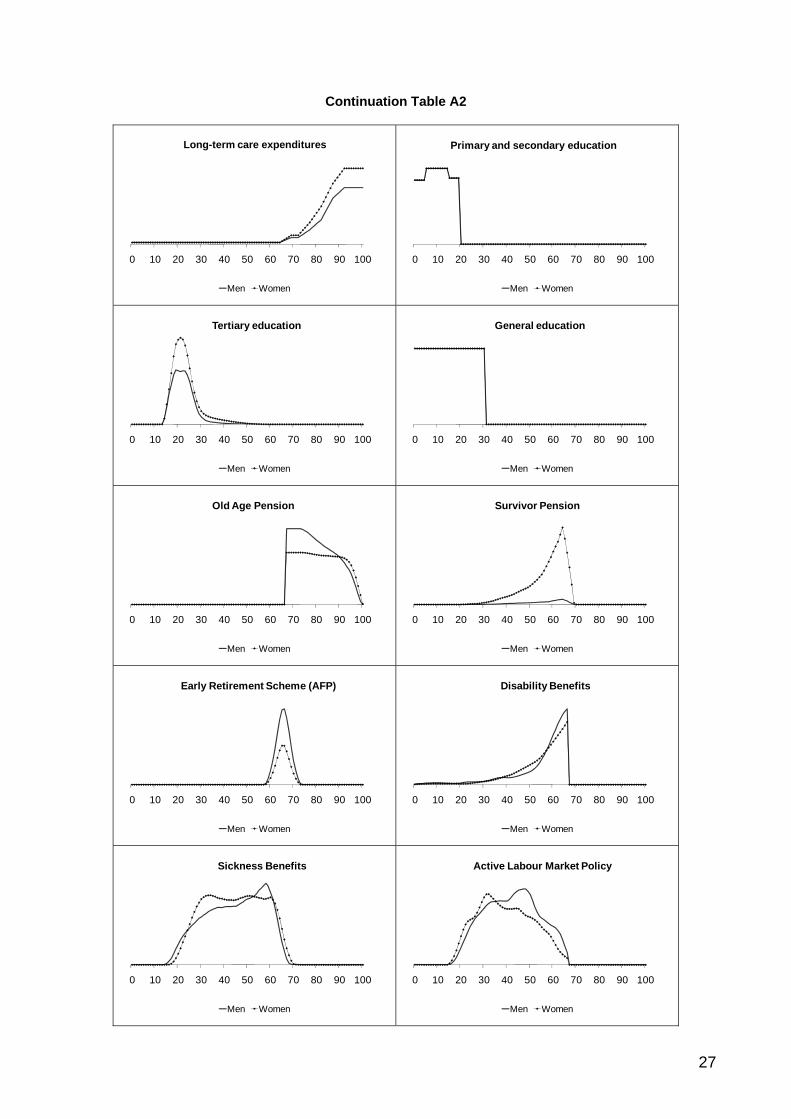
Continuation Table A2
0 10 20 30 40 50 60 70 80 90 100
Long-term care expenditures
Men Women
0 10 20 30 40 50 60 70 80 90 100
Primary and secondary education
Men Women
0 10 20 30 40 50 60 70 80 90 100
Tertiary education
Men Women
0 10 20 30 40 50 60 70 80 90 100
General education
Men Women
0 10 20 30 40 50 60 70 80 90 100
Old Age Pension
Men Women
0 10 20 30 40 50 60 70 80 90 100
Survivor Pension
Men Women
0 10 20 30 40 50 60 70 80 90 100
Early Retirement Scheme (AFP)
Men Women
0 10 20 30 40 50 60 70 80 90 100
Disability Benefits
Men Women
0 10 20 30 40 50 60 70 80 90 100
Sickness Benefits
Men Women
0 10 20 30 40 50 60 70 80 90 100
Active Labour Market Policy
Men Women
27
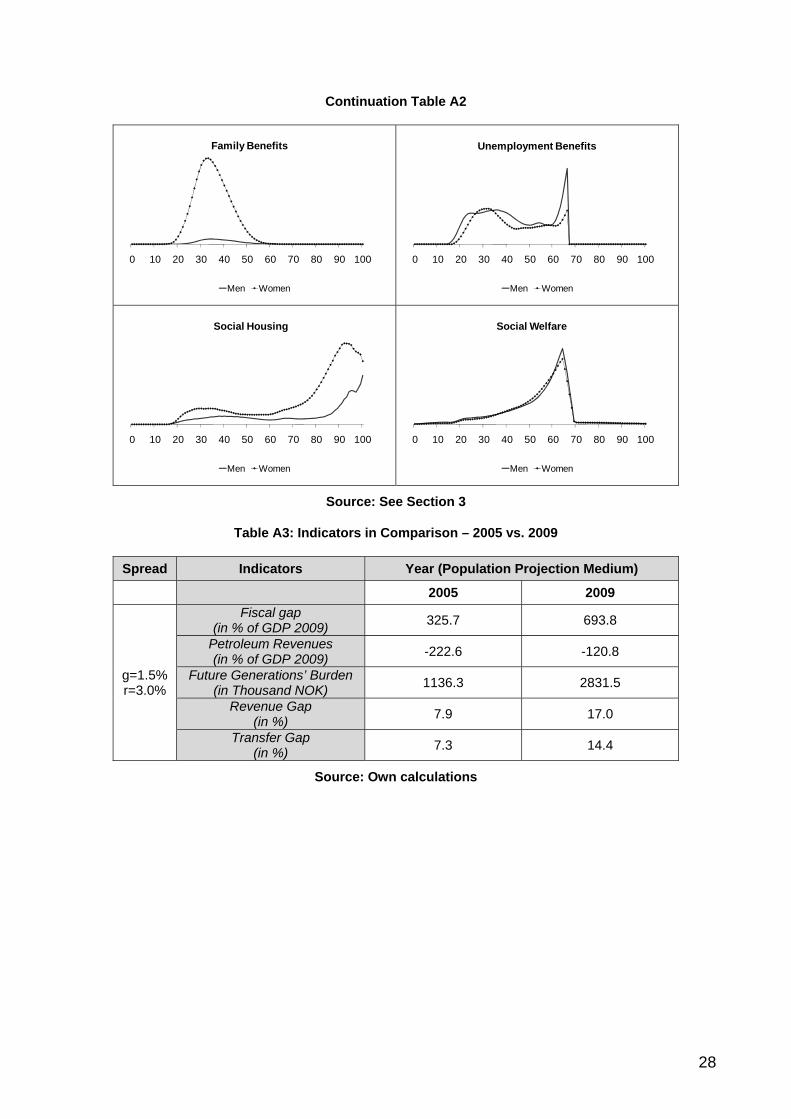
Continuation Table A2
0 10 20 30 40 50 60 70 80 90 100
Family Benefits
Men Women
0 10 20 30 40 50 60 70 80 90 100
Unemployment Benefits
Men Women
0 10 20 30 40 50 60 70 80 90 100
Social Housing
Men Women
0 10 20 30 40 50 60 70 80 90 100
Social Welfare
Men Women
Source: See Section 3
Table A3: Indicators in Comparison – 2005 vs. 2009
Spread Indicators Year (Population Projection Medium)
2005 2009
g=1.5% r=3.0%
Fiscal gap (in % of GDP 2009) 325.7 693.8
Petroleum Revenues (in % of GDP 2009) -222.6 -120.8
Future Generations’ Burden(in Thousand NOK) 1136.3 2831.5
Revenue Gap (in %) 7.9 17.0
Transfer Gap (in %) 7.3 14.4
Source: Own calculations
28

Figure A1: Generational Accounts 2005 vs. 2009
Source: Own calculations
-5000
-4000
-3000
-2000
-1000
0
1000
2000
3000
4000
5000
0 5 10 15 20 25 30 35 40 45 50 55 60 65 70 75 80 85 90 95 100
Thou
sand
NO
K
Age in 2005/2009
Total 2005 Total 2009
29
Seit 2005 erschienene Beiträge No. 1 Christian Hagist/ Norbert Klusen/ Andreas Plate/ Bernd Raffelhüschen Social Health Insurance – the major driver of unsustainable fiscal policy?
No. 2 Stefan Fetzer/ Bernd Raffelhüschen/ Lara Slawik Wie viel Gesundheit wollen wir uns eigentlich leisten?
No. 3 Oliver Ehrentraut/Matthias Heidler/Bernd Raffelhüschen En route to sustainability: history, status quo, and future reforms of the German public pension scheme?
No. 4 Jasmin Häcker/ Bernd Raffelhüschen Die Interne Rendite der Gesetzlichen Pflegeversicherung
No. 5 Jasmin Häcker/ Bernd Raffelhüschen Internal Rates of Return of the German Statutory Long-Term Care Insurance
(Englische Fassung von Diskussionsbeitrag No. 4)
No. 6 Matthias Heidler/ Bernd Raffelhüschen How risky is the German Pension System? The Volatility of the Internal Rates of Return
No. 7 Laurence J. Kotlikoff/ Christian Hagist Who’s going broke? Comparing Growth in Healthcare Costs in Ten OECD Countries
No. 8 Jasmin Häcker Dynamisierung der Pflegeleistungen: Vergangenheit – Gegenwart – Zukunft
No. 9 Dirk Mevis/ Olaf Weddige Gefahr erkannt – Gefahr gebannt? Nachhaltigkeitsbilanz der 15. Legislaturperiode des deutschen Bundestages 2002-2005
No. 10 Daniel Besendorfer/ Emily Phuong Dang/ Bernd Raffelhüschen Die Schulden und Versorgungsverpflichtungen der Länder: Was ist und was kommt
No. 11 Jasmin Häcker/ Bernd Raffelhüschen Zukünftige Pflege ohne Familie: Konsequenzen des „Heimsog-Effekts“
No. 12 Christian Hagist/ Bernd Raffelhüschen/ Olaf Weddige Brandmelder der Zukunft – Die Generationenbilanz 2004
No. 13 Matthias Heidler/ Arne Leifels/ Bernd Raffelhüschen Heterogenous life expectancy, adverse selection, and retirement behavior
No. 14 Pascal Krimmer/ Bernd Raffelhüschen Grundsicherung in Deutschland - Analyse und Reformbedarf
No. 15 Ulrich Benz/ Christian Hagist Konjunktur und Generationenbilanz – eine Analyse anhand des HP-Filters
No. 16 Jasmin Häcker/ Birgit König/ Bernd Raffelhüschen/ Matthias Wernicke/ Jürgen Wettke Effizienzreserven in der stationären Pflege in Deutschland: Versuch einer Quantifizierung und Im-plikationen für die Reform der Gesetzlichen Pflegeversicherung
No. 17 Christian Hagist/ Matthias Heidler/ Bernd Raffelhüschen/ Jörg Schoder Brandmelder der Zukunft – Die Generationenbilanz Update 2007: Demografie trifft Konjunktur
No. 18 Lukas Mangelsdorff Die Geldsteuer: Vorschlag für eine radikal einfache Steuer
No. 19 Jasmin Häcker/ Tobias Hackmann/ Stefan Moog Demenzkranke und Pflegebedürftige in der Sozialen Pflegeversicherung – Ein intertemporaler Kostenvergleich
No. 20 Oliver Ehrentraut/ Matthias Heidler Demografisches Risiko für die Staatsfinanzen? – Koordinierte Bevölkerungsvorsausberechnungen im Vergleich
No. 21 Oliver Ehrentraut/ Matthias Heidler Zur Nachhaltigkeit der GRV – Status quo, Potenziale und Risiken
No. 22 Ulrich Benz/ Christian Hagist Konjunktur und Generationenbilanz – eine Analyse anhand des HP-Filters
No. 23 Ulrich Benz/ Christian Hagist Technischer Anhang zu „Konjunktur und Generationenbilanz – eine Analyse anhand des HP-Filters“
No. 24 Veronika Deeg/ Christian Hagist The Fiscal Outlook in Austria – An Evaluation with Generational Accounts
No. 25 Oliver Ehrentraut/ Bernd Raffelhüschen Demografischer Wandel und Betriebsrenten – Zur Berücksichtigung der Langlebigkeit bei der Anpassung von Direktzusagen
No. 26 Tobias Hackmann/ Stefan Moog Älter gleich kränker? Auswirkungen des Zugewinns an Lebenserwartung auf die Pflegewahr-scheinlichkeit
No. 27 Klaus Kaier/ Christian Hagist/ Uwe Frank/ Elisabeth Meyer Antimicrobial drug use, alcohol-based hand disinfection and the burden of methicillin-resistant Staphylococcus aureus – A time series approach at a German University Medical Center
No. 28 Jasmin Häcker/ Tobias Hackmann/ Thorsten Henne Sozialgesetzgebung und Beihilfeverordnungen: Ein Leistungsvergleich von Versicherten der Sozialen Pflegeversicherung und Beamten im Pflegefall
No. 29 Stefan Moog MacSim: Ein Simulationsmodell zur Analyse der gesamtwirtschaftlichen Auswirkungen der de-mografischen Entwicklung in Deutschland
No. 30 Christian Hagist/ Stefan Moog/ Bernd Raffelhüschen Ehrbarer Staat? Die Generationenbilanz – Update 2008: Migration und Nachhaltigkeit
No. 31 Klaus Kaier/ Uwe Frank/ Christian Hagist/ Elisabeth Meyer The impact of antimicrobial drug consumption and alcohol-based hand rub use on the emer-gence and spread of extended-spectrum β-lactamase (ESBL)-producing strains – A time series analysis
No. 32 Friedrich Fichtner/ Christian Hagist Oil and Intergenerational Redistribution – The case of Norway
No. 33 Tobias Hackmann/ Stefan Moog Pflege im Spannungsfeld von Angebot und Nachfrage
No. 34 Christian Hagist/ Stefan Moog/ Bernd Raffelhüschen / Johannes Vatter Ehrbare Staaten? Die Ergebnisse der Generationenbilanzierung im internationalen Vergleich
No. 35 Christian Hagist/ Johannes Vatter Measuring Fiscal Sustainability on the Municipal Level: A German Case Study
No. 36 Uwe Frank/ Klaus Kaier Dynamics between antibiotic drug use and resistance – An economic approach
No. 37 Matthias Heidler/ Christoph Müller/ Olaf Weddige Measuring accrued-to-date liabilities of public pension schemes – method, data and limitations
No. 38 Stefan Moog/ Bernd Raffelhüschen Ehrbarer Staat? Die Generationenbilanz – Update 2009: Wirtschaftskrise trifft Tragfähigkeit
No. 39 Christoph Müller/ Bernd Raffelhüschen/ Olaf Weddige Measuring pension liabilities and the perspective of sustainability: the case of the reformed
German statutory pension scheme

No. 40 Tobias Hackmann Arbeitsmarkt Pflege: Bestimmung der künftigen Altenpflegekräfte unter Berücksichtigung der
Berufsverweildauer
No. 41 Astrid L. Grasdal/Jasmin Häcker/ Christian Hagist/ Erling Vårdal Who pays for whom? Redistributive Effects of the Norwegian Pension Reform
No. 42 Christian Hagist/Tobias Benz Der Rücklagenbedarf der Versorgungsausgaben in Baden-Württemberg – Projektion und Re-
formoptionen
No. 43 Jasmin Häcker/Tobias Hackmann LOS(T) in Long-term Care: Empirical Evidence from German Data 2000-2009
No. 44 Stefan Moog/Christoph Müller/ Bernd Raffelhüschen Ehrbare Staaten? Die deutsche Generationenbilanz im internationalen Vergleich: Wie gut ist
Deutschland auf die demografische Herausforderung vorbereitet
No. 45 Felix Schnurr/Johannes Vatter/Frank Weinmann Zum Kostenanstieg im Gesundheitswesen 2009: Wie teuer waren die Reformen?
No. 46 Jasmin Häcker/Tobias Hackmann/ Bernd Raffelhüschen Pflegereform 2010: Karenzzeiten in der Sozialen Pflegeversicherung
No. 47 Janusz Jab�onowski/Christoph Müller/Bernd Raffelhüschen A fiscal outlook for Poland using Generational Accounts
No. 48 Klaus Kaier The impact of pricing and patent expiration on the demand for pharmaceuticals: an examination
of the use of broad-spectrum antimicrobials
No. 49 Christian Hagist/Bernd Raffelhüschen/Alf Erling Risa/Erling Vårdal Long-Term Fiscal Effects of Public Pension Reform in Norway – A Generational Accounting Analy-
sis

Forschungszentrum Generationenverträge
Albert-Ludwigs-Universität Freiburg
Bertoldstraße 17
79098 Freiburg
Fon 0761 . 203 23 54
Fax 0761 . 203 22 90
www.generationenvertraege.de
[email protected] ISSN 1862-913X