csp2014 predictive spc
TRANSCRIPT

2/7/2014 A. Gilgur & J. Ferrandiz. Predictive SPC 1
Alex Gilgur, Josep Ferrandiz ASA Conference on Statistical Practice
Tampa, FL. February 2014

Outline
• SPC = Statistical Process Control
• The Fishbone of SPC
• Traditional SPC
• Six Sigma
• Predictive SPC:
– Univariate
– Multivariate
2/7/2014 A. Gilgur & J. Ferrandiz. Predictive SPC 2

2/7/2014 A. Gilgur & J. Ferrandiz. Predictive SPC
3
1968

2/7/2014 A. Gilgur & J. Ferrandiz. Predictive SPC 4
•Artificial Intelligence •Predictive Analytics
•Data Mining •Machine Learning

2/7/2014 A. Gilgur & J. Ferrandiz. Predictive SPC
5
SPC
Specifications
Target
What to measure?
Science / Engineering / Math
Domain
Upper Spec Limit
Lower Spec Limit
Distribution
Stationarity
Process Dynamics
Dependencies
The Fishbone of SPC

Setting Specs is an optimization problem
2/7/2014 6
p
Servers = argmax (Revenue |Budget)
Revenue = f[Throughput (Servers, SW, Budget)]
Servers = argmin (Budget | Revenue)
•Throughput = t (UX)
•Revenue = r (Throughput)
•Budget = f(SW, Servers)
Constraints:
•Domain
•Budget ≤ B
The business drives the specs
A. Gilgur & J. Ferrandiz. Predictive SPC

Specifications
2/7/2014 7
Stake-holders
X Y
LSL, Tgt, USL X = f-1 (Y)
LSL, Tgt, USL
From X to Y to X A. Gilgur & J. Ferrandiz. Predictive SPC

Domain
2/7/2014 A. Gilgur & J. Ferrandiz. Predictive SPC
8

“Knobs” to turn?
2/7/2014 A. Gilgur & J. Ferrandiz. Predictive SPC
9
Specifications Upper Spec Limit Target Lower Spec Limit
Domain Science/Engineering/Math What to measure?
Closing the loop
Specs to adjust?
Process Dynamics Stationarity Distribution Dependencies

2/7/2014 A. Gilgur & J. Ferrandiz. Predictive SPC
10
Does External Interaction Only Lead to Improvement?

2/7/2014 11
Process Dynamics: Short-term vs. Long-term
Timeline
Val
ue
(IO
/se
c, %
Uti
l, C
PU
Load
, …)
Day1 Day2 Day3 … … … … … … … … ... Day(N-1) Day(N)
0 0.5 1 1.5 2 2.5 3 3.5 4
1
3
5
7
9
11
13
15
17
HIGH
LOW
Data Collection hides the true distribution
A. Gilgur & J. Ferrandiz. Predictive SPC

2/7/2014 12
Process Dynamics: Traditional SPC
μ == Target; μ + 6*σ <= USL; μ - 6*σ >= LSL;
μ
σ
LCL UCL
IDEAL CASE: on target; in control; within the specifications
LSL USL
Target
A. Gilgur & J. Ferrandiz. Predictive SPC

2/7/2014 13
μ
σ
LSL
USL
Target
LCL UCL
SHIFT
μ != Target; μ + 6*σ > USL; μ - 6*σ >= LSL;
REAL CASE # 1: off target; in control; out of the specifications
P-value
Process Dynamics: a Shift
1) Negotiate specs 2) Change the process
A. Gilgur & J. Ferrandiz. Predictive SPC
2/7/2014
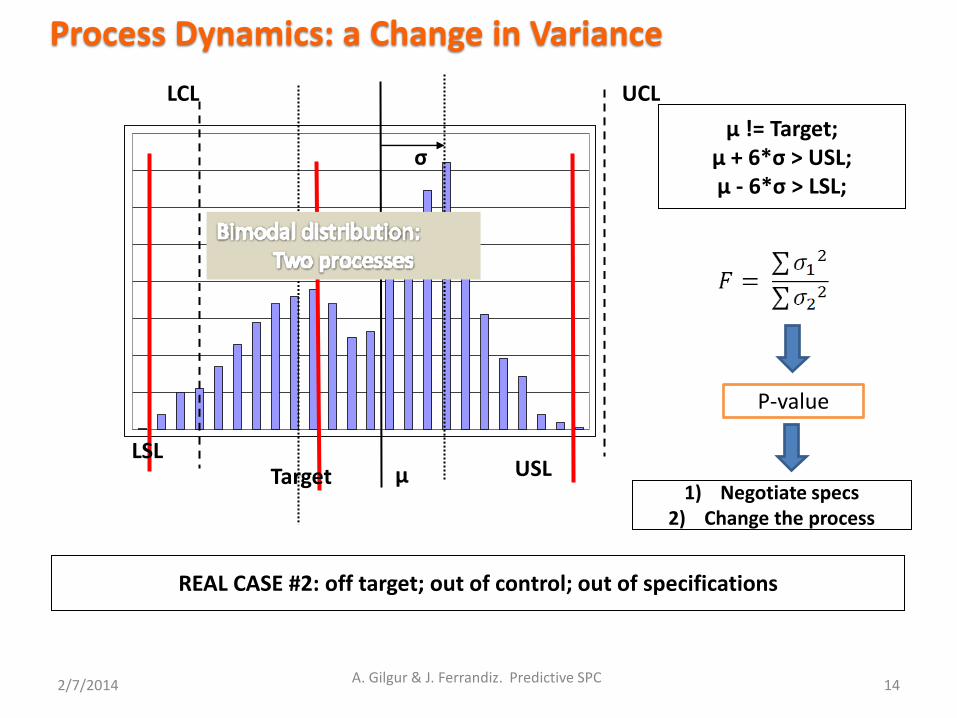
Process Dynamics: a Change in Variance
14
μ != Target; μ + 6*σ > USL; μ - 6*σ > LSL;
REAL CASE #2: off target; out of control; out of specifications
μ
σ
LSL USL Target
LCL UCL
A. Gilgur & J. Ferrandiz. Predictive SPC
P-value
1) Negotiate specs 2) Change the process
2/7/2014 15
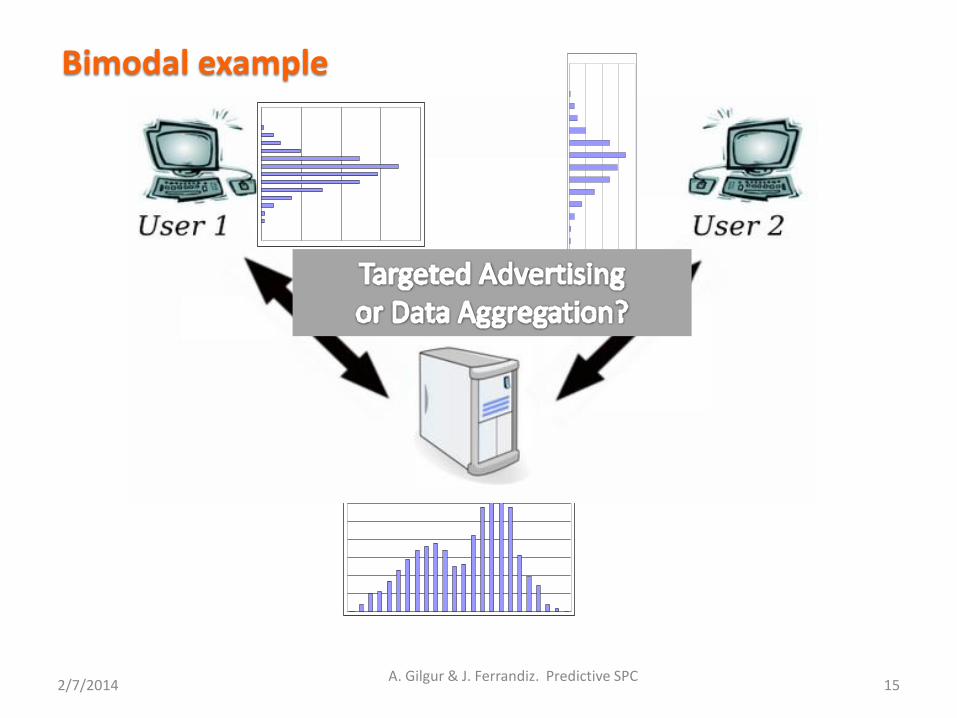
Bimodal example
A. Gilgur & J. Ferrandiz. Predictive SPC

• Cp – a measure of the process capability to produce consistent results: – Cp = (USL – LSL) / (6 * σ)
– Desired Cp >= 1.0
– High Cp -> “In control”
• Cpk – a measure of the process capability to produce results that are on target: – Cpk = Min { ( μ – LSL) / (3 * σ), (USL – μ) / (3 * σ)}
– Desired Cpk >= 1.33
– High Cpk -> “In control and On Target”
• Cpk > Cp > 1.33 -> “In Control, On Target”
• Cpk < Cp < 1.0 -> “Out of Control, Off Target”
2/7/2014 16
SPC Measures
A. Gilgur & J. Ferrandiz. Predictive SPC
2/7/2014 17
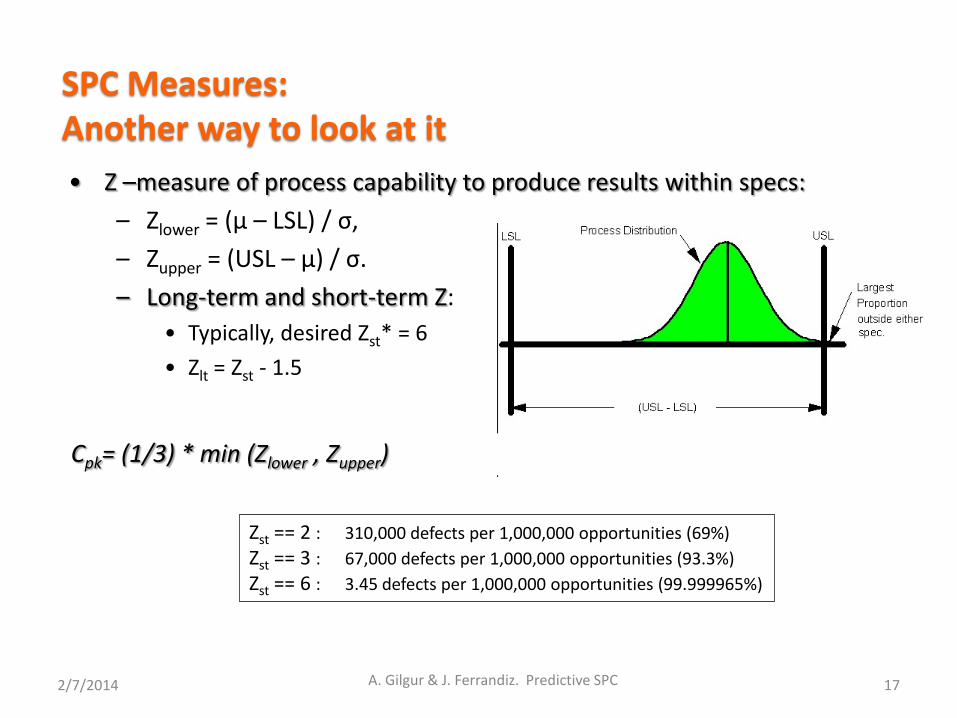
SPC Measures: Another way to look at it
• Z –measure of process capability to produce results within specs:
– Zlower = (μ – LSL) / σ,
– Zupper = (USL – μ) / σ.
– Long-term and short-term Z:
• Typically, desired Zst* = 6
• Zlt = Zst - 1.5
Zst == 2 : 310,000 defects per 1,000,000 opportunities (69%)
Zst == 3 : 67,000 defects per 1,000,000 opportunities (93.3%)
Zst == 6 : 3.45 defects per 1,000,000 opportunities (99.999965%)
A. Gilgur & J. Ferrandiz. Predictive SPC
Cpk= (1/3) * min (Zlower , Zupper)

Statistical Process Control
2/7/2014 18 A. Gilgur & J. Ferrandiz. Predictive SPC
• SPC = Statistical Process Control
• The Fishbone of SPC
• Traditional SPC
• Six Sigma
• Predictive SPC:
– Univariate
– Multivariate

Six Sigma
2/7/2014 19
http://www.isixsigma.com/
1. Define: i. End Goal ii. What to measure iii. How to measure
2. Measure: i. Gage R&R ii. Collect data
3. Analyze: i. Mean? Variance? Shape? All three? ii. Correlations
4. Improve: i. Design and Conduct Experiments ii. Analyze the results
5. Control: i. SPC ii. Education & Training iii. $avings
A. Gilgur & J. Ferrandiz. Predictive SPC
Statistical Process Control
2/7/2014 A. Gilgur & J. Ferrandiz. Predictive SPC 20
• SPC = Statistical Process Control
• The Fishbone of SPC
• Traditional SPC
• Six Sigma
• Why is it not Good Enough?
• Predictive SPC:
– Univariate
– Multivariate

2/7/2014 A. Gilgur & J. Ferrandiz. Predictive SPC 21
Why is SPC / Six Sigma not good enough?
Rapid growth New product introduction Agile Development R&D / Science … … …
Zst == 2 : 310,000 defects per 1,000,000 opportunities (69%)
Zst == 3 : 67,000 defects per 1,000,000 opportunities (93.3%)
Zst == 6 : 3.45 defects per 1,000,000 opportunities (99.999965%)
Manufacturing Mechanical / Chemical Semiconductor Food Pharmaceutical
Power Plants Traffic Engineering Customer Support … … …

2/7/2014 A. Gilgur & J. Ferrandiz. Predictive SPC 22
Why is SPC / Six Sigma not good enough?
Normal distribution Stationary processes Well defined LSL, Tgt, USL

Something like this:
2/7/2014 A. Gilgur & J. Ferrandiz. Predictive SPC
23
Or this:
A chemical process:
•Known Specifications •Unknown Dynamics •Non-stationary
A Data Center:
•Unknown Specifications •Somewhat known Dynamics •Non-stationary

Time 1. Forecast the metric 2. An alternative:
1. Observe the process 2. Is the measurement within predicted interval?
2/7/2014 24
Holt-Winters
ARIMA
Univariate Predictive SPC
… … …
A. Gilgur & J. Ferrandiz. Predictive SPC

Univariate Predictive SPC: what do we do?
Time
Time
Outlier? •Do nothing
Start of new pattern? •Reforecast
•The clock: •Continue from the beginning? •Reset at reforecast point?
When do we decide?
Process Dynamics Stationarity Distribution Dependencies

A Business Model
2/7/2014 A. Gilgur & J. Ferrandiz. Predictive SPC
26
Application DB
Makes sense to use parabola …
Traffic = # of units of work (worker threads in use) in the system
Little’s Law: Traffic = Arrival_rate * Processing_time
Arrival_Rate = a * BMI + b
Processing_time = c * Arrival_rate + d
Traffic = (a * BMI + b) * [c * (a * BMI + b) + d]
Traffic = f * BMI2 + g * BMI + h
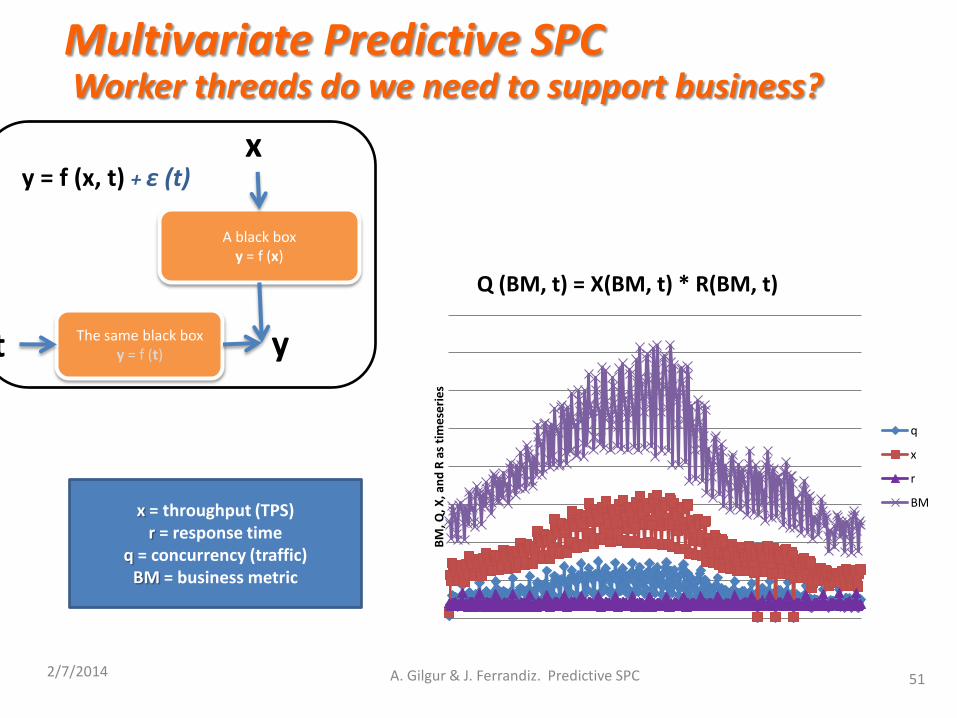
Multivariate Predictive SPC
x = throughput r = response time
q = # of worker threads BM = business metric

Quadratic fit…
2/7/2014
A. Gilgur & J. Ferrandiz. Predictive SPC
27
Application DB
Check the residuals
KPM ~ BMI2 + BMI
BMI (MCPS = millions clicks per second)
KP
M (
Co
ncu
rren
cy =
Un
its
of
Wo
rk in
th
e sy
stem
)

2/7/2014 A. Gilgur & J. Ferrandiz. Predictive SPC 28
Application DB
The curve fit is a-OK Outliers Patterns:
Top != Bulk != Bottom
Residuals…

What’s SPC got to do with it?
2/7/2014 A. Gilgur & J. Ferrandiz. Predictive SPC
29
Application DB
80 MCPS -> {290… 480} 100 MCPS -> {380… 600}
Quantile regression: • Independent top, bulk, bottom • A range of KPM for each slice of BM • Robust to outliers

80 MCPS -> {290… 480} 100 MCPS -> {380 … 600}
New data arrived
2/7/2014 A. Gilgur & J. Ferrandiz. Predictive SPC
30
Application DB
80 MCPS -> {420… 700} 100 MCPS -> {540… 800}

Packets ~ qps
Packets ~ qps
Another Example: How can we use this as a method?
2/7/2014 A. Gilgur & J. Ferrandiz. Predictive SPC
31
Baseline: @ 100 qps: M = 65 mln concurrent packets R = (30…110) mln concurrent packets
New Data: @ 100 qps: M = 63 mln concurrent packets R = (30…80) mln concurrent packets
Target
(LCL…UCL)
(LSL…USL)

“Knobs” to turn?
Specifications
Domain
Specs to adjust? Process Dynamics
Multivariate Predictive SPC: the general idea
2/7/2014 A. Gilgur & J. Ferrandiz. Predictive SPC
32
Data are NOT stationary Data are NOT normal “Processes behind data” are understood A general idea of “good” vs. “bad” behavior
oNO specifications is OK
Traffic = f * BMI2 + g * BMI + h
@BMI values of interest
“Processes behind data” CAN BE DESCRIBED MATHEMATICALLY Closed-form Monte-Carlo

How can we use it?
2/7/2014 A. Gilgur & J. Ferrandiz. Predictive SPC 33
Direct KPM-BMI link
ID degraded apps “Knobs” to turn?
Specifications
Domain
Specs to adjust? Process Dynamics

2/7/2014 A. Gilgur & J. Ferrandiz. Predictive SPC 34
•Artificial Intelligence •Predictive Analytics •Data Mining •Machine Learning 1968
2014
Predictive SPC
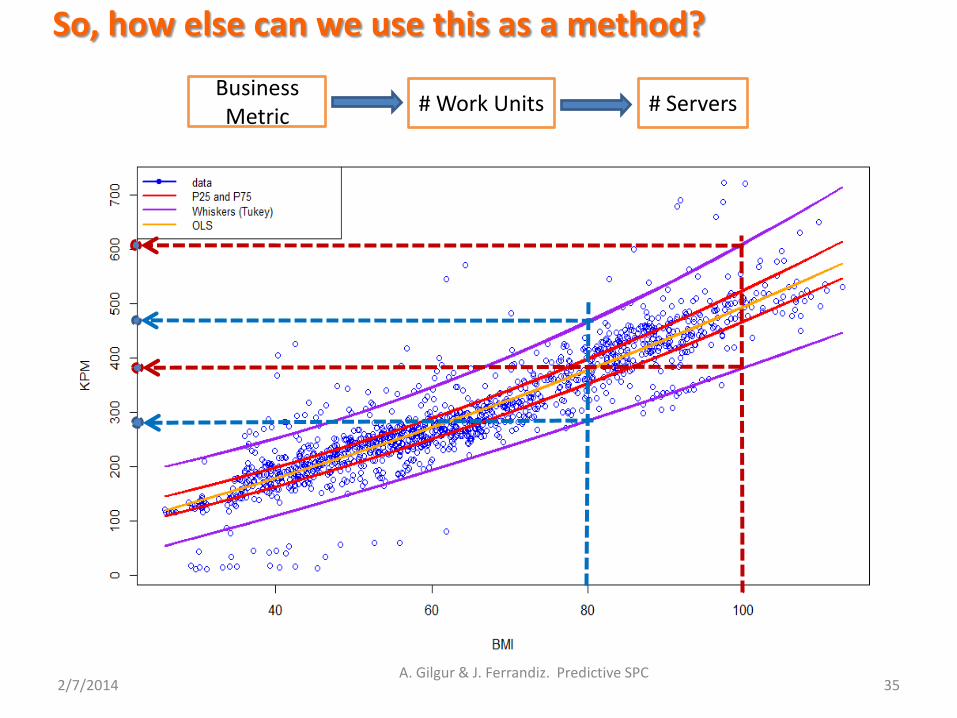
So, how else can we use this as a method?
2/7/2014 A. Gilgur & J. Ferrandiz. Predictive SPC
35
Business Metric
# Work Units # Servers
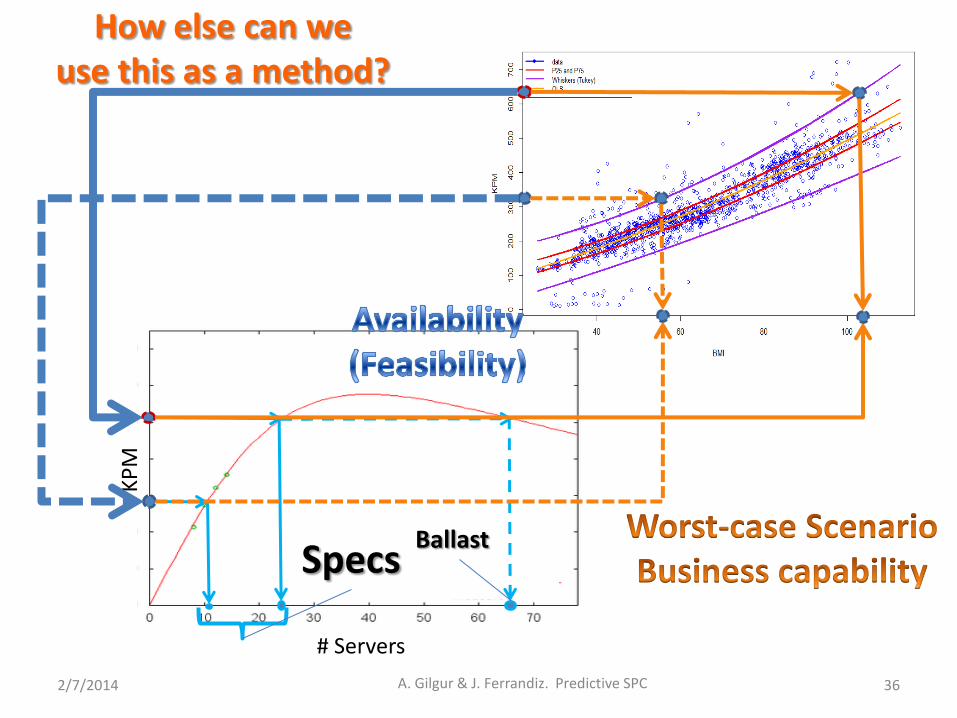
How else can we use this as a method?
2/7/2014 A. Gilgur & J. Ferrandiz. Predictive SPC 36
p
Universal Scalability Law
# Servers
KP
M
Specs Ballast

Summary • SPC Loop(s):
– The Why
– The What
– The How
• Six Sigma: – DMAIC
• Next Generation: – Predictive SPC
• Univariate Predictive SPC: Forecasting
• Multivariate Predictive SPC: Relationships among variables – A way to stay ahead of the curve
– Domain specific
– Process agnostic
– Expandable, Flexible, and Robust
– An extension of Traditional SPC
– Successfully implemented in IT
2/7/2014 A. Gilgur & J. Ferrandiz. Predictive SPC 37
“Knobs” to turn?
Specifications
Domain
Specs to adjust? Process Dynamics

Thank you!
2/7/2014 A. Gilgur & J. Ferrandiz. Predictive SPC 38
www.isixsigma.com
www.amstat.org
www.cmg.org
www.linkedin.com
http://alexonsimanddata.blogspot.com/
http://josepferrandiz.blogspot.com/
“Statistical thinking will one day be as necessary for
efficient citizenship as the ability to read and write.”
- H.G.Wells (1866-1946)

THANK YOU
2/7/2014 A. Gilgur & J. Ferrandiz. Predictive SPC 39

Appendix
• BACKUP SLIDES
2/7/2014 A. Gilgur & J. Ferrandiz. Predictive SPC 40

Traditional SPC
2/7/2014
A. Gilgur & J. Ferrandiz. Predictive SPC
41
HIGH
LOW
0
5
10
15
20
25
30
35
40
1 4 7 10 13 16 19 22 25 28 31 34 37 40 43 46 49 52 55 58 61 64 67 70 73 76 79 82 85 88 91 94 97 100 103 106 109 112 115 118 121
R
0 50 100 150 200 250 300 350 400 450 500
1
3
5
7
9
11
13
15
17
19
21
23
25
27
29
31
33
35
37
39
0 0.5 1 1.5 2 2.5 3 3.5 4
1
3
5
7
9
11
13
15
17
Date
Dai
ly A
vg.
TPS
0
10
20
30
40
50
60
70
1 4 7 10 13 16 19 22 25 28 31 34 37 40 43 46 49 52 55 58 61 64 67 70 73 76 79 82 85 88 91 94 97 100 103 106 109 112 115 118 121
HIGH
LOW
R
Date
Avg
. CP
U
uti
lizat
ion
, %

Alternatives: Entropy-based approach
2/7/2014 A. Gilgur & J. Ferrandiz. Predictive SPC
42
(IN A CLOSED SYSTEM)

2/7/2014 A. Gilgur & J. Ferrandiz. Predictive SPC
43
Entropy and probabilities
Boltzmann’s Entropy:
Shannon’s Entropy:
∆ H < 0 → external interaction detected
2/7/2014 44
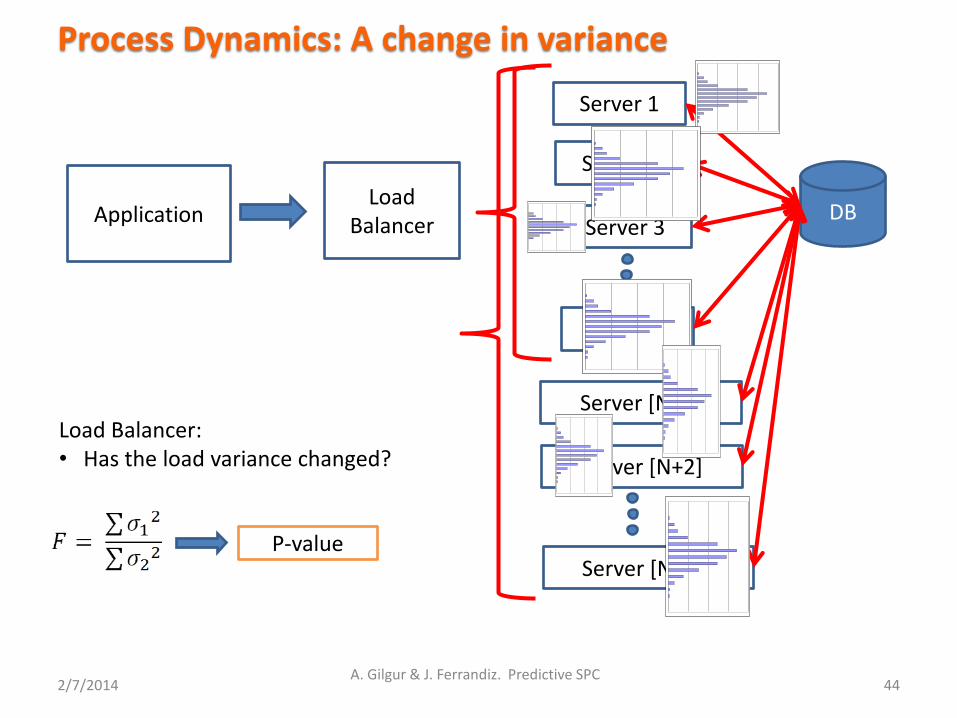
Process Dynamics: A change in variance
Application DB
Server 1
Server 2
Server 3
Server N
Load Balancer
Server [N+1]
Server [N+2]
Server [N + K]
Load Balancer: • Has the load variance changed?
P-value
A. Gilgur & J. Ferrandiz. Predictive SPC

2/7/2014 A. Gilgur & J. Ferrandiz. Predictive SPC
45
Practical Application: Load Balancer
Application DB
Server 1
Server 2
Server 3
Server N Load Balancer
Server [N+1]
Server [N+2]
Server [N + K]
P-value
Normal distribution Stationary processes
Xi: Server “i” got the transaction
wear and tear from within
External interaction
2/7/2014 A. Gilgur & J. Ferrandiz. Predictive SPC
46
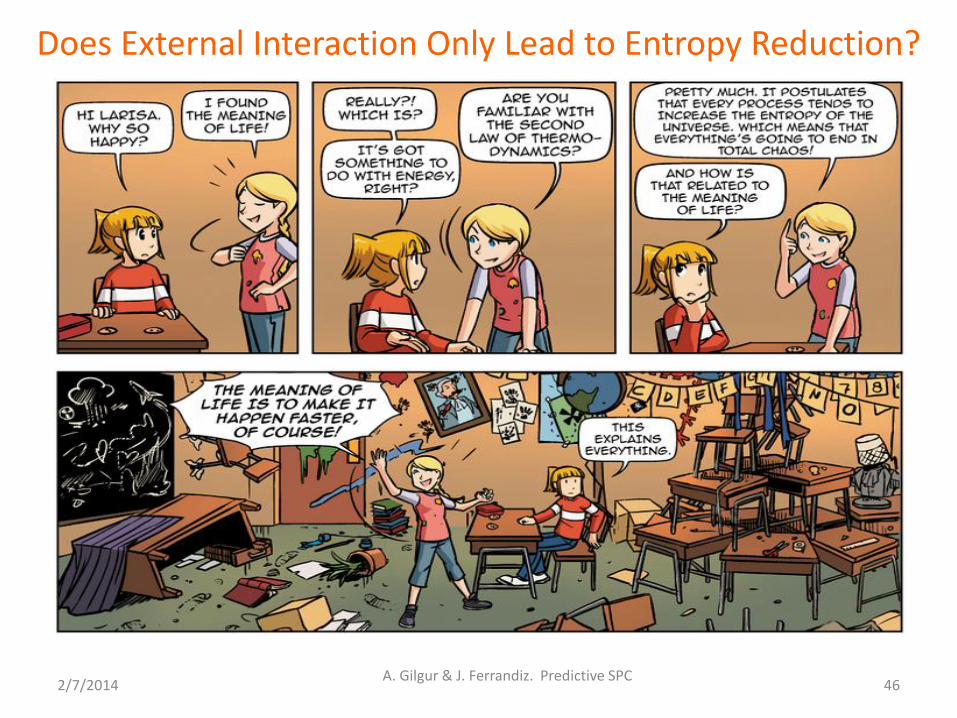
Does External Interaction Only Lead to Entropy Reduction?

Western Electric Rules
2/7/2014 A. Gilgur & J. Ferrandiz. Predictive SPC
47
http://en.wikipedia.org/wiki/Western_Electric_rules
http://en.wikipedia.org/wiki/Nelson_rules Nelson Rules

Neither normal nor stationary
2/7/2014 A. Gilgur & J. Ferrandiz. Predictive SPC 48
Is it a Memory Leak (runaway process)? Or is it expected behavior?

Why SPC?
• Because it’s cool
• Because it is logical
• Because we like to feel in control
• Because it saves $$
• Because we have the math all figured out
2/7/2014 A. Gilgur & J. Ferrandiz. Predictive SPC 49
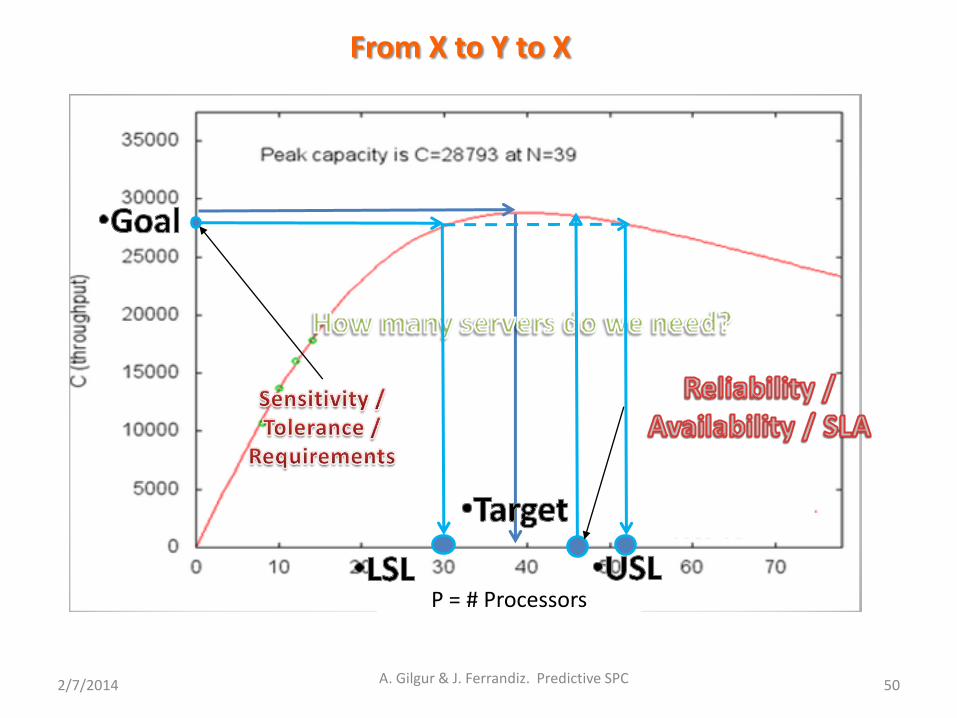
P = # Processors
From X to Y to X
2/7/2014 A. Gilgur & J. Ferrandiz. Predictive SPC 50
2/7/2014 51
A black box y = f (x)
x
The same black box y = f (t) t y
y = f (x, t) + ε (t)
BM
, Q, X
, an
d R
as
tim
ese
rie
s
Q (BM, t) = X(BM, t) * R(BM, t)
q
x
r
BM x = throughput (TPS)
r = response time q = concurrency (traffic)
BM = business metric
Worker threads do we need to support business?
A. Gilgur & J. Ferrandiz. Predictive SPC
Multivariate Predictive SPC