de beers in botswana
TRANSCRIPT
DE BEERS IN BOTSWANA
SITE VISIT – NOVEMBER 2016
1The De Beers Group of Companies
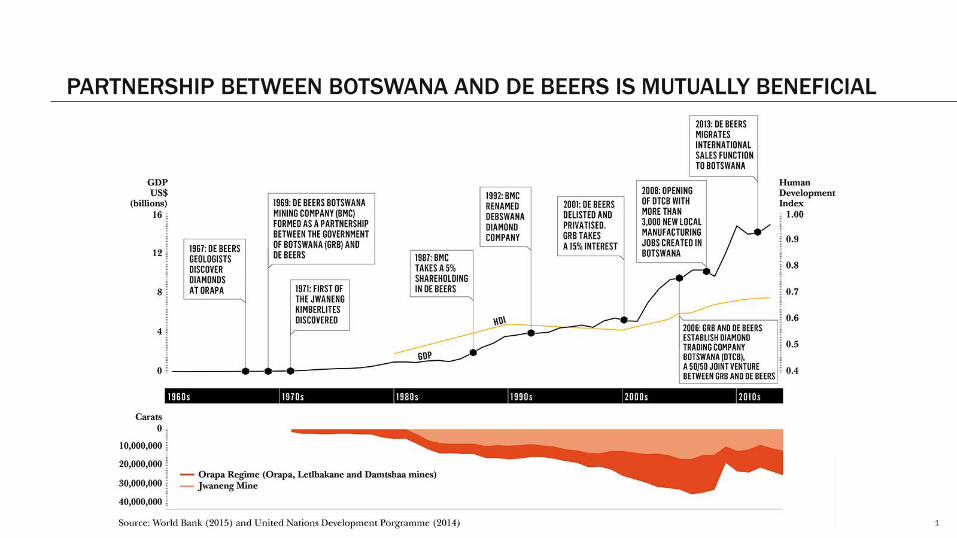
PARTNERSHIP BETWEEN BOTSWANA AND DE BEERS IS MUTUALLY BENEFICIAL
1
2The De Beers Group of Companies
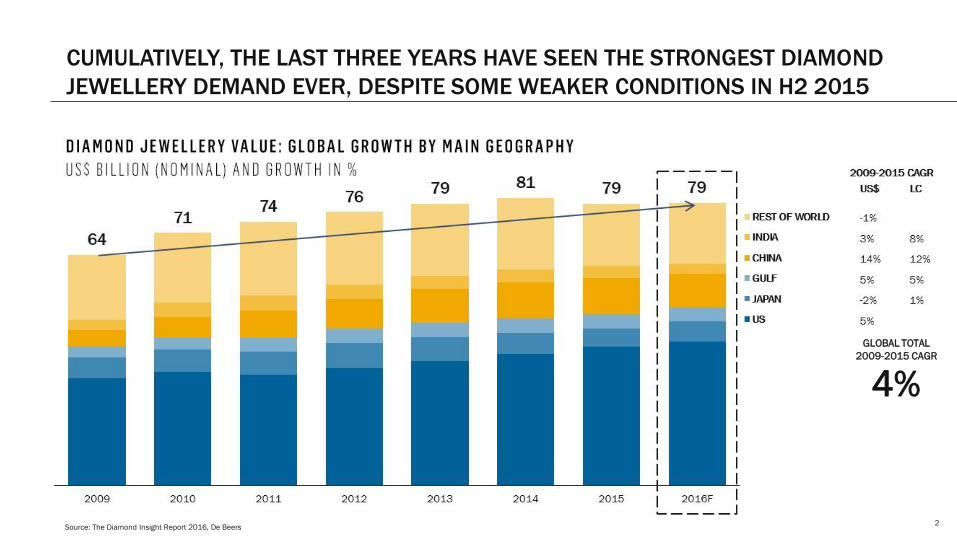
CUMULATIVELY, THE LAST THREE YEARS HAVE SEEN THE STRONGEST DIAMOND
JEWELLERY DEMAND EVER, DESPITE SOME WEAKER CONDITIONS IN H2 2015
2
4%
GLOBAL TOTAL
2009-2015 CAGR
Source: The Diamond Insight Report 2016, De Beers
3The De Beers Group of Companies
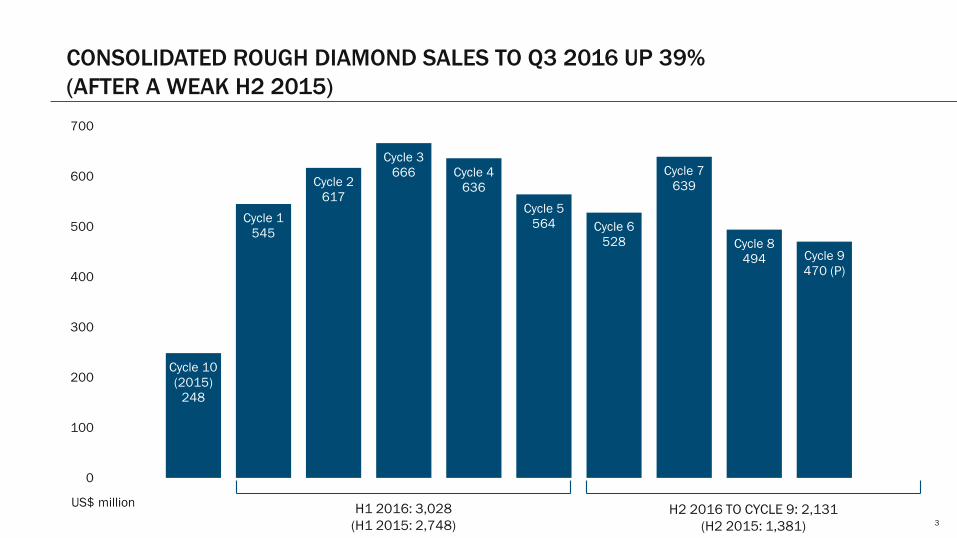
CONSOLIDATED ROUGH DIAMOND SALES TO Q3 2016 UP 39%
(AFTER A WEAK H2 2015)
Cycle 10
(2015)
248
Cycle 1
545
Cycle 2
617
Cycle 3
666 Cycle 4
636
Cycle 5
564 Cycle 6
528
Cycle 7
639
Cycle 8
494 Cycle 9
470 (P)
0
100
200
300
400
500
600
700
US$ millionH1 2016: 3,028
(H1 2015: 2,748)
H2 2016 TO CYCLE 9: 2,131
(H2 2015: 1,381) 3
4The De Beers Group of Companies
OUR FIVE KEY AREAS OF FOCUS
4
1 Enduring partnerships
2 Implementation of the operating model to
optimise cost and productivity
3 Innovation across the pipeline
4 Tailored consumer propositions
5 Attractive portfolio – profitable growth
options
5The De Beers Group of Companies
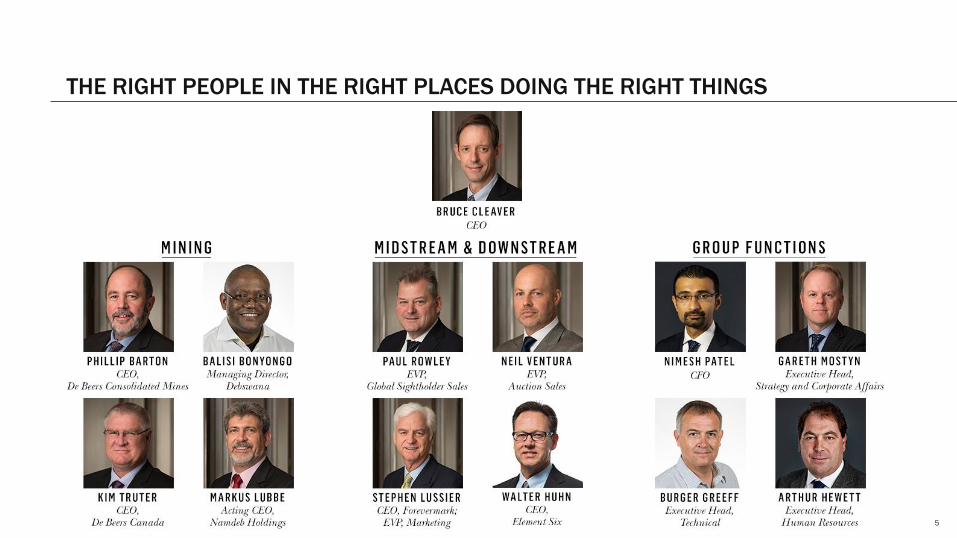
THE RIGHT PEOPLE IN THE RIGHT PLACES DOING THE RIGHT THINGS
5
6The De Beers Group of Companies
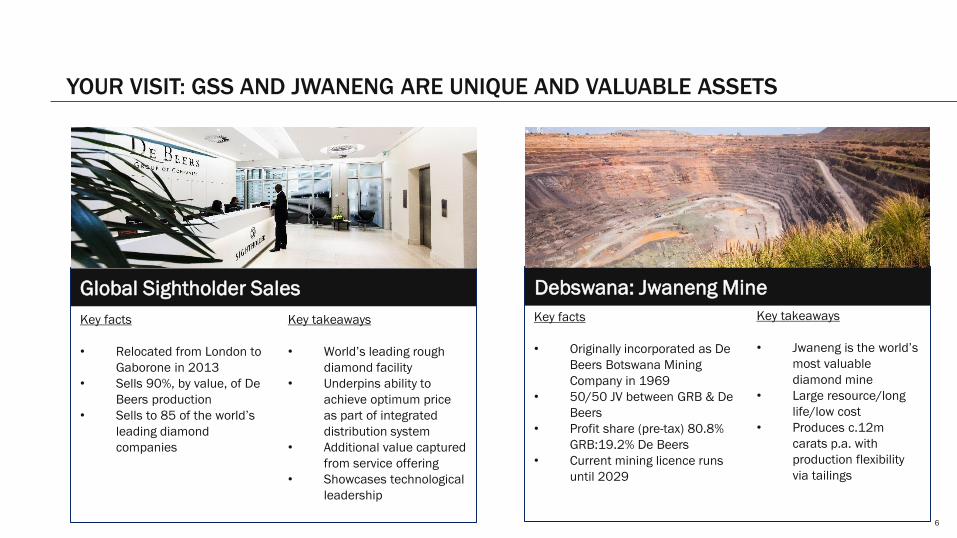
Global Sightholder Sales
YOUR VISIT: GSS AND JWANENG ARE UNIQUE AND VALUABLE ASSETS
Key facts
• Originally incorporated as De
Beers Botswana Mining
Company in 1969
• 50/50 JV between GRB & De
Beers
• Profit share (pre-tax) 80.8%
GRB:19.2% De Beers
• Current mining licence runs
until 2029
Key takeaways
• Jwaneng is the world’s
most valuable
diamond mine
• Large resource/long
life/low cost
• Produces c.12m
carats p.a. with
production flexibility
via tailings
Key facts
• Relocated from London to
Gaborone in 2013
• Sells 90%, by value, of De
Beers production
• Sells to 85 of the world’s
leading diamond
companies
Key takeaways
• World’s leading rough
diamond facility
• Underpins ability to
achieve optimum price
as part of integrated
distribution system
• Additional value captured
from service offering
• Showcases technological
leadership
6
Debswana: Jwaneng Mine
7The De Beers Group of Companies
APPENDIX
8The De Beers Group of Companies
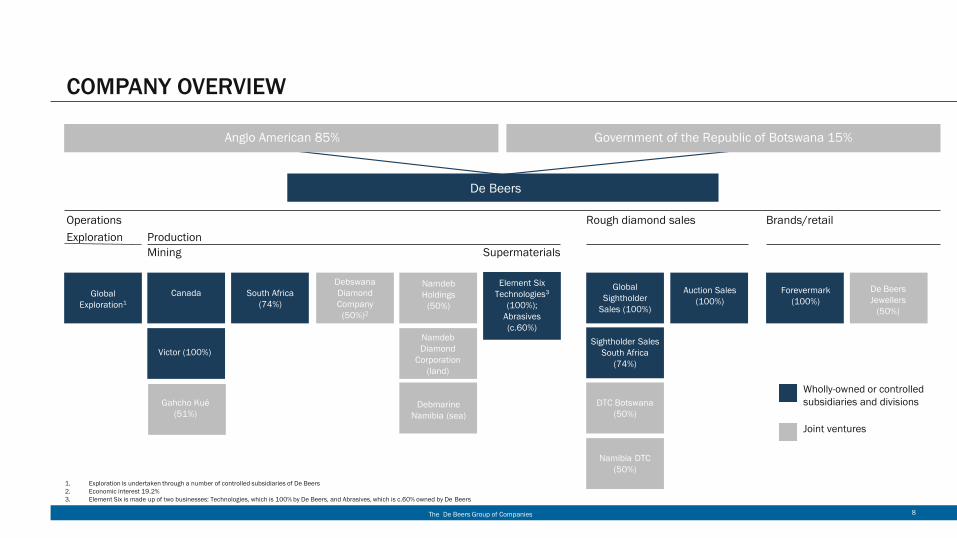
Anglo American 85% Government of the Republic of Botswana 15%
De Beers
Operations
Production
Mining Supermaterials
Rough diamond sales Brands/retail
Global
Exploration1
Canada South Africa
(74%)
Debswana
Diamond
Company
(50%)2
Namdeb
Holdings
(50%)
Namdeb
Diamond
Corporation
(land)
Debmarine
Namibia (sea)
Element Six
Technologies3
(100%);
Abrasives
(c.60%)
Global
Sightholder
Sales (100%)
Sightholder Sales
South Africa
(74%)
DTC Botswana
(50%)
Namibia DTC
(50%)
Auction Sales
(100%)
Forevermark
(100%)
De Beers
Jewellers
(50%)
Wholly-owned or controlled
subsidiaries and divisions
Joint ventures
1. Exploration is undertaken through a number of controlled subsidiaries of De Beers
2. Economic interest 19.2%
3. Element Six is made up of two businesses: Technologies, which is 100% by De Beers, and Abrasives, which is c.60% owned by De Beers
Exploration
Victor (100%)
Gahcho Kué
(51%)
COMPANY OVERVIEW
9The De Beers Group of Companies
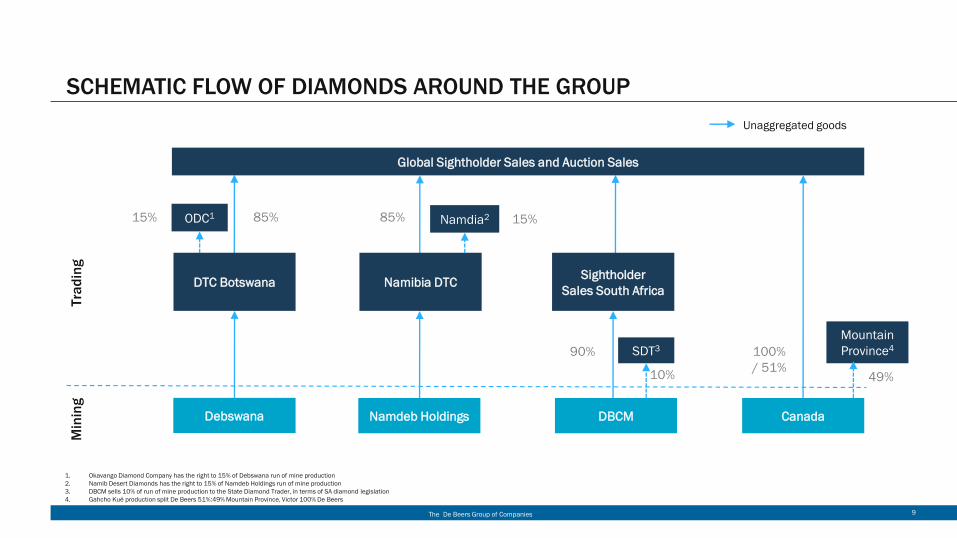
ODC1
De Beers Global Sightholder
Sales
Unaggregated goods
1. Okavango Diamond Company has the right to 15% of Debswana run of mine production
2. Namib Desert Diamonds has the right to 15% of Namdeb Holdings run of mine production
3. DBCM sells 10% of run of mine production to the State Diamond Trader, in terms of SA diamond legislation
4. Gahcho Kué production split De Beers 51%:49% Mountain Province, Victor 100% De Beers
Debswana Namdeb Holdings Canada
SDT3
85%15%
DBCM
Tra
din
gM
inin
g
Namibia DTCSightholder
Sales South AfricaDTC Botswana
Global Sightholder Sales and Auction Sales
90%
10%
Namdia2 15%85%
Mountain
Province4
49%
100%
/ 51%
SCHEMATIC FLOW OF DIAMONDS AROUND THE GROUP
10The De Beers Group of Companies
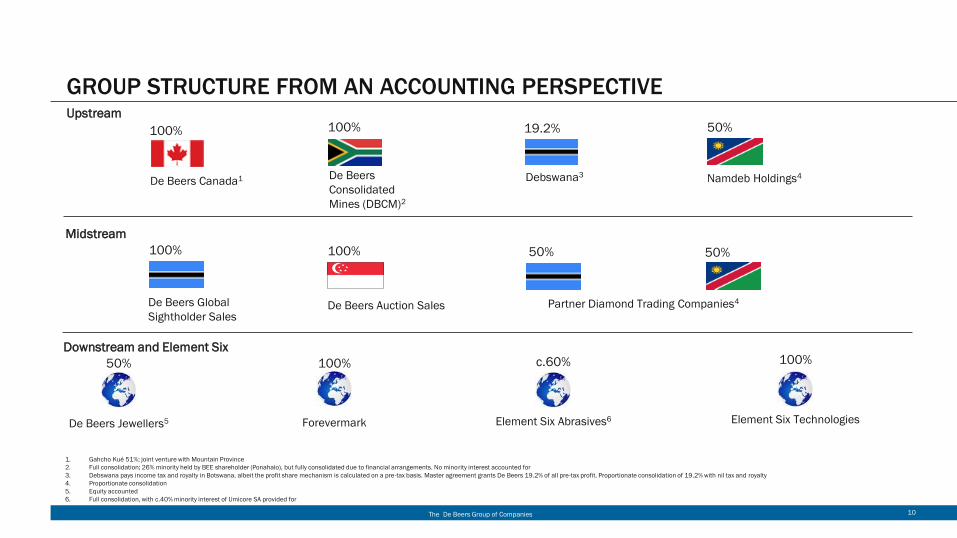
Upstream
1. Gahcho Kué 51%; joint venture with Mountain Province
2. Full consolidation; 26% minority held by BEE shareholder (Ponahalo), but fully consolidated due to financial arrangements. No minority interest accounted for
3. Debswana pays income tax and royalty in Botswana, albeit the profit share mechanism is calculated on a pre-tax basis. Master agreement grants De Beers 19.2% of all pre-tax profit. Proportionate consolidation of 19.2% with nil tax and royalty
4. Proportionate consolidation
5. Equity accounted
6. Full consolidation, with c.40% minority interest of Umicore SA provided for
De Beers
Consolidated
Mines (DBCM)2
100%
De Beers Canada1
100%
Namdeb Holdings4
50%19.2%
Debswana3
Midstream
Downstream and Element Six
50%
De Beers Jewellers5
100%
Forevermark
c.60%
Element Six Abrasives6
100%
Element Six Technologies
100%
De Beers Global
Sightholder Sales
100%
De Beers Auction Sales
50%
Partner Diamond Trading Companies4
50%
GROUP STRUCTURE FROM AN ACCOUNTING PERSPECTIVE
11The De Beers Group of Companies
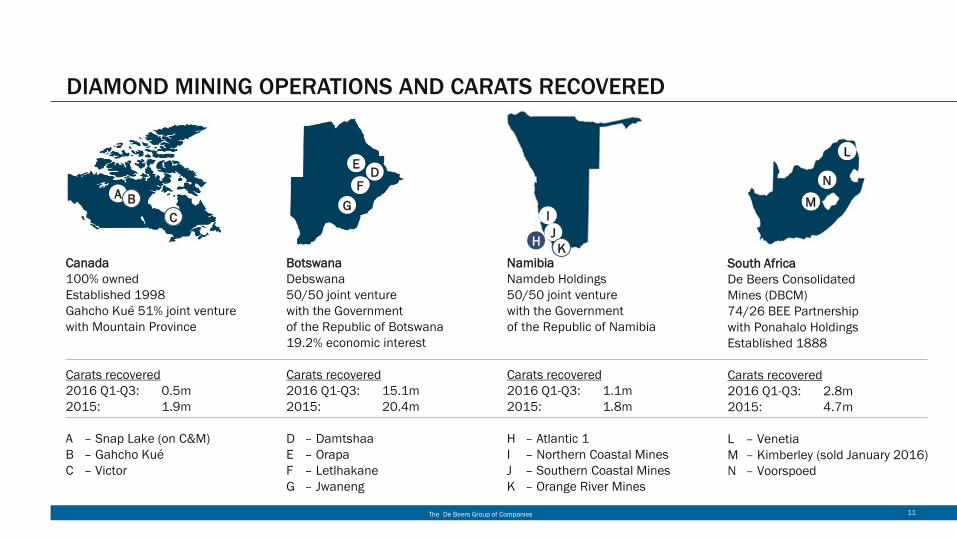
Canada
100% owned
Established 1998
Gahcho Kué 51% joint venture
with Mountain Province
Carats recovered
2016 Q1-Q3: 0.5m
2015: 1.9m
A – Snap Lake (on C&M)
B – Gahcho Kué
C – Victor
Botswana
Debswana
50/50 joint venture
with the Government
of the Republic of Botswana
19.2% economic interest
Carats recovered
2016 Q1-Q3: 15.1m
2015: 20.4m
D – Damtshaa
E – Orapa
F – Letlhakane
G – Jwaneng
South Africa
De Beers Consolidated
Mines (DBCM)
74/26 BEE Partnership
with Ponahalo Holdings
Established 1888
Carats recovered
2016 Q1-Q3: 2.8m
2015: 4.7m
L – Venetia
M – Kimberley (sold January 2016)
N – Voorspoed
A B
C
DE
F
G
H
I
J
K
L
M
N
DIAMOND MINING OPERATIONS AND CARATS RECOVERED
Namibia
Namdeb Holdings
50/50 joint venture
with the Government
of the Republic of Namibia
Carats recovered
2016 Q1-Q3: 1.1m
2015: 1.8m
H – Atlantic 1
I – Northern Coastal Mines
J – Southern Coastal Mines
K – Orange River Mines

12The De Beers Group of Companies
Notes:
For further information refer to the Anglo American Ore Reserves and Mineral Resources Report 2015.
Due to the uncertainty that may be attached to some Inferred Diamond Resources, it cannot be assumed that all or part of an Inferred Diamond Resource will necessarily be upgraded to an Indicated or Measured Diamond Resource after continued exploration.1 Grade is quoted as carats per hundred metric tonnes (cpht). 2 Grade is quoted as carats per square metre (cpm2).
DIAMOND RESOURCE AND RESERVE ESTIMATES AS AT 31 DECEMBER 2015
Selected De Beers Assets % De Beers
Ownership
Classification EXCLUSIVE
Diamond Resource Estimates
as at 31 December 2015
Diamond Reserve Estimates
as at 31 December 2015
Tonnes
(Mt)
Carats
(Mc)
Grade1
(cpht)
BCO1
(mm)
Treated
Tonnes
(Mt)
Saleable
Carats
(Mc)
Recovered
Grade1
(cpht)
BCO
(mm)
LOM years
Gahcho Kué (OP) 51 Indicated 2.3 3.2 137.1 1.00 33.8 52.0 153.8 1.00 13
Inferred 12.9 18.1 140.6 1.00
Victor (OP) 100 Indicated 0.4 0.1 23.8 1.50 4.3 0.7 16.8 1.50 3
Inferred 2.8 0.6 22.8 1.50
Venetia (OP) 100 Indicated 0.1 0.1 148.6 1.00 25.8 28.7 111.3 1.00 31 (OP&UG)
Inferred 20.3 3.4 16.9 1.00
Venetia (UG) 100 Indicated - - - - 92.9 71.8 77.2 1.00 31 (OP&UG)
Inferred 69.9 59.6 85.3 1.00
Debswana Jwaneng (OP), 50 Indicated 129.5 138.8 107.2 1.47 113.0 149.2 132.0 1.47 20
Inferred 85.7 68.7 80.3 1.47
Debswana Orapa (OP) 50 Indicated 292.4 298.8 102.2 1.65 171.9 151.4 88.0 1.65 14
Inferred 77.6 66.2 85.3 1.65
Area
(k m²)
Carats
(kc)
Grade²
(cpm²)
BCO1
(mm)
Area
(k m²)
Saleable
Carats
(kc)
Recovered
Grade²
(cpm²)
BCO
(mm)
LOM years
Namdeb Holdings – Atlantic 1 (MM) 50 Indicated 108,175 7,302 0.07 1.47 43,866 3,933 0.09 1.47 20
Inferred 1,080,989 88,226 0.08 1.47

13The De Beers Group of Companies
Unless otherwise stated, tonnage is quoted as dry metric tonnes. Estimates of Diamond Reserve tonnes reflect the tonnage to be treated.
Reported Diamond Reserves/Resources are based on a Bottom Cut Off (BCO) which refers to the bottom screen size aperture and varies between 1.00mm and 3.00mm
(nominal square mesh).
The estimates reported represent 100% of the Diamond Reserves and Diamond Resources.
Diamond Resources are reported as additional to Diamond Reserves.
The Canadian Diamond Reserve and Diamond Resource estimates are reported in accordance with the Canadian Institute of Mining and Metallurgy (CIM) Definition
Standards on Mineral Resources and Mineral Reserves.
The Southern African Diamond Reserve and Diamond Resource estimates are reported in accordance with The South African Code for the Reporting of Exploration
Results, Mineral Resources and Mineral Reserves (The SAMREC Code, 2007 Edition as amended July 2009).
LoM = Life of Mine (years) is based on scheduled Probable Reserves including Indicated and some Inferred Resources considered for Life of Mine planning.
OP = Open Pit; UG = Underground; MM = Marine Mining; Mt = Million tonnes; Kt = Thousand tonnes; k m2 = thousand square metres
Projects
Jwaneng Cut 8
The Life of Mine Plan approved in 2015 includes the Cut-8 estimates of 84 Mt of material to be treated containing an estimated 93 M¢ (North, Centre and South Pipes,
excluding the 4th Pipe which is mined as part of waste stripping and stockpiled).
Venetia Underground
The project is expected to treat approximately 132 Mt of material containing an estimated 94 M¢. Scheduled Inferred Resources (39.5 Mt) constitute 24% (22.4 M¢) of
the estimated carats. These estimates are scheduled tonnes and carats as per the Life of Mine Plan approved in 2015.
Gahcho Kué
The project is expected to treat approximately 35 Mt of material containing an estimated 54 M¢ (100% basis). Scheduled Inferred Resources (1.2 Mt) constitute 2.7%
(1.5 M¢) of the estimated carats. The estimates are scheduled tonnes and carats as per the Life of Mine Plan approved in 2015.
DIAMOND RESOURCE AND RESERVE ESTIMATES AS AT 31 DECEMBER 2015:
EXPLANATORY NOTES
14The De Beers Group of Companies
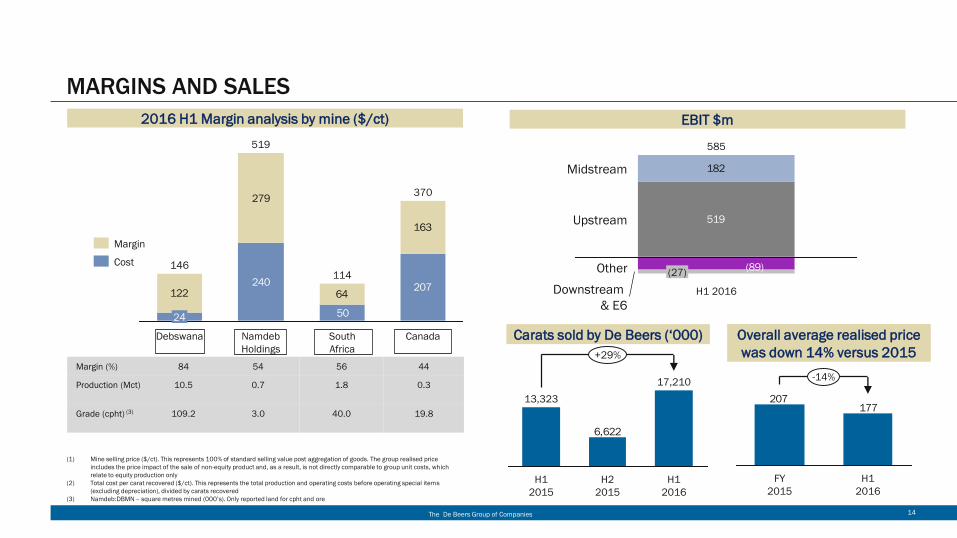
2016 H1 Margin analysis by mine ($/ct)
240207
122
279
64
163
50
Canada
370
114
South
Africa
Namdeb
Holdings
519
Debswana
146
24
Margin (%) 84 54 56 44
Production (Mct) 10.5 0.7 1.8 0.3
Grade (cpht) (3) 109.2 3.0 40.0 19.8
Cost
Margin
(1) Mine selling price ($/ct). This represents 100% of standard selling value post aggregation of goods. The group realised price
includes the price impact of the sale of non-equity product and, as a result, is not directly comparable to group unit costs, which
relate to equity production only
(2) Total cost per carat recovered ($/ct). This represents the total production and operating costs before operating special items
(excluding depreciation), divided by carats recovered
(3) Namdeb:DBMN – square metres mined (000’s). Only reported land for cpht and ore
(89)
519
182
Downstream
& E6
Midstream
Upstream
Other (27)
H1 2016
585
EBIT $m
6,622
+29%
H1
2016
17,210
H2
2015
H1
2015
13,323
Carats sold by De Beers (‘000)
177207
H1
2016
FY
2015
-14%
Overall average realised price
was down 14% versus 2015
MARGINS AND SALES
15The De Beers Group of Companies
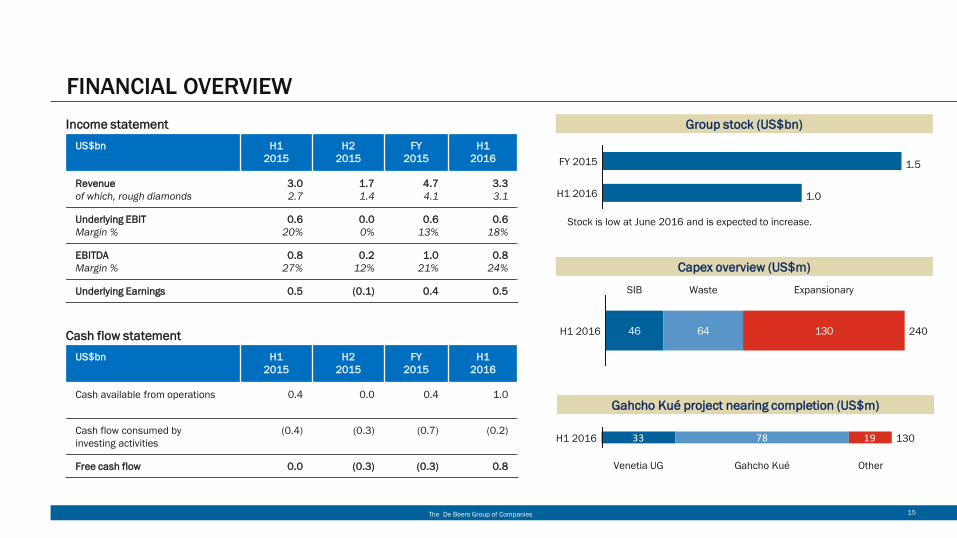
US$bn H1
2015
H2
2015
FY
2015
H1
2016
Revenue
of which, rough diamonds
3.0
2.7
1.7
1.4
4.7
4.1
3.3
3.1
Underlying EBIT
Margin %
0.6
20%
0.0
0%
0.6
13%
0.6
18%
EBITDA
Margin %
0.8
27%
0.2
12%
1.0
21%
0.8
24%
Underlying Earnings 0.5 (0.1) 0.4 0.5
US$bn H1
2015
H2
2015
FY
2015
H1
2016
Cash available from operations 0.4 0.0 0.4 1.0
Cash flow consumed by
investing activities
(0.4) (0.3) (0.7) (0.2)
Free cash flow 0.0 (0.3) (0.3) 0.8
Income statement
Cash flow statement
Capex overview (US$m)
33 78 19
Venetia UG Gahcho Kué Other
H1 2016 130
Gahcho Kué project nearing completion (US$m)
46 64 130 240H1 2016
SIB ExpansionaryWaste
Group stock (US$bn)
Stock is low at June 2016 and is expected to increase.
1.0
1.5
H1 2016
FY 2015
FINANCIAL OVERVIEW
16The De Beers Group of Companies
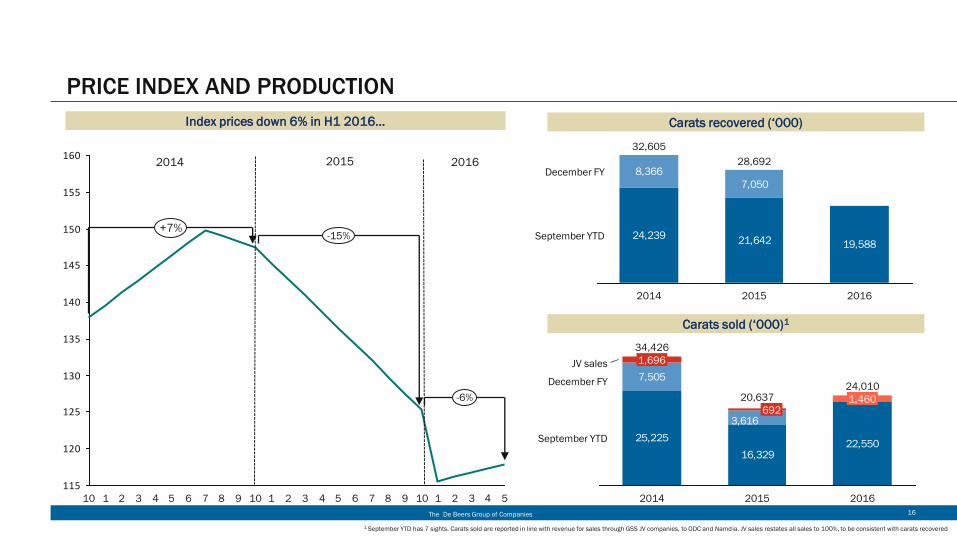
Index prices down 6% in H1 2016…
18.1
15.2
115
120
125
130
135
140
145
150
155
160
5432110
-6%
-15%+7%
7 987654 54321106 3211098
232
Carats recovered (‘000)
Carats sold (‘000)1
24,23921,642
8,366
7,050
19,588September YTD
December FY
20162015
28,692
2014
32,605
25,225
16,32922,550
7,505
3,616
34,426
1,696JV sales
December FY
September YTD
2016
24,010
1,460
2015
20,637
692
2014
1 September YTD has 7 sights. Carats sold are reported in line with revenue for sales through GSS JV companies, to ODC and Namdia. JV sales restates all sales to 100%, to be consistent with carats recovered
PRICE INDEX AND PRODUCTION
20152014 2016
17The De Beers Group of Companies
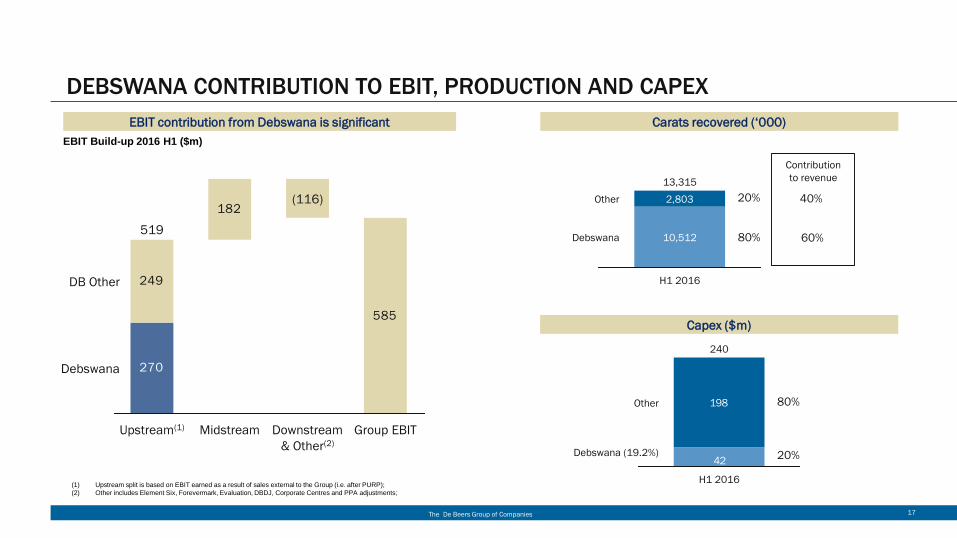
DEBSWANA CONTRIBUTION TO EBIT, PRODUCTION AND CAPEX
EBIT contribution from Debswana is significant Carats recovered (‘000)
Capex ($m)
(1) Upstream split is based on EBIT earned as a result of sales external to the Group (i.e. after PURP);
(2) Other includes Element Six, Forevermark, Evaluation, DBDJ, Corporate Centres and PPA adjustments;
270
249
182
585
Debswana
DB Other
Group EBITDownstream
& Other(2)
(116)
MidstreamUpstream(1)
519
EBIT Build-up 2016 H1 ($m)
42
198Other
H1 2016
Debswana (19.2%)
240
80%
20%
Debswana
Other
H1 2016
13,315
10,512
2,803 20%
80%
Contribution
to revenue
40%
60%