delineating shallow neogene deformation structures in ... · delineating shallow neogene...
TRANSCRIPT
Anais da Academia Brasileira de Ciências (2003) 75(2): 235-248(Annals of the Brazilian Academy of Sciences)ISSN 0001-3765www.scielo.br/aabc
Delineating shallow Neogene deformation structures innortheastern Pará State using Ground Penetrating Radar
DILCE F. ROSSETTI
Museu Paraense Emílio Goeldi, Coordenação de Pesquisas e Pós-GraduaçãoCx. Postal 399, 66077-530 Belém, PA, Brasil
Manuscript received on March 26, 2002; accepted for publication on March 7, 2003;
presented by Alcides N. Sial
ABSTRACT
The geological characterization of shallow subsurface Neogene deposits in northeastern Pará State using
Ground Penetrating Radar (GPR) revealed normal and reverse faults, as well as folds, not yet well documented
by field studies. The faults are identified mostly by steeply-dipping reflections that sharply cut the nearby
reflections causing bed offsets, drags and rollovers. The folds are recognized by reflections that are highly
undulating, configuring broad concave and convex-up features that are up to 50 m wide and 80 to 90 ns deep.
These deformation structures are mostly developed within deposits of Miocene age, though some of the faults
might continue into younger deposits as well. Although the studied GPR sections show several diffractions
caused by trees, differential degrees of moisture, and underground artifacts, the structures recorded here can
not be explained by any of these “noises”. The detailed analysis of the GPR sections reveals that they are
attributed to bed distortion caused by brittle deformation and folding. The record of faults and folds are not
widespread in the Neogene deposits of the Bragantina area. These GPR data are in agreement with structural
models, which have proposed a complex evolution including strike-slip motion for this area from the Miocene
to present.
Key words: Neogene, northeastern Pará State, Ground Penetrating Radar, tectonics, sedimentary rocks.
INTRODUCTION
There are numerous works illustrating the applica-
tion of Ground Penetrating Radar (GPR) to increase
stratigraphic and facies data collection in shallow
surface throughout the world (e.g., Bridge et al.
1995, Stephens 1994, Bristow 1995, Van Heteren
et al. 1998, Dagallier et al. 2000). In particular,
this methodology has been successfully applied for
mapping of facies and stratigraphic surfaces of Neo-
gene deposits in northeastern Pará State, providing
more detailed information to reconstruct the deposi-
Correspondence to: Dilce F. RossettiE-mail: [email protected]
tional environments and understand their evolution
through time (Rossetti and Góes 2001 a,b,c, Fig. 1).
The GPR experiments conducted in this area have
led to image some intriguing features recorded by
reflection distortions, which are the subject of this
paper. It is well known that the interpretation of GPR
profiles might be biased due to diffractions caused by
above-ground objects (trees, metallic fences, power
lines, buildings, etc.), as well as buried objects
(e.g., underground utility lines, storage tanks), and
even differences in moisture (Roberts et al. 1991,
Asprion 1998, Bano et al. 2000). These elements
might cause noises and interfere with true reflec-
An Acad Bras Cienc (2003)75 (2)
236 DILCE F. ROSSETTI
tions, representing a major problem during GPR in-
terpretation. The reflection distortions observed in
the study area can not be attributed to noises, but
reflect more probably tectonic deformation. The
record of faults and fractures in Cenozoic deposits of
the Bragantina Zone is not new (Katzer 1933, Ack-
ermann 1964). Tectonic models combining normal
and strike-slip faults have been proposed for this area
(Igreja et al. 1990, Costa et al. 2001). These studies
are mostly based on the analysis of drainage systems
and morphological aspects of coastal cliffs, while
geological field evidence remains inadequate to test
the models. Actually, the available outcrops, mostly
including isolated coastal cliffs and limestone quar-
ries, show dominantly horizontal deposits, though
bed tilting in the order of 20◦ to 60◦ has been also
reported (Costa et al. 1993). The GPR revealed to be
a technique of great use to prospect subsurface fault
and fracture segments in Neogene deposits of the
Bragantina Zone. It also helped to reveal features
that suggest the presence of folds, not yet recorded
in these deposits. Based on the results obtained in
this investigation, the use of GPR provides an al-
ternative technique for imaging large-scale defor-
mation structures in shallow Neogene deposits in
northeastern Pará State, improving the knowledge
of its tectono-sedimentary history.
MATERIALS AND METHODS
The GPR operates with emission of high frequency
(10 to 2500 Mhz) electromagnetic waves in the
ground for detecting material variations. Several pa-
pers discuss in detail the basic theory of GPR (e.g.,
Moffat and Puskar 1976, Fisher et al. 1992, Asprion
1998). The GPR system used in this field survey was
a Geophysical Survey Systems, Inc. Model SIR-2,
with monostatic antenna of 200 Mhz frequency and
slow walking pace. The system uses a 12-V battery,
and it was run in a continuous recording mode, with
a two-way travel time setting averaging 150 ns with
512 samples per scan. Although Common Mid Point
tests were not carried out in the study area, calibra-
tion with outcrop data led to an estimated depth in-
vestigation of 12 m. Horizontal surface control was
made by the addition of markers every 50 m dur-
ing data acquisition. The sections presented in this
paper did not require topographic correction, given
the flat nature of the study area at the sea level. To
improve the image quality, the GPR profiles were
analyzed using a RADAN software with the least
processing including gain correction and application
of filters with Finite Impulse Response to remove
bands of ringing and high frequency (“snow”) noises
and to enhance low frequency reflections. The same
filters were used in all GPR profiles illustrated in
this paper in order to allow a comparison of GPR
facies characteristics.
GEOLOGICAL BACKGROUND
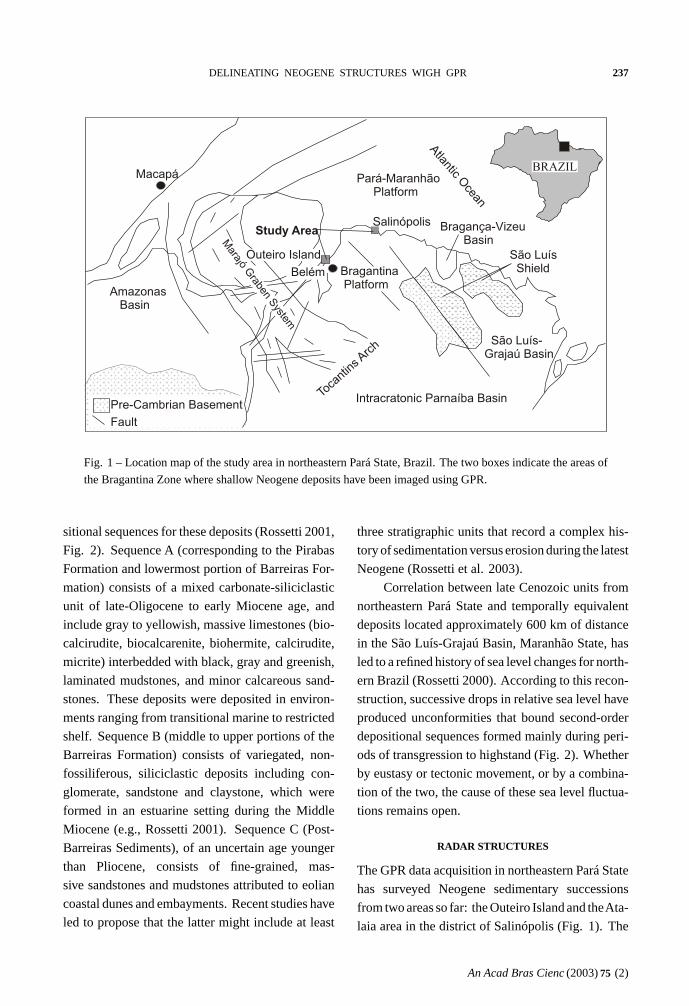
The Bragantina Zone is located in an area that has
been undergone to a complex tectonic deformation
since the initial continental break up in the Early
Cretaceous that culminated with the origin of the
South Atlantic Ocean. The area is bounded by the
Marajó Graben System to the northwest and west,
the Bragança-Viseu and São Luís-Grajaú Basin to
the southeast, and the Pará-Maranhão Platform to
the north. Although it represents a stable area com-
pared to the strongly extended and strike-slip de-
formed adjacent areas, studies have shown that the
Bragantina Zone had also a complex tectonic evolu-
tion through the Tertiary and on (Igreja et al. 1990,
Costa et al. 1993). According to these authors,
two sets of features characterize this area: northeast
dipping normal faults developed during Late Ter-
tiary; and northeast-southwest and east-west strike-
slip faults linked by northwest-southeast normal
faults of Pleistocene to Holocene age.
Previous studies combining fieldwork with
GPR data has helped to improve our knowledge re-
lated to the paleoenvironmental and stratigraphic
framework of Neogene deposits in northeastern Pará
State and to analyze them within the context of sea
level changes (Rossetti et al. 1989, 1990, Rossetti
2001, Rossetti and Góes 2001 a,b,c). Mapping of re-
gional unconformities has led to propose three depo-
An Acad Bras Cienc (2003)75 (2)
DELINEATING NEOGENE STRUCTURES WIGH GPR 237
BRAZIL
Bragança-Vizeu Basin
Intracratonic Parnaíba Basin
Amazonas Basin
Toca
ntin
s Arc
h São Luís-Grajaú Basin
São Luís Shield
Pará-Maranhão Platform
Atlantic O
cean
Macapá
Marajó G
raben System
Study Area
Pre-Cambrian Basement
Fault
Salinópolis
Bragantina Platform
Outeiro Island
Belém
Fig. 1 – Location map of the study area in northeastern Pará State, Brazil. The two boxes indicate the areas of
the Bragantina Zone where shallow Neogene deposits have been imaged using GPR.
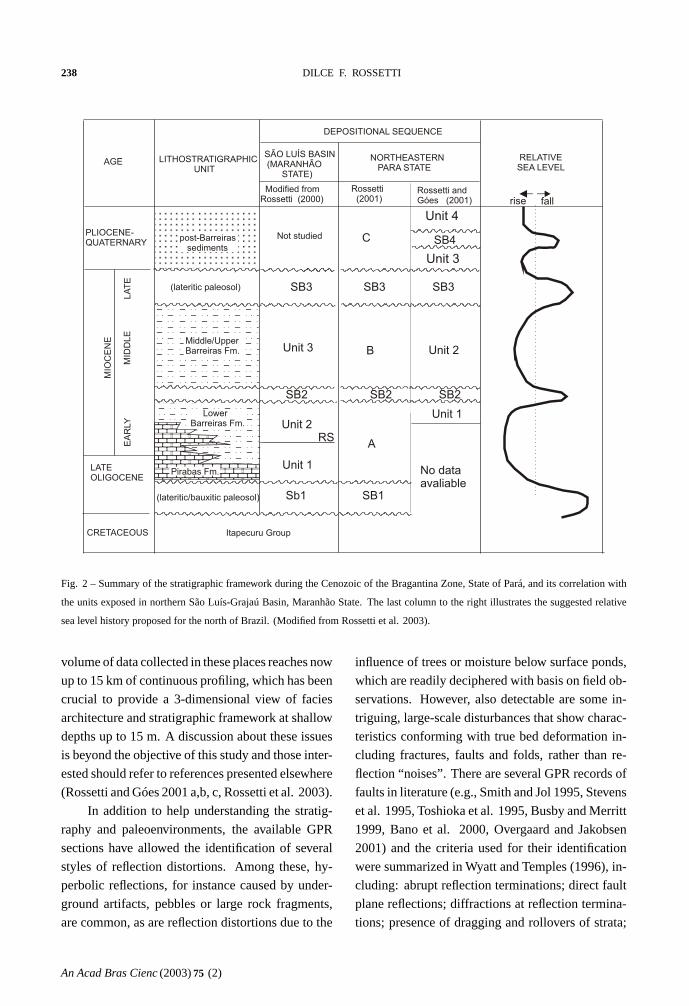
sitional sequences for these deposits (Rossetti 2001,
Fig. 2). Sequence A (corresponding to the Pirabas
Formation and lowermost portion of Barreiras For-
mation) consists of a mixed carbonate-siliciclastic
unit of late-Oligocene to early Miocene age, and
include gray to yellowish, massive limestones (bio-
calcirudite, biocalcarenite, biohermite, calcirudite,
micrite) interbedded with black, gray and greenish,
laminated mudstones, and minor calcareous sand-
stones. These deposits were deposited in environ-
ments ranging from transitional marine to restricted
shelf. Sequence B (middle to upper portions of the
Barreiras Formation) consists of variegated, non-
fossiliferous, siliciclastic deposits including con-
glomerate, sandstone and claystone, which were
formed in an estuarine setting during the Middle
Miocene (e.g., Rossetti 2001). Sequence C (Post-
Barreiras Sediments), of an uncertain age younger
than Pliocene, consists of fine-grained, mas-
sive sandstones and mudstones attributed to eolian
coastal dunes and embayments. Recent studies have
led to propose that the latter might include at least
three stratigraphic units that record a complex his-
tory of sedimentation versus erosion during the latest
Neogene (Rossetti et al. 2003).
Correlation between late Cenozoic units from
northeastern Pará State and temporally equivalent
deposits located approximately 600 km of distance
in the São Luís-Grajaú Basin, Maranhão State, has
led to a refined history of sea level changes for north-
ern Brazil (Rossetti 2000). According to this recon-
struction, successive drops in relative sea level have
produced unconformities that bound second-order
depositional sequences formed mainly during peri-
ods of transgression to highstand (Fig. 2). Whether
by eustasy or tectonic movement, or by a combina-
tion of the two, the cause of these sea level fluctua-
tions remains open.
RADAR STRUCTURES
The GPR data acquisition in northeastern Pará State
has surveyed Neogene sedimentary successions
from two areas so far: the Outeiro Island and theAta-
laia area in the district of Salinópolis (Fig. 1). The
An Acad Bras Cienc (2003)75 (2)
238 DILCE F. ROSSETTI
AGE
DEPOSITIONAL SEQUENCE
LATEOLIGOCENE
LowerBarreiras Fm.
Pirabas Fm.
Middle/UpperBarreiras Fm.
post-Barreiras sediments
Itapecuru Group
MID
DL
ELA
TE
EA
RLY
MIO
CE
NE
PLIOCENE-QUATERNARY
(lateritic paleosol)
(lateritic/bauxitic paleosol)
CRETACEOUS
LITHOSTRATIGRAPHICUNIT
Rossetti(2001)
Modified fromRossetti (2000)
Sb1
RS
SB3
SB2
Unit 1
Unit 2
SÃO LUÍS BASIN (MARANHÃO
STATE)
NORTHEASTERN PARA STATE
Rossetti andGóes (2001)
SB3
SB2
SB1
C
B
A
fallrise
RELATIVESEA LEVEL
Unit 4
Unit 3
Unit 2
Unit 1
No dataavaliable
Unit 3
SB2
SB4
SB3
Not studied
Fig. 2 – Summary of the stratigraphic framework during the Cenozoic of the Bragantina Zone, State of Pará, and its correlation with
the units exposed in northern São Luís-Grajaú Basin, Maranhão State. The last column to the right illustrates the suggested relative
sea level history proposed for the north of Brazil. (Modified from Rossetti et al. 2003).
volume of data collected in these places reaches now
up to 15 km of continuous profiling, which has been
crucial to provide a 3-dimensional view of facies
architecture and stratigraphic framework at shallow
depths up to 15 m. A discussion about these issues
is beyond the objective of this study and those inter-
ested should refer to references presented elsewhere
(Rossetti and Góes 2001 a,b, c, Rossetti et al. 2003).
In addition to help understanding the stratig-
raphy and paleoenvironments, the available GPR
sections have allowed the identification of several
styles of reflection distortions. Among these, hy-
perbolic reflections, for instance caused by under-
ground artifacts, pebbles or large rock fragments,
are common, as are reflection distortions due to the
influence of trees or moisture below surface ponds,
which are readily deciphered with basis on field ob-
servations. However, also detectable are some in-
triguing, large-scale disturbances that show charac-
teristics conforming with true bed deformation in-
cluding fractures, faults and folds, rather than re-
flection “noises”. There are several GPR records of
faults in literature (e.g., Smith and Jol 1995, Stevens
et al. 1995, Toshioka et al. 1995, Busby and Merritt
1999, Bano et al. 2000, Overgaard and Jakobsen
2001) and the criteria used for their identification
were summarized in Wyatt and Temples (1996), in-
cluding: abrupt reflection terminations; direct fault
plane reflections; diffractions at reflection termina-
tions; presence of dragging and rollovers of strata;
An Acad Bras Cienc (2003)75 (2)
DELINEATING NEOGENE STRUCTURES WIGH GPR 239
correlation of reflectors across a fault plane; and loss
of coherency beneath a fault plain or distorted dips
seen through the fault plane. The GPR signature
of folds is scarce, but an example has been recorded
from Quaternary of west Cumbria, UK (Meschede et
al. 1997, Busby and Merritt 1999). Similar features
were identified in the Neogene deposits prospected
in the shallow surface of northeastern Pará, as de-
scribed in the following.
Faults and Fractures in GPR Sections
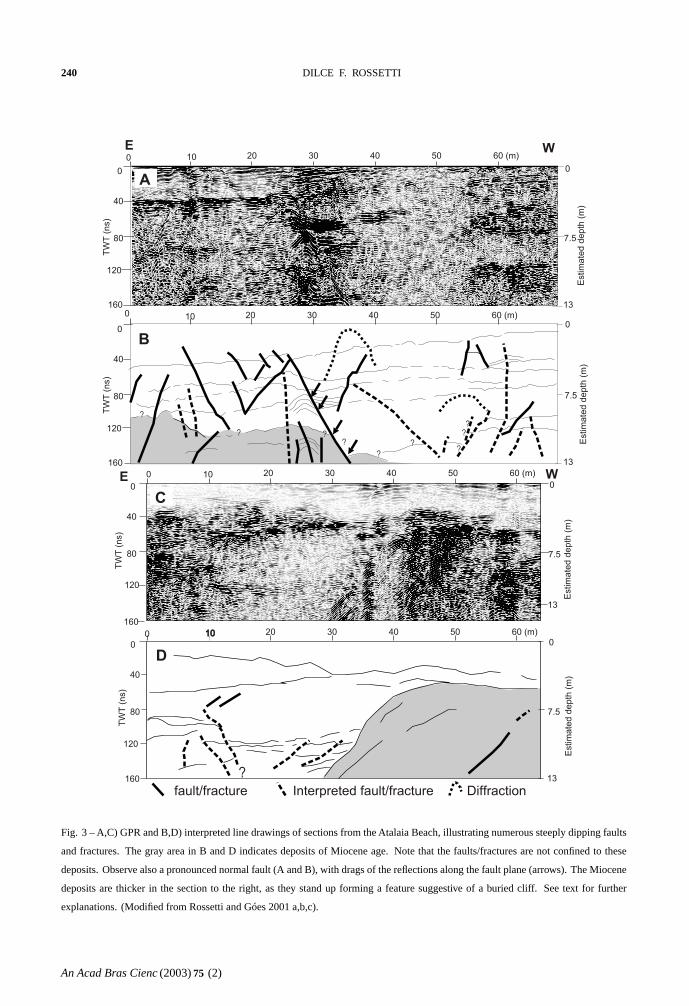
Numerous reflection distortions were identified in
the GPR images collected in the Bragantina Zone,
which are better related to faults and fractures. Fig-
ures 3 A-D show two laterally correlatable profiles
located approximately 15 m apart with several in-
clined reflection segments. These show an apparent
high angle, which is due to the vertical exaggera-
tion of the radar sections. Some of these inclined
segments consist of white, reflection-free lines de-
fined by sharp interruptions of the surrounding flat
lying beds. These dipping lines may separate flat ly-
ing reflections that show offsets. This is particularly
well illustrated between 20 and 40 m of horizon-
tal distance, where the reflections step down to the
right as it passes through a steeply dipping reflec-
tion. The reflections in both sides of this feature are
bent, forming convex and concave-up features in the
left and right side of it, respectively. Two concave
shapes between 40 and 80 ns of depth are mantled
by downlapping sigmoidal reflectors. Noteworthy
is the progressive downward increase in reflection
offset, which reaches up to 40 ns (estimated 3 m,
considering calibration with outcrops) at the base of
the section (arrows). In the right section, there is a
discontinuity surface bounding underlying, steeply
dipping reflections and overlain by sharp reflections
that terminate against it in onlap. Deciphering the
nature of all the steeply dipping reflections is not so
simple as they may record different situations. For
instance, the reflections bounded by the discontinu-
ity surface in the right section could be interpreted
as bed deformation at the edge of a cliff. Corre-
lation of this discontinuity surface throughout sev-
eral square kilometers suggests it to be an important
stratigraphic marker that corresponds to the uncon-
formity at the end of the Miocene. The reflection dis-
tortion between 20 and 40 m is, on the other hand, se-
curely attributed to a normal fault, with the hanging
wall to the right and foot wall to the left. The down-
ward increase in reflection offset attests to an upward
decrease in fault activity through time. As the fault
process took place, the beds on the foot wall were
slightly dragged to accommodate the displacement.
The sigmoidal reflectors that downlap the concave-
up features between 40 and 80 ns of depth suggest
that sedimentation might have been affected, caus-
ing a change in sedimentary patterns. The other in-
clined reflections seen throughout the sections might
have been caused by faults with smaller offsets, not
detectable by the GPR resolution, or even fractures.
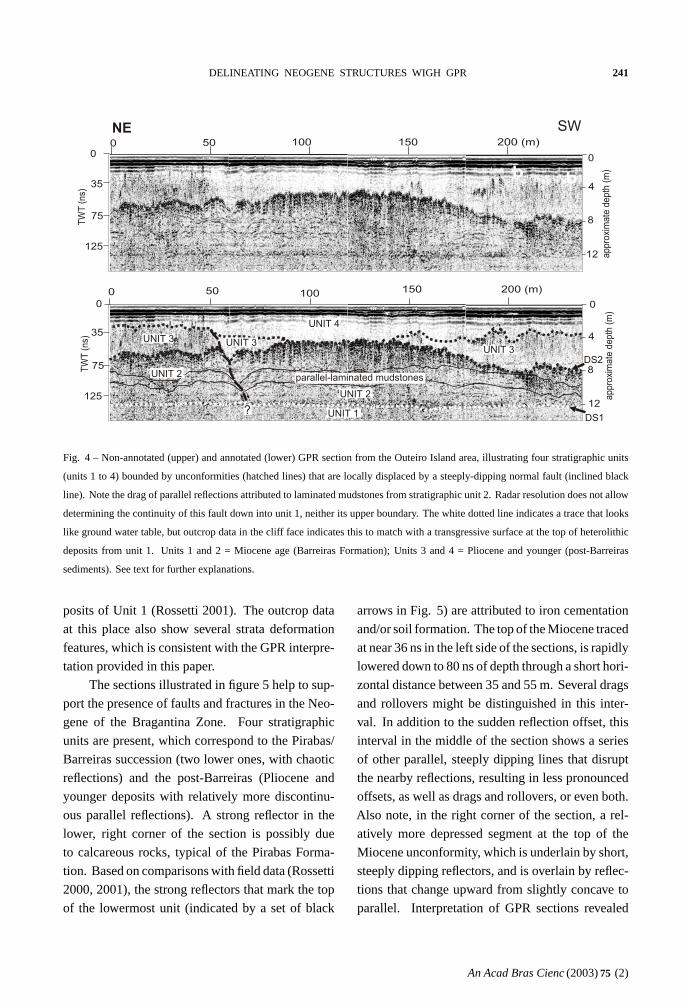
The example shown in figure 4 illustrates Mid-
dle/Late Miocene deposits, represented by units 1
and 2, which are unconformably overlain by units 3
and 4, developed from the Pliocene and correspond-
ing to the post-Barreiras sediments. The reflections
in this section are locally disturbed in its left side, as
revealed by the slight downward displacements of
the stratigraphic surfaces between units 2 and 3 and
units 3 and 4. The reflection disturbance at this point
is also indicated by the dragging of reflections within
unit 2, which is attributed to parallel-laminated mud-
stones. The reflection pattern observed at this local-
ity is better explained by a southwest-dipping nor-
mal fault, which cuts through unit 2. The upward
fault continuity into unit 3 as indicated in figure 4 is
one possibility to explain the displacement of unit
3, but the corresponding deposits in the right left of
the fault could also represent colluvial deposits. Be-
cause reflection resolution decreases substantially in
the lower part of the section, determination of fault
continuity into these beds was precluded. For this
same reason, it is problematic to interpret the strong
reflector indicated as the top of unit 1. In fact, the top
of this unit is very planar, which at first suggested
ground water level, but calibration with outcrop data
at a cliff face showed it to match with a transgressive
surface at the top of tidal-dominated heterolithic de-
An Acad Bras Cienc (2003)75 (2)
240 DILCE F. ROSSETTI
160
0
TW
T(n
s)
?
?
?
?
?
?
fault/fracture Interpreted fault/fracture Diffraction
?
?
?
A
B
E W0 2010 30 40 50 60 (m)
0 2010 30 40 50 60 (m)
80
40
120
160
0
TW
T(n
s)
80
40
120
13
0
Estim
ate
dd
ep
th(m
)
?
D
E W0 2010 30 40 50 60 (m)
0 201010 30 40 50 60 (m)
0
80
40
0
80
40
120
7.5
13
0
Estim
ate
dd
ep
th(m
)
7.5
C
13
0
Estim
ate
dd
ep
th(m
)
7.5
13
0
Estim
ate
dd
ep
th(m
)
7.5
120
160
160
TW
T(n
s)
TW
T(n
s)
Fig. 3 – A,C) GPR and B,D) interpreted line drawings of sections from the Atalaia Beach, illustrating numerous steeply dipping faults
and fractures. The gray area in B and D indicates deposits of Miocene age. Note that the faults/fractures are not confined to these
deposits. Observe also a pronounced normal fault (A and B), with drags of the reflections along the fault plane (arrows). The Miocene
deposits are thicker in the section to the right, as they stand up forming a feature suggestive of a buried cliff. See text for further
explanations. (Modified from Rossetti and Góes 2001 a,b,c).
An Acad Bras Cienc (2003)75 (2)
DELINEATING NEOGENE STRUCTURES WIGH GPR 241
NE SW
0
35
TW
T(n
s)
75
125
4
ap
pro
xim
ate
de
pth
(m)
8
12
parallel-laminated mudstones
DS2
DS1
0
35
TW
T(n
s)
75
125
UNIT 4UNIT 4
UNIT 3UNIT 3 UNIT 3
UNIT 2
UNIT 2
UNIT 1
0
4
ap
pro
xim
ate
de
pth
(m)
8
12?
? ? ? ??? ?
?
0 10050 150 200 (m)
b bb
0 10050 150 200 (m)
0
Fig. 4 – Non-annotated (upper) and annotated (lower) GPR section from the Outeiro Island area, illustrating four stratigraphic units
(units 1 to 4) bounded by unconformities (hatched lines) that are locally displaced by a steeply-dipping normal fault (inclined black
line). Note the drag of parallel reflections attributed to laminated mudstones from stratigraphic unit 2. Radar resolution does not allow
determining the continuity of this fault down into unit 1, neither its upper boundary. The white dotted line indicates a trace that looks
like ground water table, but outcrop data in the cliff face indicates this to match with a transgressive surface at the top of heterolithic
deposits from unit 1. Units 1 and 2 = Miocene age (Barreiras Formation); Units 3 and 4 = Pliocene and younger (post-Barreiras
sediments). See text for further explanations.
posits of Unit 1 (Rossetti 2001). The outcrop data
at this place also show several strata deformation
features, which is consistent with the GPR interpre-
tation provided in this paper.
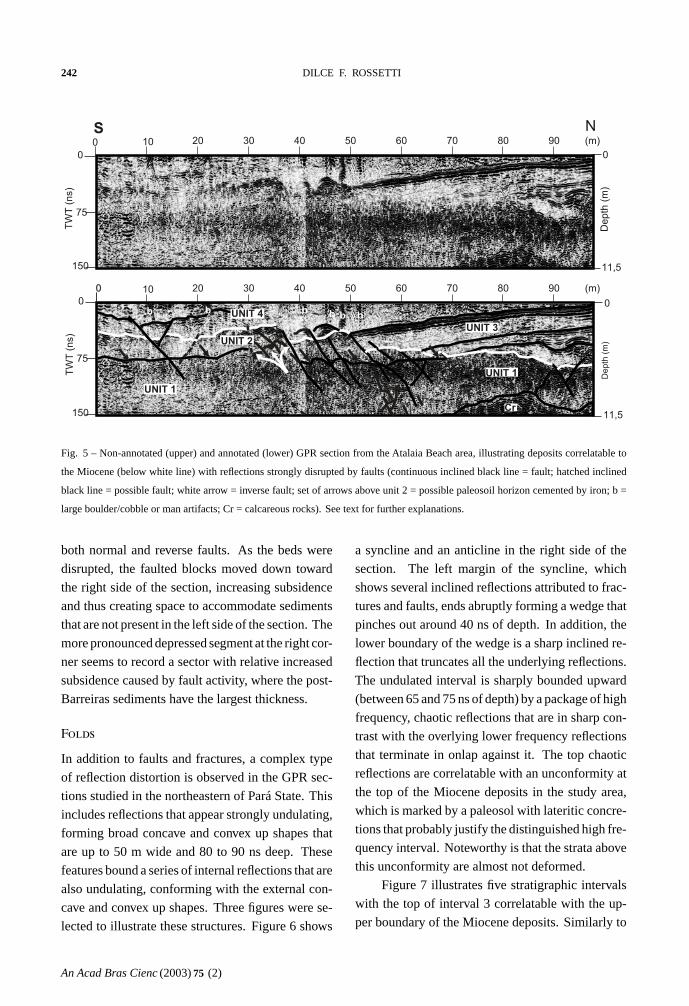
The sections illustrated in figure 5 help to sup-
port the presence of faults and fractures in the Neo-
gene of the Bragantina Zone. Four stratigraphic
units are present, which correspond to the Pirabas/
Barreiras succession (two lower ones, with chaotic
reflections) and the post-Barreiras (Pliocene and
younger deposits with relatively more discontinu-
ous parallel reflections). A strong reflector in the
lower, right corner of the section is possibly due
to calcareous rocks, typical of the Pirabas Forma-
tion. Based on comparisons with field data (Rossetti
2000, 2001), the strong reflectors that mark the top
of the lowermost unit (indicated by a set of black
arrows in Fig. 5) are attributed to iron cementation
and/or soil formation. The top of the Miocene traced
at near 36 ns in the left side of the sections, is rapidly
lowered down to 80 ns of depth through a short hori-
zontal distance between 35 and 55 m. Several drags
and rollovers might be distinguished in this inter-
val. In addition to the sudden reflection offset, this
interval in the middle of the section shows a series
of other parallel, steeply dipping lines that disrupt
the nearby reflections, resulting in less pronounced
offsets, as well as drags and rollovers, or even both.
Also note, in the right corner of the section, a rel-
atively more depressed segment at the top of the
Miocene unconformity, which is underlain by short,
steeply dipping reflectors, and is overlain by reflec-
tions that change upward from slightly concave to
parallel. Interpretation of GPR sections revealed
An Acad Bras Cienc (2003)75 (2)
242 DILCE F. ROSSETTI
0 0
De
pth
(m)
150 11,5
0 2010 30 40 50 60 70 80 90 (m)
0
De
pth
(m)
11,5
0 2010 30 40 50 60 70 80 90 (m)
TW
T(n
s)
b b b b bb
S N
75
0
150
TW
T(n
s)
75
Cr
UNIT 1
UNIT 1
UNIT 3
UNIT 4
UNIT 2
Fig. 5 – Non-annotated (upper) and annotated (lower) GPR section from the Atalaia Beach area, illustrating deposits correlatable to
the Miocene (below white line) with reflections strongly disrupted by faults (continuous inclined black line = fault; hatched inclined
black line = possible fault; white arrow = inverse fault; set of arrows above unit 2 = possible paleosoil horizon cemented by iron; b =
large boulder/cobble or man artifacts; Cr = calcareous rocks). See text for further explanations.
both normal and reverse faults. As the beds were
disrupted, the faulted blocks moved down toward
the right side of the section, increasing subsidence
and thus creating space to accommodate sediments
that are not present in the left side of the section. The
more pronounced depressed segment at the right cor-
ner seems to record a sector with relative increased
subsidence caused by fault activity, where the post-
Barreiras sediments have the largest thickness.
Folds
In addition to faults and fractures, a complex type
of reflection distortion is observed in the GPR sec-
tions studied in the northeastern of Pará State. This
includes reflections that appear strongly undulating,
forming broad concave and convex up shapes that
are up to 50 m wide and 80 to 90 ns deep. These
features bound a series of internal reflections that are
also undulating, conforming with the external con-
cave and convex up shapes. Three figures were se-
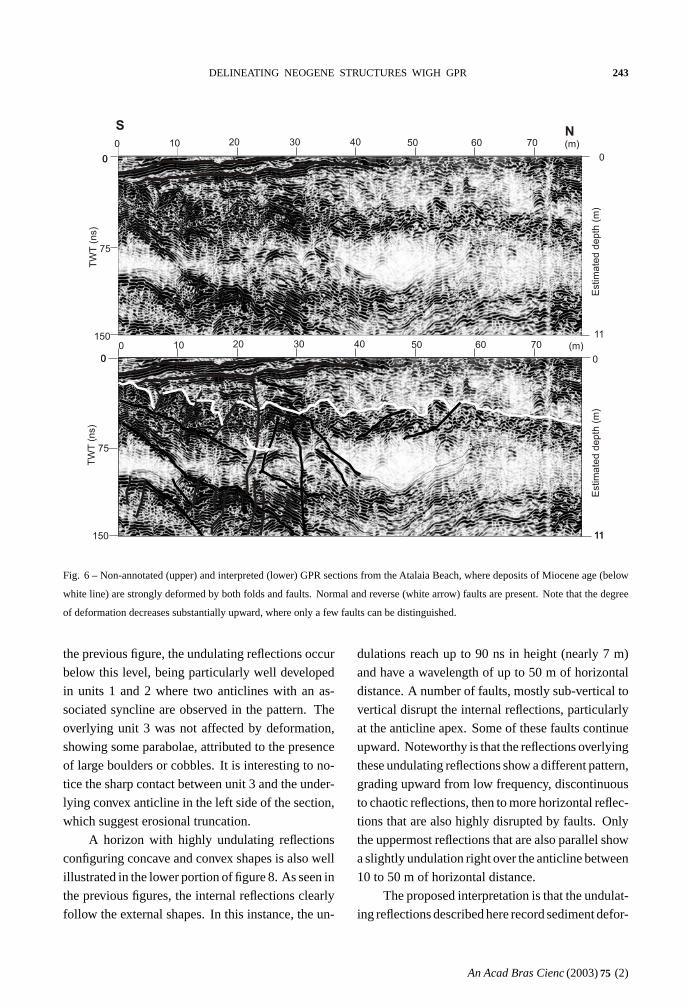
lected to illustrate these structures. Figure 6 shows
a syncline and an anticline in the right side of the
section. The left margin of the syncline, which
shows several inclined reflections attributed to frac-
tures and faults, ends abruptly forming a wedge that
pinches out around 40 ns of depth. In addition, the
lower boundary of the wedge is a sharp inclined re-
flection that truncates all the underlying reflections.
The undulated interval is sharply bounded upward
(between 65 and 75 ns of depth) by a package of high
frequency, chaotic reflections that are in sharp con-
trast with the overlying lower frequency reflections
that terminate in onlap against it. The top chaotic
reflections are correlatable with an unconformity at
the top of the Miocene deposits in the study area,
which is marked by a paleosol with lateritic concre-
tions that probably justify the distinguished high fre-
quency interval. Noteworthy is that the strata above
this unconformity are almost not deformed.
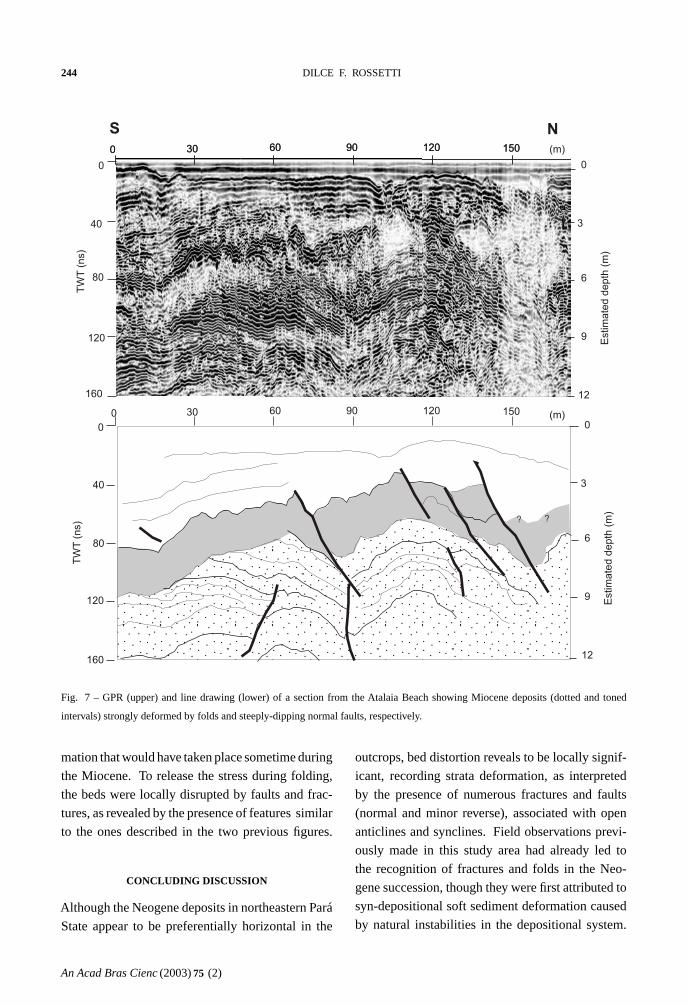
Figure 7 illustrates five stratigraphic intervals
with the top of interval 3 correlatable with the up-
per boundary of the Miocene deposits. Similarly to
An Acad Bras Cienc (2003)75 (2)
DELINEATING NEOGENE STRUCTURES WIGH GPR 243
150
0
11
0
Estim
ate
dd
ep
th(m
)
0
TW
T(n
s)
0 2010 30 40 50 60 70 (m)
75
150
0
1111
0
Estim
ate
dd
ep
th(m
)
0
0 2010 30 40 50 60 70 (m)
75
TW
T(n
s)
SN
Fig. 6 – Non-annotated (upper) and interpreted (lower) GPR sections from the Atalaia Beach, where deposits of Miocene age (below
white line) are strongly deformed by both folds and faults. Normal and reverse (white arrow) faults are present. Note that the degree
of deformation decreases substantially upward, where only a few faults can be distinguished.
the previous figure, the undulating reflections occur
below this level, being particularly well developed
in units 1 and 2 where two anticlines with an as-
sociated syncline are observed in the pattern. The
overlying unit 3 was not affected by deformation,
showing some parabolae, attributed to the presence
of large boulders or cobbles. It is interesting to no-
tice the sharp contact between unit 3 and the under-
lying convex anticline in the left side of the section,
which suggest erosional truncation.
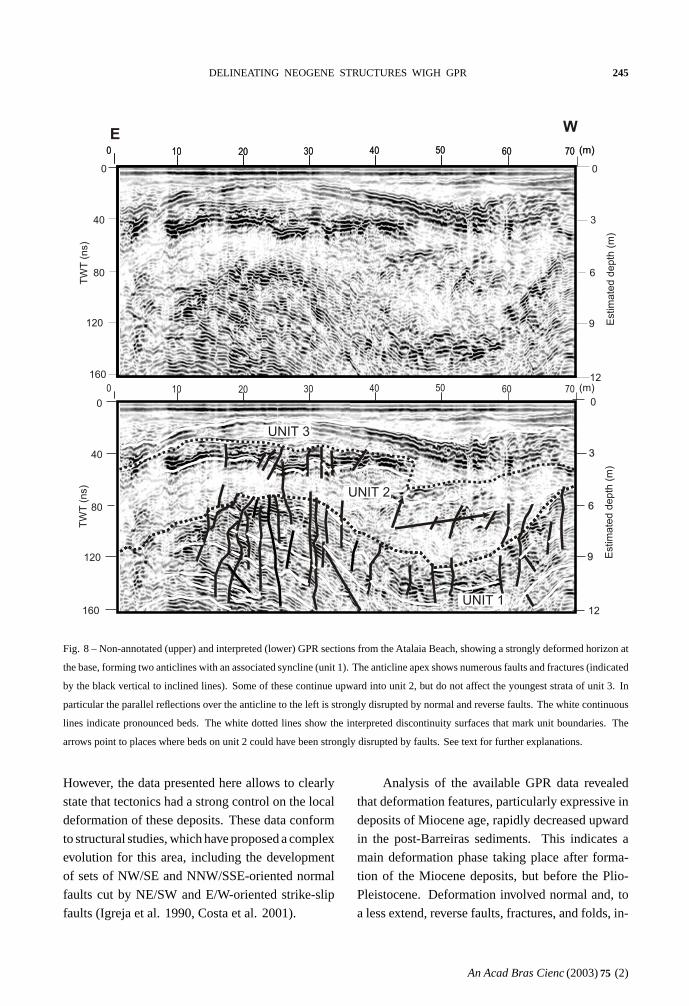
A horizon with highly undulating reflections
configuring concave and convex shapes is also well
illustrated in the lower portion of figure 8. As seen in
the previous figures, the internal reflections clearly
follow the external shapes. In this instance, the un-
dulations reach up to 90 ns in height (nearly 7 m)
and have a wavelength of up to 50 m of horizontal
distance. A number of faults, mostly sub-vertical to
vertical disrupt the internal reflections, particularly
at the anticline apex. Some of these faults continue
upward. Noteworthy is that the reflections overlying
these undulating reflections show a different pattern,
grading upward from low frequency, discontinuous
to chaotic reflections, then to more horizontal reflec-
tions that are also highly disrupted by faults. Only
the uppermost reflections that are also parallel show
a slightly undulation right over the anticline between
10 to 50 m of horizontal distance.
The proposed interpretation is that the undulat-
ing reflections described here record sediment defor-
An Acad Bras Cienc (2003)75 (2)
244 DILCE F. ROSSETTI
? ?
160
0
12
0
TW
T(n
s)
Estim
ate
ddepth
(m)
0 6030 90 120 150
0 6030 90 120 150 (m)
0 6030 90 120 150 (m)
S N
80
40
120
160
0
TW
T(n
s)
80
40
120
6
3
9
12
0
Estim
ate
ddepth
(m)
6
3
9
Fig. 7 – GPR (upper) and line drawing (lower) of a section from the Atalaia Beach showing Miocene deposits (dotted and toned
intervals) strongly deformed by folds and steeply-dipping normal faults, respectively.
mation that would have taken place sometime during
the Miocene. To release the stress during folding,
the beds were locally disrupted by faults and frac-
tures, as revealed by the presence of features similar
to the ones described in the two previous figures.
CONCLUDING DISCUSSION
Although the Neogene deposits in northeastern Pará
State appear to be preferentially horizontal in the
outcrops, bed distortion reveals to be locally signif-
icant, recording strata deformation, as interpreted
by the presence of numerous fractures and faults
(normal and minor reverse), associated with open
anticlines and synclines. Field observations previ-
ously made in this study area had already led to
the recognition of fractures and folds in the Neo-
gene succession, though they were first attributed to
syn-depositional soft sediment deformation caused
by natural instabilities in the depositional system.
An Acad Bras Cienc (2003)75 (2)
DELINEATING NEOGENE STRUCTURES WIGH GPR 245
0 2010 30 40 50 (m)60 70
0
0 2010 30 40 50 (m)
160
TW
T(n
s)
60 70
0
0 2010 30 40 50 (m)
12E
stim
ate
dd
ep
th(m
)
60 70
UNIT 1
UNIT 2
UNIT 3
EW
80
40
120
0
160
TW
T(n
s)
80
40
120
6
3
9
0
12
Estim
ate
dd
ep
th(m
)
6
3
9
Fig. 8 – Non-annotated (upper) and interpreted (lower) GPR sections from the Atalaia Beach, showing a strongly deformed horizon at
the base, forming two anticlines with an associated syncline (unit 1). The anticline apex shows numerous faults and fractures (indicated
by the black vertical to inclined lines). Some of these continue upward into unit 2, but do not affect the youngest strata of unit 3. In
particular the parallel reflections over the anticline to the left is strongly disrupted by normal and reverse faults. The white continuous
lines indicate pronounced beds. The white dotted lines show the interpreted discontinuity surfaces that mark unit boundaries. The
arrows point to places where beds on unit 2 could have been strongly disrupted by faults. See text for further explanations.
However, the data presented here allows to clearly
state that tectonics had a strong control on the local
deformation of these deposits. These data conform
to structural studies, which have proposed a complex
evolution for this area, including the development
of sets of NW/SE and NNW/SSE-oriented normal
faults cut by NE/SW and E/W-oriented strike-slip
faults (Igreja et al. 1990, Costa et al. 2001).
Analysis of the available GPR data revealed
that deformation features, particularly expressive in
deposits of Miocene age, rapidly decreased upward
in the post-Barreiras sediments. This indicates a
main deformation phase taking place after forma-
tion of the Miocene deposits, but before the Plio-
Pleistocene. Deformation involved normal and, to
a less extend, reverse faults, fractures, and folds, in-
An Acad Bras Cienc (2003)75 (2)
246 DILCE F. ROSSETTI
dicating compression. The deformation structures
interpreted in the GPR sections are consistent with
strike-slip regime, as proposed for the study area.
Areas with strike-slip deformation are characterized
by the co-existence of folds and faults with normal
and reverse separation, as a reflex of simultaneous
shortening and extension (Christie-Blick and Biddle
1985). Zones experiencing extension may display
gaps in surface ruptures, which could have produced
depositional sites for the Plio-Pleistocene strata dur-
ing strike-slip tectonism. Tectonics might have also
been the main mechanism to create space and ac-
commodate the post-Miocene deposits, as revealed
by the presence of thicker deposits of this age in
subsiding areas where faults were more pronounced.
Therefore, the features recorded here are highly ex-
pected considering the structural style proposed to
the study area.
Considering the data recorded in this paper, it
is concluded that the GPR might be an important
tool to help prospecting and analyzing shallow fea-
tures in the Neogene deposits of northeastern Pará
State. This procedure might significantly contribute
to provide additional field data to improve the tec-
tonic models available in this area.
ACKNOWLEDGMENTS
This work was supported by a grant from the CNPq
(PNPPG/2000). For logistical support, the author
is grateful to the Goeldi Museum. Special thanks
are due to Cláudia Cristina de Melo, Heloísa Maria
Santos, Lena Barata e Leandro Miranda for the assis-
tance with the equipment operation during the field-
work.
RESUMO
A caracterização geológica de depósitos neógenos ocor-
rentes em sub-superfície rasa no nordeste do Estado do
Pará, usando Radar de Penetração no Solo (GPR), revelou
a presença de falhas normais e reversas, bem como dobras,
ainda não documentadas em estudos de campo prévios. As
falhas são identificadas por reflexões inclinadas que cor-
tam bruscamente reflexões vizinhas, causando freqüentes
deslocamentos de camadas. As dobras são reconhecidas
por reflexões fortemente ondulantes, configurando feições
côncavas e convexas que medem até 50 m de amplitude
e 80 a 90 m de profundidade. Estas estruturas defor-
macionais desenvolvem-se, principalmente, em depósi-
tos de idade miocênica, embora algumas falhas possam
estender-se, também, a depósitos mais jovens. Embo-
ra as seções de GPR estudadas mostrem várias difrações
causadas por árvores, umidade do solo, e objetos enter-
rados, as estruturas registradas aqui não podem ser expli-
cadas por nenhum destes “ruídos”. A análise detalhada
das seções de GPR revelou que as feições deformacionais
estudadas estão relacionadas com distorções de camadas
causadas por deformações rúptil e dúctil. Embora falhas
e dobras não sejam amplamente registradas em depósi-
tos neógenos da Zona Bragantina, os dados aqui apre-
sentados são consistentes com modelos estruturais, que
propõem uma evolução complexa incluindo movimen-
tações transcorrentes para esta área, do Mioceno até o
presente.
Palavras-chave: Neógeno, nordeste do Estado do Pará,
Radar de Penetração no Solo, tectônica, rochas sedi-
mentares.
REFERENCES
Ackermann FL. 1964. Geologia e fisiografia da região
Bragantina-Estado do Pará. Cadernos da Amazônia
21: 1-90.
Asprion U. 1998. Ground-penetrating radar (GPR)
analysis in aquifer-sedimentology: case studies, with
an emphasis on glacial systems of SW Germany.
Tübinger Geowissenschaftliche Arbeiten 43: 1-105.
Bano M, Marquis G, Niviére B, Maurin JC and
Cushing M. 2000. Investigating alluvial and tec-
tonic features with ground-penetrating radar and an-
alyzing diffractions patterns. J Applied Geophysics
43: 33-41.
Bridge JS, Alexander J, Collier REL, Gawthorpe
RL and Jarvis J. 1995. Ground-penetrating radar
and coring used to study the large-scale structure of
point-bar deposits in three dimensions. Sedimentol-
ogy 42: 839-852.
Bristow C. 1995. Facies analysis in the Lower Green-
sand using ground-penetrating radar. J Geol Soc Lon-
An Acad Bras Cienc (2003)75 (2)
DELINEATING NEOGENE STRUCTURES WIGH GPR 247
don 152: 591-598.
Busby JP and Merritt JW. 1999. Quaternary defor-
mation mapping with ground penetrating radar. J
Applied Geophysics 41: 75-91.
Christie-Blick N and Biddle KT. 1985. Deforma-
tion and basin formation along strike-slip faults. In:
KT Biddle and N Christie-Blick (Eds.), Strike-
slip deformation, basin formation, and sedimenta-
tion, S.E.P.M. Special Publication 37: 1-34.
Costa JBS, Borges MS, Bemerguy RL, Fernan-
des JMG, Costa Júnior PS and Costa ML.
1993. Evolução cenozóica da região de Salinópo-
lis, nordeste do Estado do Pará. Bol Geoc USP, 12:
373-396.
Costa JBS, Memerguy RL, Hasui Y and Borges MS.
2001. Tectonics and paleogeography along the Ama-
zon river. J South American Earth Sci 14: 335-347.
Dagallier G, Laitinen AI, Malartre F, Van Camp-
enhout IPAM and Veeken PCH. 2000. Ground-
penetrating radar: application in a shallow marine
Oxfordian limestone sequence located on the eastern
flank of the Paris Basin, NE France. Sed Geol 130:
149-165.
Fisher E, McMechan GA and Annan AP. 1992. Ac-
quisition and processing of wide-aperture ground
penetrating radar data. Geophysics, 57: 495-504.
Igreja HLS, Borges MS, Alves RJ, Costa Júnior
PSC and Costa JBS. 1990. Estudos neotectônicos
nas Ilhas de Outeiro e Mosqueiro, NE do Estado do
Pará. In:Congresso Brasileiro de Geologia, 36.
Natal. Anais, Natal: SBG, 1990, 5: 2110-2123.
Katzer G. 1933. Geologia do Estado do Pará (Brasil).
Bol Mus Par Emílio Goeldi Hist Nat Etnog 9: 1-269.
Meschede M, Asprion U and Reicherter K. 1997.
Visualization of tectonic structures in shallow-depth
high-resolution Ground Penetrating Radar (GPR)
profiles. Terra Nova 9: 167-170.
Moffat DL and Puskar RJ. 1976. A subsurface elec-
tromagnetic pulse radar. Geophysics 41: 506-518.
Overgaard T and Jakobsen PR. 2001. Mapping of
glaciotectonic deformation in an ice marginal envi-
ronment with ground penetrating radar. J Applied
Geophysics 47: 191-197.
Roberts R, Daniels JL and Vendl M. 1991. Seasonal
variations and ground penetrating radar repeatability.
In: Annual Meeting of the Society for Explo-
ration Geophysicists, 61. Tulsa. Abstract Book,
Tulsa: Soc Exploration Geophysicists 1: 486-489.
Rossetti DF. 2000. Influence of low amplitude/high
frequency relative sea-level changes in a wave-
dominated estuary (Miocene), São Luís Basin, north-
ern Brazil. Sed Geol 133: 295-324.
Rossetti DF. 2001. Late Cenozoic sedimentary evolu-
tion in northeastern Pará, within the context of sea
level changes. J South Am Earth Sci 14: 77-89.
Rossetti DF and Góes AM. 2001a. Ground Pene-
trating Radar: Application in Cenozoic Deposits at
the Outeiro Island, PA. In:Simpósio de Geolo-
gia da Amazônia, 7. Belém. CD-ROM..., Belém:
SBG, 2001.
Rossetti DF and Góes AM. 2001b. Análise rasa de
subsuperfície na Praia do Atalaia, município de Sa-
linópolis (PA), com radar de penetração no solo. In:
Simpósio de Geologia da Amazônia, 7. Belém.
CD-ROM, Belém: SBG, 2001.
Rossetti DF and Góes AM. 2001c. Imaging Upper
Tertiary to Quaternary deposits from northern Brazil
applying ground penetrating radar. Rev Bras Geoc
31: 195-202.
Rossetti DF, Truckenbrodt W and Góes AM. 1989.
Estudo paleoambiental e estratigráfico dos Sedimen-
tos Barreiras e Pós-Barreiras na região Bragantina,
nordeste do Pará. Bol Mus Paraense Emílio Goeldi,
Sér Ciênc Terra 1: 25-74.
Rossetti DF, Góes AM and Truckenbrodt W. 1990.
A influência marinha nos Sedimentos Barreiras.
Bol Mus Paraense Emílio Goeldi, Sér Ciênc Terra
2: 17-29.
Rossetti DF, Góes AM and Souza LSB. 2003. Estrati-
grafia da sucessão sedimentar Pós-Barreiras (Zona
Bragantina, Pará) com base em radar de penetração
no solo. Rev Bras Geof. In press.
Smith DG and Jol HM. 1995. Wasatch Fault (Utah),
detected and displacement characterized by ground
penetrating radar. Environ Eng Geosci 1: 489-496.
Stephens M. 1994. Architectural element analysis
within the Kayenta Formation (Lower Jurassic) using
ground-probing radar and sedimentological profiling,
southwestern Colorado. Sed Geol 90: 179-211.
Stevens KM, Lodha GS, Holloway AL and Soon-
An Acad Bras Cienc (2003)75 (2)

248 DILCE F. ROSSETTI
awala NM. 1995. The application of ground pene-
trating radar for mapping fractures in plutonic rocks
within the Whiteshell Research Area, Pinawa, Man-
itoba, Canada. J Applied Geophysics 33: 125-141.
Toshioka T, Tsuchida T and Sasahara K. 1995. Ap-
plication of GPR to detecting and mapping cracks in
rock slopes. J Applied Geophysics 33: 119-124.
Van Heteren S, Fitzgerald DM, McKinlay PA and
Buynevich IV. 1998. Radar facies of paraglacial
barrier systems: coastal New England, USA. Sedi-
mentology 45: 181-200.
Wyatt DE and Temples TJ. 1996. Ground-penetrating
radar detection of small-scale channels, joints and
faults in the unconsolidated sediments of the Atlantic
Coastal Plain. Environmental Geology 27: 219-225.
An Acad Bras Cienc (2003)75 (2)