development of a database and visualization system
TRANSCRIPT

METHODOLOGY Open Access
Development of a database andvisualization system integrating variousmodels of seismic velocity structure andsubducting plate geometry around JapanYasuko Yamagishi1*, Ayako Nakanishi2, Seiichi Miura2, Shuichi Kodaira2 and Hide Sakaguchi1
Abstract
To estimate strong ground motions caused by future earthquakes in Japan and to more accurately predict seismichazards and tsunamis, it is necessary to accurately model the geometry of the subducting plate and the seismicvelocity structure around Japan, particularly in offshore areas. Although various seismic velocity structure and plateboundary models have been proposed around Japan, they are all managed individually and differ in extent, datatype, and format. Ensuring consistency among those models requires knowledge of their spatial distribution aroundthe subduction zones of Japan. Here, we describe a database system to store and serve various velocity structureand plate geometry datasets from around Japan. Seismic structure models in this database include 3D seismicvelocity models obtained by seismic tomography, 3D plate geometry models, 2D seismic velocity structure models,2D plate geometry models obtained by offshore seismic surveys, and hypocenter distributions determined byoffshore observations and the Japan Meteorological Agency. Using this database (currently available only inJapanese), users can obtain data from several structural models at once in the form of the original model data,equal-interval gridded data in a text file, and Keyhole Markup Language (KML) data. Users can grasp thedistributions of all available seismic models and hypocenters using a web-based interface, simultaneously viewvarious models and hypocenters as KML output files in Google Earth, and easily and freely handle the structuralmodels in a selected area of interest using the gridded text-file output data. This system will be useful in creatingmore accurate models of the geometries of the subducting plate and the seismic velocity structure around Japan.
Keywords: Seismic velocity structure, Subducting plate, Database, Visualization, Google Earth, KML
IntroductionThe Japanese Islands are in a complex tectonic setting, withthe Pacific and Philippine Sea plates subducting beneathJapan from the east and southeast, respectively. Strongground motions and tsunamis generated by large thrustearthquakes occurring on the subducting plate interfacescause considerable damage to coastal areas, as illustratedby the 2011 Tohoku earthquake (e.g., Fujiwara et al. 2011).To estimate strong ground motions and predict seismic
hazards for such large thrust events, it is necessary to
create accurate models of the geometries of the subduct-ing plates and seismic velocity structure. In preparing theNational Seismic Hazard Maps (2017), the Earthquake Re-search Committee, Headquarters for Earthquake ResearchPromotion in the Ministry of Education, Culture, Sports,Science and Technology (MEXT) constructed a standardvelocity structure model around Japan based on data fromKoketsu et al. (2008) and Fujiwara et al. (2009). Thismodel, the Japan Integrated Velocity Structure Model(Koketsu et al. 2008), was created to simulate long-periodground motions and their associated seismic hazards.However, large thrust earthquakes often occur in deep off-shore locations in subduction zones, where the velocitystructure remains poorly understood because standardvelocity structure models are based only on onshore
* Correspondence: [email protected] of Mathematical Science and Advanced Technology, JapanAgency for Marine-Earth Science and Technology, 3173-25, Showa-machi,Kanazawa-ku, Yokohama 236-0001, JapanFull list of author information is available at the end of the article
Progress in Earth and Planetary Science
© The Author(s). 2018 Open Access This article is distributed under the terms of the Creative Commons Attribution 4.0International License (http://creativecommons.org/licenses/by/4.0/), which permits unrestricted use, distribution, andreproduction in any medium, provided you give appropriate credit to the original author(s) and the source, provide a link tothe Creative Commons license, and indicate if changes were made.
Yamagishi et al. Progress in Earth and Planetary Science (2018) 5:49 https://doi.org/10.1186/s40645-018-0207-4

geophysical and geological data. Nakamura et al. (2015)observed from ocean-bottom data that long-period (10–20 s) ground motions developed in ocean areas during amoderate (Mw 5.8) earthquake. It is thus necessary toconsider the submarine velocity structure, including thick,low-velocity sedimentary layers, in simulations oflong-period ground motions and associated seismic haz-ards because long-period ground motions in ocean areascould affect source analyses such as magnitude estimatesand finite fault slips.Various seismic velocity structure models have been
constructed for the plate boundaries around Japan, in-cluding crustal structure and tomographic models basedon offshore seismic surveys and observations. However,each model is different and managed individually by itsconstructor organization. It is therefore an opportunetime to construct a new and more realistic model of thesubducting plate geometry and seismic velocity struc-ture. Integrated plate configuration data based on manyseismic studies (Hirose 2013) and a visualization systemfor subsurface structures of Japan (Active Fault Database2016) are available, although the structural informationis of insufficient resolution for offshore application. Toproduce a fully integrated submarine velocity structureand subducting plate geometry model, we need to knowthe spatial distribution of the various subordinatemodels (i.e., 2D and 3D seismic velocity models andplate geometries) and visually compare their hypocentraldistributions.Here, we describe a newly developed database to store
the various types of velocity structure and plate geometrydata around Japan, available at http://www.kozo.jishin.go.jp.We introduce the concept, development, and maintenanceof this database and provide some examples of its use.
Methods/ExperimentalTo better understand and conveniently compare sub-marine seismic velocity structure and subducting plategeometry models, we developed a database to store andvisualize the various kinds of seismic velocity structuremodels around Japan. In this section, we first explain thestorage of the seismic velocity structure models as datain the database and then describe the development anduse of the database.
Data used for database developmentWe collected published and officially announced 2D vel-ocity structure models and plate geometries along off-shore seismic profile lines, 3D tomographic velocitymodels, and 3D plate geometries. We prepared four per-mission levels for the data and sources used to constructthe database, depending on data availability: (1) only theareal extent of the data and the source reference can beindicated, (2) the data and source reference can be
displayed but not distributed, (3) the data and referenceare approved for both display and download, or (4)nothing is provided. For example, option 2 is chosen ifthe model was only reported in documents issued bygovernmental institutions.2D velocity structure models and plate geometries along
offshore seismic profile lines were provided by the Univer-sity of Tokyo, Hokkaido University, Tokyo University ofMarine Science and Technology, the Japan Coast Guard,and the Japan Agency for Marine-Earth Science and Tech-nology (JAMSTEC). 3D velocity models estimated by seis-mic tomography and 3D subducting plate geometrieswere provided by the University of Tokyo, Tohoku Uni-versity, Tokyo Institute of Technology, the MeteorologicalResearch Institute, the National Research Institute forEarth and Disaster Resilience, and JAMSTEC. Hypocen-tral parameters were provided by the Japan MeteorologicalAgency (JMA) and JAMSTEC. We standardized the for-mat of all models and parameters because their contents,notation systems, and sampling intervals were differentdepending on the data provider.
Development of the databaseIn addition to the original data files, our database pro-vides reconstructed 250-m equal-interval gridded datafiles. We included a function to convert the data intoKeyhole Markup Language (KML), an XML-based lan-guage schema for visualizing geographic data in GoogleEarth. Users can acquire various data files from severalmodels at once, regardless of model type. We con-structed a web-based graphical user interface (GUI) tosearch the database, display the extent of the data ineach model, and retrieve the desired model data.
Database designWe constructed the database as a Java SE 8 applicationand developed the web GUI so that anyone can accessthe database via the Internet. The system uses ApacheHTTP Server 2.2 and Apache Tomcat 8 as middleware.For searching and processing data, we developed a JavaServlet without a database management system (e.g.,MySQL, PostgreSQL). Because the data archiving systemuses only a file system (see Table 1), no knowledge ofdatabase language (e.g., SQL) is needed for managementof the data. Instead, an information file must be createdfor each kind of model data (including the source refer-ence, file name, and permission level of the data) anduploaded to the parent directory (Table 1).
File formats accepted by the databaseIn constructing the database, each model type presentedvarious data formats. To standardize the data files, datashould be written as geographic data comprising
Yamagishi et al. Progress in Earth and Planetary Science (2018) 5:49 Page 2 of 9

latitude, longitude, and depth, plus either a seismic vel-ocity (2D and 3D velocity models), seismic velocity per-turbation (if available for 3D velocity models), ormagnitude and origin time (hypocenter distributions).Except for original data files provided by various insti-tutes, universities, and researchers, the database requiresspace-delimited plain text files organized for each modeltype as shown in Table 2. To provide 250-mequal-interval gridded data, the database requires hori-zontal equal-interval grid point data (except for hypo-center distributions); 2D and 3D seismic velocity modelsfurther require vertical equal-interval grid point data.For 3D seismic velocity and plate geometry models, theextent of the data is displayed in the web GUI as a rect-angle on the map, in which the existence of blank ordummy data is permitted; thus, the database can accept“incomplete” data within the model extent. For 2D seis-mic velocity and plate geometry models, the data extentis displayed as a profile on the map, and data must existacross the entire profile. In addition to the formattedtext file, the database can store original, unprocesseddata files for download.
Searching the databaseThe database can be searched using user-specified pa-rameters (Fig. 1). Users begin by setting the geographic
region of interest as follows: (1) the user sets the geo-graphic coordinates of the start and end points of a pro-file by drawing the profile on the Earth’s surface, (2) theuser sets the distance from the profile within which theywish to capture data, and (3) a rectangular region is cre-ated from the user-specified parameters (Fig. 2). Allmodels containing data within the rectangular region ofinterest are searched. The user can then select the de-sired model(s) and output file type; the original data file(depending on permissions), the 250-m equal-intervalgridded data file, and the KML file are available fordownload.Users can select and acquire data files for 2D seismic
velocity models, 2D plate geometry models, and hypo-center distributions simultaneously. However, 3D seis-mic velocity and plate geometry models must beselected individually, and only one data type (seismicvelocity, Vp or Vs, and seismic velocity perturbation,dVp or dVs) can be selected at a time for 3D seismic vel-ocity models. Because of their large data volume, whenJMA hypocenter distributions are selected as outputdata, users must further specify a period of occurrenceand maximum and minimum magnitudes.A “ReadMe” file included with the downloaded data
files provides the contents of each downloaded data file,the format of the equal-interval gridded data, the refer-ence for the selected model, the user-selected searcharea, etc. The reference information provides users themethod and observational data used to create the ori-ginal model.
Generating 250-m equal-interval gridded dataThe equal-interval gridded data files provided by thedatabase are interpolated from the original data at equalhorizontal and vertical intervals of 250 m using the bicu-bic method (ignoring the curvature of the Earth) andthen written into a text file for output. The 250-mequal-interval data are produced automatically when
Table 2 Data types, contents, and structures required by the database
Data type 2D plate geometry 2D velocity structure 3D plate geometry 3D velocity structure Hypocenter distribution
Contents Depth of the plateboundary along aseismic line
2D velocity distributionalong a seismic line
3D depth profileof the plate boundary
3D velocity distribution Hypocentral parameter
Structure Origin time
Latitude(decimaldegrees)
Latitude(decimal degrees)
Latitude(decimal degrees)
Latitude(decimal degrees)
Latitude(decimal degrees)
Longitude(decimal degrees)
Longitude(decimal degrees)
Longitude(decimal degrees)
Longitude(decimal degrees)
Longitude(decimal degrees)
Depth (km) Depth (km) Depth (km) Depth (km) Depth (km)
Vp or Vs Vp or/and Vs; dVpor/and dVs if available
Magnitude: Mjfor JMA dataM (Watanabe 1971)for other data.
Table 1 Structure of the file system used for data archiving
Directory structure Contents
database/ Top-level directory of the database
database/data/ Information file for each model
database/data/2D_plate/ 2D plate geometry model data files
database/data/2D_structure/ 2D seismic velocity model data files
database/data/3D_plate/ 3D plate geometry model data files
database/data/3D_structure/ 3D seismic velocity model data files
database/data/Hypo/ Hypocenter distribution data files
Yamagishi et al. Progress in Earth and Planetary Science (2018) 5:49 Page 3 of 9

2D seismic velocity and plate geometry models are storedin the database and are regarded as existing in a verticalrectangle. For 3D seismic velocity and plate geometrymodels, the equal-interval data are produced each time thedatabase is searched; 3D plate geometry models are inter-polated from the original data only within theuser-specified search region, whereas only the data in thevertical cross section just beneath the user-specified profileare newly interpolated for 3D seismic velocity models. Theequal-interval data are regarded as existing within a rect-angular parallelepiped in 3D seismic velocity models and
are projected onto the Earth’s surface as a horizontal rect-angle in 3D plate geometry models. Grid points containingno data in the projected 3D models are given dummyvalues of − 9999, and new grid points interpolated fromdummy values will be passed dummy values of − 9999.Dummy data are ignored upon conversion into KML.
Converting equal-interval data to KMLFor simultaneous visualization of 2D and 3D seismicvelocity structure models in Google Earth, the data-base converts the 250-m equal-interval gridded data
Fig. 1 Flowchart of the database search parameters. This search structure consists of three steps: definition of the search area, model selection,and selection of data for download. Once users set a search area, all models containing data within that search area are selected, regardless ofmodel type. Each selection step is described in detail in the text
Yamagishi et al. Progress in Earth and Planetary Science (2018) 5:49 Page 4 of 9
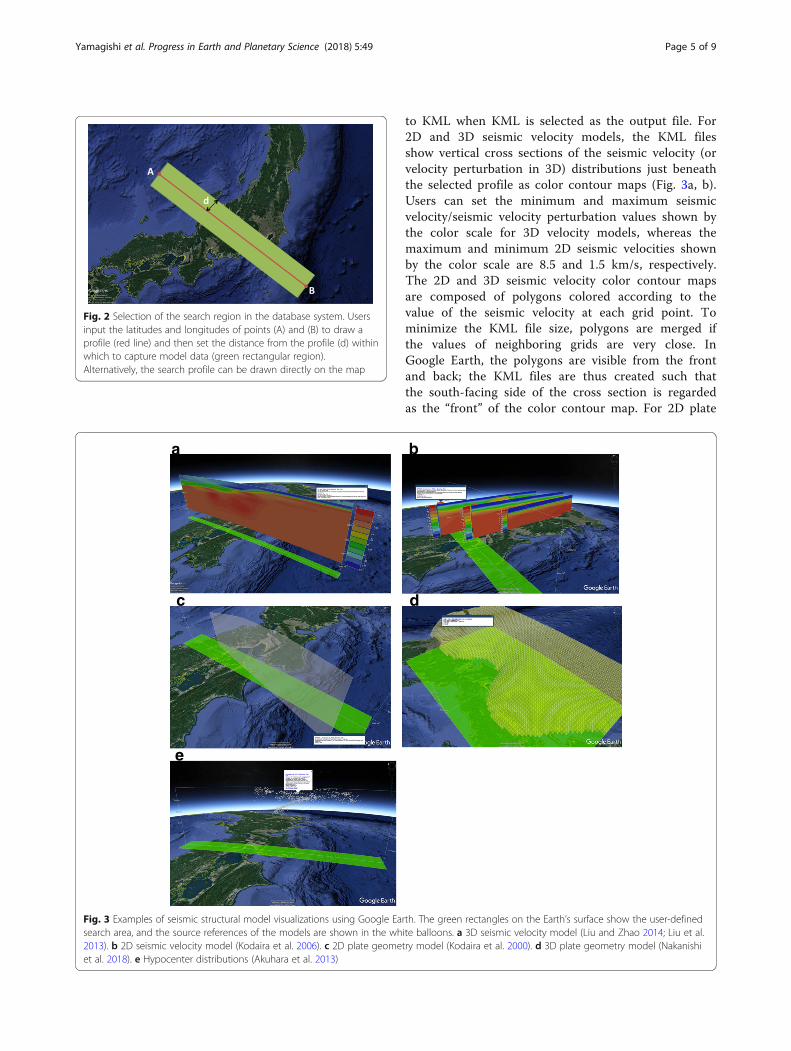
to KML when KML is selected as the output file. For2D and 3D seismic velocity models, the KML filesshow vertical cross sections of the seismic velocity (orvelocity perturbation in 3D) distributions just beneaththe selected profile as color contour maps (Fig. 3a, b).Users can set the minimum and maximum seismicvelocity/seismic velocity perturbation values shown bythe color scale for 3D velocity models, whereas themaximum and minimum 2D seismic velocities shownby the color scale are 8.5 and 1.5 km/s, respectively.The 2D and 3D seismic velocity color contour mapsare composed of polygons colored according to thevalue of the seismic velocity at each grid point. Tominimize the KML file size, polygons are merged ifthe values of neighboring grids are very close. InGoogle Earth, the polygons are visible from the frontand back; the KML files are thus created such thatthe south-facing side of the cross section is regardedas the “front” of the color contour map. For 2D plate
Fig. 2 Selection of the search region in the database system. Usersinput the latitudes and longitudes of points (A) and (B) to draw aprofile (red line) and then set the distance from the profile (d) withinwhich to capture model data (green rectangular region).Alternatively, the search profile can be drawn directly on the map
a b
c
e
d
Fig. 3 Examples of seismic structural model visualizations using Google Earth. The green rectangles on the Earth’s surface show the user-definedsearch area, and the source references of the models are shown in the white balloons. a 3D seismic velocity model (Liu and Zhao 2014; Liu et al.2013). b 2D seismic velocity model (Kodaira et al. 2006). c 2D plate geometry model (Kodaira et al. 2000). d 3D plate geometry model (Nakanishiet al. 2018). e Hypocenter distributions (Akuhara et al. 2013)
Yamagishi et al. Progress in Earth and Planetary Science (2018) 5:49 Page 5 of 9

geometry models, the depth to the top of the plate is rep-resented as lines connecting the plate depths (Fig. 3c). For3D plate geometry models, the plate geometry data areconverted into KML as an aggregate surface of triangularpolygons (Fig. 3d). Hypocenters are displayed as spheres(Fig. 3e). KML placemarks show the source data used inthe models; upon clicking the placemark in Google Earth,the source reference appears in a white balloon (Fig. 3).As the Earth’s interior is not visible in Google Earth, thedata must be displayed outside of the Earth; the depths ofthe data are thus converted into altitudes relative to an“imaginary Earth’s surface” altitude defined by the user.
Web GUIA web-based GUI enables users to easily access the data-base via the Internet (presently only available in Japanese).
A map embedded in the GUI shows the extent of allmodels in the database (Fig. 4a). In this view, source refer-ences can be viewed by clicking the profile line (2D plategeometry and seismic velocity models) or the margin ofthe bounding box (3D plate geometry and seismic velocitymodels) of individual models. In the GUI, users can easilyadjust the geographic coordinates of the rectangularsearch region by clicking on the map, and the map is re-drawn showing only the models that include datawithin the search region (Fig. 4b). For 3D seismic vel-ocity and plate geometry models, the model area isshown by a rectangle, although some blank pointsmay exist within that area. In these cases, the rect-angle represents the maximum extent of the selecteddata. We developed this web GUI assuming use ofthe Google Chrome browser.
a
b
Fig. 4 Web GUI for searching the database. a The first page of the search tool. Green and red lines show the positions of 2D plate geometry andseismic velocity models, respectively. Yellow and green boxes show the extents of 3D plate geometry and seismic velocity models, respectively.Spheres represent hypocenters; hypocenters from the same model are shown in the same color. b The second page of the search tool. Aftersearch area selection, the map is refreshed to show only the models containing data within the search area. The left panel lists the titles of theselected models. The green line and red rectangle indicate the search area defined by the user in the first step (a)
Yamagishi et al. Progress in Earth and Planetary Science (2018) 5:49 Page 6 of 9

ResultsTowards the goal of constructing an integrated seismicstructural model beneath the Pacific Ocean aroundJapan, we have developed a database that stores variousseismic structural models (obtained by seismic surveysand tomographic analyses) and hypocentral parameters.Using this database, users can (1) acquire various datafiles from several models at once, regardless of themodel type, (2) view the extent of the existing seismicstructural models in the web GUI (Fig. 4a), and (3) easilyvisualize the structural data distribution, particularly inthe offshore region, by interfacing with Google Earth(Fig. 3). Moreover, by using the original dataset or thegridded data provided by this database, users can analyzeindividual structural models. Therefore, this databasewill be useful in creating a better model of the subduct-ing plate and seismic velocity structure around Japan.
DiscussionIn this section, we introduce several example applications ofthe database. We first explain the use of the equal-intervalgridded data and then show an example of simultaneousvisualization of different seismic velocity models.
At present, the GUI is only available in Japanese. How-ever, we believe that this database will be useful to all re-searchers interested in the seismic velocity structure andsubducting plate geometry around Japan. We recognizethat this system should be improved in the future to re-spond to users’ requests, including an English GUI.
Use of 250-m equal-interval gridded dataThe database provides three data output options: (1)the original data files, (2) 250 m equal-interval grid-ded data files, and (3) KML files. The unprocessedoriginal data files are the intact datasets provided byvarious institutes or researchers; these are differentfrom the formatted input data (text) files accepted bythe database. JMA hypocenter data are the exception;the original data files are not provided because oftheir large volume. The equal-interval data files provideinterpolated data gridded horizontally and vertically at250-m intervals. The 250-m equal-interval data are pro-vided in a vertical section beneath the user-specified pro-file for 3D seismic velocity models or in a rectangularparallelepiped under the user-specified search region for3D plate geometry models. For 2D seismic velocity and
Fig. 5 Visualization of various seismic structural models under the Nankai Trough. The cross section of the 3D seismic velocity model is fromNakajima and Hasegawa (2007), the 3D plate geometry model from Nakanishi et al. (2018), the 2D plate geometry and seismic velocity modelsfrom Kodaira et al. (2006), and the hypocentral distribution from Akuhara et al. (2013). The green rectangle on the Earth’s surface shows the user-defined search area. Differences between the individual models are notable; for example, hypocenters located at the surface of the subductingslab are consistently deeper than the top of the slab in the 3D plate geometry model
Yamagishi et al. Progress in Earth and Planetary Science (2018) 5:49 Page 7 of 9

plate geometry models, the equal-interval data are pro-vided beneath the entire survey line across the search area.Because the original data are often provided as a programor in a unique file format, complicated procedures may benecessary to process different types of original model data.The equal-interval gridded data are space-separated andprovided as a plain text file in a simple format summa-rized by the “ReadMe” file so that users can easily analyzeor visualize the models in their software of choice. Ifneeded, users can easily convert the equal-interval griddeddata to other data formats such as GeoCSV (Stults et al.2015) or JSON (JavaScript Object Notation) for seismictomographic data (Postpischl et al. 2011).
Visualization of seismic structure modelsThe database provides KML files produced from the 250-mequal-interval data for display in Google Earth. The layersystem of Google Earth allows various geographic data tobe displayed simultaneously on a virtual globe. Therefore,the database can simultaneously visualize several seismicstructure models, regardless of the model types. Figure 5shows a visual comparison of 3D plate geometry (Nakanishiet al. 2018) and seismic velocity models (Nakajima andHasegawa 2007), 2D plate geometry and seismic velocitymodels (Kodaira et al. 2006), and hypocentral distributions(Akuhara et al. 2013). Differences between the 3D plategeometry model, 3D seismic velocity model, and hypocen-ters are notable at greater depths; for example, hypocenterslocated at the subducting slab interface are consistentlydeeper than the top of the slab in the 3D plate geometrymodel.
ConclusionWe developed a database system with a web GUI, avail-able at http://www.kozo.jishin.go.jp, to provide seismicstructure model data via the Internet. Using this data-base, users can easily obtain various kinds of seismicstructure model data and visualize them simultaneouslyin Google Earth. By interfacing with Google Earth, thisdatabase allows users to easily understand the structuraldata distribution in offshore regions of Japan. This sys-tem also provides 250-m equal-interval gridded datafrom the desired structural models as a text file, whichusers can employ to analyze individual models withoutany complicated data preparation. As a result, we believethat the database will be useful to produce a more accur-ate seismic structure model beneath the Pacific Oceanaround Japan.
AbbreviationsGUI: Graphical user interface; JAMSTEC: Japan Agency for Marine-EarthScience and Technology; JMA: Japan Meteorological Agency;KML: Keyhole Markup Language; MEXT: Ministry of Education, Culture,Sports, Science and Technology
AcknowledgementsThis study was performed as a “research project for development of seismologicalinformation database for modeling seismic velocity structure offshore aroundJapan” funded by the Ministry of Education, Culture, Sports, Science andTechnology (MEXT), Japan. We are grateful to all who have kindly agreed to theincorporation of their models and data into our database. The earthquake catalogused in this study is produced by the JMA in cooperation with MEXT. The catalogis based on seismic data provided by the National Research Institute for EarthScience and Disaster Prevention, JMA, Hokkaido University, Hirosaki University,Tohoku University, the University of Tokyo, Nagoya University, Kyoto University,Kochi University, Kyushu University, Kagoshima University, the National Institute ofAdvanced Industrial Science and Technology, the Geographical Survey Institute,Tokyo Metropolis, Shizuoka Prefecture, Hot Springs Research Institute of KanagawaPrefecture, Yokohama City, and JAMSTEC. We are grateful to Riming Zhu (VisCoreCo., Ltd.) and Kenji Morimoto (VINAS Co., Ltd.) for their skill in developing thisdatabase and the KML data conversion system.
FundingThis study was funded by the Ministry of Education, Culture, Sports, Scienceand Technology.
Availability of data and materialsAll data provided by institutes and researchers for this study is stored in thedeveloped database, available at http://www.kozo.jishin.go.jp (in Japanese).
Authors’ contributionsYY and AN proposed the topic. YY developed the database system. ANinvestigated existing structural models and coordinated the permissionslevels of the data files with the providers. SM and SK helped collect the datafiles and develop the system. HS contributed to the discussion. All authorsread and approved the final manuscript.
Competing interestsThe authors declare that they have no competing interests.
Publisher’s NoteSpringer Nature remains neutral with regard to jurisdictional claims inpublished maps and institutional affiliations.
Author details1Department of Mathematical Science and Advanced Technology, JapanAgency for Marine-Earth Science and Technology, 3173-25, Showa-machi,Kanazawa-ku, Yokohama 236-0001, Japan. 2Research and DevelopmentCenter for Earthquake and Tsunami, Japan Agency for Marine-Earth Scienceand Technology, 3173-25, Showa-machi, Kanazawa-ku, Yokohama 236-0001,Japan.
Received: 18 April 2018 Accepted: 17 August 2018
ReferencesActive Fault Database (2016) National Institute of Advanced Industrial Science
and Technology, https://gbank.gsj.jp/subsurface/english/index.html. Accessed21 Mar 2018
Akuhara T, Mochizuki K, Nakahigashi K, Yamada T, Shinohara M, Sakai S,Kanazawa T, Uehira K, Shimizu H (2013) Segmentation of the Vp/Vs ratio andlow-frequency earthquake distribution around the fault boundary of theTonankai and Nankai earthquakes. Geophys Res Lett 40:1306–1310. https://doi.org/10.1002/grl.50223
Fujiwara H, Kawai S, Aoi S, Morikawa N, Sennna S, Kudo N, Ooi M, Hao Kx-S,Hayakawa Y, Toyama N, Matsuyama N, Iwamoto L|K, Suzuki H, Ei R (2009) Astudy on subsurface structure model for deep sedimentary layers of Japanfor strong-motion evaluation. Technical note of the National ResearchInstitute for Earth Science and Disaster Prevention, No 337 (in Japanese)
Fujiwara T, Kodaira S, No T, Kaiho Y, Takahashi N, Kaneda Y (2011) The 2011Tohoku-Oki earthquake: displacement reaching the trench axis. Science 334:1240. https://doi.org/10.1126/science.1211554
Hirose F (2013) Fuyuki Hirose’s HP, plate configuration data, http://www.mri-jma.go.jp/Dep/st/member/fhirose/en/en.PlateConfiguration.html. Accessed 21Mar 2018
Yamagishi et al. Progress in Earth and Planetary Science (2018) 5:49 Page 8 of 9

Kodaira S, Hori T, Ito A, Miura S, Fujie G, Park J-O, Baba T, Sakaguchi H, Kaneda Y(2006) A cause of rupture segmentation and synchronization in the Nankaitrough revealed by seismic imaging and numerical simulation. J GeophysRes 111:B09301. https://doi.org/10.1029/2005JB004030
Kodaira S, Takahashi N, Nakanishi A, Miura S, Kaneda Y (2000) Subductedseamount imaged in the rupture zone of the 1946 Nankaido earthquake.Science 289:104–106. https://doi.org/10.1126/science.289.5476.104.
Koketsu K, Miyake H, Fujiwara H, Hashimoto T (2008) Progress towards a Japanintegrated velocity structure model and long-period ground motion hazardmap, in Proceedings of the 14th World Conference on EarthquakeEngineering: Beijing, China, paper no. S10–038.
Liu X, Zhao D (2014) Structural control on the nucleation of megathrustearthquakes in the Nankai subduction zone. Geophys Res Lett 41:8288–8293.https://doi.org/10.1002/2014GL062002
Liu X, Zhao D, Li S (2013) Seismic imaging of the Southwest Japan arc from theNankai trough to the Japan Sea. Phys Earth Planet Inter 216:59–73. https://doi.org/10.1016/j.pepi.2013.01.003
Nakajima J, Hasegawa A (2007) Subduction of the Philippine Sea slab beneathsouthwestern Japan: slab geometry and its relationship to arc magmatism.J Geophys Res 112:B08306. https://doi.org/10.1029/2006JB004770
Nakamura T, Takenaka H, Okamoto T, Ohori M, Tsuboi S (2015) Long-periodocean -bottom motions in the source areas of large subduction earthquakes,Scientific Reports 5, Article number: 16648. Doi:https://doi.org/10.1038/srep16648
Nakanishi A, Takahashi T, Yamamoto Y, Takahashi T, Citak SO, Nakamura T, ObanaK, Kodaira S, Kaneda Y (2018) Three-dimensional plate geometry and P-wavevelocity models of the subduction zone in SW Japan: Implication forseismogenesis. In: Byrne T, Fisher D, McNeil L, Saffer D, Ujiie K, UnderwoodM, Yamaguchi A (eds) Geology and tectonics of subduction zones: a tributeto Gaku Kimura. Geological Society of America Special Paper 534 (in press)
National Seismic Hazard Maps (2017) Report of Earthquake ResearchCommittee, Headquarters for Earthquake Research Promotion, https://www.jishin.go.jp/evaluation/seismic_hazard_map/shm_report/shm_report_2017. Accessed 9 Apr 2018
Postpischl L, Danecek P, Morelli A, Pondrelli S (2011) Standardization of seismictomographic models and earthquake focal mechanisms data sets based onweb technologies, visualization with keyhole markup language. Comp Secsci37:47–56. https://doi.org/10.1016/j.cageo.2010.05.006
Stults M, Arko R A, Davis E, Ertz D J, Turner M, Trabant C M, Valentine Jr D W,Ahem T K, Carbotte S M, Gurnis M, Meertens C, Ramamurthy M K, Zaslavsky L(2015) GeoCSV: tabular text formatting for geoscience data. Abstract IN11F-1809 presented at AGU Fall Meeting 2015, San Francisco, California, 14–18December 2015. https://agu.confex.com/agu/fm15/webprogram/Paper84142.html. Accessed 8 June 2018
Watanabe H (1971) Determination of earthquake magnitude at regional distancein and near Japan. Zishin 24: 189–200. (in Japanese with English abstract)
Yamagishi et al. Progress in Earth and Planetary Science (2018) 5:49 Page 9 of 9