development of a rare earth element resource database
TRANSCRIPT
Development of a Rare Earth Element Resource
Database Management System
Von der Fakultät für Georessourcen und Materialtechnik der Rheinisch-Westfä-
lischen Technischen Hochschule Aachen
zur Erlangung des akademischen Grades eines
Doktors der Naturwissenschaften
genehmigte Dissertation
vorgelegt von M.Sc.
Patrick Friedrichs
aus Würselen
Berichter: Univ.-Prof. (em) Dr. rer. Nat. Franz Michael Meyer
Univ.-Prof. Dr. Ing. Hermann Wotruba
Tag der mündlichen Prüfung: 27. Januar 2017
Diese Dissertation ist auf den Internetseiten der Hochschulbibliothek online verfügbar.

Declaration
II
Declaration
I declare that this dissertation was composed by myself. The work contained herein is
my own except where explicitly stated otherwise in the text, and that this work has not
been submitted for any other degree or professional qualification except as specified.
--------------------------------------------
(Patrick Friedrichs)

Acknowledgement
III
Acknowledgement
First, I would like to thank Prof. F. Michael Meyer for giving me the opportunity to write
this dissertation as well as being part of the Siemens research program (S-FB). Fur-
ther, I would like to offer my sincerest appreciation for his constant guidance, valuable
feedback, and mostly for the keen interest, he showed throughout this dissertation. It
was a pleasure working with him.
Second, I would like to thank Prof. Wotruba for being the second communicant and
also for his special interest in the DBMS he showed during the four years of the project.
In addition, I would like to thank my colleague Nicolas Stoltz for the wonderful four
years and the comfortable environment of cooperation and companionship. I will al-
ways miss the time we had during this project.
Moreover, I want to thank Siemens AG for funding this interesting project as well as for
the guidance throughout this project. Further, I am thankful for giving me the oppor-
tunity to write invention disclosures as well as patents. In particular, I would like to
thank Dr. Thomas Peuker and Dr. Sonja Wolfrum (Siemens AG) for their continuous
feedback and that they always had a sympathetic ear.
I am highly indebted and grateful to my fiancée Amelie for days and weeks of proof-
reading, discussions and the moods she had to stand during the last couple of years.
Thank you for your patience, love and encouragement throughout all ups and downs.
Finally, I want to acknowledge the contribution of my family and friends, who supported
me in all difficulties I encountered in my efforts to accomplish this dissertation. My sin-
cere gratitude goes to my parents for supporting and encouraging me during the years.
Publications
IV
Publications
Friedrichs, P.T. & Meyer, F.M.: REE Database Management System: Evaluation of
REE deposits and occurrences. The Minerals, Metals & Materials Society (TMS). Jour-
nal of Sustainable Metallurgy, Springer, 2016.
Friedrichs, P.T., Meyer, F.M. & Stoltz, N.B.: Evaluation of Rare Earth deposits using a
dynamic Database Management System. 11th Rare Earth Conference, Singapore, No-
vember 12th 2015.
Friedrichs, P.T., Meyer, F.M. & Stoltz, N.B.: Evaluation of Rare Earth deposits using a
dynamic Database Management System (Poster). 11th Rare Earth Conference, Singa-
pore, November 12th 2015.
Stoltz, N.B., Friedrichs, P.T. & Meyer, F.M.: Ion Adsorption Clays – A Geometallurgical
Approach. 11th Rare Earth Conference, Singapore, November 12th 2015.
Friedrichs, P.T., Stoltz, N.B. & Meyer, F.M.: Introducing a Rare Earth Resource Man-
agement System. SGA 13th Biennal Meeting, Nancy, 24th – 26th August 2015.
Friedrichs, P.T., Meyer, F.M. & Stoltz, N.B.: The economic potential of the global Heavy
Rare Earth Element deposits in comparison to the high-class Chinese deposits. Joint
Meeting GV and DMG, Tübingen, September 16th, 2013.
Stoltz, N.B., Meyer, F.M. & Friedrichs, P.T.: Economic potential of Rare Earth Elements
in apatite of the Khibina Complex, Kola Peninsula, Russia. Joint Meeting GV and DMG,
Tübingen, September 16th, 2013.
Patents of the S-FB
V
Friedrichs, P.T., Meyer, F.M. & Stoltz, N.B.: The economic potential of global REE
deposits. Rare Earth Elements and Compounds Conference, Munster, September
2015.
Stoltz, N.B., Meyer, F.M. & Friedrichs, P.T.: No metal without mineral – geometallurgy
of unconventional REE ores and minerals. Rare Earth Elements and Compounds Con-
ference, Munster, September 2015.
Patents of the S-FB
DE 102014203171 A1 - Verfahren zur Abtrennung von Seltenerdverbindungen aus
einem Feststoffgemisch. Veröffentlichungsdatum: 27.August, 2015. Erfinder. Patrick
Friedrichs (RWTH), Marc Hanebuth (Siemens AG), Nicolas Stoltz (RWTH), Sonja
Wolfrum (Siemens AG).
DE 102014202792 A1 - Mobile Vorrichtung zur Behandlung von wertstoffhaltigem Ab-
baugut. Veröffentlichungsdatum: 20. August 2015. Erfinder: Patrick Friedrichs
(RWTH), F. Michael Meyer (RWTH), Nicolas Stoltz (RWTH), Sonja Wolfrum (Siemens
AG).
DE 102014201303 A1 - Verfahren zur Abtrennung von Seltenerd-Bestandteilen aus
einem unterschiedliche Seltenerd-Bestandteile sowie wenigstens einen Nicht-Selten-
erd-Bestandteil enthaltenden Gemengestrom. Veröffentlichungsdatum: 30. Juli, 2015.
Erfinder: Sonja Wolfrum (Siemens AG), Patrick Friedrichs (RWTH), Marc Hanebuth
(Siemens AG), Nicolas Stoltz (RWTH).
Table of Content
VI
Table of Content
Declaration ................................................................................................................................. II
Acknowledgement .................................................................................................................... III
Publications .............................................................................................................................. IV
Patents of the S-FB .................................................................................................................... V
Table of Content ....................................................................................................................... VI
List of Figures .......................................................................................................................... IX
List of Tables ........................................................................................................................... XII
List of Abbreviations ............................................................................................................. XIII
Abstract ................................................................................................................................... XV
Kurzfassung .......................................................................................................................... XVII
1 Introduction .......................................................................................................................... 1
1.1 Aim ................................................................................................................................... 2
2 Rare Earth Elements ............................................................................................................. 4
2.1 Definition and explanation of REE terms ........................................................................ 4
2.2 Applications and use of REE ........................................................................................... 5
2.3 Critical Elements of REE ................................................................................................. 8
2.3.1 Calculation of specific methods to evaluate CREE-deposits ............................. 10
2.3.2 Interpretation of CREO values in REE deposits ................................................ 12
3 Mineralogy & Geology ...................................................................................................... 17
3.1 REE Minerals and ores ................................................................................................... 17
3.2 Deposit Types ................................................................................................................. 19
3.3 Resources & Reserves .................................................................................................... 20
3.3.1 Terms .................................................................................................................. 20
3.4 REE Deposits ................................................................................................................. 25
3.4.1 LREE deposits .................................................................................................... 25
3.4.2 HREE+Y deposits .............................................................................................. 29
4 Economy ............................................................................................................................ 31
4.1 Market of the Rare Earth Elements ................................................................................ 31
4.1.1 Pricing ................................................................................................................ 36
4.1.2 Supply & Demand .............................................................................................. 38
4.1.3 Price Development ............................................................................................. 41
5 Development of the Database Management System (DBMS) ........................................... 51
Table of Content
VII
5.1 Definition of parameters ................................................................................................. 54
5.1.1 General Information ........................................................................................... 54
5.1.2 Geography .......................................................................................................... 54
5.1.3 Owner Information ............................................................................................. 56
5.1.4 Geology .............................................................................................................. 58
5.1.5 Mineralization .................................................................................................... 58
5.1.6 Material Grade .................................................................................................... 59
5.1.7 Economy ............................................................................................................. 60
5.1.8 Mining ................................................................................................................ 61
5.2 Structure of the DBMS ................................................................................................... 64
5.2.1 Tables ................................................................................................................. 64
5.2.2 Relationships ...................................................................................................... 66
5.2.3 Forms .................................................................................................................. 67
5.2.4 Queries ............................................................................................................... 71
5.3 Layout of the DBMS ...................................................................................................... 74
5.3.1 Design ................................................................................................................. 75
6 Systematization of the DBMS ............................................................................................ 77
6.1 Search Systems ............................................................................................................... 78
6.1.1 Detailed description of the Deposit Search Menu features ................................ 79
6.1.2 Occurrence Search Menu ................................................................................... 83
6.2 Compare Deposit Menu ................................................................................................. 84
6.2.1 Compare Deposit ................................................................................................ 84
6.2.2 Dynamic Basket Price Calculator ...................................................................... 86
6.2.3 Oxide & Metal Prices ......................................................................................... 87
6.2.4 Creation of Overall report .................................................................................. 89
6.3 Result Systems ............................................................................................................... 91
6.3.1 Rating ................................................................................................................. 91
6.3.2 Clustering ........................................................................................................... 94
6.3.3 Ranking .............................................................................................................. 95
6.3.4 Use-Value Analysis ............................................................................................ 96
7 Application of the DBMS ................................................................................................ 102
7.1 Comparison and Evaluation of REE deposits and occurrences ................................... 102
7.1.1 Rating ............................................................................................................... 102
7.1.2 Clustering Groups ............................................................................................ 108
7.2 Evaluation of REE deposits .......................................................................................... 119
7.2.1 Ranking ............................................................................................................ 119
VIII
7.2.2 Use-Value Analysis .......................................................................................... 126
8 Conclusion ....................................................................................................................... 142
8.1 Discussion .................................................................................................................... 142
8.2 Concluding Summary ................................................................................................... 149
9 Literature .......................................................................................................................... 152
10 Appendix .......................................................................................................................... 159
10.1 Appendix I .................................................................................................................... 159
10.2 Appendix II – Basket Price China Domestic of REE deposits .................................... 161
10.3 Appendix III – Basket Price FOB of REE deposits ..................................................... 163
10.4 Appendix IV – Material Grades of REE deposits ........................................................ 166
10.5 Appendix V – China Domestic & FOB Prices in US-$/kg .......................................... 171
10.6 Appendix VI – Ranking System ................................................................................... 172
10.7 Appendix VI – Results of Use-Value-Analysis. .......................................................... 176
List of Figures
IX
List of Figures
Figure 1: Global Rare Earth Element production from 1950 until 2000 (Haxel, et al., 2002)... 1
Figure 2: Criticality graph – Critical Elements plotted with respect to supply risk and economic
importance (European Commission, 2014). ............................................................................... 8
Figure 3: Criticality of REE, economic importance versus supply risk. .................................. 10
Figure 4: Major REE deposit types in a tectonic context. (Chakhmouradian & Wall, 2012) .. 20
Figure 5: Precision levels of the three different stages of a mineral resource. (Dominy, et al.,
2002) ......................................................................................................................................... 22
Figure 6: General relationships between Exploration Results, Mineral Resources and Ore
Reserves (JORC, 2004) ............................................................................................................ 23
Figure 7: Progress stages and timeline for a REE deposit (modified after (Lynas Corp., 2014))
.................................................................................................................................................. 24
Figure 8: Structural and functional coherence of the REE market. ......................................... 34
Figure 9: Exemplary view of the FOB prices from Q1 2011 until Q4 2012 (price data taken
from (Metal-Pages, 2015)). ...................................................................................................... 37
Figure 10: Connections between demand and supply companies in the REE market in 2012.
(logos are trademarks of companies, only used in this slide) ................................................... 40
Figure 11: Price development of lanthanum-, cerium- and Samarium-oxide (price data taken
from (Metal-Pages, 2015)). ..................................................................................................... 42
Figure 12: Price development of praseodymium- and neodymium-oxide (price data taken from
(Metal-Pages, 2015)). ............................................................................................................... 43
Figure 13: Price development of the three Heavy RE Oxides europium, terbium, dysprosium
plus yttrium (price data taken from (Metal-Pages, 2015)). ..................................................... 44
Figure 14: Price development of lanthanum-, cerium- and Samarium-oxide (price data taken
from (Metal-Pages, 2015)). ..................................................................................................... 45
Figure 15: Price development of praseodymium- and neodymium--oxide (price data taken from
(Metal-Pages, 2015)). ............................................................................................................... 46
Figure 16: Price development of europium-, terbium-, gadolinium-, dysprosium- and yttrium-
oxide (price data taken from (Metal-Pages, 2015)). ................................................................ 47
Figure 17: Basket Price China Domestic from 2005 until 2014. ............................................. 49
Figure 18: Basket Price FOB from 2005 until 2014. ............................................................... 50
Figure 19: Data entries, parameters, occurrences and deposits. ............................................... 51
Figure 20: Workflow of the development of the Database Management System ................... 53
Figure 21: Insert field attribute through the operation Data Type. .......................................... 65
Figure 22: Relationships between all tables / columns of the DBMS. ..................................... 66
Figure 23: Creation of Forms through different datasheets. .................................................... 67
Figure 24: Check boxes in the controls toolbox are used for implementing boxes into the form.
.................................................................................................................................................. 68
Figure 25: Exemplary view of building the form for the price feature. ................................... 68
Figure 26: Code Builder option inside the Form Builder with implemented boxes. ............... 69
Figure 27: Macro Builder with implemented codes. ................................................................ 70
Figure 28: Interacting Comboboxes in Visual Basic components. .......................................... 71
List of Figures
X
Figure 29: Definition of queries through the Query Builder. ................................................... 72
Figure 30: Forming relationships between different tables through “Cascadeafter”. .............. 73
Figure 31: Expression builder for Queries. .............................................................................. 74
Figure 32: Display of the Navigation Panel. ............................................................................ 75
Figure 33: Form Builder in MS-Access with Header, Detail, Footer and Property Sheet. ...... 76
Figure 34: Operation centre of the DBMS. .............................................................................. 78
Figure 35: Exemplary search within the Deposit Search Menu. .............................................. 79
Figure 36: Deposit Search – Deposit Araxa (Brazil). .............................................................. 80
Figure 37: Deposit Search – Result Deposit Araxa (Brazil) .................................................... 80
Figure 38: Deposit Search – Country (Brazil) and Ore (Monazite). ........................................ 81
Figure 39: Deposit Search – Country (Brazil) and Ore (Monazite). ........................................ 81
Figure 40: Deposit Search – Parameter Description. ............................................................... 83
Figure 41: Compare Menu with the above selected deposits, in the column “Material Grade”.
.................................................................................................................................................. 85
Figure 42: Export System to PFF/Excel conversion. ............................................................... 85
Figure 43: Basket Price Calculator with choices of deposit and year. ..................................... 87
Figure 44: Price Menus of the DBMS, depicted as a hierarchy. .............................................. 88
Figure 45: DBMS Price Feature for FOB Oxide. ..................................................................... 89
Figure 46: Overall Comparison menu viewing the deposits Mountain Pass and Storkwitz. ... 90
Figure 47: Rating system with range of AAA to C and explanations. ..................................... 93
Figure 48: Cluster Menu with five different clusters, exemplary “Eudialyte Cluster“. ........... 94
Figure 49: Ranking system with Material Grade and TREO. .................................................. 96
Figure 50: Use-Value-Analysis, determination of values, best-worst value system. ............... 97
Figure 51: Value-Point-Transformation. .................................................................................. 98
Figure 52: Preferences Matrices. .............................................................................................. 99
Figure 53: Scoring Model of Use-Value Analysis with goal criteria and weighting. ............ 100
Figure 54: Exemplary results of Use-Value Analysis according to defined rules ................. 101
Figure 55: Use-Value-Analysis – Stages. .............................................................................. 101
Figure 56: Excerpt of Rating system, showing categories AAA-AA. ................................... 103
Figure 57: Excerpt of Rating System, category A. ................................................................ 104
Figure 58: Excerpt of Rating system, category BBB. ............................................................ 105
Figure 59: Excerpt of Rating system, categories BB-B. ........................................................ 106
Figure 60: Excerpt of Rating system, categories CCC-C. ...................................................... 107
Figure 61: Excerpt of Eudialyte Clustering Group ................................................................ 110
Figure 62: Excerpt of Bastnasite Clustering Group ............................................................... 113
Figure 63: Excerpt of Monazite- Clustering Group ............................................................... 116
Figure 64: Ranking in case of Dy2O3 content, Rank first to 12th. .......................................... 120
Figure 65: Ranking by Dy2O3 content, Rank 29 to 41. .......................................................... 121
Figure 66: Overall Ranking of Material Grade ...................................................................... 122
Figure 67: TREO Ranking. .................................................................................................... 123
Figure 68: Top ten results of the first calculation of the DBMS Use-Value-Analysis (Use Case
I). ............................................................................................................................................ 129
Figure 69: Top ten results of the second calculation of the DBMS Use-Value-Analysis (Use
Case II). .................................................................................................................................. 133

List of Figures
XI
Figure 70: Top ten results of the third calculation of the DBMS Use-Value-Analysis (Use Case
III). .......................................................................................................................................... 136
Figure 71: Top ten results of the fourth calculation of the DBMS Use-Value-Analysis (Use Case
IV). ......................................................................................................................................... 139
List of Tables
XII
List of Tables
Table 1: Lanthanides and their approaches to the terms LREE, MREE & HREE+Y. .............. 5
Table 2: REE use in the diverse fields of applications. .............................................................. 6
Table 3: Excerpt of Appendix I with exemplary deposits and the corresponding CREO values
.................................................................................................................................................. 15
Table 4: Major Rare earth element minerals (Chakhmouradian & Wall, 2012) ...................... 18
Table 5: Material Grade (normative) in wt-%, according to seven sources. ........................... 26
Table 6: Mineral distribution of the deposits Maoniuping, Weishan, Mount Weld CLD and
Mountain Pass. ......................................................................................................................... 28
Table 7: Material grades of IAC deposits in Southern China (Shen, 2014). ............................ 30
Table 8: Column “General Information” and its different parameters ..................................... 65
Table 9: Attributive Ratings from categories AAA to C. ........................................................ 92
Table 10: Ranking Eudialyte- Clustering Group .................................................................... 111
Table 11: Ranking Bastnasite- Clustering Group .................................................................. 114
Table 12: Ranking Monazite-Clustering Groups ................................................................... 118
Table 13: Overall Ranking of TREO and single element TREO Ranking, Overall Ranking 1-
20. ........................................................................................................................................... 125
Table 14: Use Case I, basic scenario for UVA. ..................................................................... 127
Table 15: Use Case II, Material Grade and CREE scenario for UVA. .................................. 131
Table 16: Use Case III, Economy, Basket Prices and Production. ........................................ 134
Table 17: Use Case IV, Pr-, Nd- and Dy-oxide, Radioactive Elements and TREO .............. 137
Table 18: Results of Use Cases I – IV and total result including rank. ................................. 141
List of Abbreviations
XIII
List of Abbreviations
C
CREE Critical Rare Earth Element
D
DBMS Database Management System
F
FOB Free-On-Board
G
Geo Geology - project title
H
HREE Heavy Rare Earth Elements
HREO Heavy Rare Earth Oxides
I
IAC Ion Adsorption Clay(s)
J
JORC Joint Ore Reserve Committee of AustralAsian
JV Joint Venture
L
LCA Life Cycle Assesment
LCD Liquid-crystal display
LED Light-emitting diode
LOI Letter of Intent
LOM Life of mine
LREE Light Rare Earth Elements
M
MOU Memorandum of Understanding
MREE Medium Rare Earth Elements
MRT Magnetic resonance tomography
N
NCREE Non-Critical Rare Earth Elements
List of Abbreviations
XIV
NdFeB Neodymium Iron Boron (Permanent Magnet)
NI 43-101 National Instrument 43-101
P
PRC People's Republic of China
R
R&D Research and Development
REE Rare Earth Elements
REO Rare Earth Oxides
RoW Rest of the World
S
S-FB Siemens research unit
T
TREO Total Rare Earth Oxide
U
US-$/kg United States Dollar per kilogram
USA United States of America
Abstract
XV
Abstract
The future availability of Rare Earth Elements (REE) is a very important issue in the
21st century due to a rapid growth in demand Moreover, inequality between supply
and demand has led to monopolistic supply conditions controlled by China. This
resulted in severe challenges for REE consuming companies and competing REE
producers outside China. These circumstances had boosted exploration activities for
REE prospects worldwide over the past years.
Currently, there are several information sources on REE prospects scattered in
scientific literature, company reports, and feasibility studies. However, there is no
source accessible which contains all relevant data on REE occurrences and deposits.
REE are progressively gaining an essential part within new technologies, such as clean
energy, military, and consumer electronics sectors. With each of these sectors
incessantly expanding, industrial demand for the constituent REE is rising rapidly,
hence their inclusion in the group of strategic elements. An acute problem for strategic
elements is the concentration of the world's largest producers in a small number of
countries. However, the supply problems are partly based on complex ores, separation
issues, and the safe handling of hazardous elements. Further, it depends on the high
market volatility and increasing demand. Therefore, the evaluation of REE deposits
has become very crucial for sustaining the security of future supply. To analyse future
supply options, it is important to point out the difference between producing deposits,
a prospective deposit and a simple occurrence.
This dissertation analyses current REE prospects concerning geological,
mineralogical, economical, mining and environment-technical attributes by creating a
DBMS. Another part of this dissertation is the analysis of Critical REE (CREE) and its
market structure. These features are essential for analysing the REE sector and its
prospects. Moreover, they also help to validate the necessity for developing the DBMS.
The main part of developing the DBMS is based on information databases, which
contain collective information on 1190 prospects with known REE enrichment. The
data are, however, of differing accuracy and reliability, depending on the degree of
exploration undertaken to date. Grade and tonnage information is available for about
250 deposits, while more detailed geologic and economic parameters such as material
grade, defined resources (TREO tonnage) and reserves, CREE and Basket Price are
Abstract
XVI
known for 79 sites. In addition, the database also contains entries pertaining to the
abundances of toxic elements such as thorium and uranium.
The system includes an economic dataset of REE producing companies and potential
producing companies. The evaluation systems implemented in the DBMS are Rating,
Clustering, Ranking and Use-Value Analysis. However, all systems evaluate the
existing producing deposits as well as the potential deposits for possible future
production.
Further, the DBMS provides the opportunity to analyse the complete dataset of all
prospects by using the implemented rating system. This system includes all
occurrences and deposits worldwide and rates them according to attributes of market
and statuary mining codes. These attributes, are of high relevance with regard to the
assessment of the REE sector.
Thus, the evaluation system of Rating is a useful tool to analyse the complete REE
sector concerning producing and potential prospects
The evaluation system of Clustering is used to subdivide the REE sector by the ore-
containing raw mineral, which is relevant for industrial separation and use. Thus, within
the evaluation system Clustering, it is possible to constitute different Clustering
Groups, namely Eudialyte, Bastnasite and Monazite.
The third evaluation system is Ranking, which functions as a pre-evaluation system to
the Use-Value Analysis. It is a calculation tool that computes TREO values combined
with material grade values of single elements. As a result, it ranks the regarded
prospects in TREO per oxide. In this dissertation, three different ranking systems are
analysed. Most oxides are weighted equally. However, lanthanum, cerium and
samarium are weighted regressively. This is a consequence of the high abundance
and thus, lower prices for these oxides. The Use-Value Analysis is the main evaluation
system in the DBMS. It evaluates deposits according to selected parameters of the
categories Material Grade, Economy and Mining. These parameters include mineral
contents, presence of toxic elements, TREO tonnage, Basket Price and production
volume. Within the Use-Value Analysis, different case studies according to different
views on the REE sector are presented within this dissertation. These case studies
evaluate the REE sector concerning its economy, and environmental as well as
mineralogical issues.
Kurzfassung
XVII
Kurzfassung
Die Verfügbarkeit von Seltenen Erdelementen (SEE) ist im 21. Jahrhundert von stra-
tegischer Bedeutung aufgrund einer stetig wachsenden Nachfrage. Der SEE-Sektor
wird durch ein Ungleichgewicht in Angebot und Nachfrage sowie der Vormachtstellung
Chinas und des daraus resultierenden Monopols beschrieben. Dies führt zu enormen
Herausforderungen sowohl für SEE konsumierende Industrieunternehmen als auch für
konkurrierende SEE Produzenten außerhalb Chinas. Diese Gegebenheiten resultier-
ten in einer Verstärkung der Explorationsaktivitäten weltweiter SEE Prospekte in den
vergangenen Jahren.
Im Verlauf der fortschreitenden Technisierung in den letzten beiden Dekaden erlang-
ten SEE sukzessive einen essentielleren Stellenwert im Bereich Energie, Militär und
Elektronik. Durch den stetigen Ausbau dieser Sektoren erhöhte sich die Nachfrage
bezüglich SEE. Dies ist der Grund, SEE in die Gruppe der strategischen Elemente
einzubeziehen. Ein akutes Problem ist das Defizit zwischen Produktion und Nachfrage
bezüglich einzelner SEE wie Neodym, Europium, Terbium und Dysprosium sowie teil-
weise Praseodym und Yttrium. Diese Versorgungsprobleme basieren auf dem Abbau
komplexer Erze und den daraus resultierenden Separationsproblemen sowie in der
hohen Volatilität des Marktes und der steigenden Nachfrage. Daher ist die Evaluierung
SEE Lagerstätten essentiell um die zukünftige Versorgungssicherheit der SEE konsu-
mierenden Verbraucher zu gewährleisten. Insbesondere durch die hohe Nachfrage
nach Konsumgütern und Industrieanwendungen wie Magneten, Legierungen und
Elektronik steigt der Bedarf an SEE exponentiell an.
Diese Dissertation evaluiert SEE Prospekte bezüglich ihrer geologischen, mineralogi-
schen, ökonomischen sowie bergbau- und umwelttechnischen Eigenschaften durch
die Erstellung eines Datenbank Managementsystems (DBMS). Ein weiterer Teil dieser
Arbeit stellt die Evaluierung der kritischen SEE sowie der SEE Marktstruktur dar. Diese
Teilbereiche der Dissertation sind essentielle Bestandteile für die Evaluierung des
SEE-Sektors.
Das DBMS umfasst einen wirtschaftlichen Datensatz von SEE produzierenden sowie
potenziell produzierenden Unternehmen. Die implementierten Bewertungssysteme im
Kurzfassung
XVIII
DBMS sind Rating, Clustering, Ranking und eine Nutzwertanalyse. Die Systeme be-
werten mögliche zukünftige Produktionsmöglichkeiten anhand von implementierten At-
tributen und Kriterien.
Das System Rating erfasst den kompletten Datensatz aller weltweiten Prospekte.
Diese werden anhand von Marktattributen sowie Ressourcenzertifizierungs-Codes be-
wertet. Somit stellt das Bewertungssystem Rating ein nützliches Werkzeug dar, um
den kompletten SEE Sektor in Bezug auf produzierende und potenziell produzierende
SEE-führende Prospekte zu analysieren.
Das Bewertungssystem Clustering wird verwendet um den SEE Sektor in attributive
Teile zu unterteilen, welche ressourcenspezifische Merkmale aufweisen und von hoher
Relevanz sind. Diese Dissertation beinhaltet drei verschiedene Clustering Gruppen
bezogen auf die Erze Eudialyt, Bastnäsit und Monazit.
Das dritte Bewertungssystem, Ranking, ist ein System, welches als Vor-Evaluierungs-
system zur Nutzwertanalyse dient. Dieses System ist ein Kalkulationswerkzeug wel-
ches Werte des TREO und Material Grade miteinander kombiniert und als Resultat die
betrachteten Prospekte in TREO per Oxid bewertet.
Die Nutzwertanalyse ist das wichtigste Bewertungssystem im DBMS. Es bewertet La-
gerstätten anhand von ausgewählten Parametern der Kategorien Material Grade, Eco-
nomy und Mining. Diese Parameter beinhalten Informationen zur Mineralverteilung,
radioaktiven Elementen, TREO Tonnage, Basket Price und Produktionsvolumen. In
der Nutzwertanalyse sind verschiedene Use Cases basierend auf verschiedenen res-
sourcentechnischen Perspektiven bzgl. des SEE Sektors erstellt worden.
Introduction
1
1 Introduction
The importance of Rare Earth Elements (REE) can be very well understood with a
statement of Deng Xiaoping in 1992: “The middle East has oil. China has Rare Earths”
(Xiaoping, 1992). This declaration defines the REE as a geo-political resource.
The Chinese government exploited the fact that there is no other big producer world-
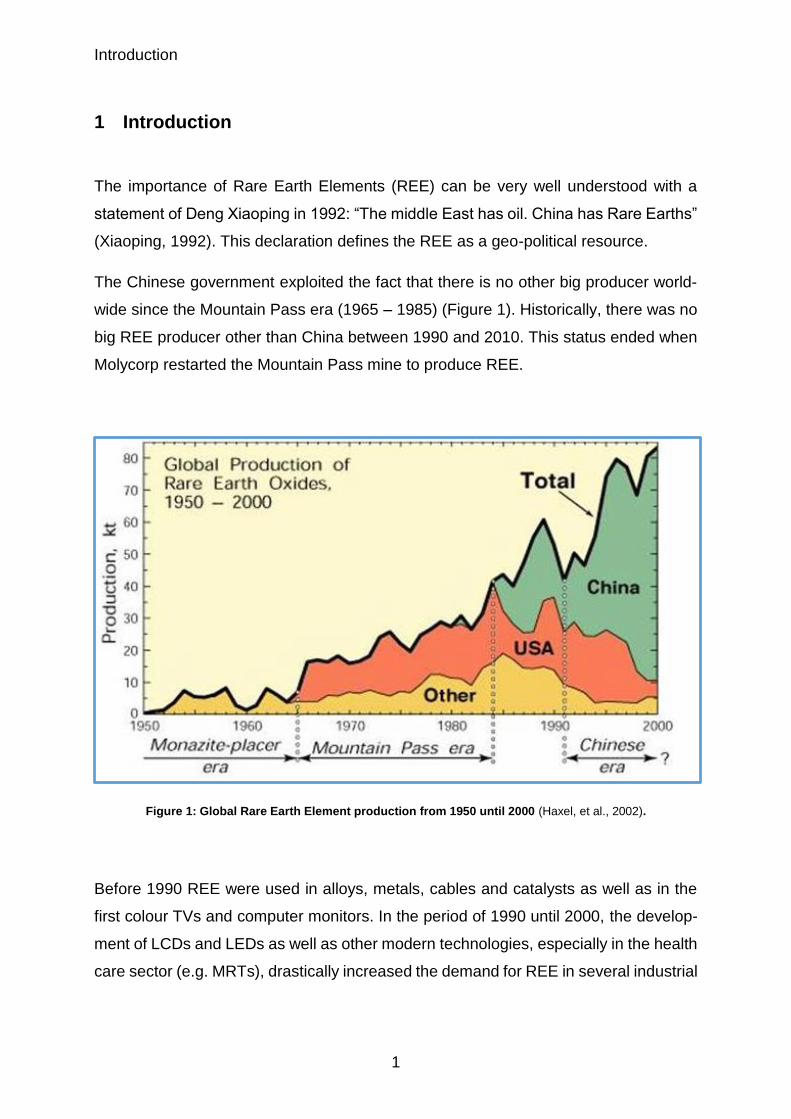
wide since the Mountain Pass era (1965 – 1985) (Figure 1). Historically, there was no
big REE producer other than China between 1990 and 2010. This status ended when
Molycorp restarted the Mountain Pass mine to produce REE.
Figure 1: Global Rare Earth Element production from 1950 until 2000 (Haxel, et al., 2002).
Before 1990 REE were used in alloys, metals, cables and catalysts as well as in the
first colour TVs and computer monitors. In the period of 1990 until 2000, the develop-
ment of LCDs and LEDs as well as other modern technologies, especially in the health
care sector (e.g. MRTs), drastically increased the demand for REE in several industrial
Introduction
2
sectors. Nowadays, REE are progressively gaining an essential role in new technolo-
gies, such as clean energy, military, and consumer electronics. With each of these
sectors incessantly expanding, the industries’ demand for the constituent REE in-
creases, hence their inclusion into the group of so-called strategic elements.
A crucial problem for strategic elements is that the main producers are clustered in a
small number of countries. For instance, China possesses a monopoly on the majority
of REE and has recently decreased their export quotas. The supply problems are partly
based on complex ores, separation issues, handling harmful elements, the high market
volatility, and increasing demand. Therefore, the evaluation of REE deposits has be-
come very crucial for sustaining the security of future supply. In times of high demand
for consumer goods and industrial applications like magnets, alloys, electronics and
additional fields, the need for REE increases exponentially. To analyse future supply
options, it is important to point out the difference between producing deposits, a pro-
spective deposit and a simple occurrence.
1.1 Aim
The aim of this thesis is the creation of a database management system (DBMS) for
evaluating global REE deposits and occurrences concerning their potential as future
REE suppliers.
Worldwide, there are no comparable systems simultaneously showing and evaluating
REE deposits and occurrences. The system should identify and classify current and
future REE resources and reserves. Further, it should characterize REE deposits ac-
cording to sustainability criteria and define their economic potential (i.e. in ground
value). Accordingly, the objective of this work is the development of a coherent DBMS
which analyses, compares and finally evaluates REE deposits and occurrences.
The herein developed DBMS includes implemented search and compare functions as
well as evaluation classifications. The assessment of deposits and occurrences is
based on specific predefined, parameters. The selection of the parameters is based
on geological, mineralogical, economic and environmental criteria. These parameters
are defined within the structure of the DBMS. In this regard, the DBMS includes three
Introduction
3
main systems, a search, a comparison and an evaluation system. The three major
systems are interconnected via the criterion Deposit.
The dissertation was developed as part of the S - FB (Siemens research unit) at RWTH
Aachen University and represents the sub project 1.2 (TP 1.2). The S-FB was estab-
lished in 2011 by Siemens AG and RWTH Aachen University to evaluate the Rare
Earth sector and to establish a process chain for Rare Earth mining and separation.
The four-year project was completely funded by Siemens AG. The project consisted of
six subprojects (TP 1 – 6) which dealt with the subjects of geology, mining, separation,
processing, metallurgy and life cycle assessment concerning REE deposits and their
products. Partial project TP 1 (Geo) was further divided into two sections. Division 1
(TP 1.1) was responsible for the geo-metallurgy and sample analyse of REE deposits,
whereas division 2 (TP 1.2) dealt with analysing REE deposits and occurrences world-
wide with the aid of a Database Management System. Additionally, TP 1.2 developed
six invention disclosures resulting in three patent applications. All inventions and pa-
tents are property of Siemens AG.
The initial need for TP 1.2 can be explained by a current lack of one comprehensive
database covering geological, mineralogical, economic and environmental parameters
of REE prospects and mining. Thus, the contribution to the S-FB project is the identifi-
cation and classification of current and future REE resources. Thereby, the REE de-
posits are characterized according to sustainability criteria and their economic potential
(i.e. in-ground value). The objectives and methods used in this R&D project are the
acquisition of information and data including geological, mineralogical, economic and
environmental aspects from REE deposits and prospects worldwide. Moreover, these
data have to be evaluated, screened and implemented into a database structure with
linkages that enables the classification of all REE deposits and occurrences worldwide.
Rare Earth Elements
4
2 Rare Earth Elements
2.1 Definition and explanation of REE terms
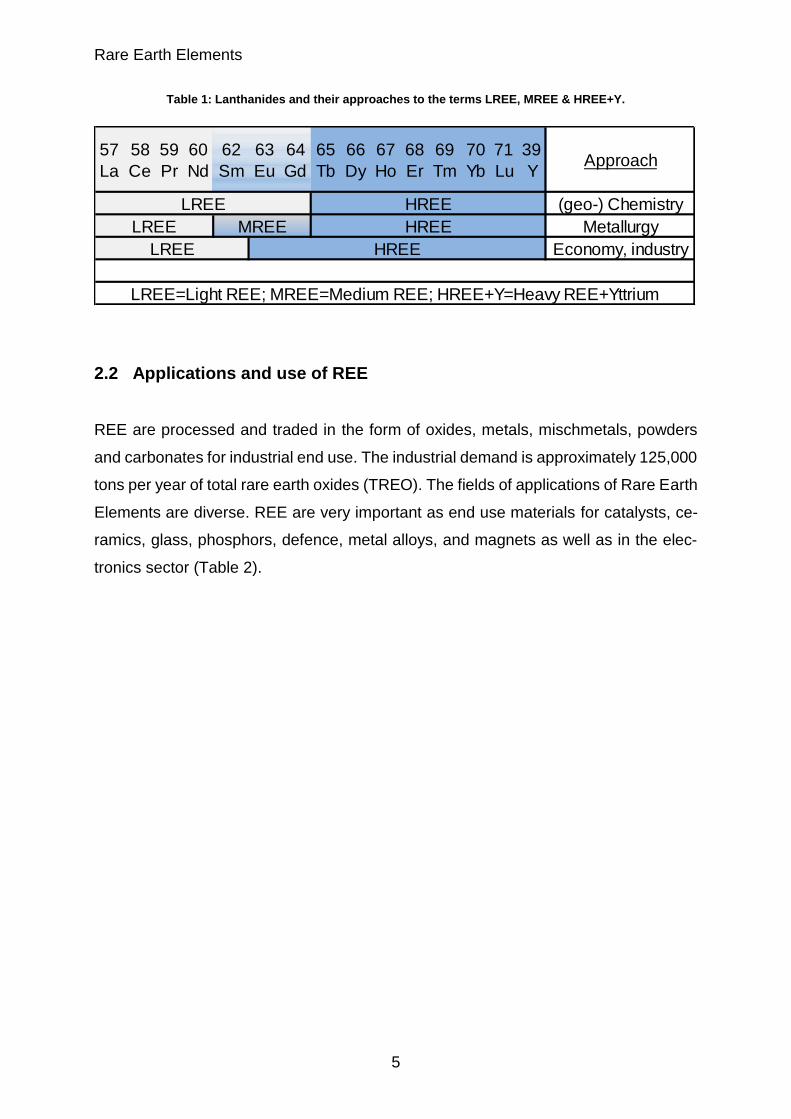
The differentiation between light, medium and heavy REEs evokes a rather controver-
sial discussion. There are a couple of misleading usages of the term REE. In (geo-)
chemistry, metallurgy, economy/ mining and the industrial sector, the usage of the
terms light (LREE), medium (MREE) and heavy REE (HREE) often differs.
In (geo-) chemistry, LREE are defined from lanthanum to gadolinium (Table 1) because
of the increasing unpaired electrons from 0 to 7. In contrast to that, LREE in metallurgy
are classified from lanthanum to neodymium due to the calculation and design of sep-
aration and processing issues. In the mining sector, LREE are grouped from lanthanum
to samarium due to big price margins in the years 2010-2012 as well as high demand
and small supply, and high scarcity of HREE.
Within the metallurgical sector, the elements from samarium to gadolinium are classi-
fied as MREE (Table 1). MREE are also called the SEG (samarium, europium and
gadolinium) group because of its occurrence within the early stages of SX (Solvent
Extraction) (Hatch, 2012). SX stages are the main commercial processes used to sep-
arate and purify REE (Hatch, 2012).
Further, both approaches – the (geo-) chemical as well as the metallurgical – group
HREE from terbium to lutetium plus yttrium. Thus, HREEs are classified from terbium
to lutetium (Table 1) because of their paired electrons from 6 to 0. Yttrium is imple-
mented into the HREE group due to its similar ionic radius and its chemical properties.
According to the economical approach, HREE are classified from europium to lutetium
plus yttrium (Table 1). Therein, europium and gadolinium are classified as Heavy REE
(Hatch, 2012) because of their high volatile prices. In line with these differentiations,
the economical approach assigns the elements from holmium to ytterbium as HREE
merely due to their scarcity in supply. In terms of prices, these elements are as high
as for example neodymium or praseodymium.
Rare Earth Elements
5
Table 1: Lanthanides and their approaches to the terms LREE, MREE & HREE+Y.
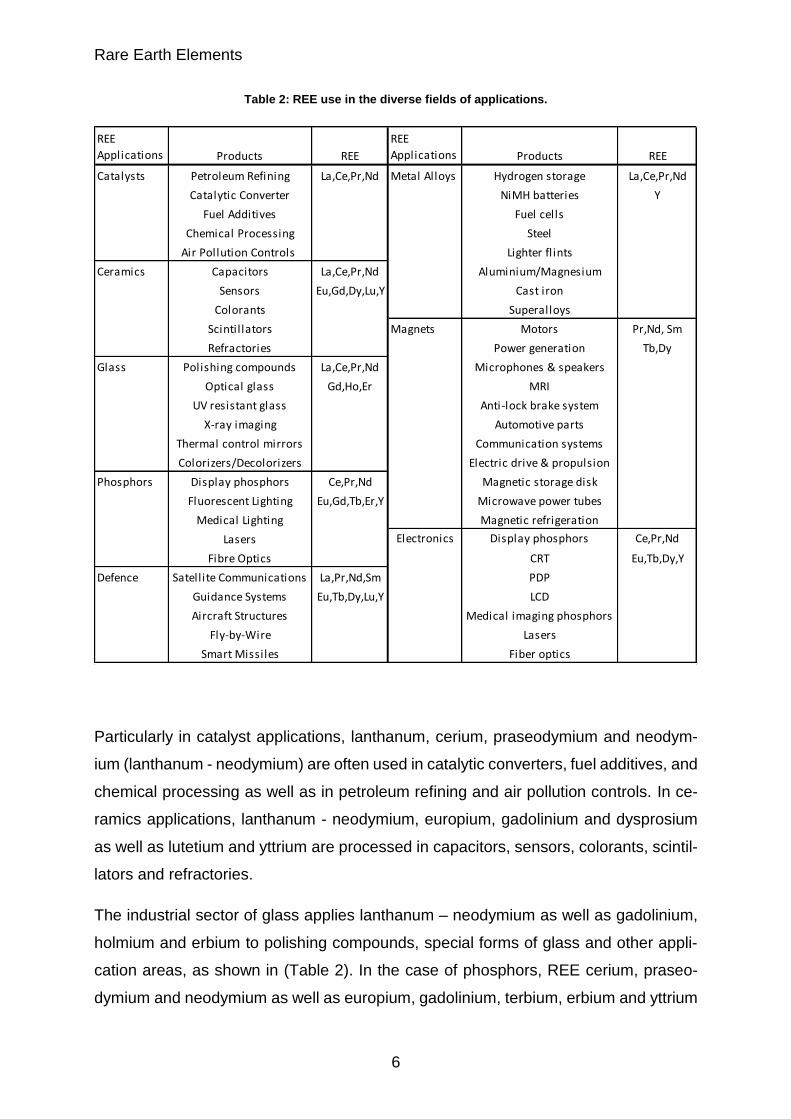
2.2 Applications and use of REE
REE are processed and traded in the form of oxides, metals, mischmetals, powders
and carbonates for industrial end use. The industrial demand is approximately 125,000
tons per year of total rare earth oxides (TREO). The fields of applications of Rare Earth
Elements are diverse. REE are very important as end use materials for catalysts, ce-
ramics, glass, phosphors, defence, metal alloys, and magnets as well as in the elec-
tronics sector (Table 2).
57
La
58
Ce
59
Pr
60
Nd
62
Sm
63
Eu
64
Gd
65
Tb
66
Dy
67
Ho
68
Er
69
Tm
70
Yb
71
Lu
39
YApproach
(geo-) Chemistry
Metallurgy
Economy, industry
LREE=Light REE; MREE=Medium REE; HREE+Y=Heavy REE+Yttrium
MREE
LREE HREE
LREE HREE
LREE HREE
Rare Earth Elements
6
Table 2: REE use in the diverse fields of applications.
Particularly in catalyst applications, lanthanum, cerium, praseodymium and neodym-
ium (lanthanum - neodymium) are often used in catalytic converters, fuel additives, and
chemical processing as well as in petroleum refining and air pollution controls. In ce-
ramics applications, lanthanum - neodymium, europium, gadolinium and dysprosium
as well as lutetium and yttrium are processed in capacitors, sensors, colorants, scintil-
lators and refractories.
The industrial sector of glass applies lanthanum – neodymium as well as gadolinium,
holmium and erbium to polishing compounds, special forms of glass and other appli-
cation areas, as shown in (Table 2). In the case of phosphors, REE cerium, praseo-
dymium and neodymium as well as europium, gadolinium, terbium, erbium and yttrium
REE
Applications Products REE
REE
Applications Products REE
Catalysts Petroleum Refining La,Ce,Pr,Nd Metal Alloys Hydrogen storage La,Ce,Pr,Nd
Catalytic Converter NiMH batteries Y
Fuel Additives Fuel cells
Chemical Processing Steel
Air Pollution Controls Lighter fl ints
Ceramics Capacitors La,Ce,Pr,Nd Aluminium/Magnesium
Sensors Eu,Gd,Dy,Lu,Y Cast iron
Colorants Superalloys
Scintil lators Magnets Motors Pr,Nd, Sm
Refractories Power generation Tb,Dy
Glass Polishing compounds La,Ce,Pr,Nd Microphones & speakers
Optical glass Gd,Ho,Er MRI
UV resistant glass Anti-lock brake system
X-ray imaging Automotive parts
Thermal control mirrors Communication systems
Colorizers/Decolorizers Electric drive & propulsion
Phosphors Display phosphors Ce,Pr,Nd Magnetic storage disk
Fluorescent Lighting Eu,Gd,Tb,Er,Y Microwave power tubes
Medical Lighting Magnetic refrigeration
Lasers Electronics Display phosphors Ce,Pr,Nd
Fibre Optics CRT Eu,Tb,Dy,Y
Defence Satellite Communications La,Pr,Nd,Sm PDP
Guidance Systems Eu,Tb,Dy,Lu,Y LCD
Aircraft Structures Medical imaging phosphors
Fly-by-Wire Lasers
Smart Missiles Fiber optics
Rare Earth Elements
7
are processed in display phosphors, special modules of lighting, lasers and fibre optics
(Table 2).
REE also play an important role in the defence industry. Lanthanum, praseodymium,
neodymium and samarium as well as europium, terbium, dysprosium, lutetium and
yttrium are processed primarily for use in satellite communications, guidance systems
and missiles (Table 2). Furthermore, praseodymium, neodymium, samarium and dys-
prosium are often used in missiles as well as in guidance systems by using samarium
Cobalt (SmCo) and Neodymium Iron Boron (NdFeB) permanent magnets (Grasso,
2013). Samarium is a component of SmCo magnets used in many defence and com-
mercial technologies. Neodymium, in combination with praseodymium and dyspro-
sium, is processed to create the strongest available permanent magnets for wind gen-
eration.
In the industrial sector of magnets, praseodymium, neodymium, samarium, terbium
and dysprosium are essential raw materials for the production of motors, permanent
magnets, automotive parts and other technologies (Table 2). Further, in electronics,
cerium, praseodymium and neodymium as well as europium, terbium, dysprosium and
yttrium are used in CRT (Cardiac Resynchronization Therapy), PDP (Programmed
Data Processor), LCD (Liquid Crystal Display), fibre optics, lasers and other applica-
tions (Table 2).
In the metal alloys sector, lanthanum – neodymium and yttrium are used in batteries,
fuel cells, steel, flints, superalloys and other applications (Table 2). For instance, lan-
thanum can be applied to make steel more malleable (Rare Earth Technology Alliance,
2015).
Regarding the different usages of REE, one can state that critical REE (CREE) are
used in nearly all application areas. Therefore, this group of elements must be ob-
served and evaluated in detail, particularly in regard to possible economic conse-
quences.
Rare Earth Elements
8
2.3 Critical Elements of REE
The term Critical Elements can be defined as those elements gaining high economic
importance mostly due to a lack in supply and therefore, a high supply risk. The term
was first established by the European Commission (European Commission, 2014). In
the first draft of the European Commission in 2010, there was a list of fourteen critical
elements pointed out a potential economic risk (European Commission, 2014). In the
second draft in 2013, the list contained twenty critical elements (European
Commission, 2014).
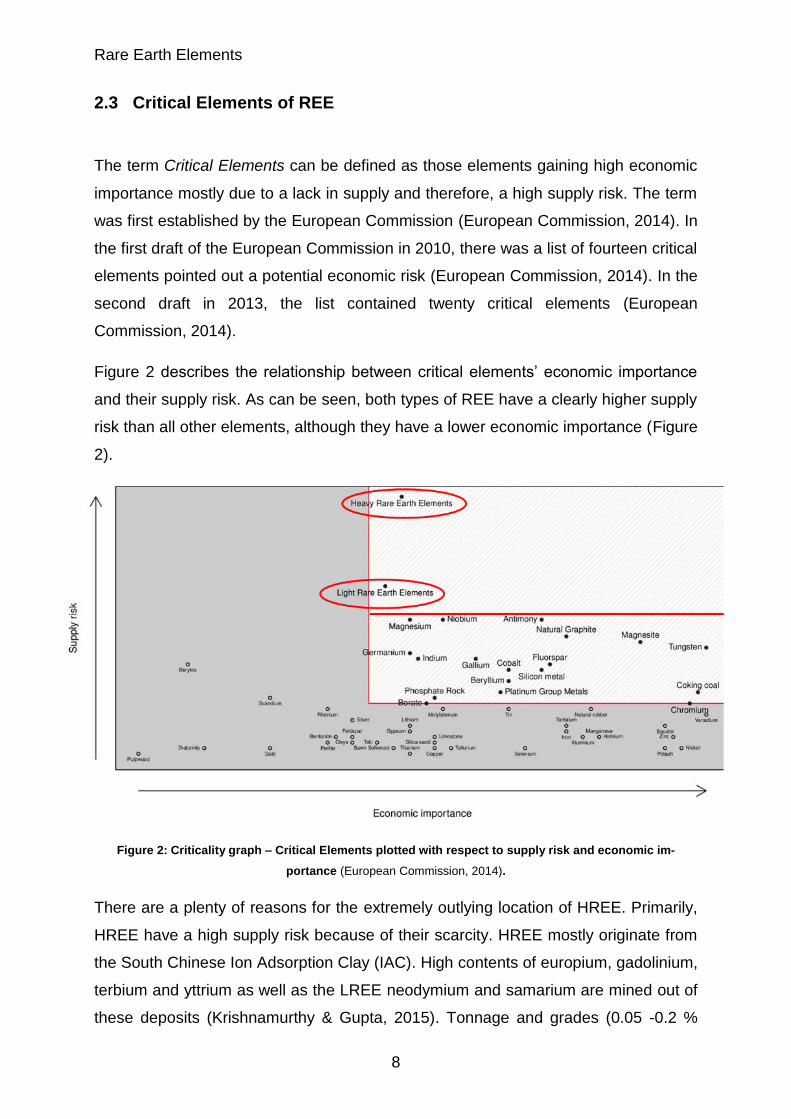
Figure 2 describes the relationship between critical elements’ economic importance
and their supply risk. As can be seen, both types of REE have a clearly higher supply
risk than all other elements, although they have a lower economic importance (Figure
2).
Figure 2: Criticality graph – Critical Elements plotted with respect to supply risk and economic im-
portance (European Commission, 2014).
There are a plenty of reasons for the extremely outlying location of HREE. Primarily,
HREE have a high supply risk because of their scarcity. HREE mostly originate from
the South Chinese Ion Adsorption Clay (IAC). High contents of europium, gadolinium,
terbium and yttrium as well as the LREE neodymium and samarium are mined out of
these deposits (Krishnamurthy & Gupta, 2015). Tonnage and grades (0.05 -0.2 %
Rare Earth Elements
9
REO) of REE content in IAC deposits are the lowest of all Chinese deposits
(Krishnamurthy & Gupta, 2015). Moreover, Chinese IAC deposits have tonnages
smaller than 10,000 tons of Mineral Resources (British Geological Survey (BGS),
2011). Furthermore, in the last twenty years the ratio of reserves of IAC in contrast to
the production declined from 50:1 to 15:1 (Krishnamurthy & Gupta, 2015). Thus, the
highly-demanded HREE will have a high supply risk for the future.
In addition, LREE also tend to remain critical in the case of neodymium and, to a lesser
extent, praseodymium. The high demand for these elements for industrial application
leads to a higher supply risk. Another reason is that the Chinese mine Bayan Obo is
currently the main producer of LREE.
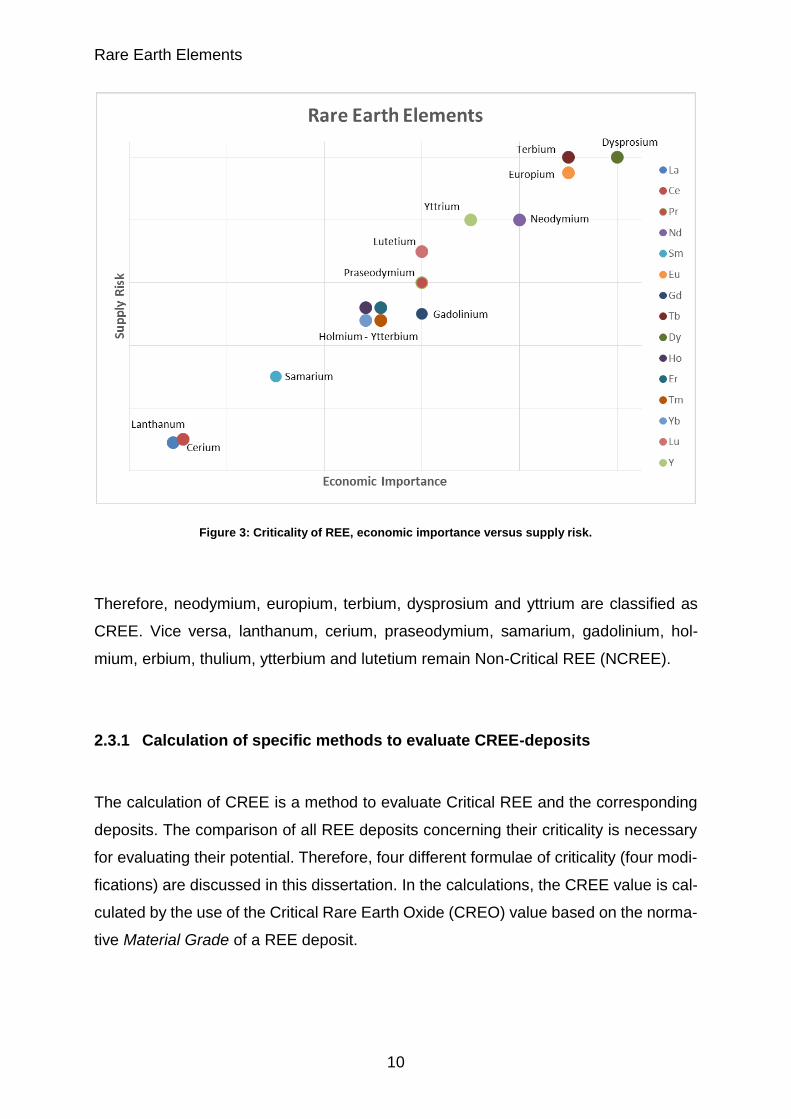
Figure 3 depicts the economic importance versus supply risk of the elements within
the REE Group. There is a rather linear trend, i.e. a low supply risk implies a low eco-
nomic importance. This can be explained by the economic principle of demand con-
trolling supply. In this case, due to the limited nature of these resources, all REE with
a high economic importance carry the risk that, at a certain point in time, there will not
be enough material to meet the high demand of the market.
Rare Earth Elements
10
Figure 3: Criticality of REE, economic importance versus supply risk.
Therefore, neodymium, europium, terbium, dysprosium and yttrium are classified as
CREE. Vice versa, lanthanum, cerium, praseodymium, samarium, gadolinium, hol-
mium, erbium, thulium, ytterbium and lutetium remain Non-Critical REE (NCREE).
2.3.1 Calculation of specific methods to evaluate CREE-deposits
The calculation of CREE is a method to evaluate Critical REE and the corresponding
deposits. The comparison of all REE deposits concerning their criticality is necessary
for evaluating their potential. Therefore, four different formulae of criticality (four modi-
fications) are discussed in this dissertation. In the calculations, the CREE value is cal-
culated by the use of the Critical Rare Earth Oxide (CREO) value based on the norma-
tive Material Grade of a REE deposit.
Rare Earth Elements
11
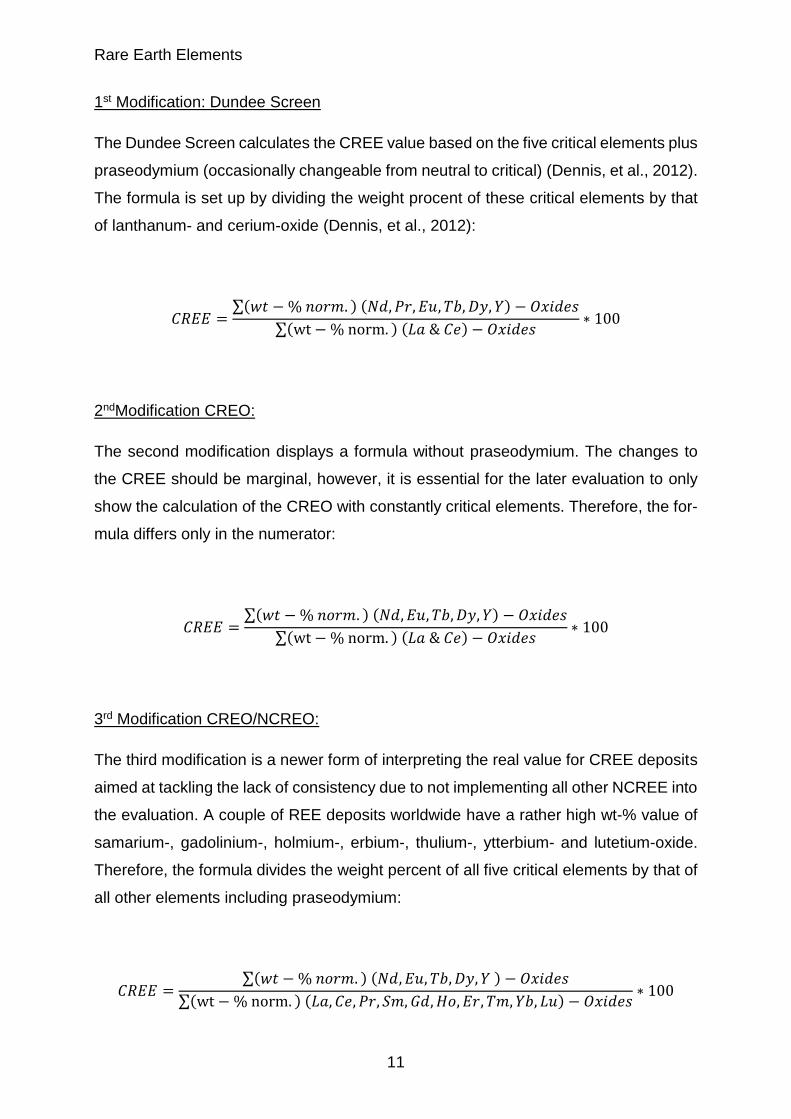
1st Modification: Dundee Screen
The Dundee Screen calculates the CREE value based on the five critical elements plus
praseodymium (occasionally changeable from neutral to critical) (Dennis, et al., 2012).
The formula is set up by dividing the weight procent of these critical elements by that
of lanthanum- and cerium-oxide (Dennis, et al., 2012):
𝐶𝑅𝐸𝐸 =∑(𝑤𝑡 − % 𝑛𝑜𝑟𝑚. ) (𝑁𝑑, 𝑃𝑟, 𝐸𝑢, 𝑇𝑏, 𝐷𝑦, 𝑌) − 𝑂𝑥𝑖𝑑𝑒𝑠
∑(wt − % norm. ) (𝐿𝑎 & 𝐶𝑒) − 𝑂𝑥𝑖𝑑𝑒𝑠∗ 100
2ndModification CREO:
The second modification displays a formula without praseodymium. The changes to
the CREE should be marginal, however, it is essential for the later evaluation to only
show the calculation of the CREO with constantly critical elements. Therefore, the for-
mula differs only in the numerator:
𝐶𝑅𝐸𝐸 =∑(𝑤𝑡 − % 𝑛𝑜𝑟𝑚. ) (𝑁𝑑, 𝐸𝑢, 𝑇𝑏, 𝐷𝑦, 𝑌) − 𝑂𝑥𝑖𝑑𝑒𝑠
∑(wt − % norm. ) (𝐿𝑎 & 𝐶𝑒) − 𝑂𝑥𝑖𝑑𝑒𝑠∗ 100
3rd Modification CREO/NCREO:
The third modification is a newer form of interpreting the real value for CREE deposits
aimed at tackling the lack of consistency due to not implementing all other NCREE into
the evaluation. A couple of REE deposits worldwide have a rather high wt-% value of
samarium-, gadolinium-, holmium-, erbium-, thulium-, ytterbium- and lutetium-oxide.
Therefore, the formula divides the weight percent of all five critical elements by that of
all other elements including praseodymium:
𝐶𝑅𝐸𝐸 =∑(𝑤𝑡 − % 𝑛𝑜𝑟𝑚. ) (𝑁𝑑, 𝐸𝑢, 𝑇𝑏, 𝐷𝑦, 𝑌 ) − 𝑂𝑥𝑖𝑑𝑒𝑠
∑(wt − % norm. ) (𝐿𝑎, 𝐶𝑒, 𝑃𝑟, 𝑆𝑚, 𝐺𝑑, 𝐻𝑜, 𝐸𝑟, 𝑇𝑚, 𝑌𝑏, 𝐿𝑢) − 𝑂𝑥𝑖𝑑𝑒𝑠∗ 100
Rare Earth Elements
12
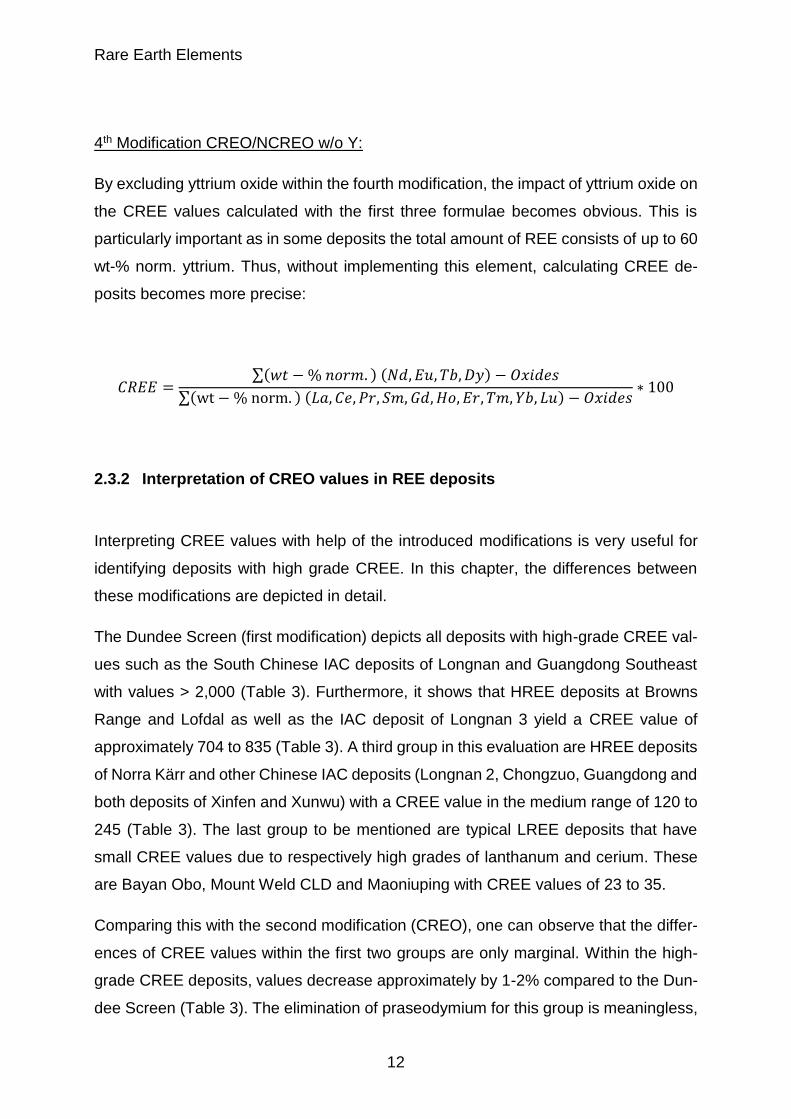
4th Modification CREO/NCREO w/o Y:
By excluding yttrium oxide within the fourth modification, the impact of yttrium oxide on
the CREE values calculated with the first three formulae becomes obvious. This is
particularly important as in some deposits the total amount of REE consists of up to 60
wt-% norm. yttrium. Thus, without implementing this element, calculating CREE de-
posits becomes more precise:
𝐶𝑅𝐸𝐸 =∑(𝑤𝑡 − % 𝑛𝑜𝑟𝑚. ) (𝑁𝑑, 𝐸𝑢, 𝑇𝑏, 𝐷𝑦) − 𝑂𝑥𝑖𝑑𝑒𝑠
∑(wt − % norm. ) (𝐿𝑎, 𝐶𝑒, 𝑃𝑟, 𝑆𝑚, 𝐺𝑑, 𝐻𝑜, 𝐸𝑟, 𝑇𝑚, 𝑌𝑏, 𝐿𝑢) − 𝑂𝑥𝑖𝑑𝑒𝑠∗ 100
2.3.2 Interpretation of CREO values in REE deposits
Interpreting CREE values with help of the introduced modifications is very useful for
identifying deposits with high grade CREE. In this chapter, the differences between
these modifications are depicted in detail.
The Dundee Screen (first modification) depicts all deposits with high-grade CREE val-
ues such as the South Chinese IAC deposits of Longnan and Guangdong Southeast
with values > 2,000 (Table 3). Furthermore, it shows that HREE deposits at Browns
Range and Lofdal as well as the IAC deposit of Longnan 3 yield a CREE value of
approximately 704 to 835 (Table 3). A third group in this evaluation are HREE deposits
of Norra Kärr and other Chinese IAC deposits (Longnan 2, Chongzuo, Guangdong and
both deposits of Xinfen and Xunwu) with a CREE value in the medium range of 120 to
245 (Table 3). The last group to be mentioned are typical LREE deposits that have
small CREE values due to respectively high grades of lanthanum and cerium. These
are Bayan Obo, Mount Weld CLD and Maoniuping with CREE values of 23 to 35.
Comparing this with the second modification (CREO), one can observe that the differ-
ences of CREE values within the first two groups are only marginal. Within the high-
grade CREE deposits, values decrease approximately by 1-2% compared to the Dun-
dee Screen (Table 3). The elimination of praseodymium for this group is meaningless,
Rare Earth Elements
13
as these deposits have rather low levels of praseodymium. Similarly, within HREE de-
posits, CREE value decreases 1-3% (Table 3).
However, the third group shows much higher changes ranging from 5 to 15% (Table
3). This shows that the corresponding deposits contain higher amounts of praseodym-
ium. Even more extreme is the difference between Dundee and CREO regarding LREE
deposits, as this group exhibits differences between 21 and 25% (Table 3). Thus, the
amount of praseodymium in these is the highest of those deposits considered here.
Accordingly, this approach shows that comparing the Dundee Screen with CREO is a
useful and quite easy method to identify deposits with a significant amount of praseo-
dymium, since e.g. deposits with high values of praseodymium like Mount Weld CLD,
Bayan Obo or Maoniuping are rated considerably better within the Dundee Screen than
within CREO.
Comparing the percentage changes between the Dundee Screen and CREO using the
third modification CREO/NCREO, one can identify major differences in the evaluated
deposits’ values in Table 3.
In comparison to the Dundee Screen and CREO, changes between 84 and 89% are
observed within the first group (Longnan 1 – Guangdong Southeast), whereas within
the second group (Browns Range – Lofdal-Bergville) the percentage changes yield 66-
72% (Table 3). One can state that the values of both groups converge within the third
modification.
In contrast to the clear changes within the first two groups, the third (Chongzuo –
Xunwu 1) and fourth groups (Mount Weld CLD – Maoniuping) show only minor differ-
ences concerning the comparison of the Dundee Screen vs. CREO/NCREO, respec-
tively CREO vs. CREO/NCREO. Nevertheless, even these differences between the
Dundee Screen and CREO are apparent. While comparing the third group concerning
the Dundee Screen vs. CREO/NCREO and CREO vs. CREO/NCREO, the differences
reach 37-52% and 31-46% respectively (Table 3).
Within the fourth group, the value changes differ yet again. While comparing the Dun-
dee Screen to CREO/NCREO, the percentage difference amounts to 29-31%, whereas
the comparison of CREO and CREO/NCREO only yields changes of 8-11%.
It can be therefore be concluded that the analysed groups converge. Differences of
formerly 7,000 – 10,000 % (comparison of first and fourth group in the Dundee Screen
Rare Earth Elements
14
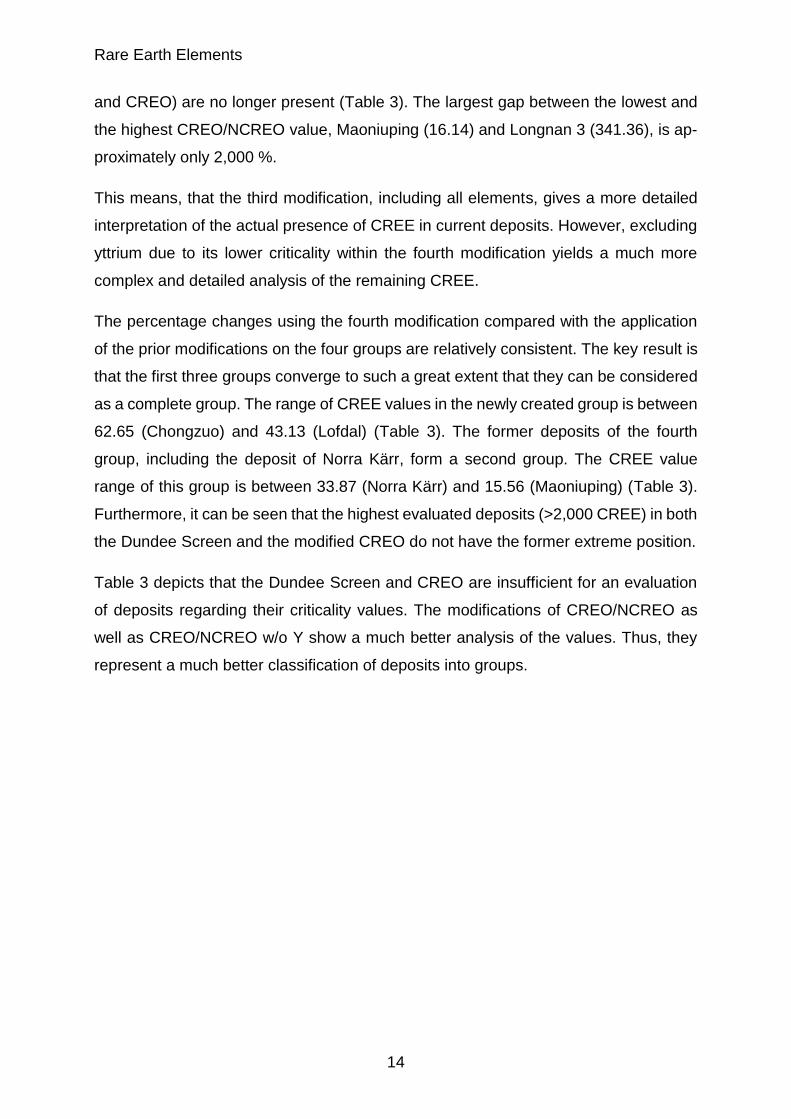
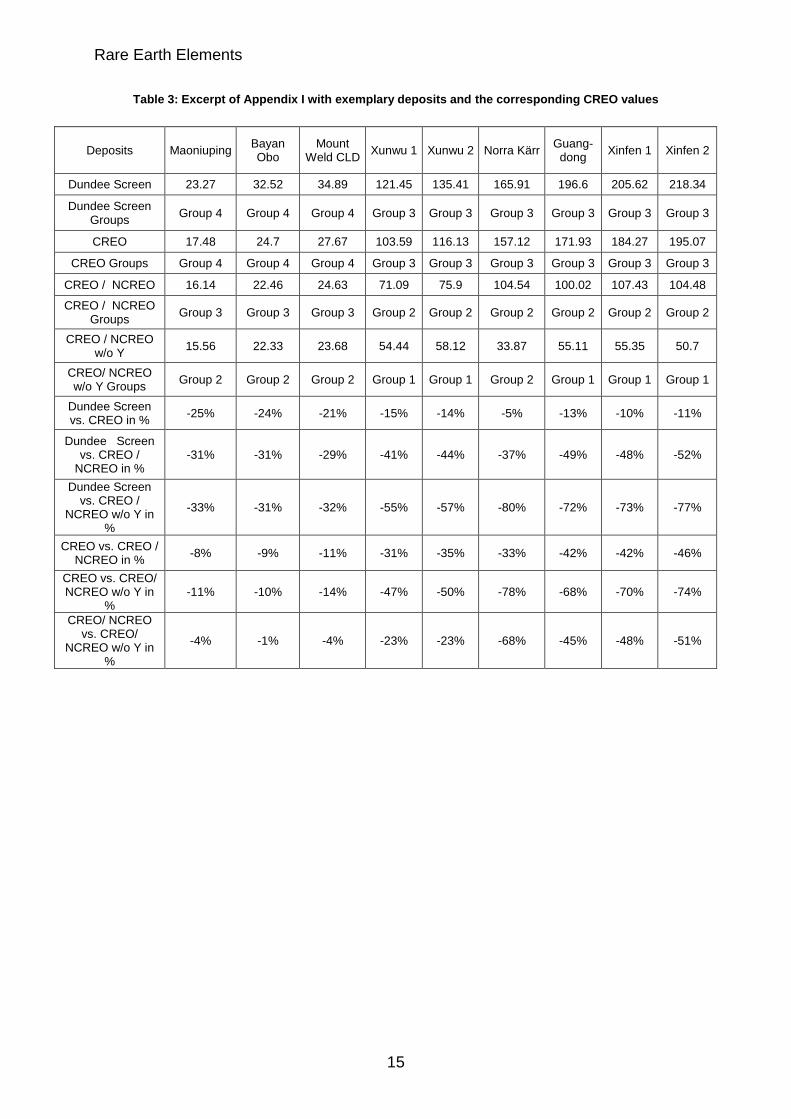
and CREO) are no longer present (Table 3). The largest gap between the lowest and
the highest CREO/NCREO value, Maoniuping (16.14) and Longnan 3 (341.36), is ap-
proximately only 2,000 %.
This means, that the third modification, including all elements, gives a more detailed
interpretation of the actual presence of CREE in current deposits. However, excluding
yttrium due to its lower criticality within the fourth modification yields a much more
complex and detailed analysis of the remaining CREE.
The percentage changes using the fourth modification compared with the application
of the prior modifications on the four groups are relatively consistent. The key result is
that the first three groups converge to such a great extent that they can be considered
as a complete group. The range of CREE values in the newly created group is between
62.65 (Chongzuo) and 43.13 (Lofdal) (Table 3). The former deposits of the fourth
group, including the deposit of Norra Kärr, form a second group. The CREE value
range of this group is between 33.87 (Norra Kärr) and 15.56 (Maoniuping) (Table 3).
Furthermore, it can be seen that the highest evaluated deposits (>2,000 CREE) in both
the Dundee Screen and the modified CREO do not have the former extreme position.
Table 3 depicts that the Dundee Screen and CREO are insufficient for an evaluation
of deposits regarding their criticality values. The modifications of CREO/NCREO as
well as CREO/NCREO w/o Y show a much better analysis of the values. Thus, they
represent a much better classification of deposits into groups.
Rare Earth Elements
15
Table 3: Excerpt of Appendix I with exemplary deposits and the corresponding CREO values
Deposits Maoniuping Bayan Obo
Mount Weld CLD
Xunwu 1 Xunwu 2 Norra Kärr Guang-dong
Xinfen 1 Xinfen 2
Dundee Screen 23.27 32.52 34.89 121.45 135.41 165.91 196.6 205.62 218.34
Dundee Screen Groups
Group 4 Group 4 Group 4 Group 3 Group 3 Group 3 Group 3 Group 3 Group 3
CREO 17.48 24.7 27.67 103.59 116.13 157.12 171.93 184.27 195.07
CREO Groups Group 4 Group 4 Group 4 Group 3 Group 3 Group 3 Group 3 Group 3 Group 3
CREO / NCREO 16.14 22.46 24.63 71.09 75.9 104.54 100.02 107.43 104.48
CREO / NCREO Groups
Group 3 Group 3 Group 3 Group 2 Group 2 Group 2 Group 2 Group 2 Group 2
CREO / NCREO w/o Y
15.56 22.33 23.68 54.44 58.12 33.87 55.11 55.35 50.7
CREO/ NCREO w/o Y Groups
Group 2 Group 2 Group 2 Group 1 Group 1 Group 2 Group 1 Group 1 Group 1
Dundee Screen vs. CREO in %
-25% -24% -21% -15% -14% -5% -13% -10% -11%
Dundee Screen vs. CREO /
NCREO in % -31% -31% -29% -41% -44% -37% -49% -48% -52%
Dundee Screen vs. CREO /
NCREO w/o Y in %
-33% -31% -32% -55% -57% -80% -72% -73% -77%
CREO vs. CREO / NCREO in %
-8% -9% -11% -31% -35% -33% -42% -42% -46%
CREO vs. CREO/ NCREO w/o Y in
% -11% -10% -14% -47% -50% -78% -68% -70% -74%
CREO/ NCREO vs. CREO/
NCREO w/o Y in %
-4% -1% -4% -23% -23% -68% -45% -48% -51%
Rare Earth Elements
16
Table 3: continued
Deposits Chong-zuo
Lofdal-Bergville
Longnan 2
Browns Range
Guangdong Southeast
Longnan 4 Longnan 3 Longnan 1
Dundee Screen 245.45 704.26 822.65 835.66 2052.78 2057.49 2400.61 2519.19
Dundee Screen Groups
Group 3 Group 2 Group 2 Group 2 Group 1 Group 1 Group 1 Group 1
CREO 221.72 697.52 799.12 825.74 2,036.11 2,024.46 2,367.58 2,486.20
CREO Groups Group 3 Group 2 Group 2 Group 2 Group 1 Group 1 Group 1 Group 1
CREO / NCREO 122.34 238.33 268.74 232.59 255.4 324.83 341.36 280.87
CREO / NCREO Groups
Group 2 Group 1 Group 1 Group 1 Group 1 Group 1 Group 1 Group 1
CREO / NCREO w/o Y
62.65 43.13 57.4 46.16 48.78 49.07 54.89 59.11
CREO/ NCREO w/o Y Groups
Group 1 Group 1 Group 1 Group 1 Group 1 Group 1 Group 1 Group 1
Dundee Screen vs. CREO in %
-10% -1% -3% -1% -1% -2% -1% -1%
Dundee Screen vs. CREO / NCREO in
% -50% -66% -67% -72% -88% -84% -86% -89%
Dundee Screen vs. CREO / NCREO w/o
Y in % -74% -94% -93% -94% -98% -98% -98% -98%
CREO vs. CREO / NCREO in %
-45% -66% -66% -72% -87% -84% -86% -89%
CREO vs. CREO/ NCREO w/o Y in %
-72% -94% -93% -94% -98% -98% -98% -98%
CREO/ NCREO vs. CREO/ NCREO w/o
Y in % -49% -82% -79% -80% -81% -85% -84% -79%
Mineralogy & Geology
17
3 Mineralogy & Geology
3.1 REE Minerals and ores
The International Mineralogical Association defines a mineral as "an element or chem-
ical compound that is normally crystalline and that has been formed because of geo-
logical processes" (Nickel, 1995). An ore is defined as an accumulation of sufficient
minerals with important elements that can be economically extracted from rock
(Guilbert & Park Jr., 1986). For instance, Bastnasite is a mineral while Bastnasite-(Ce)
is a typical REE ore.
REE minerals do not occur naturally as metallic elements, they rather occur in oxides,
carbonates, phosphates, silicates and less frequently in halides. Approximately 200
REE minerals are known in the mineralogical context (British Geological Survey,
2011). However, only a few are commercially significant (British Geological Survey,
2011). REE-bearing minerals vary in their concentrations but tend to be biased towards
either LREE or HREE (British Geological Survey, 2011).
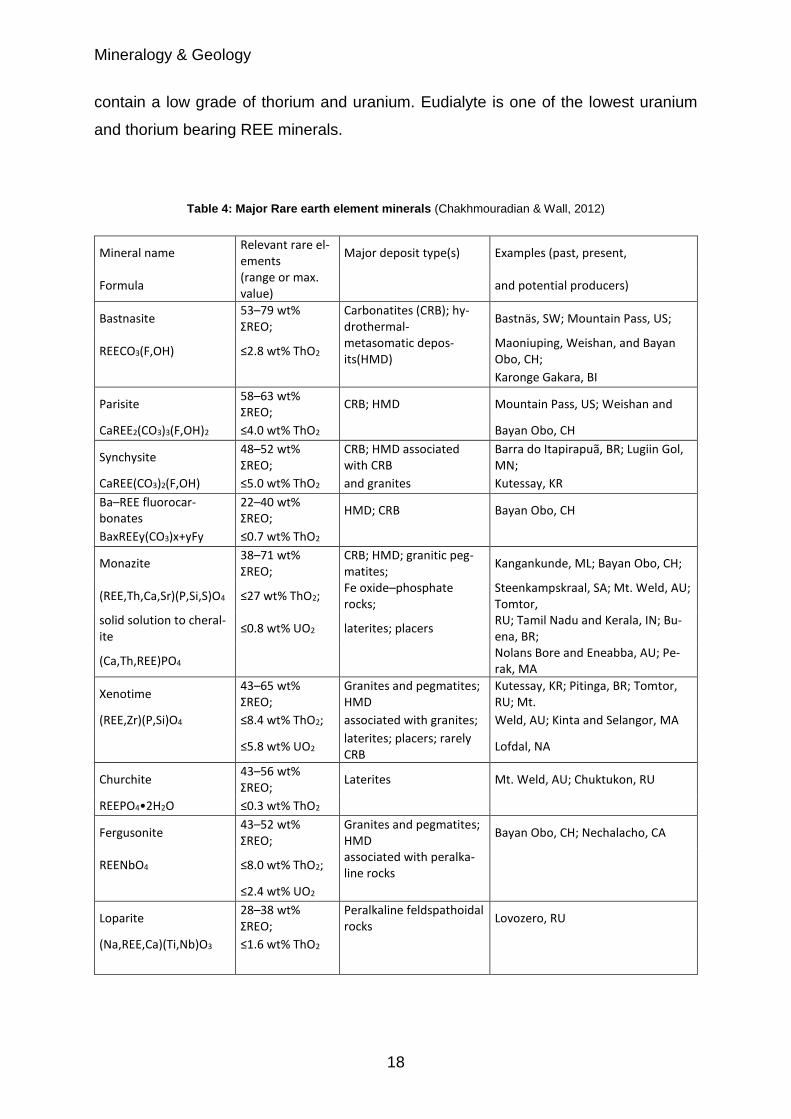
Typical RE minerals are Bastnasite, Monazite and Xenotime. Bastnasite is typically
found in LREE deposits such as Bayan Obo (China) and Mountain Pass (USA) (Table
4) and contains low concentrations of thorium and uranium. LREE deposits of Mt. Weld
(Australia) as well as the placer deposits in Brazil and India are typical deposits with
Monazite as the main RE mineral. Monazite yields the highest value of the toxic ele-
ment thorium with approximately 27 wt-% (Table 4). Both minerals gain the highest
grades in REO (Table 4). Contrary to Bastnasite and Monazite, Xenotime is typical of
HREE deposits such as Lofdal (Namibia) or Browns Range (Australia). It yields aver-
age values of thorium (approx. 8.4 wt-%) and the highest values of uranium (approx.
5.8 wt-%).
The REE-bearing clays of the IAC deposits Longnan, Xunwu, Xinfen, Chongzou,
Changting and to a lesser extent Guangdong (Southeast China) are extremely en-
riched with HREE. Non-existent concentrations of radioactive elements are distinctive
of IAC deposits. Other significant REE-containing minerals are Parisite, Synchisite,
Fluorocarbonates, Churchite, Fergusonite, Loparite and Samarskite (Tasman Metals
Ltd., 2015). Further REE-bearing minerals are Apatite, Eudialyte and Zirconium, which
Mineralogy & Geology
18
contain a low grade of thorium and uranium. Eudialyte is one of the lowest uranium
and thorium bearing REE minerals.
Table 4: Major Rare earth element minerals (Chakhmouradian & Wall, 2012)
Mineral name Relevant rare el-ements
Major deposit type(s) Examples (past, present,
Formula (range or max. value)
and potential producers)
Bastnasite 53–79 wt% ΣREO;
Carbonatites (CRB); hy-drothermal-
Bastnäs, SW; Mountain Pass, US;
REECO3(F,OH) ≤2.8 wt% ThO2 metasomatic depos-its(HMD)
Maoniuping, Weishan, and Bayan Obo, CH;
Karonge Gakara, BI
Parisite 58–63 wt% ΣREO;
CRB; HMD Mountain Pass, US; Weishan and
CaREE2(CO3)3(F,OH)2 ≤4.0 wt% ThO2 Bayan Obo, CH
Synchysite 48–52 wt% ΣREO;
CRB; HMD associated with CRB
Barra do Itapirapuã, BR; Lugiin Gol, MN;
CaREE(CO3)2(F,OH) ≤5.0 wt% ThO2 and granites Kutessay, KR
Ba–REE fluorocar-bonates
22–40 wt% ΣREO;
HMD; CRB Bayan Obo, CH
BaxREEy(CO3)x+yFy ≤0.7 wt% ThO2
Monazite 38–71 wt% ΣREO;
CRB; HMD; granitic peg-matites;
Kangankunde, ML; Bayan Obo, CH;
(REE,Th,Ca,Sr)(P,Si,S)O4 ≤27 wt% ThO2; Fe oxide–phosphate rocks;
Steenkampskraal, SA; Mt. Weld, AU; Tomtor,
solid solution to cheral-ite
≤0.8 wt% UO2 laterites; placers RU; Tamil Nadu and Kerala, IN; Bu-ena, BR;
(Ca,Th,REE)PO4 Nolans Bore and Eneabba, AU; Pe-rak, MA
Xenotime 43–65 wt% ΣREO;
Granites and pegmatites; HMD
Kutessay, KR; Pitinga, BR; Tomtor, RU; Mt.
(REE,Zr)(P,Si)O4 ≤8.4 wt% ThO2; associated with granites; Weld, AU; Kinta and Selangor, MA
≤5.8 wt% UO2 laterites; placers; rarely CRB
Lofdal, NA
Churchite 43–56 wt% ΣREO;
Laterites Mt. Weld, AU; Chuktukon, RU
REEPO4•2H2O ≤0.3 wt% ThO2
Fergusonite 43–52 wt% ΣREO;
Granites and pegmatites; HMD
Bayan Obo, CH; Nechalacho, CA
REENbO4 ≤8.0 wt% ThO2; associated with peralka-line rocks
≤2.4 wt% UO2
Loparite 28–38 wt% ΣREO;
Peralkaline feldspathoidal rocks
Lovozero, RU
(Na,REE,Ca)(Ti,Nb)O3 ≤1.6 wt% ThO2
Mineralogy & Geology
19
3.2 Deposit Types
REE deposits exist in many metamorphic, sedimentary and igneous rocks (British
Geological Survey, 2011). There are several rock-forming and hydrothermal processes
which influence the concentration and distribution of REE (British Geological Survey,
2011). These processes include the enrichment with magmatic or hydrothermal fluids,
subsequent redistribution and concentration by weathering and other surface pro-
cesses as well as separation into mineral phases and precipitation (British Geological
Survey, 2011).
In geological terms, REE deposits and occurrences can be divided into two major de-
posit types: primary and secondary. Primary deposit types are (1) Carbonatite-associ-
ated, (2) associated with alkaline igneous rocks, (3) Iron-REE and (4) Hydrothermal
deposits (British Geological Survey, 2011). In contrast, secondary deposits are (1)
Placers (Marine-, Alluvial- and Paleo-Placers), (2) lateritic deposits and (3) IAC (British
Geological Survey, 2011). This difference is caused by the environment in which REE
are enriched (British Geological Survey, 2011). Primary deposits are associated with
hydrothermal and igneous processes, whereas secondary deposits are formed by
weathering and sedimentary processes (British Geological Survey, 2011).
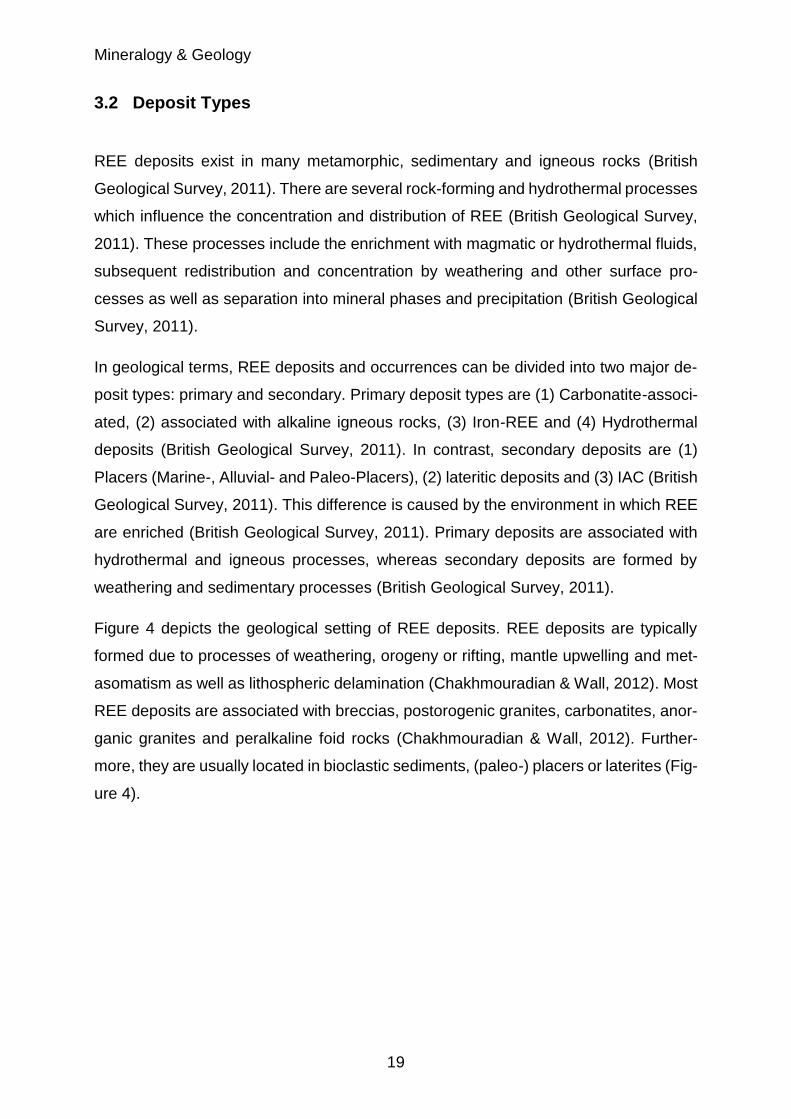
Figure 4 depicts the geological setting of REE deposits. REE deposits are typically
formed due to processes of weathering, orogeny or rifting, mantle upwelling and met-
asomatism as well as lithospheric delamination (Chakhmouradian & Wall, 2012). Most
REE deposits are associated with breccias, postorogenic granites, carbonatites, anor-
ganic granites and peralkaline foid rocks (Chakhmouradian & Wall, 2012). Further-
more, they are usually located in bioclastic sediments, (paleo-) placers or laterites (Fig-
ure 4).
Mineralogy & Geology
20
Figure 4: Major REE deposit types in a tectonic context. (Chakhmouradian & Wall, 2012)
3.3 Resources & Reserves
3.3.1 Terms
Mineral resources and ore reserves are factored in the range of evaluation of geologic
deposits. These terms are described in certification codes like the JORC code (statu-
tory mining code of Australia/Asia), the Ni 43-101 code (statutory mining code of Can-
ada), the SAMREC code (statutory mining code of Africa) and other minor codes.
These codes are used to certify resources and reserves in deposits. In the case of
exploration results, the terms “modifying factors”, “resource” and “reserves” are the
three main factors.
After JORC (2004), modifying factors are defined as follows:
“Modifying Factors are considerations used to convert Mineral Resources to
Ore Reserves. These include, but are not restricted to, mining, processing,
metallurgical, infrastructure, economic, marketing, legal, environmental, social
and governmental factors.”
These modifying factors, in particular the level of detail the modifying factors imply,
influence whether a deposit can be defined as a mineral resource or reserve, includ-
ing different categories within these two main definitions. Mineral resources and the
corresponding sub-categories are defined as follows according to the JORC code
(JORC, 2004):
Mineralogy & Geology
21
“Mineral Resource is a concentration or occurrence of solid material of eco-
nomic interest in or on the Earth’s crust in such form, grade (or quality), and
quantity that there are reasonable prospects for eventual economic extraction.
The location, quantity, grade (or quality), continuity and other geological char-
acteristics of a Mineral Resource are known, estimated or interpreted from
specific geological evidence and knowledge. Mineral Resources are sub-di-
vided - in order of increasing geological confidence - into Inferred, Indicated
and Measured categories.”
“An Inferred Mineral Resource is that part of a Mineral Resource for which
quantity and grade (or quality) are estimated on the basis of limited geological
evidence and sampling. An Inferred Mineral Resource has a lower level of con-
fidence than that applying to an Indicated Mineral Resource and must not be
converted to an Ore Reserve.”
“An Indicated Mineral Resource is that part of a Mineral Resource for which
quantity, grade (or quality), densities, shape and physical characteristics are
estimated with sufficient confidence to allow the application of Modifying Fac-
tors in sufficient detail to support mine planning and evaluation of the economic
viability of the deposit. An Indicated Mineral Resource has a lower level of con-
fidence than that applying to a Measured Mineral Resource and may only be
converted to a Probable Ore Reserve.”
“A Measured Mineral Resource is that part of a Mineral Resource for which
quantity, grade (or quality), densities, shape, and physical characteristics are
estimated with confidence sufficient to allow the application of Modifying Fac-
tors to support detailed mine planning and final evaluation of the economic vi-
ability of the deposit. A Measured Mineral Resource has a higher level of con-
fidence than that applying to either an Indicated Mineral Resource or an In-
ferred Mineral Resource.”
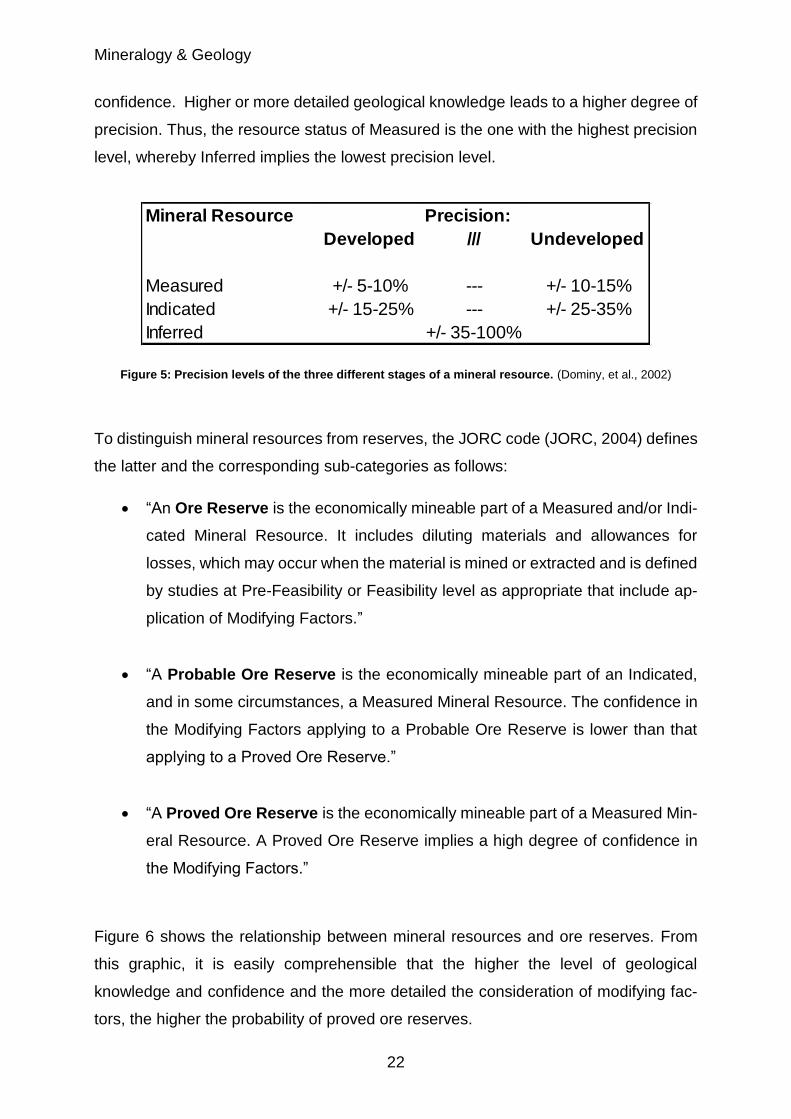
Each of the above mentioned statuses (Inferred, Indicated and Measured) vary in their
stage of precision. Figure 5 depicts the precision levels of the different forms of mineral
resources. The degree of precision depends on the level of geological knowledge and
Mineralogy & Geology
22
confidence. Higher or more detailed geological knowledge leads to a higher degree of
precision. Thus, the resource status of Measured is the one with the highest precision
level, whereby Inferred implies the lowest precision level.
Figure 5: Precision levels of the three different stages of a mineral resource. (Dominy, et al., 2002)
To distinguish mineral resources from reserves, the JORC code (JORC, 2004) defines
the latter and the corresponding sub-categories as follows:
“An Ore Reserve is the economically mineable part of a Measured and/or Indi-
cated Mineral Resource. It includes diluting materials and allowances for
losses, which may occur when the material is mined or extracted and is defined
by studies at Pre-Feasibility or Feasibility level as appropriate that include ap-
plication of Modifying Factors.”
“A Probable Ore Reserve is the economically mineable part of an Indicated,
and in some circumstances, a Measured Mineral Resource. The confidence in
the Modifying Factors applying to a Probable Ore Reserve is lower than that
applying to a Proved Ore Reserve.”
“A Proved Ore Reserve is the economically mineable part of a Measured Min-
eral Resource. A Proved Ore Reserve implies a high degree of confidence in
the Modifying Factors.”
Figure 6 shows the relationship between mineral resources and ore reserves. From
this graphic, it is easily comprehensible that the higher the level of geological
knowledge and confidence and the more detailed the consideration of modifying fac-
tors, the higher the probability of proved ore reserves.
Mineral Resource Precision:
Developed /// Undeveloped
Measured +/- 5-10% --- +/- 10-15%
Indicated +/- 15-25% --- +/- 25-35%
Inferred +/- 35-100%
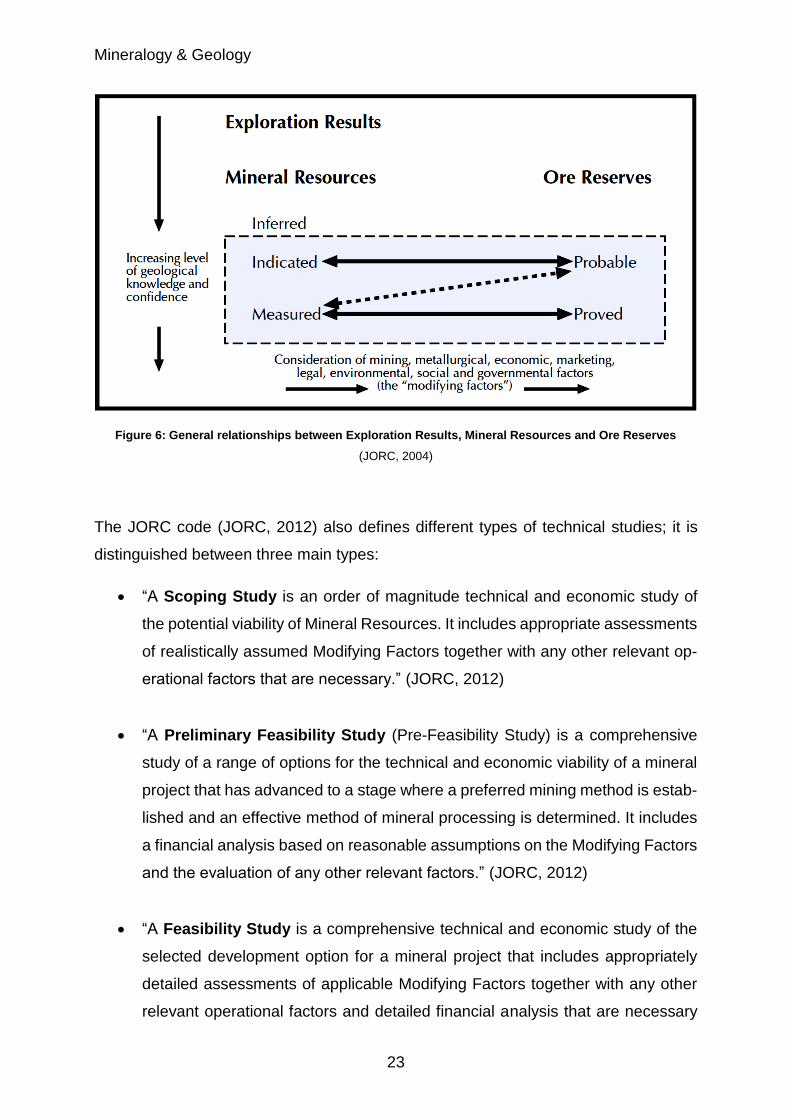
Mineralogy & Geology
23
Figure 6: General relationships between Exploration Results, Mineral Resources and Ore Reserves
(JORC, 2004)
The JORC code (JORC, 2012) also defines different types of technical studies; it is
distinguished between three main types:
“A Scoping Study is an order of magnitude technical and economic study of
the potential viability of Mineral Resources. It includes appropriate assessments
of realistically assumed Modifying Factors together with any other relevant op-
erational factors that are necessary.” (JORC, 2012)
“A Preliminary Feasibility Study (Pre-Feasibility Study) is a comprehensive
study of a range of options for the technical and economic viability of a mineral
project that has advanced to a stage where a preferred mining method is estab-
lished and an effective method of mineral processing is determined. It includes
a financial analysis based on reasonable assumptions on the Modifying Factors
and the evaluation of any other relevant factors.” (JORC, 2012)
“A Feasibility Study is a comprehensive technical and economic study of the
selected development option for a mineral project that includes appropriately
detailed assessments of applicable Modifying Factors together with any other
relevant operational factors and detailed financial analysis that are necessary

Mineralogy & Geology
24
to demonstrate that extraction is reasonably justified (economically mineable).
The results of the study may reasonably serve as the basis for a final decision.”
(JORC, 2012)
Figure 7 depicts the progress stages and the timeline for investigating REE deposits.
It starts with typical grass roots geological investigations and sampling, and ends with
the construction of the pit. The time of development for an open pit is around 10 to 15
years.
There are four main stages for REE deposits. The first one is the certification of the
resource or scoping study (Figure 7). It is followed by the next main stage, which is the
pre-feasibility study. This includes financial analysis, configuration or planning of un-
derground or pit mining and development of a processing method (Figure 7). The third
stage is the actual feasibility study. It contains the justification of the economic feasi-
bility of mining and the detailed assessment of applicable modifying factors. The final
stage describes the construction of either pit or underground mines as well as the es-
tablishment of all facilities (e.g. processing plants).
Figure 7: Progress stages and timeline for a REE deposit (modified after (Lynas Corp., 2014))
Mineralogy & Geology
25
3.4 REE Deposits
The description of REE deposits depends on the material grade respectively the min-
eral distribution of the deposit. In this chapter, only current and former producing de-
posits of REE are discussed, whereas potential deposits are neglected.
3.4.1 LREE deposits
LREE deposits are defined by their high amount of cerium, lanthanum and neodymium
as well as medium to high amounts of praseodymium and samarium. Usually, the con-
tent for LREE deposits is > 75 wt-%. The content of HREE and yttrium is relatively low.
There are six LREE deposits worldwide that play a significant role in the REE segment.
The most well-known LREE deposits that are in production are Bayan Obo (China),
Maoniuping (China), Dalucao (China), Weishan (China), Mountain Pass (USA) and
Mount Weld CLD (Australia). Of these six deposits, Mountain Pass and Mount Weld
CLD are currently struggling because of low market prices (Jamasmie, 2015; Worstall,
2014).
Bayan Obo
The Bayan Obo deposit is located in the region of Inner Mongolia, Northern China.
This deposit is currently the main producer of REE worldwide, with a steady production
of 50,000 tons per year of REO. This is approximately 42.5 % of the world production.
The owner of this deposit is Baotou Iron and Steel and Rare Earth Company, which is
part of the Baotou Group. The Bayan Obo deposit consists of three big ore bodies
(Main, East and West) which divide the deposit into three parts.
The main exploitation takes place in the Main and East in the form of open pit mining.
The Main ore body contains 20,000,000 tons of mineral resources with contents of 35
wt-% iron and 6.19 wt-% REO (Hitzmann, et al., 1992). In contrast to this, the East ore
body consists of 15,000,000 tons of mineral resources with a content of 33 wt-% iron
and 5.71 wt-% REO (Hitzmann, et al., 1992). Approximately 98 % of the material grade
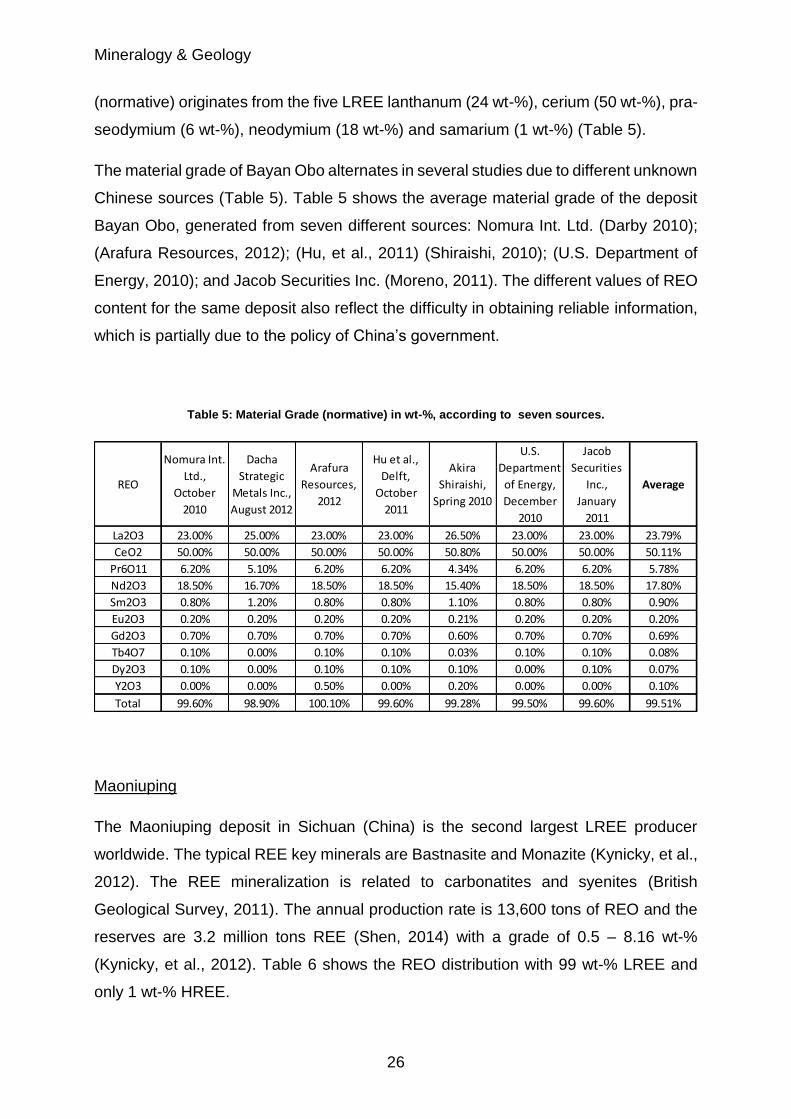
Mineralogy & Geology
26
(normative) originates from the five LREE lanthanum (24 wt-%), cerium (50 wt-%), pra-
seodymium (6 wt-%), neodymium (18 wt-%) and samarium (1 wt-%) (Table 5).
The material grade of Bayan Obo alternates in several studies due to different unknown
Chinese sources (Table 5). Table 5 shows the average material grade of the deposit
Bayan Obo, generated from seven different sources: Nomura Int. Ltd. (Darby 2010);
(Arafura Resources, 2012); (Hu, et al., 2011) (Shiraishi, 2010); (U.S. Department of
Energy, 2010); and Jacob Securities Inc. (Moreno, 2011). The different values of REO
content for the same deposit also reflect the difficulty in obtaining reliable information,
which is partially due to the policy of China’s government.
Table 5: Material Grade (normative) in wt-%, according to seven sources.
Maoniuping
The Maoniuping deposit in Sichuan (China) is the second largest LREE producer
worldwide. The typical REE key minerals are Bastnasite and Monazite (Kynicky, et al.,
2012). The REE mineralization is related to carbonatites and syenites (British
Geological Survey, 2011). The annual production rate is 13,600 tons of REO and the
reserves are 3.2 million tons REE (Shen, 2014) with a grade of 0.5 – 8.16 wt-%
(Kynicky, et al., 2012). Table 6 shows the REO distribution with 99 wt-% LREE and
only 1 wt-% HREE.
REO
Nomura Int.
Ltd.,
October
2010
Dacha
Strategic
Metals Inc.,
August 2012
Arafura
Resources,
2012
Hu et al.,
Delft,
October
2011
Akira
Shiraishi,
Spring 2010
U.S.
Department
of Energy,
December
2010
Jacob
Securities
Inc.,
January
2011
Average
La2O3 23.00% 25.00% 23.00% 23.00% 26.50% 23.00% 23.00% 23.79%
CeO2 50.00% 50.00% 50.00% 50.00% 50.80% 50.00% 50.00% 50.11%
Pr6O11 6.20% 5.10% 6.20% 6.20% 4.34% 6.20% 6.20% 5.78%
Nd2O3 18.50% 16.70% 18.50% 18.50% 15.40% 18.50% 18.50% 17.80%
Sm2O3 0.80% 1.20% 0.80% 0.80% 1.10% 0.80% 0.80% 0.90%
Eu2O3 0.20% 0.20% 0.20% 0.20% 0.21% 0.20% 0.20% 0.20%
Gd2O3 0.70% 0.70% 0.70% 0.70% 0.60% 0.70% 0.70% 0.69%
Tb4O7 0.10% 0.00% 0.10% 0.10% 0.03% 0.10% 0.10% 0.08%
Dy2O3 0.10% 0.00% 0.10% 0.10% 0.10% 0.00% 0.10% 0.07%
Y2O3 0.00% 0.00% 0.50% 0.00% 0.20% 0.00% 0.00% 0.10%
Total 99.60% 98.90% 100.10% 99.60% 99.28% 99.50% 99.60% 99.51%
Mineralogy & Geology
27
Daluxiang (or Dalucao)
Daluxiang is another Sichuan-situated, REE-producing deposit. It has the same geo-
logical properties as Maoniuping. The grade of REO in this deposit is approximately
1.0 – 4.5 wt-% (Liu, et al., 2015). Mineral resources amount to 15.2 million tons
(Verplanck, et al., 2014) and the reserves are approximately 990,000 tons of REO
(Shen, 2014). No production and mineral distribution data is available for this deposit,
but it is currently in production (Shen, 2014). It also belongs to the LREE fraction of
Sichuan-located deposits.
Weishan
The Weishan deposit is located in the province of Shandong, China. The reserve is
calculated to be approximately 2.55 million tons REO and the grade is roughly 3.13
wt-% (Zhi Li & Yang, 2014). The deposit is a typical carbonate type and the main min-
erals are Bastnasite and Parisite (Zhi Li & Yang, 2014). The normative distribution of
REO is similar to that of the previously mentioned LREE deposits. LREE are distributed
with a value of approximately 98 wt-%, whereas HREE accounts for less than 2 wt-%
(Table 6).
Mount Weld CLD
The Mount Weld Central Lanthanide deposit (CLD) is an Australian mine located 700
km Northeast of Perth. Mount Weld is a carbonatite deposit situated in a volcanic plug
(Lynas Corp., 2015). Moreover, the carbonatite is approximately 3 km in diameter
(Lynas Corp., 2015). This carbonatite also hosts other undeveloped deposits like Dun-
can, Swan, Crown and Emu (Lynas Corp., 2015). The deposit contains 1,454,000 tons
of REO and has an average REE grade of 9.73 wt-% (Hatch, 2015). The relative dis-
tribution of REO is depicted in Table 6. Mount Weld CLD is also a high grade REE
deposit with around 98 wt-% LREE and only 2 wt-% HREE (Hatch, 2015). In 2014,
Mount Weld CLD produced 3,965 tons of REO (Lynas Corp., 2014).
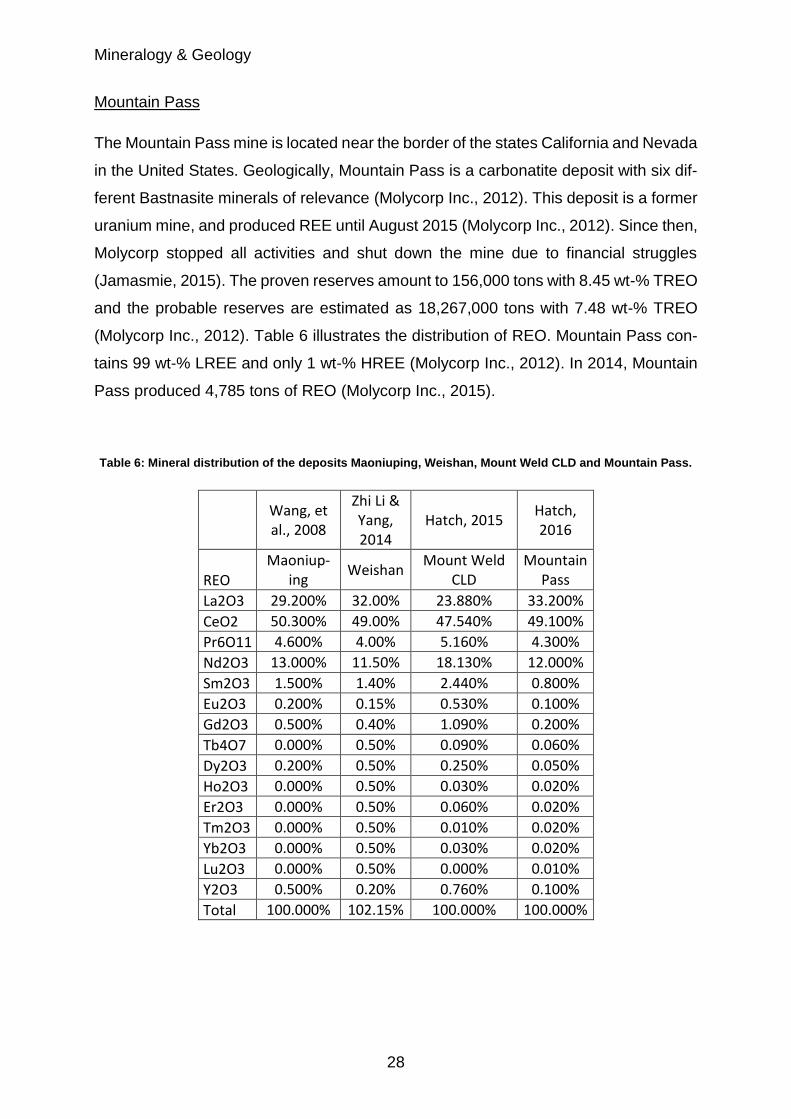
Mineralogy & Geology
28
Mountain Pass
The Mountain Pass mine is located near the border of the states California and Nevada
in the United States. Geologically, Mountain Pass is a carbonatite deposit with six dif-
ferent Bastnasite minerals of relevance (Molycorp Inc., 2012). This deposit is a former
uranium mine, and produced REE until August 2015 (Molycorp Inc., 2012). Since then,
Molycorp stopped all activities and shut down the mine due to financial struggles
(Jamasmie, 2015). The proven reserves amount to 156,000 tons with 8.45 wt-% TREO
and the probable reserves are estimated as 18,267,000 tons with 7.48 wt-% TREO
(Molycorp Inc., 2012). Table 6 illustrates the distribution of REO. Mountain Pass con-
tains 99 wt-% LREE and only 1 wt-% HREE (Molycorp Inc., 2012). In 2014, Mountain
Pass produced 4,785 tons of REO (Molycorp Inc., 2015).
Table 6: Mineral distribution of the deposits Maoniuping, Weishan, Mount Weld CLD and Mountain Pass.
Wang, et al., 2008
Zhi Li & Yang, 2014
Hatch, 2015 Hatch, 2016
REO
Maoniup-ing
Weishan Mount Weld
CLD Mountain
Pass
La2O3 29.200% 32.00% 23.880% 33.200%
CeO2 50.300% 49.00% 47.540% 49.100%
Pr6O11 4.600% 4.00% 5.160% 4.300%
Nd2O3 13.000% 11.50% 18.130% 12.000%
Sm2O3 1.500% 1.40% 2.440% 0.800%
Eu2O3 0.200% 0.15% 0.530% 0.100%
Gd2O3 0.500% 0.40% 1.090% 0.200%
Tb4O7 0.000% 0.50% 0.090% 0.060%
Dy2O3 0.200% 0.50% 0.250% 0.050%
Ho2O3 0.000% 0.50% 0.030% 0.020%
Er2O3 0.000% 0.50% 0.060% 0.020%
Tm2O3 0.000% 0.50% 0.010% 0.020%
Yb2O3 0.000% 0.50% 0.030% 0.020%
Lu2O3 0.000% 0.50% 0.000% 0.010%
Y2O3 0.500% 0.20% 0.760% 0.100%
Total 100.000% 102.15% 100.000% 100.000%
Mineralogy & Geology
29
3.4.2 HREE+Y deposits
HREE deposits are characterized by a LREE/HREE-ratio with contents of europium to
yttrium higher than 25 wt-% (Kingsnorth, 2012). The only HREE producing deposits
are the South Chinese IAC deposits of Changting, Chongzou, Longnan, Xunwu and
Xinfen (Shen, 2012a). Usually, the production of all IAC deposits totals between 40,000
and 50,000 tons per year (Shen, 2014). This varies due to illegal mining in the Southern
part of China. Operational costs aggregate to 3 US-$ per kilogram (US-$/kg) of mined
REO (Shen, 2014). The toxic elements yield a very small value of 0.002 wt. -% ThO2
and 0.032 wt.-% U3O8 (Shen, 2014).
The production of all Longnan deposits yields approximately 3,000 tons per year REO
with an average mine life of 9.62 years (Shen, 2014). Some of the IAC deposits contain
high amounts of neodymium and less yttrium (Shen, 2012a).
The relative mineral distribution of REO within these deposits varies extremely. On one
hand, there are the typical high-grade HREE deposits of Longnan (Table 7). On the
other hand, two other types of IAC deposits can be characterized by high grades of
neodymium and small grades of yttrium (Xunwu) as well as medium values for neo-
dymium and yttrium (Xinfen, Changting and Chongzuo) (Table 7).
The Longnan deposits stand out due to their high values of dysprosium, gadolinium,
terbium and erbium as well as yttrium (approx. 60 wt-%). The Xunwu deposits have
the highest neodymium values in all of China with up to 30 wt-%. The Xunwu deposits
also have high grades of gadolinium. However, the deposits in Xinfen, Changting and
Chongzuo yield high grades in gadolinium and dysprosium.
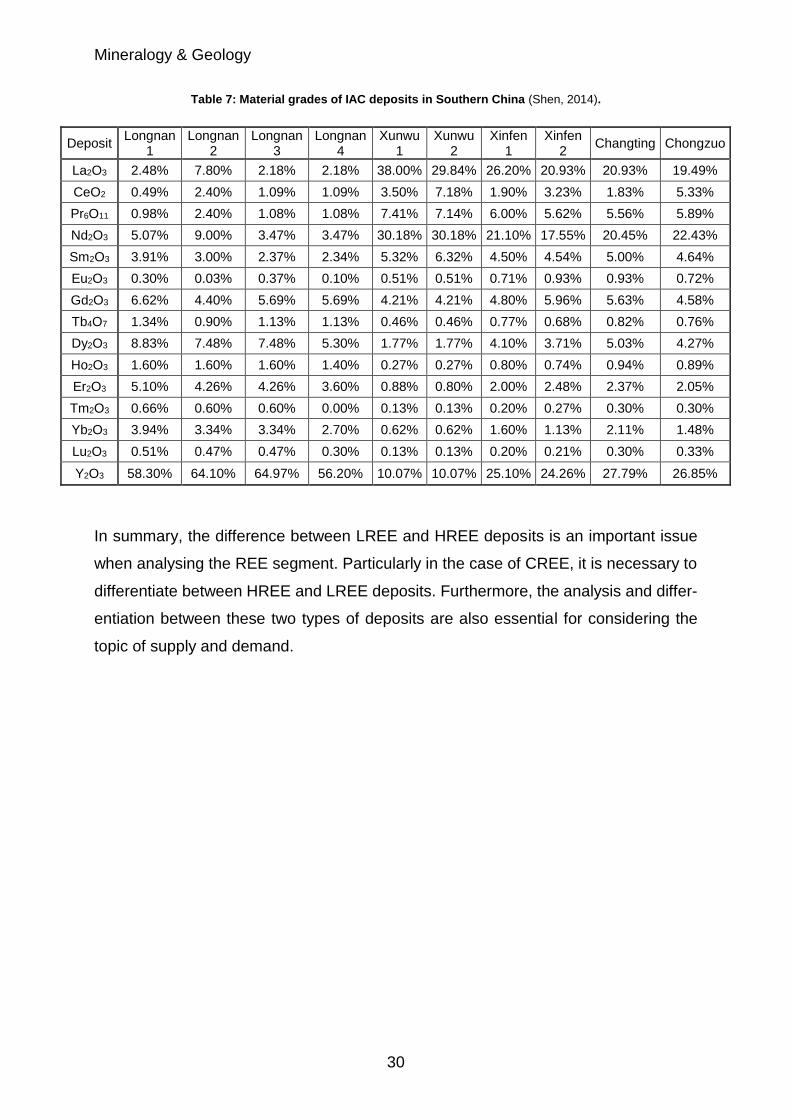
Mineralogy & Geology
30
Table 7: Material grades of IAC deposits in Southern China (Shen, 2014).
Deposit Longnan
1 Longnan
2 Longnan
3 Longnan
4 Xunwu
1 Xunwu
2 Xinfen
1 Xinfen
2 Changting Chongzuo
La2O3 2.48% 7.80% 2.18% 2.18% 38.00% 29.84% 26.20% 20.93% 20.93% 19.49%
CeO2 0.49% 2.40% 1.09% 1.09% 3.50% 7.18% 1.90% 3.23% 1.83% 5.33%
Pr6O11 0.98% 2.40% 1.08% 1.08% 7.41% 7.14% 6.00% 5.62% 5.56% 5.89%
Nd2O3 5.07% 9.00% 3.47% 3.47% 30.18% 30.18% 21.10% 17.55% 20.45% 22.43%
Sm2O3 3.91% 3.00% 2.37% 2.34% 5.32% 6.32% 4.50% 4.54% 5.00% 4.64%
Eu2O3 0.30% 0.03% 0.37% 0.10% 0.51% 0.51% 0.71% 0.93% 0.93% 0.72%
Gd2O3 6.62% 4.40% 5.69% 5.69% 4.21% 4.21% 4.80% 5.96% 5.63% 4.58%
Tb4O7 1.34% 0.90% 1.13% 1.13% 0.46% 0.46% 0.77% 0.68% 0.82% 0.76%
Dy2O3 8.83% 7.48% 7.48% 5.30% 1.77% 1.77% 4.10% 3.71% 5.03% 4.27%
Ho2O3 1.60% 1.60% 1.60% 1.40% 0.27% 0.27% 0.80% 0.74% 0.94% 0.89%
Er2O3 5.10% 4.26% 4.26% 3.60% 0.88% 0.80% 2.00% 2.48% 2.37% 2.05%
Tm2O3 0.66% 0.60% 0.60% 0.00% 0.13% 0.13% 0.20% 0.27% 0.30% 0.30%
Yb2O3 3.94% 3.34% 3.34% 2.70% 0.62% 0.62% 1.60% 1.13% 2.11% 1.48%
Lu2O3 0.51% 0.47% 0.47% 0.30% 0.13% 0.13% 0.20% 0.21% 0.30% 0.33%
Y2O3 58.30% 64.10% 64.97% 56.20% 10.07% 10.07% 25.10% 24.26% 27.79% 26.85%
In summary, the difference between LREE and HREE deposits is an important issue
when analysing the REE segment. Particularly in the case of CREE, it is necessary to
differentiate between HREE and LREE deposits. Furthermore, the analysis and differ-
entiation between these two types of deposits are also essential for considering the
topic of supply and demand.
Economy
31
4 Economy
In this chapter, the economy of the REE market is discussed. The main elements de-
scribed in this work are the market structure and its participants, market entrance bar-
riers and supply and demand linkages. Furthermore, a description of the different price
schemes is given.
4.1 Market of the Rare Earth Elements
The market for REE is a complex structured network of demand and supply caused by
a high grade of non-transparency in the diverse trading systems. The channels of trade
and pricing are often quite confusing, since REE are not listed on stock exchanges and
therefore, are not publicly traded (Radon, et al., 2012). REE products (e.g. oxides,
metals and powders) are directly traded between supplier and buyer. The trading sys-
tems of the REE market mostly function following the Over-the-Counter-Principle
(OTC) and can be structured into three categories (Radon, et al., 2012). These cate-
gories are (a) Broker System, (b) Online platforms and (c) Direct Contact (Radon, et
al., 2012).
The Broker System (a) is a conventional trading system which merges seller and buyer
(Radon, et al., 2012). Contact is made by broker or trading companies specializing in
REE (Radon, et al., 2012) like Toyota Tshusho, Advanced Materials Japan, Rhodia
China or Hefa Baotou RE. They manage the price negotiation and cash flows within
the transactions (Radon, et al., 2012). The broker does not receive a fee for the nego-
tiations or in transactions, and benefits solely from arbitrage (margin between buying
and selling price) (Radon, et al., 2012).
The trading system of online platforms (b) is a method of buying and selling REE prod-
ucts via websites such as Asian Metals, Metal Pages, China RE or Alibaba. The web-
sites function as live markets, where registered market participants drop, sell or buy
notes via communication media (Radon, et al., 2012). Most of the participants only list
the price as negotiable (Radon, et al., 2012). Therefore, the suggested prices just give
hints about the current REE spot prices (Radon, et al., 2012).
Economy
32
Within Direct Contact (c), either buyers or sellers communicate directly and transac-
tions take place directly between the two parties – similar to the corporate bond market
- and not via a centralized market (Radon, et al., 2012). During the negotiation phase,
supply contracts and conditions regarding margins and prices are arranged. In reach-
ing agreements on price, both parties orient themselves on the current available prices
on online platforms such as Asian Metals or Metal Pages (Radon, et al., 2012). The
negotiated contracts determine the fixed prices by set price ranges (Radon, et al.,
2012). These contracts promise a relative price stability that cannot be reached on the
volatile spot market. Depending on the outcome of negotiations, this system is either
profitable or unprofitable for producers, because producers can generate more exact
volumes due to determined prices and demand, but they may lose profit if spot prices
increase (Radon, et al., 2012). With Direct Contact, both parties typically sign contracts
in form of a Memorandum of Understanding or a Letter of Intent, an Offtake Agreement
or a Strategic Partnership, respectively.
This decentralized market can be described considering its morphology by three dif-
ferent market systems– oligopoly, duopoly and monopoly (Figure 8).
Theoretically, a market is based on the equilibrium between supply and demand. How-
ever, in the REE market there are only a couple of suppliers – mostly Chinese – and
contrary to that, considerably more demanders. This results from of the manifold of
applications, as well as China’s strength in production and total dominance on the mar-
ket (Figure 8).
The entire market is primarily classified as an oligopoly (Figure 8) by the market par-
ticipants. On the one hand, there are the three Chinese main suppliers: Baotou Steel
Rare-Earth Hi-Tech Co. Ltd., Aluminium Corporation of China (Chinalco) and Minmet-
als Ganzhou RE Co. Ltd. (Minmetals) (Figure 8). On the other hand, there are demand-
ers like Molycorp Inc., Lynas Corp. and other companies from Malaysia, Russia and
Thailand (Gambogi, 2016). The market volume of 124,000 tons RE Oxides (Gambogi,
2016) is scattered over all of these market participants. As a result of Chinese industrial
companies being nationalized, Chinese producers can be grouped together as the
People’s Republic of China (PRC) (Tse, 2011; British Geological Survey (BGS), 2011).
Following this definition, all other companies outside China can be combined as the
Rest of the World (RoW) producers. This newly formed situation leads to a transfor-
mation from an oligopoly market to a duopoly market.
Economy
33
Thus, in the duopoly market there are only two suppliers: PRC and RoW. Nevertheless,
and according to the definition of a duopoly, there are still many companies on the
demand side (Gagliardi, 2012).
The complete market can be structured into ten sub-markets, which are characterized
by REE’s demand sectors. The aggregated worldwide output is up to 124,000 tons of
REO with 105,000 tons produced by China and at least 19,000 tons by RoW (Figure
8). Accordingly, China has a market share of 85 % while RoW companies share only
15 % of the market (Figure 8). This highlights China’s superiority in the REE market.
Moreover, a market share > 35 % (Gocht, 1983) allows sufficient power to hold a mo-
nopolistic position in the market. Thus, in this context, China not only holds the status
of the main supplier, but that of a monopolist as well (Figure 8).
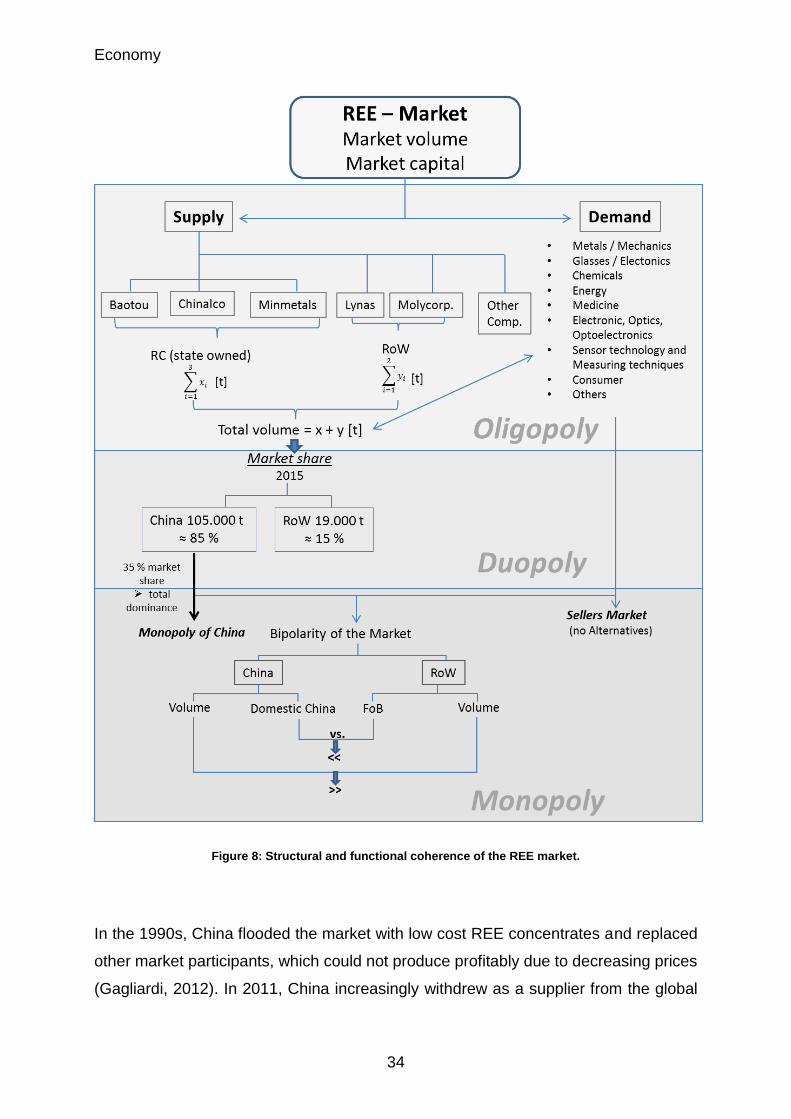
Economy
34
Figure 8: Structural and functional coherence of the REE market.
In the 1990s, China flooded the market with low cost REE concentrates and replaced
other market participants, which could not produce profitably due to decreasing prices
(Gagliardi, 2012). In 2011, China increasingly withdrew as a supplier from the global
Economy
35
REE market by reducing their Export Quotas. In numbers, this means the export vol-
ume declined from 50,145 tons in 2009 to 30,258 tons in 2011 (China Ministry of
Commerce, 2013). Between 2012 and 2014, there were only marginal changes. The
Export Quota in 2014 was 30,611 tons of REE (China Ministry of Commerce, 2013). In
2015, China abandoned its Export Quota due to a lawsuit with the World Trade Organ-
ization (WTO) (Jamasmie, 2015).
Due to the unbalanced supply and demand situation, the REE market may be charac-
terized as a seller’s market. According to the definition of a seller’s market, the margin
of demand exceeds the margin of supply, therefore the seller has more influence on
the market than the buyer (Feess, 2004). The combination of a monopolistic market
and a seller’s market also results, besides in the opportunity of margin and price fixing,
in the opportunity to establish submarkets (Feess, 2004). This process results in the
bipolarity of the market (Feess, 2004).
Furthermore, the bipolarity of the REE market is caused by the existing price differen-
tiation. On the REE market, there are differences between the China Domestic and the
Free-on-Board (FOB) price. The classification of two groups of consumers which have
to pay divergent prices is associated with a price differentiation of the third order
(Feess, 2004). Within a third order price differentiation, the consumers of a good are
subdivided into several groups, which are awarded different price based on willing-
ness-to-pay (Feess, 2004).
China differentiates two groups of consumers – consumers on national territory and
consumers outside of national territory. Consequently, the two-price feature of China
Domestic and FOB emerges. Therefore, China set up high barriers to enter the market.
In theories of economics and competition, market entry barriers are obstacles that can
prevent a possible market participant from entering the preferred market (Sullivan &
Sheffrin, 2003). In the REE market, one can define at least, two market entry barriers
– the cost per kilogram (kg) REE and the production tonnage per year. Because of this
specific situation caused by the monopoly of China, even companies which are pro-
ducing might temporarily be unable to stay in the market due to difficulties with opera-
tional expenditures and/or decreasing prices (Jamasmie, 2015; Worstall, 2014).
Economy
36
4.1.1 Pricing
On the REE market, there is the FOB and the China Domestic price for all 15 REE.
The FOB is the price for international consuming companies, whereas the China Do-
mestic is the internal price for all Chinese companies. China trades the resources
within their borders with an approximately 35-40% lower price margin (China Ministry
of Commerce, 2013). Nevertheless, there is a functional coherence between the FOB
and the China Domestic pricing. The typical formula for the FOB is as follows (Lynas
Corp., 2013):
𝐹𝑂𝐵 = 𝑠𝑎𝑙𝑒𝑠 𝑡𝑎𝑥 + 𝑒𝑥𝑝𝑜𝑟𝑡 𝑡𝑎𝑥 + 𝑒𝑥𝑝𝑜𝑟𝑡 𝑐𝑜𝑠𝑡𝑠 + 𝐶ℎ𝑖𝑛𝑎 𝐷𝑜𝑚𝑒𝑠𝑡𝑖𝑐 [𝑈𝑆$]
With the aid of this price calculation, the FOB has a certain grade of transparency.
However, influential variables can only partially be estimated. The export tax can be
limited to an value between 15 to 25 % (Lynas Corp., 2013). Although the costs for the
export permit cannot be estimated, the reduction of the Export Quota is associated with
increasing costs (Radon, et al., 2012). However, the development of the China Do-
mestic price is still not transparent and therefore, the FOB price is hardly calculable.
The typical price system of a natural resource is a calculation of costs for a single
resource in a centralized market (Feess, 2004). In contrast to that, the price system of
REE is completely contrary to the conventional assumption of calculating resource
prices. The prices of REE are element specific and vary per element by a couple of
100 US-$/kg (Figure 9). For instance, in Q1/2011, the price for europium amounted to
719.2 US-$/kg. In Q3/2011, it was 4900 US-$/kg, while in Q4/2012, the price for euro-
pium gained approximately 1770 US-$/kg. Equally volatile are the prices for terbium
and dysprosium. Figure 9 depicts that the prices for terbium varied from Q1/2011 to
Q3/2011 by 3040 US-$/kg and from Q3/2011 to Q2/2012 by 2410 US-$/kg. The price
for dysprosium was 412.9 US-$/kg in Q1/2011, increased to 2262.31 US-$/kg in
Q3/2011 and eventually decreased to 630 US-$/kg in Q4/2012.
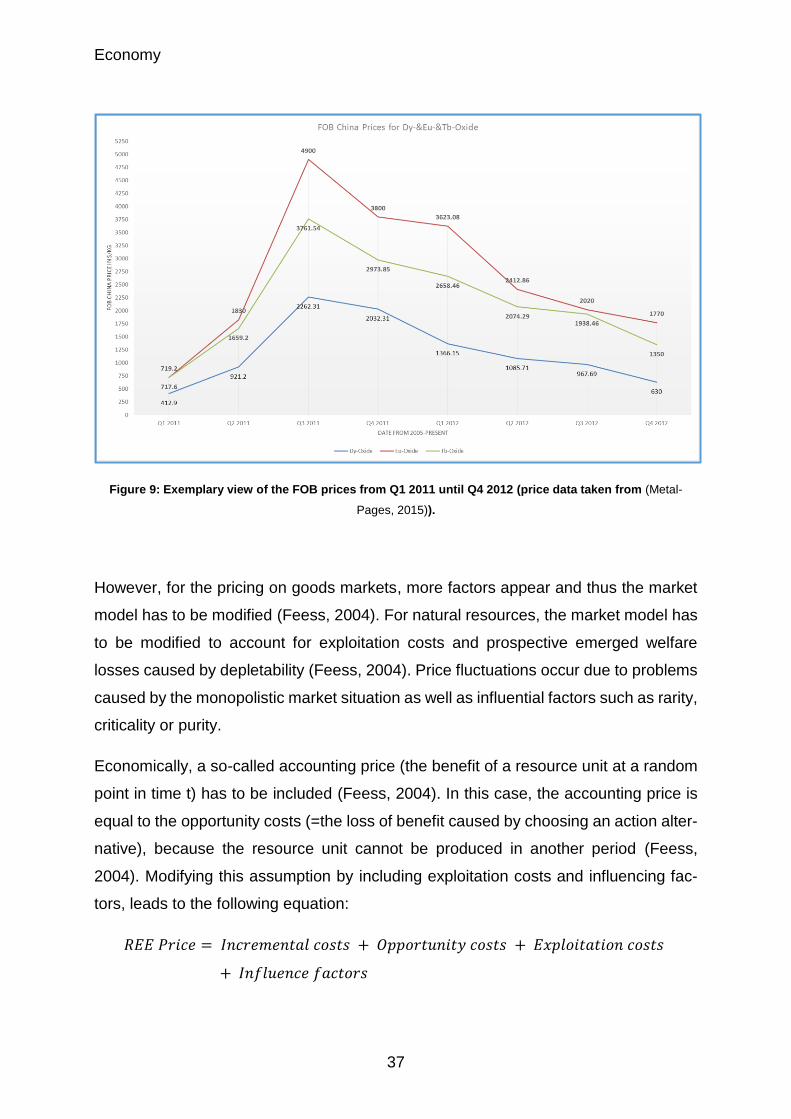
Economy
37
Figure 9: Exemplary view of the FOB prices from Q1 2011 until Q4 2012 (price data taken from (Metal-
Pages, 2015)).
However, for the pricing on goods markets, more factors appear and thus the market
model has to be modified (Feess, 2004). For natural resources, the market model has
to be modified to account for exploitation costs and prospective emerged welfare
losses caused by depletability (Feess, 2004). Price fluctuations occur due to problems
caused by the monopolistic market situation as well as influential factors such as rarity,
criticality or purity.
Economically, a so-called accounting price (the benefit of a resource unit at a random
point in time t) has to be included (Feess, 2004). In this case, the accounting price is
equal to the opportunity costs (=the loss of benefit caused by choosing an action alter-
native), because the resource unit cannot be produced in another period (Feess,
2004). Modifying this assumption by including exploitation costs and influencing fac-
tors, leads to the following equation:
𝑅𝐸𝐸 𝑃𝑟𝑖𝑐𝑒 = 𝐼𝑛𝑐𝑟𝑒𝑚𝑒𝑛𝑡𝑎𝑙 𝑐𝑜𝑠𝑡𝑠 + 𝑂𝑝𝑝𝑜𝑟𝑡𝑢𝑛𝑖𝑡𝑦 𝑐𝑜𝑠𝑡𝑠 + 𝐸𝑥𝑝𝑙𝑜𝑖𝑡𝑎𝑡𝑖𝑜𝑛 𝑐𝑜𝑠𝑡𝑠
+ 𝐼𝑛𝑓𝑙𝑢𝑒𝑛𝑐𝑒 𝑓𝑎𝑐𝑡𝑜𝑟𝑠
Economy
38
4.1.2 Supply & Demand
The feature of supply and demand in the REE sector is very different than with all other
resources. Generally, the demand defines the supply. However, this only holds true for
not limited resources. For natural resources and particularly for REE, other rules apply.
First, one has to keep in mind that there is not always an equilibrium between supply
and demand. For instance, the demand in 2011 was estimated to be 105 kt of total
REE and forecasts state an increase of up to 160 kt in 2016 (Kingsnorth, 2012). The
supply in 2011 was estimated to be only slightly higher than the estimated demand,
namely 113 kt (Kingsnorth, 2012). Kingsnorth (2012) predicted the supply yielding 195
kt in 2016. Thus, the predicted numbers promise a rather positive development, since
the supply should be at least slightly higher than the demand.
To understand the REE market, it is necessary to analyse the suppliers’ side. The
origin of the suppliers is considered to be one of the main critical factors. Analyses
show that more than 85 % of the global supply originates from China (cf. Chapter 4.1).
As it is described in Chapter 4.1, buyer and seller sign contracts in form of Memoran-
dum of Understanding (MOU), Letter of Intent (LOI), Joint Venture (JV), Strategic Part-
nership or Offtake Agreements. These contracts are usually employed in the REE sec-
tor between buyer and seller in the Direct Contact system. However, all these forms of
contracts may be cancelled. One argument for this is the high volatility of REE prices.
Thus, neither operational costs nor raw material costs for further production can be
predicted in a sufficient manner.
Figure 10 illustrates the relationships between (potential) global supply and demand
companies. On the left part of the figure, REE demanding industrial companies are
depicted. On the right part, REE-producing and potentially producing companies in
2012 are displayed. Furthermore, Figure 10 shows the interactions between REE-us-
ing industrial companies and governmental institutions. These companies either have
agreements with potential REE producers outside China or have contact to Chinese
REE trading and/or producing companies. Industrial companies like e.g. Shin Etsu,
Rhodia, BASF, Siemens, Bosch, Toyota, TDK and others have Direct Contact agree-
ments or contracts with potential REE producing companies like Alkane, Lynas,
Molycorp, Great Western, Ucore, Tantalus or others.
Economy
39
The highest amount of contracts in this profiling approach are held by Lynas Corp.,
Great Western Group (GWG) and Molycorp Inc. BASF and Rhodia have supply con-
tracts with Lynas Corp., whereby Siemens has a LOI with the same company. Vacu-
umschmelze holds a LOI with GWG. Furthermore, the U.S. Department of Defence
invests in the GWG, whereas Aichi Steel and Electron Energy hold supply and coop-
eration agreements with GWG. Moreover, Sumitomo, Hitachi Metals, Mitsubishi and
Arnold Magnetic Technologies hold LOIs and JVs with Molycorp Inc.
These contracts result in security of supply, and thus represent the attempt at gaining
more independence from China. On the other side, American steel companies like
Dexter, Adams or MCE and other non-American companies like Aichi Steel and Bosch
have direct contacts to Chinese REE producing companies such as Baotou Steel, Chi-
nalco and Minmetals. One reason might be that none of these companies believes in
a steady RoW producer that can produce high margins of REE. Figure 10 shows that
there are three methods to establish cooperations between REE-using companies and
potential producing or producing companies.
Both are based on the idea of security of supply. Some industrial companies do have
contracts with minor potential producers due to the opportunity of exclusive supply.
Other industrial companies are interested in supply contracts with major potential pro-
ducers, e.g. with Lynas Corp., Molycorp. Inc. and Great Western Group. Thus, they
are more interested in a safe supply situation. Finally, many industrial companies do
not recognize potential producers as future supply partners. Therefore, they choose
Chinese REE producing companies as supply partners.
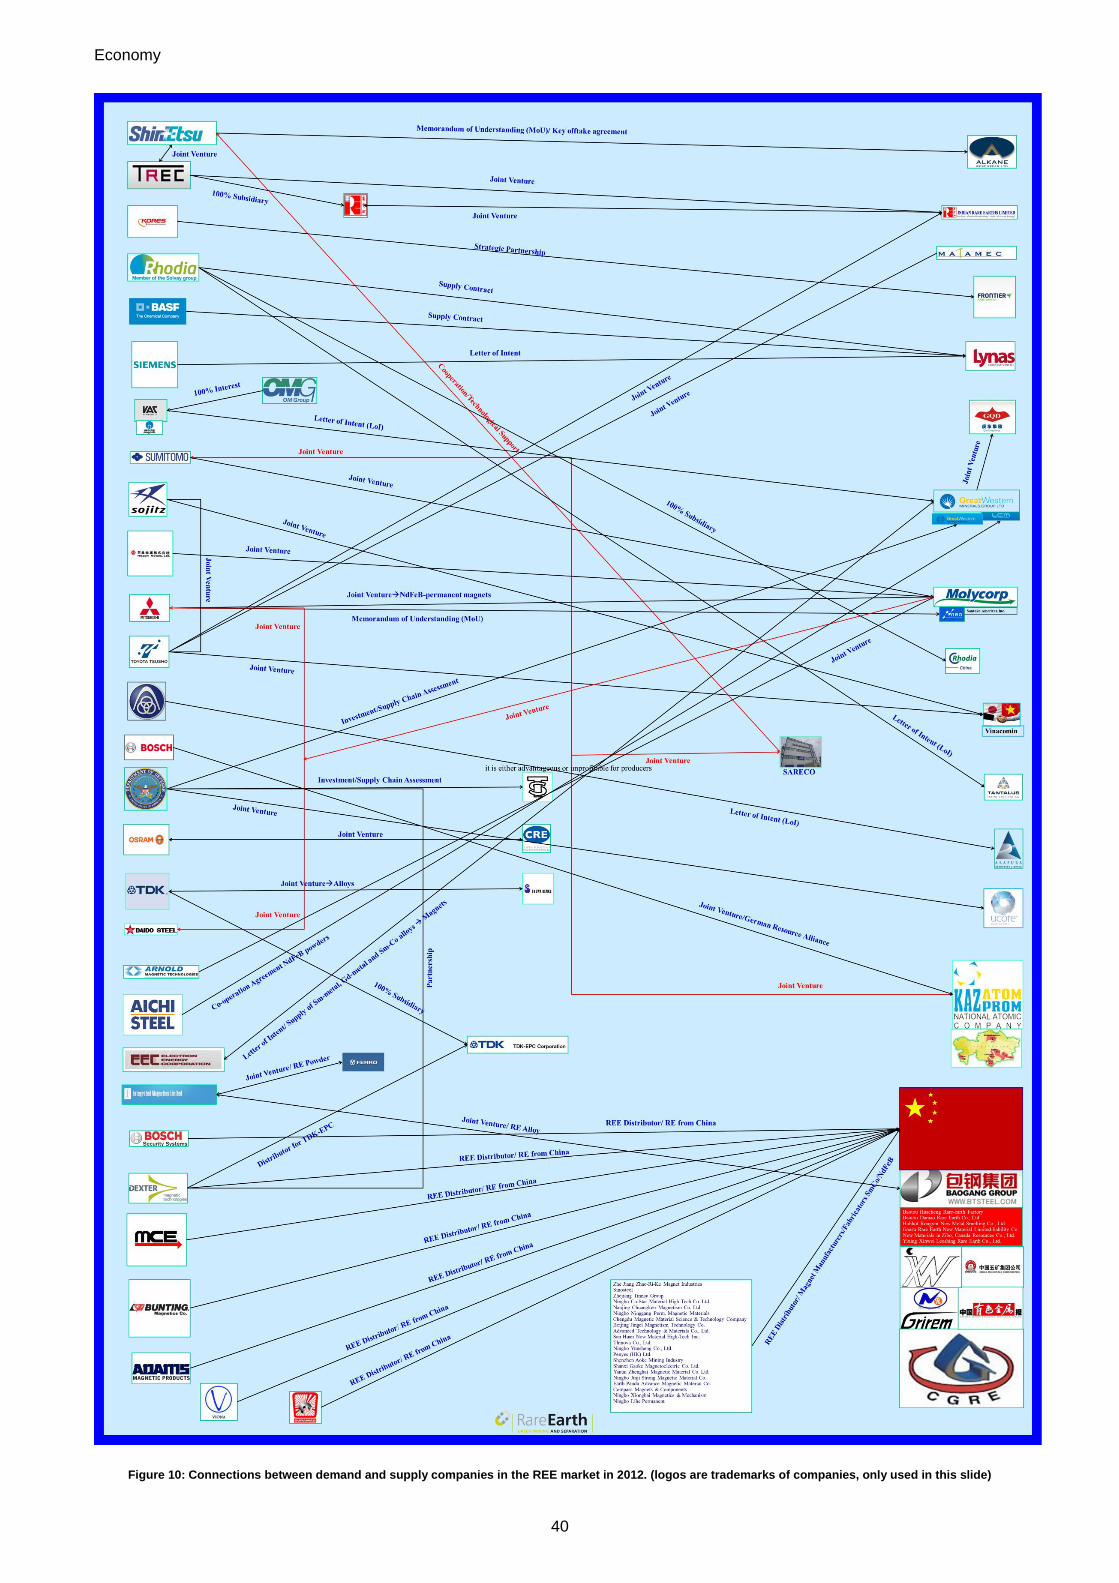
Economy
40
Figure 10: Connections between demand and supply companies in the REE market in 2012. (logos are trademarks of companies, only used in this slide)
Economy
41
4.1.3 Price Development
In this chapter, the development of both China Domestic and FOB prices is described.
The prices for China Domestic are considered from 2005 until 2015 and the prices for
the FOB from 2002 until 2015. The REE of erbium, holmium, thulium, ytterbium and
lutetium are excluded due to unavailable price data.
4.1.3.1 China Domestic Oxide Prices
In Figure 11, the development of China Domestic prices for lanthanum (La)-, cerium
(Ce)- and samarium (Sm)- oxides is depicted. One can recognize that the price struc-
ture of these elements stays quite similar over time. Within the period of 2005 to 2007,
they yielded nearly the same price of around 2.5 US-$/kg. In 2008, La-oxide had
slightly higher prices. The most noticeable event took place in 2011, when the prices
for all three types of REO increased and reached a peak. This growth in price was in
the case of Ce-oxide five times (20 US-$/kg), for La-oxide four times (16 US-$/kg), and
for Sm-oxide six times higher (12 US-$/kg) than the price in the year before. Moreover,
it is striking that Ce-oxide gained the highest prices, although La-oxide was slightly
higher in previous periods. Nevertheless, after this peak in 2011, the prices declined
again very abruptly, leading back to the level of prices from 2005 to 2007.
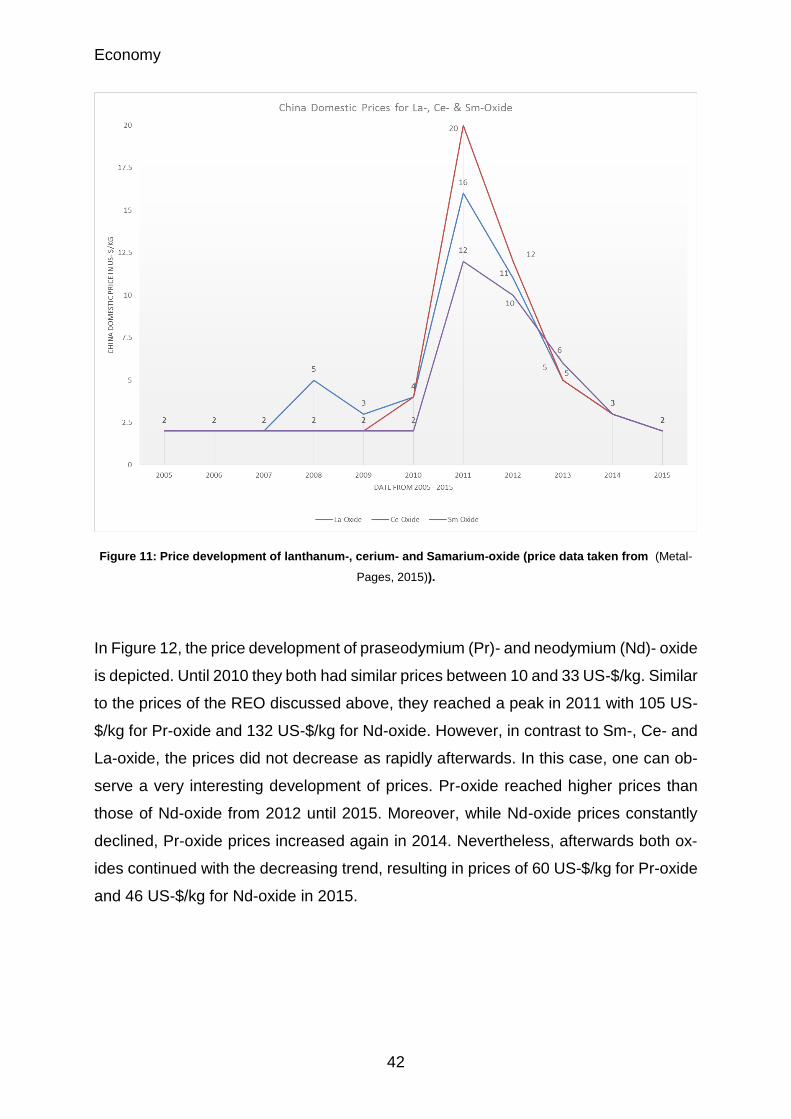
Economy
42
Figure 11: Price development of lanthanum-, cerium- and Samarium-oxide (price data taken from (Metal-
Pages, 2015)).
In Figure 12, the price development of praseodymium (Pr)- and neodymium (Nd)- oxide
is depicted. Until 2010 they both had similar prices between 10 and 33 US-$/kg. Similar
to the prices of the REO discussed above, they reached a peak in 2011 with 105 US-
$/kg for Pr-oxide and 132 US-$/kg for Nd-oxide. However, in contrast to Sm-, Ce- and
La-oxide, the prices did not decrease as rapidly afterwards. In this case, one can ob-
serve a very interesting development of prices. Pr-oxide reached higher prices than
those of Nd-oxide from 2012 until 2015. Moreover, while Nd-oxide prices constantly
declined, Pr-oxide prices increased again in 2014. Nevertheless, afterwards both ox-
ides continued with the decreasing trend, resulting in prices of 60 US-$/kg for Pr-oxide
and 46 US-$/kg for Nd-oxide in 2015.
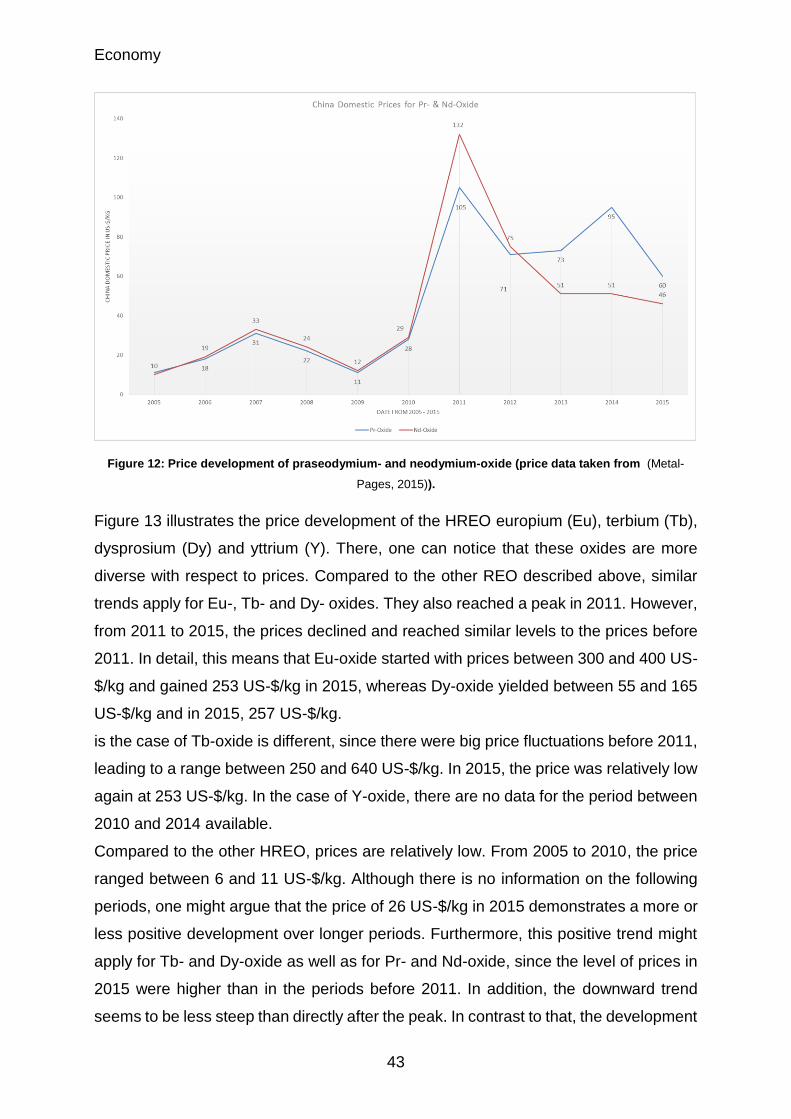
Economy
43
Figure 12: Price development of praseodymium- and neodymium-oxide (price data taken from (Metal-
Pages, 2015)).
Figure 13 illustrates the price development of the HREO europium (Eu), terbium (Tb),
dysprosium (Dy) and yttrium (Y). There, one can notice that these oxides are more
diverse with respect to prices. Compared to the other REO described above, similar
trends apply for Eu-, Tb- and Dy- oxides. They also reached a peak in 2011. However,
from 2011 to 2015, the prices declined and reached similar levels to the prices before
2011. In detail, this means that Eu-oxide started with prices between 300 and 400 US-
$/kg and gained 253 US-$/kg in 2015, whereas Dy-oxide yielded between 55 and 165
US-$/kg and in 2015, 257 US-$/kg.
is the case of Tb-oxide is different, since there were big price fluctuations before 2011,
leading to a range between 250 and 640 US-$/kg. In 2015, the price was relatively low
again at 253 US-$/kg. In the case of Y-oxide, there are no data for the period between
2010 and 2014 available.
Compared to the other HREO, prices are relatively low. From 2005 to 2010, the price
ranged between 6 and 11 US-$/kg. Although there is no information on the following
periods, one might argue that the price of 26 US-$/kg in 2015 demonstrates a more or
less positive development over longer periods. Furthermore, this positive trend might
apply for Tb- and Dy-oxide as well as for Pr- and Nd-oxide, since the level of prices in
2015 were higher than in the periods before 2011. In addition, the downward trend
seems to be less steep than directly after the peak. In contrast to that, the development
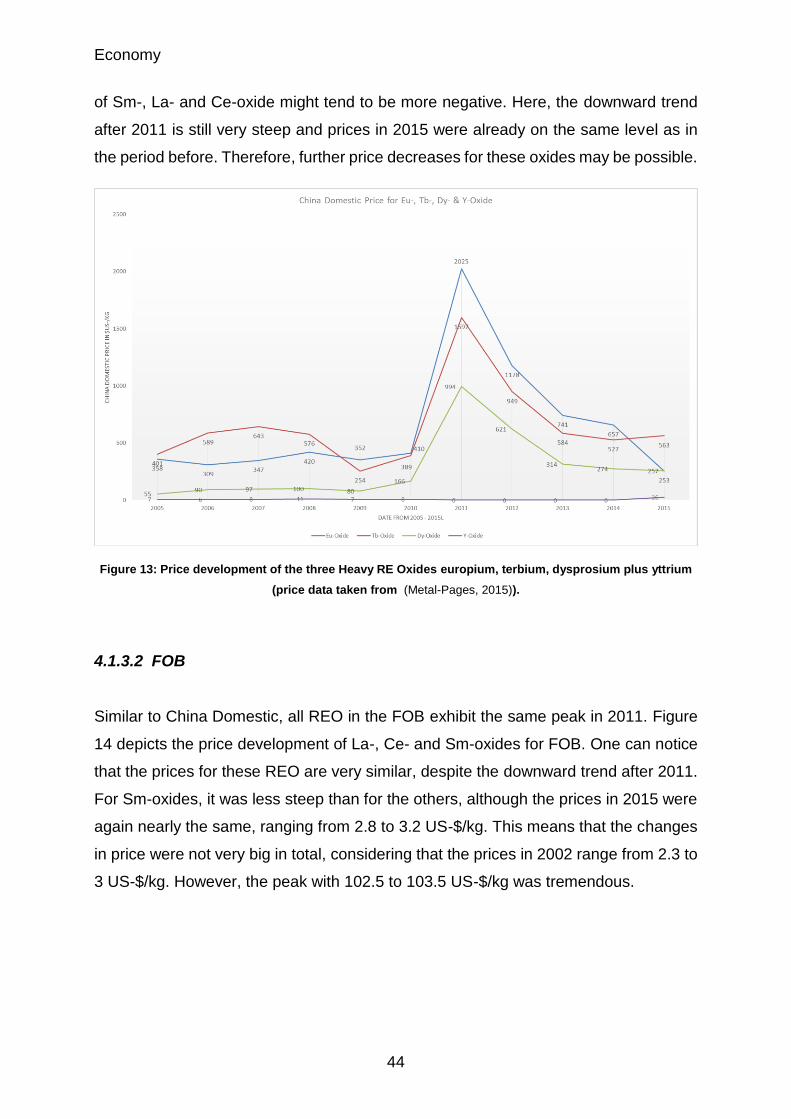
Economy
44
of Sm-, La- and Ce-oxide might tend to be more negative. Here, the downward trend
after 2011 is still very steep and prices in 2015 were already on the same level as in
the period before. Therefore, further price decreases for these oxides may be possible.
Figure 13: Price development of the three Heavy RE Oxides europium, terbium, dysprosium plus yttrium
(price data taken from (Metal-Pages, 2015)).
4.1.3.2 FOB
Similar to China Domestic, all REO in the FOB exhibit the same peak in 2011. Figure
14 depicts the price development of La-, Ce- and Sm-oxides for FOB. One can notice
that the prices for these REO are very similar, despite the downward trend after 2011.
For Sm-oxides, it was less steep than for the others, although the prices in 2015 were
again nearly the same, ranging from 2.8 to 3.2 US-$/kg. This means that the changes
in price were not very big in total, considering that the prices in 2002 range from 2.3 to
3 US-$/kg. However, the peak with 102.5 to 103.5 US-$/kg was tremendous.
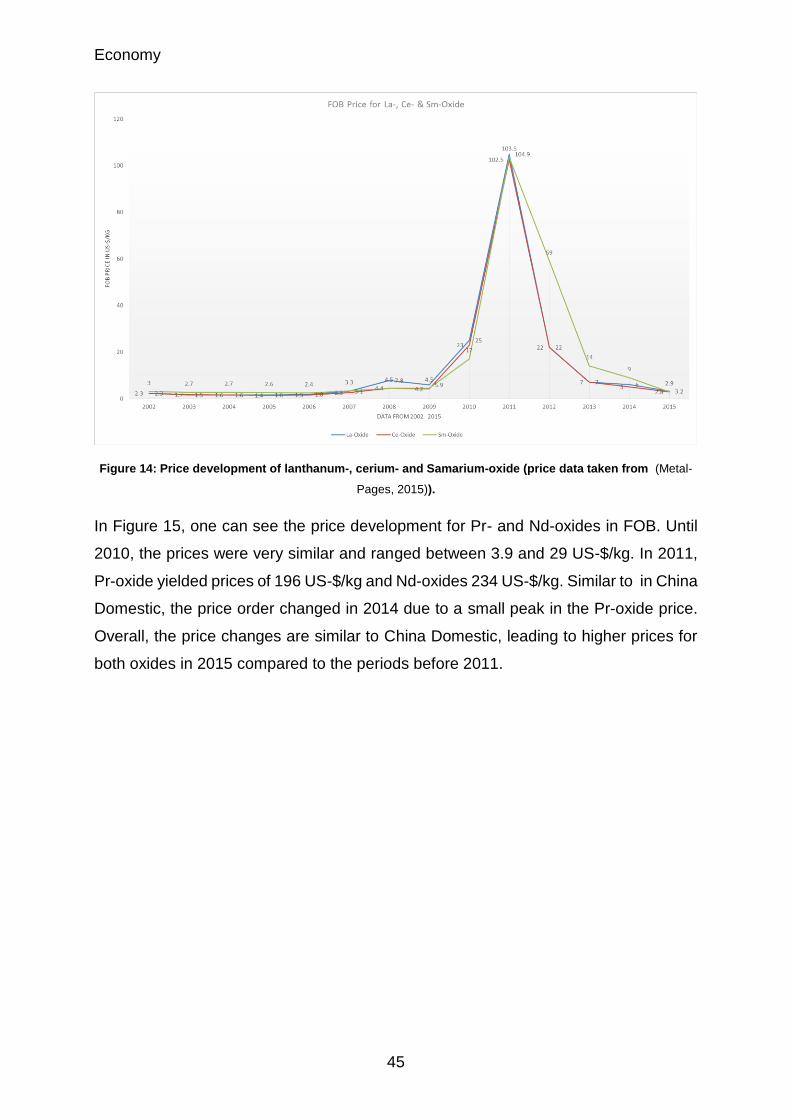
Economy
45
Figure 14: Price development of lanthanum-, cerium- and Samarium-oxide (price data taken from (Metal-
Pages, 2015)).
In Figure 15, one can see the price development for Pr- and Nd-oxides in FOB. Until
2010, the prices were very similar and ranged between 3.9 and 29 US-$/kg. In 2011,
Pr-oxide yielded prices of 196 US-$/kg and Nd-oxides 234 US-$/kg. Similar to in China
Domestic, the price order changed in 2014 due to a small peak in the Pr-oxide price.
Overall, the price changes are similar to China Domestic, leading to higher prices for
both oxides in 2015 compared to the periods before 2011.
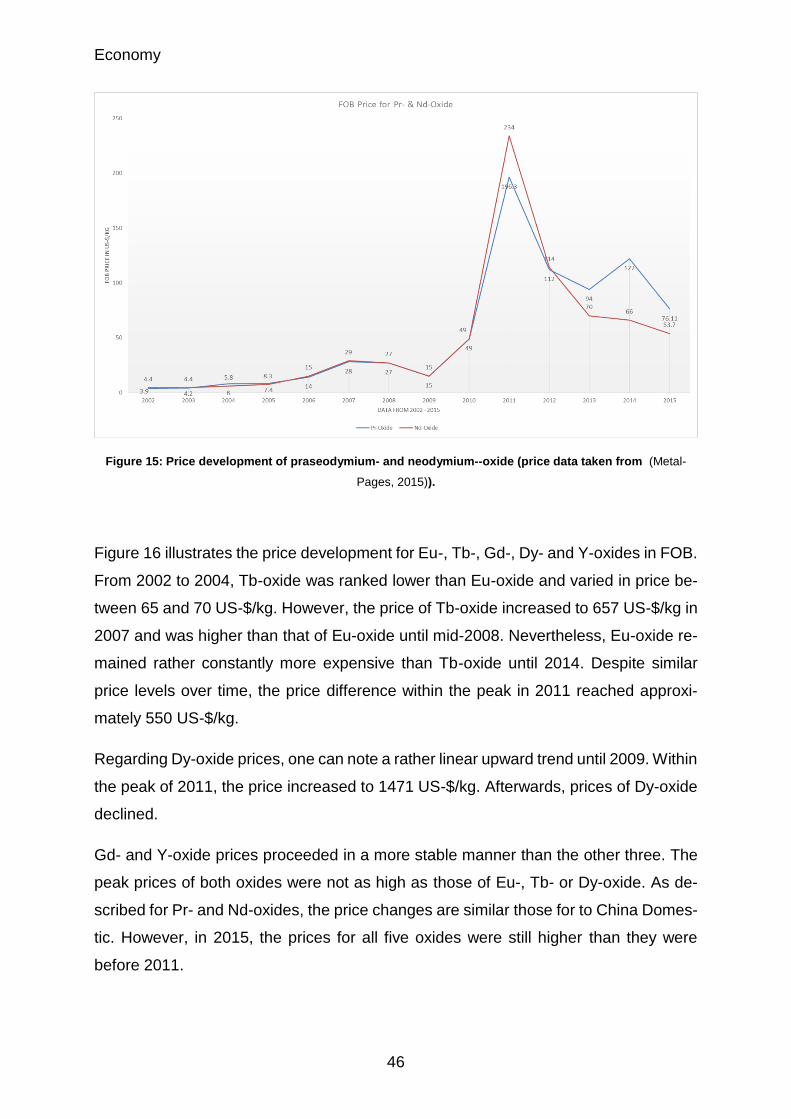
Economy
46
Figure 15: Price development of praseodymium- and neodymium--oxide (price data taken from (Metal-
Pages, 2015)).
Figure 16 illustrates the price development for Eu-, Tb-, Gd-, Dy- and Y-oxides in FOB.
From 2002 to 2004, Tb-oxide was ranked lower than Eu-oxide and varied in price be-
tween 65 and 70 US-$/kg. However, the price of Tb-oxide increased to 657 US-$/kg in
2007 and was higher than that of Eu-oxide until mid-2008. Nevertheless, Eu-oxide re-
mained rather constantly more expensive than Tb-oxide until 2014. Despite similar
price levels over time, the price difference within the peak in 2011 reached approxi-
mately 550 US-$/kg.
Regarding Dy-oxide prices, one can note a rather linear upward trend until 2009. Within
the peak of 2011, the price increased to 1471 US-$/kg. Afterwards, prices of Dy-oxide
declined.
Gd- and Y-oxide prices proceeded in a more stable manner than the other three. The
peak prices of both oxides were not as high as those of Eu-, Tb- or Dy-oxide. As de-
scribed for Pr- and Nd-oxides, the price changes are similar those for to China Domes-
tic. However, in 2015, the prices for all five oxides were still higher than they were
before 2011.
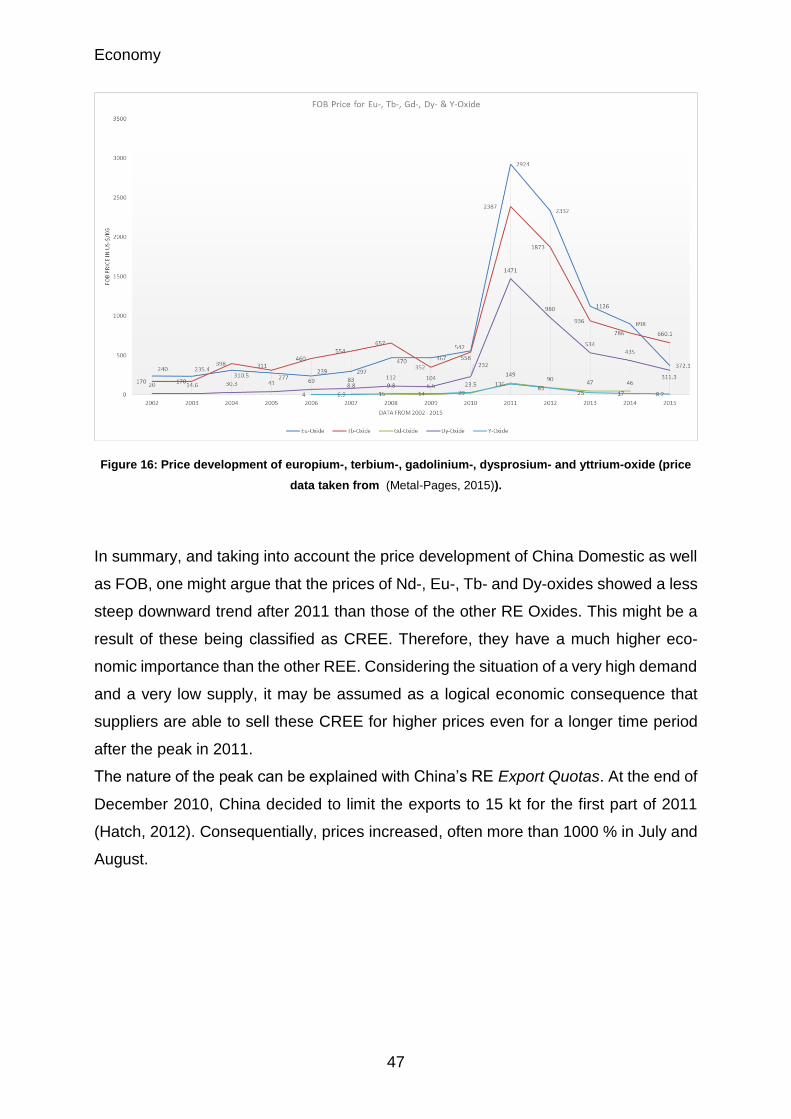
Economy
47
Figure 16: Price development of europium-, terbium-, gadolinium-, dysprosium- and yttrium-oxide (price
data taken from (Metal-Pages, 2015)).
In summary, and taking into account the price development of China Domestic as well
as FOB, one might argue that the prices of Nd-, Eu-, Tb- and Dy-oxides showed a less
steep downward trend after 2011 than those of the other RE Oxides. This might be a
result of these being classified as CREE. Therefore, they have a much higher eco-
nomic importance than the other REE. Considering the situation of a very high demand
and a very low supply, it may be assumed as a logical economic consequence that
suppliers are able to sell these CREE for higher prices even for a longer time period
after the peak in 2011.
The nature of the peak can be explained with China’s RE Export Quotas. At the end of
December 2010, China decided to limit the exports to 15 kt for the first part of 2011
(Hatch, 2012). Consequentially, prices increased, often more than 1000 % in July and
August.
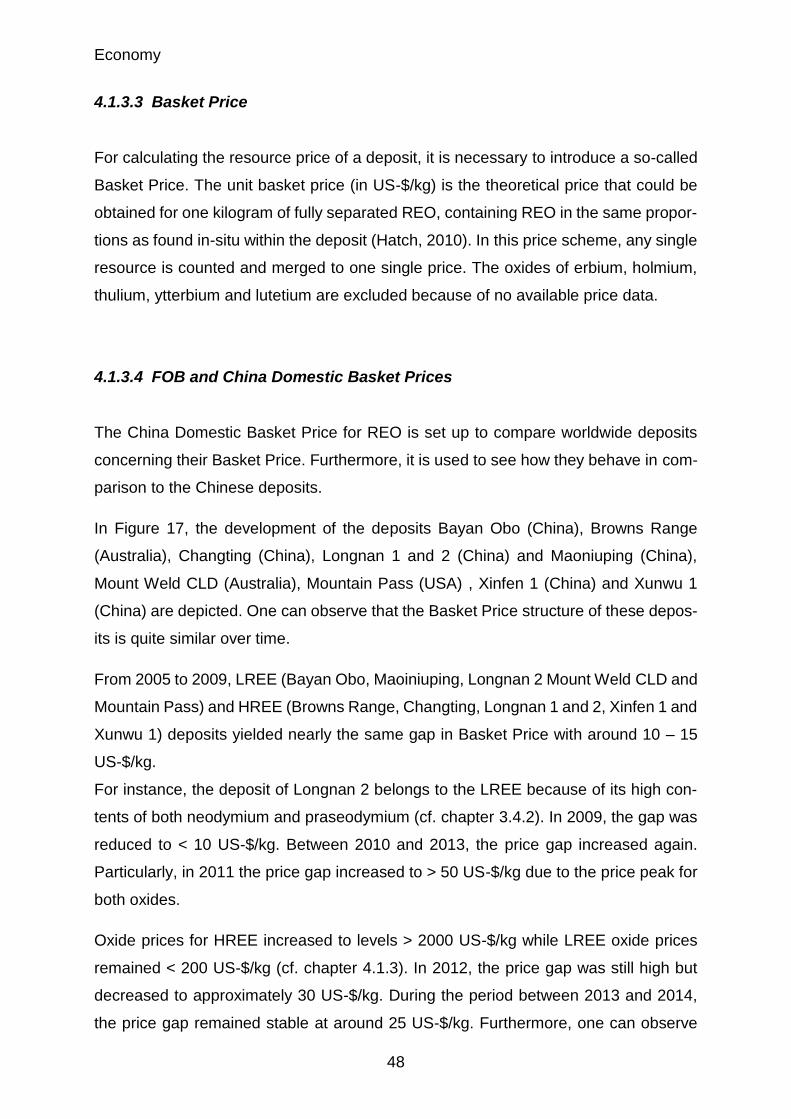
Economy
48
4.1.3.3 Basket Price
For calculating the resource price of a deposit, it is necessary to introduce a so-called
Basket Price. The unit basket price (in US-$/kg) is the theoretical price that could be
obtained for one kilogram of fully separated REO, containing REO in the same propor-
tions as found in-situ within the deposit (Hatch, 2010). In this price scheme, any single
resource is counted and merged to one single price. The oxides of erbium, holmium,
thulium, ytterbium and lutetium are excluded because of no available price data.
4.1.3.4 FOB and China Domestic Basket Prices
The China Domestic Basket Price for REO is set up to compare worldwide deposits
concerning their Basket Price. Furthermore, it is used to see how they behave in com-
parison to the Chinese deposits.
In Figure 17, the development of the deposits Bayan Obo (China), Browns Range
(Australia), Changting (China), Longnan 1 and 2 (China) and Maoniuping (China),
Mount Weld CLD (Australia), Mountain Pass (USA) , Xinfen 1 (China) and Xunwu 1
(China) are depicted. One can observe that the Basket Price structure of these depos-
its is quite similar over time.
From 2005 to 2009, LREE (Bayan Obo, Maoiniuping, Longnan 2 Mount Weld CLD and
Mountain Pass) and HREE (Browns Range, Changting, Longnan 1 and 2, Xinfen 1 and
Xunwu 1) deposits yielded nearly the same gap in Basket Price with around 10 – 15
US-$/kg.
For instance, the deposit of Longnan 2 belongs to the LREE because of its high con-
tents of both neodymium and praseodymium (cf. chapter 3.4.2). In 2009, the gap was
reduced to < 10 US-$/kg. Between 2010 and 2013, the price gap increased again.
Particularly, in 2011 the price gap increased to > 50 US-$/kg due to the price peak for
both oxides.
Oxide prices for HREE increased to levels > 2000 US-$/kg while LREE oxide prices
remained < 200 US-$/kg (cf. chapter 4.1.3). In 2012, the price gap was still high but
decreased to approximately 30 US-$/kg. During the period between 2013 and 2014,
the price gap remained stable at around 25 US-$/kg. Furthermore, one can observe
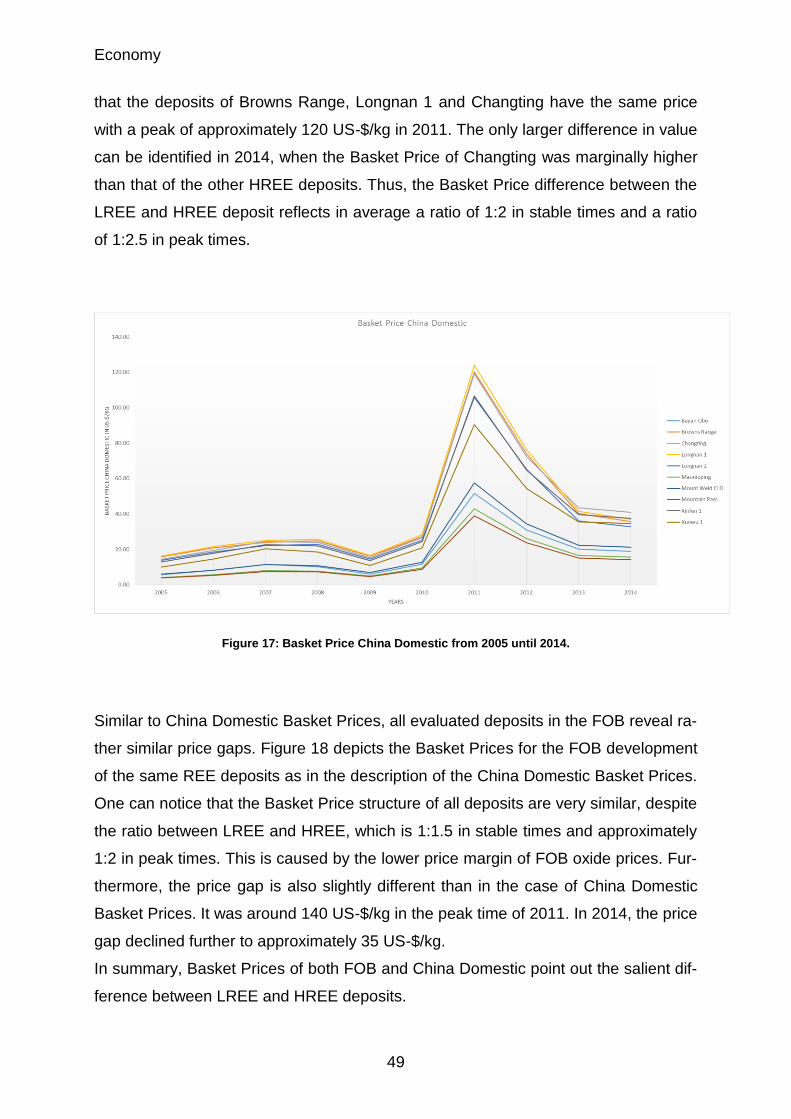
Economy
49
that the deposits of Browns Range, Longnan 1 and Changting have the same price
with a peak of approximately 120 US-$/kg in 2011. The only larger difference in value
can be identified in 2014, when the Basket Price of Changting was marginally higher
than that of the other HREE deposits. Thus, the Basket Price difference between the
LREE and HREE deposit reflects in average a ratio of 1:2 in stable times and a ratio
of 1:2.5 in peak times.
Figure 17: Basket Price China Domestic from 2005 until 2014.
Similar to China Domestic Basket Prices, all evaluated deposits in the FOB reveal ra-
ther similar price gaps. Figure 18 depicts the Basket Prices for the FOB development
of the same REE deposits as in the description of the China Domestic Basket Prices.
One can notice that the Basket Price structure of all deposits are very similar, despite
the ratio between LREE and HREE, which is 1:1.5 in stable times and approximately
1:2 in peak times. This is caused by the lower price margin of FOB oxide prices. Fur-
thermore, the price gap is also slightly different than in the case of China Domestic
Basket Prices. It was around 140 US-$/kg in the peak time of 2011. In 2014, the price
gap declined further to approximately 35 US-$/kg.
In summary, Basket Prices of both FOB and China Domestic point out the salient dif-
ference between LREE and HREE deposits.
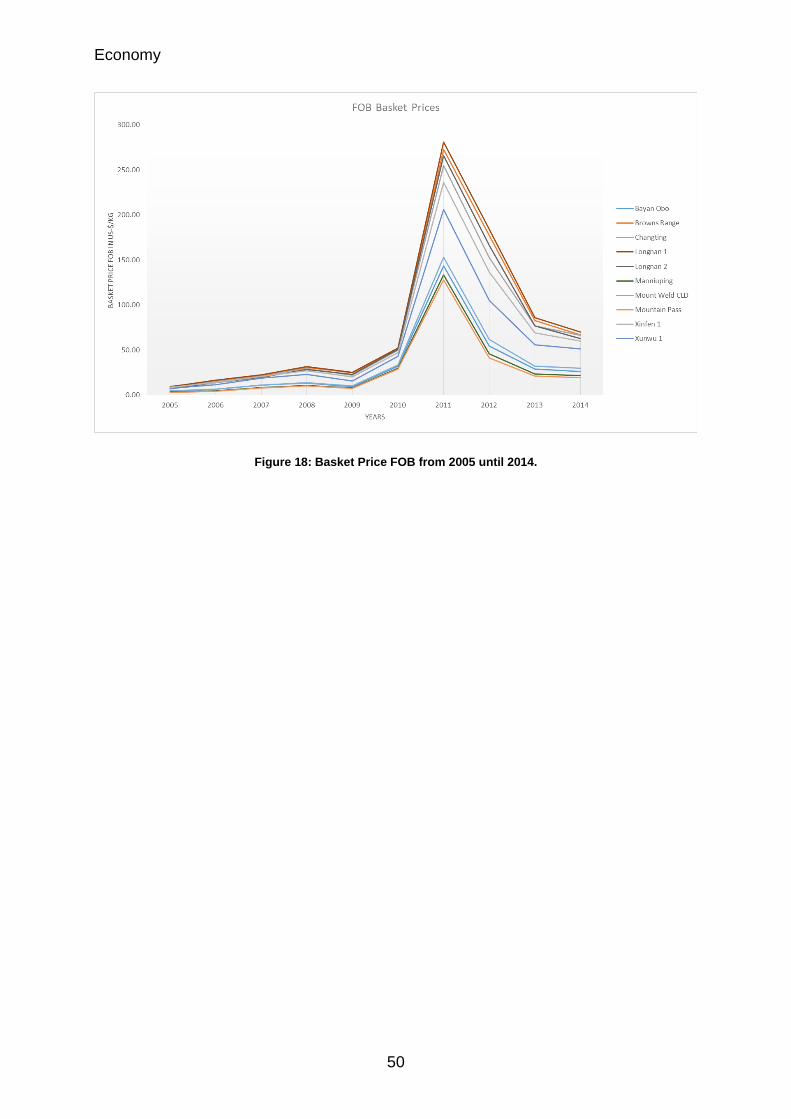
Economy
50
Figure 18: Basket Price FOB from 2005 until 2014.
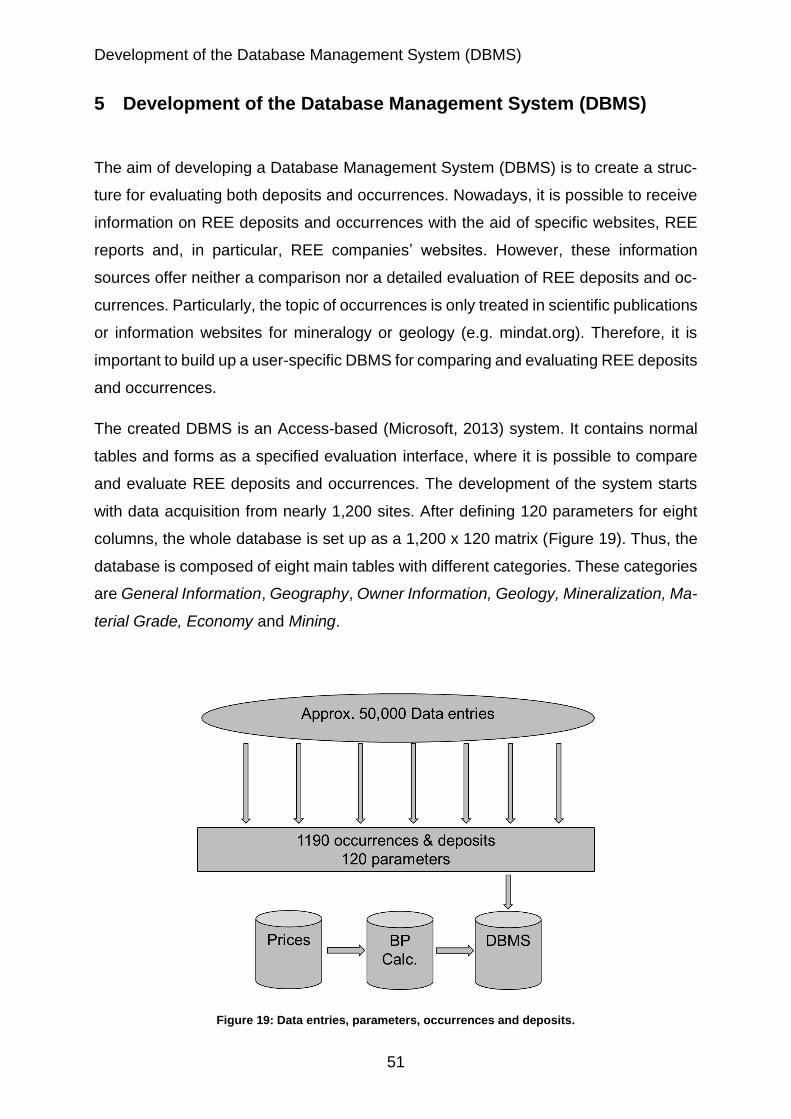
Development of the Database Management System (DBMS)
51
5 Development of the Database Management System (DBMS)
The aim of developing a Database Management System (DBMS) is to create a struc-
ture for evaluating both deposits and occurrences. Nowadays, it is possible to receive
information on REE deposits and occurrences with the aid of specific websites, REE
reports and, in particular, REE companies’ websites. However, these information
sources offer neither a comparison nor a detailed evaluation of REE deposits and oc-
currences. Particularly, the topic of occurrences is only treated in scientific publications
or information websites for mineralogy or geology (e.g. mindat.org). Therefore, it is
important to build up a user-specific DBMS for comparing and evaluating REE deposits
and occurrences.
The created DBMS is an Access-based (Microsoft, 2013) system. It contains normal
tables and forms as a specified evaluation interface, where it is possible to compare
and evaluate REE deposits and occurrences. The development of the system starts
with data acquisition from nearly 1,200 sites. After defining 120 parameters for eight
columns, the whole database is set up as a 1,200 x 120 matrix (Figure 19). Thus, the
database is composed of eight main tables with different categories. These categories
are General Information, Geography, Owner Information, Geology, Mineralization, Ma-
terial Grade, Economy and Mining.
Figure 19: Data entries, parameters, occurrences and deposits.
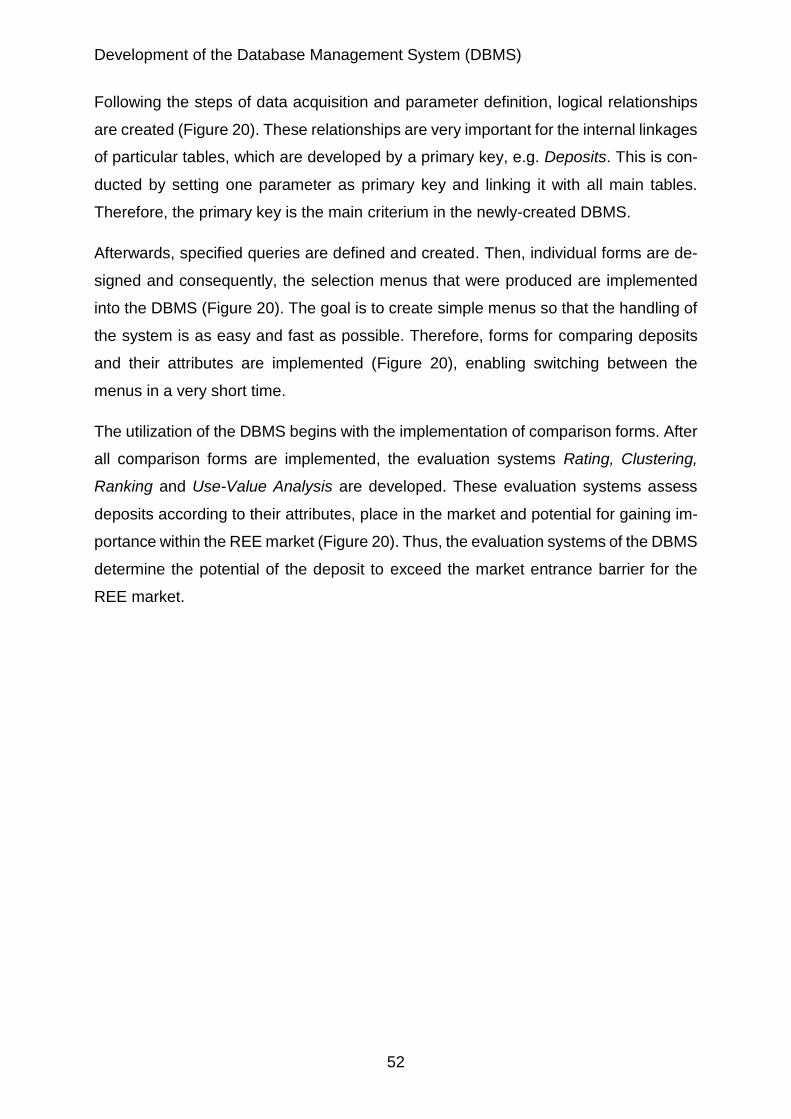
Development of the Database Management System (DBMS)
52
Following the steps of data acquisition and parameter definition, logical relationships
are created (Figure 20). These relationships are very important for the internal linkages
of particular tables, which are developed by a primary key, e.g. Deposits. This is con-
ducted by setting one parameter as primary key and linking it with all main tables.
Therefore, the primary key is the main criterium in the newly-created DBMS.
Afterwards, specified queries are defined and created. Then, individual forms are de-
signed and consequently, the selection menus that were produced are implemented
into the DBMS (Figure 20). The goal is to create simple menus so that the handling of
the system is as easy and fast as possible. Therefore, forms for comparing deposits
and their attributes are implemented (Figure 20), enabling switching between the
menus in a very short time.
The utilization of the DBMS begins with the implementation of comparison forms. After
all comparison forms are implemented, the evaluation systems Rating, Clustering,
Ranking and Use-Value Analysis are developed. These evaluation systems assess
deposits according to their attributes, place in the market and potential for gaining im-
portance within the REE market (Figure 20). Thus, the evaluation systems of the DBMS
determine the potential of the deposit to exceed the market entrance barrier for the
REE market.
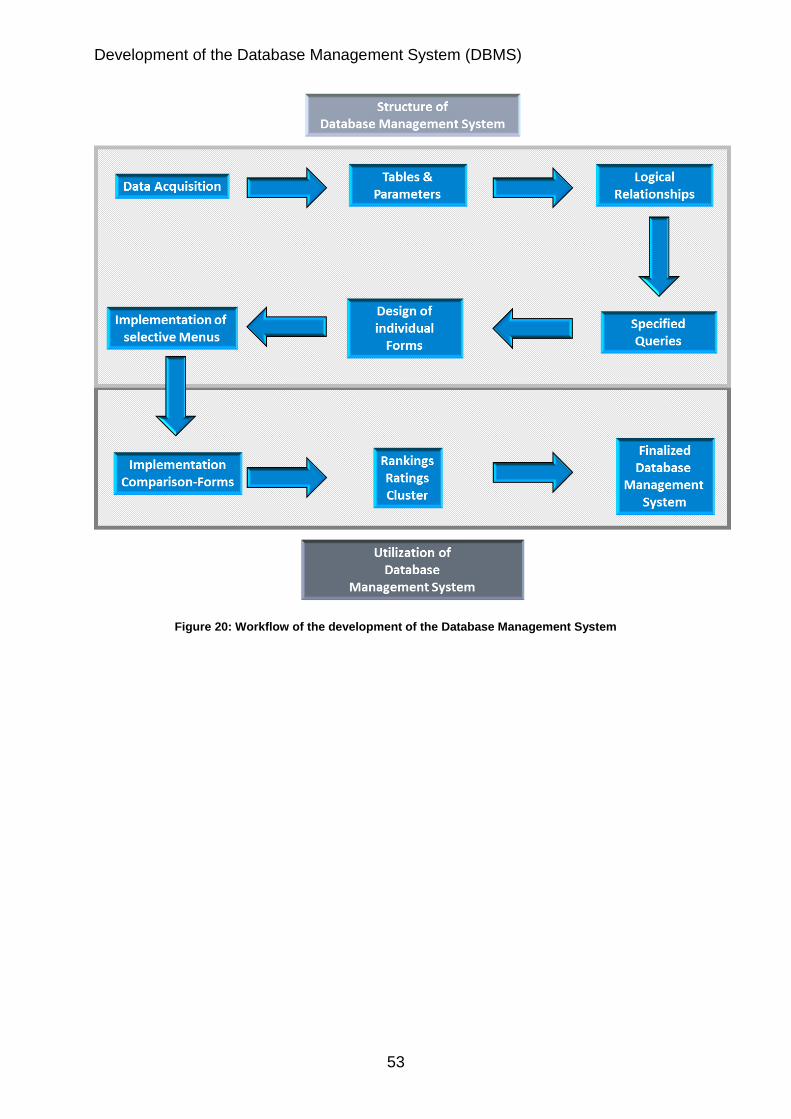
Development of the Database Management System (DBMS)
53
Figure 20: Workflow of the development of the Database Management System
Development of the Database Management System (DBMS)
54
5.1 Definition of parameters
5.1.1 General Information
Deposits:
Name of the deposit or name of the mining district.
Deposit Type:
Depends on the character of the rock and classifies it in mineralogical terms.
Country:
A territory of a nation or state.
State or Province:
A territory governed as an administrative or political unit of a country.
Deposit Rating:
Modified after and partly depending on systems of credit rating for companies. It should
systematically rate deposits according to their mineralogical and economical charac-
teristics and values. Rating levels are graded from highest level AAA to lowest level C.
Within the ranking system, there are nine levels (AAA-AA-A-BBB-BB-B-CCC-CC-C),
which allow for the differentiation of deposits and occurrences.
Level AAA means a first class deposit for REE with ratings of the highest values in the
deposit's economics and resources. Level C stands for the worst deposits with respect
to economic feasibility, political systems (unrest), tonnage, grade ore concentration,
trade and environment (Green Mining).
Source&Date of Estimate(s):
First estimation of deposits.
Government Type/Form (Country):
Type of government by country.
5.1.2 Geography
Latitude:
Geographic Location.
Development of the Database Management System (DBMS)
55
Longitude:
Geographic Location.
Nearby Port (in km) Linear Distance:
Nearest port in linear distance to deposit.
Industries (existing):
Existing industries pertaining to infrastructure of REE deposits/mining.
Road Map./Existing/Conditions:
Mapping and distance of optional transport system.
Railway Map./Existing/Conditions:
Mapping and distance of optional transport system.
Airport Map./Existing/Conditions:
Mapping and distance of optional transport system.
Country-GDP (millions of US-$):
“Gross Domestic Product = refers to the market value of all officially recognized final
goods and services produced within a country in a given period.” (Science Daily, 2012).
Country-GNP (millions of US-$):
“Gross National Product = an estimate of the total money value of all the final goods
and services produced in a given one-year period by the factors of production owned
by a particular country's residents.” (Investopedia, 2012)
Industrial Logistics:
“Classification under three headings: (i) product support, also referred to as engineer-
ing logistics or post-sale customer support, (ii) production support which includes more
traditional forms of logistics such as the supply chain and final product distribution, and
finally (iii) industrial sector which includes non-firm specific issues linked to transporta-
tion policy, support location of industrial parks, etc." (Barros, 1997).
Development of the Database Management System (DBMS)
56
5.1.3 Owner Information
Company:
Name of the company and date of establishment.
Stock Exchange Symbol:
“A unique series of letters assigned to a security for trading purposes. NYSE and
AMEX listed stocks have three characters or less. Nasdaq-listed securities have four
or five characters. If a fifth letter appears, it identifies the security as other than a single
issue of common stock. They are also known as "ticker symbols”. The fifth letter of the
ticker symbol of a Nasdaq listed stock can prove very helpful in finding out the history
of a company. For example, if there is an "E" as the fifth letter, the company has had
previous trouble with their SEC filings.” (Investopedia, 2012)
ISIN (International Securities Identification Number):
“A unique international code, which identifies a securities issue. Each country has a
national numbering agency, which assigns ISIN numbers for securities in that country.”
(ISIN, 2012)
Equity emission (Date and Share Price ($)):
Emission of shares with share & opening price.
Historical Max ($):
Historical maximum share price in US-$.
Historical Min ($):
Historical minimum share price in US-$.
Market Capitalization ($):
“Market capitalization (or market cap) is the total value of the issued shares of a publicly
traded company; it is equal to the share price times the number of shares outstanding.
As outstanding stock is bought and sold in public markets, capitalization could be used
as a proxy for the public opinion of a company's net worth and is a determining factor
in some forms of stock valuation.” (SKS Business, 2012)
Share quantity:
Maximum amount of shares a company emitted.
Development of the Database Management System (DBMS)
57
Licences:
Licences a company earns from the state to explore an occurrence/ a deposit.
Contracts Government:
A Company's contracts with the government.
Subsidy:
A benefit given by the government to groups or individuals, usually in the form of a
cash payment or tax reduction.
Royalties:
“Royalties (sometimes, running royalties, or private sector taxes) are usage-based
payments made by one party (the "licensee") to another (the "licensor") for the right to
ongoing use of an asset, sometimes an intellectual property. Royalties are typically
agreed upon as a percentage of gross or net revenues derived from the use of an asset
or a fixed price per unit sold of an item of such, but there are also other modes and
metrics of compensation. A royalty interest is the right to collect a stream of future
royalty payments, often used in the oil or music industry to describe a percentage own-
ership of future production or revenues from a given leasehold, which may divested
from be the original owner of the asset.” (Russell & Cohn, 2012)
Trade capacity (tons/Country):
Trade capacity of the country.
Market Share (Country):
Market share of the country.
Import (Country):
Import of REE by country.
Export Quota (tons/year/Country):
Export quota of REE by country.
Production volume (Country):
Production volume of REE by country.
Domestic Consumption (tons/Country):
Total consumption of REE by single country (internal consumption).
State-owned deposits (Country):
Development of the Database Management System (DBMS)
58
State-owned deposits by country, particularly communistic countries.
State-owned companies (Country):
State-owned companies by country, particularly communistic countries.
5.1.4 Geology
Host Rock(s):
Rock which serves as a host for other rocks or for mineral deposits.
Geochemistry:
Geochemical analysis of minerals to evaluate for REE.
Geochronology:
The branch of geology concerned with ordering and dating of events in the earth's
history, including the origin of the earth itself.
Geological Risks:
Natural Hazards (e.g. earthquake zones, floods, tropical cyclones, etc.).
5.1.5 Mineralization
Deposit Status:
Deposit or occurrence (setting for all deposits and occurrences in the DBMS).
REE Deposit - Type (LREE/HREE):
Difference between a LREE deposit (including more than 75 % of LREE) and a HREE
deposit (including more than 25 % of HREE+Y).
Ore Mineral Association:
"A group of minerals found together in a rock. Includes all ore minerals suggesting the
complexity of geological processes generating them (e.g. remobilisation)". (Stylianos-
Stavvas, 1995)
Development of the Database Management System (DBMS)
59
Ores:
Types of ores relevant to REE deposits (Monazite, Bastnasite, Xenotime, Ion-Adsorp-
tion Clays, Apatite, Eudialyte, and Zirconium).
Gangue Minerals:
Gangue minerals refer to material associated with ore. They are also mined and after-
wards removed by crushing and separation processes.
Ore Minerals:
Minerals that are significant for the ore or the deposit.
5.1.6 Material Grade
La2O3: Lanthanum-Oxide of a Rare Earth Element (REE).
CeO2: Cerium-Oxide of a Rare Earth Element (REE).
Pr6O11: Praseodymium-Oxide of a Rare Earth Element (REE).
Nd2O3: Neodymium-Oxide of a Rare Earth Element (REE).
Sm2O3: Samarium-Oxide of a Rare Earth Element (REE).
Eu2O3: Europium-Oxide of a Rare Earth Element (REE).
Gd2O3: Gadolinium-Oxide of a Rare Earth Element (REE).
Tb4O7: Terbium-Oxide of a Rare Earth Element (REE).
Dy2O3: Dysprosium-Oxide of a Rare Earth Element (REE).
Ho2O3: Holmium-Oxide of a Rare Earth Element (REE).
Er2O3: Erbium-Oxide of a Rare Earth Element (REE).
Tm2O3: Thulium-Oxide of a Rare Earth Element (REE).
Yb2O3: Ytterbium-Oxide of a Rare Earth Element (REE).
Lu2O3: Lutetium-Oxide of a Rare Earth Element (REE).
Y2O3: Yttrium-Oxide of a Rare Earth Element (REE).
Development of the Database Management System (DBMS)
60
Uranium Grade (U3O8): Grade of Uranium (U3O8) within the deposit.
Thorium Grade (ThO2): Grade of Thorium (ThO2) within the deposit.
Niobium (Nb): Mineral contained in the ore body and by-product of REE mining.
Tantalum (Ta): Mineral contained in the ore body and by-product of REE mining.
5.1.7 Economy
Cut-Off-Grade (wt-%) INFERRED (INF):
Cf. chapter 3.3
MR (t) INF:
Cf. chapter 3.3
TREO (wt-%) INF:
Total Rare Earth Oxide value of the deposit in weight percentage.
TREO (t) INF:
Total Rare Earth Oxide value of the deposit in tonnage.
Cut-Off-Grade (wt-%) INDICATED (IND):
Cf. chapter 3.3
MR (t) IND: Cf. definition of MR (t) INF.
TREO (wt-%) IND: Cf. definition of TREO (wt-%) INF.
TREO (t) IND: Cf. definition of TREO (t) INF.
Cut-Off-Grade (wt-%) MEASURED (MEA):
Cf. chapter 3.3
MR (t) MEA: Cf. definition of MR (t) INF.
TREO (wt-%) MEA: Cf. definition of TREO (wt-%) INF.
TREO (t) MEA: Cf. definition of TREO (t) INF.
Development of the Database Management System (DBMS)
61
MR (t) Total: Cf. definition of MR (t) INF.
TREO (wt-%) Average:
The total sum of all 15 Rare Earth Elements in wt-%.
TREO (t) Total:
The total sum of all 15 Rare Earth Elements in t.
Reserves:
Cf. chapter 3.3
In situ value TREO ($/t):
“The in-situ value regards the size and grade of the acquired resource chastened by
the level of country risk, as perceived and analysed at the time of the transaction. This
is the level of expectation one has with the mining project and one of the factors that
has an impact on the acquisition price.” (Hatch, 2012)
Basket Price ($/kg) (FOB) Deposit:
“= Unit Basket Price FOB (in US-$/kg). This is the theoretical price that could be ob-
tained for one kilogram of fully separated RE oxides, containing RE oxides in the same
proportions as found in-situ within the deposit (e.g. if the proportion of neodymium ox-
ide in the total RE oxide material grade is 10%, the unit basket price includes the
market price for 100 grams of neodymium oxide).” (Hatch, 2012)
Basket Price ($/kg) /(Domestic China) Deposit:
Cf. definition Basket Price ($/kg) (FOB) Deposit.
5.1.8 Mining
Deposit Information:
Contains specific information regarding the deposit.
General Development Status:
General development status of the deposit (stages).
Actual Production:
Development of the Database Management System (DBMS)
62
Actual production of the deposit.
Historical Production:
Historical production of the deposit.
Open Pit / Underground:
Type of mining.
Mining life (LOM):
“The time in which, through the employment of the available capital, the ore reserves‒
or such reasonable extension of the ore reserves as conservative geological analysis
may justify‒will be extracted.” (Hoover, 2013)
Mining (Tip) Ratio, Tonnage:
Tip material, tonnage and ratios between production and tipping.
Overburden:
“In mining and in archaeology, overburden (also called waste or spoil) is the material
that is situated above an area of economic or scientific interest. In mining, it is most
commonly the rock, soil, and ecosystem that is located above a coal seam or ore body.
Overburden is distinct from tailings, the material that remains after economically valu-
able components have been extracted from the generally finely milled ore. Overburden
is removed during surface mining, but is typically not contaminated with toxic compo-
nents and may be used to restore an exhausted mining site to a semblance of its ap-
pearance before mining began. Overburden may also be used as a term to describe
all soil and ancillary material above the bedrock horizon in a given area.” (Factforge,
2013)
Stripping Ratio:
“In mining, stripping ratio or strip ratio refers to the ratio of the volume of overburden
(or waste material) required to be handled in order to extract some volume of ore. For
example, a 3:1 stripping ratio means that mining one cubic meter of ore will require
mining three cubic meters of waste rock. Stripping ratios are typically reduced to show
the volume of waste removal required to extract one unit volume of ore. For instance,
2:1 as opposed to 4:2. When compared to surface mining, which requires overburden
removal prior to ore extraction, underground mining operations tend to have lower
stripping ratios due to increased selectivity. All other factors being equal, mining at a
Development of the Database Management System (DBMS)
63
higher stripping ratio is less profitable than mining at a lower stripping ratio because
more waste must be moved (at a cost per unit volume) for an equivalent volume of
revenue generating ore. If the ratio is too high given a particular price of ore and asso-
ciated cost of mining then it may not be economical to conduct mining.” (Hartman,
1996)
Mining recovery:
An expression of the amount of product (nominal or actual) that can be manufactured
from a given input of raw material Mining (mining-onlineexpos, 2013).
Processing recovery:
“An expression of the amount of product (nominal or actual) that can be manufactured
from a given input of raw material.“ (Rothsay, 2014).
Metallurgical recovery:
“An expression of the amount of product (nominal or actual) that can be manufactured
from a given input of raw material Metallurgy.” (Rothsay, 2014)
Recultivation:
“General expression used for the making of bare areas (raw mineral soils) fertile again
through bioengineering and refertilization.” (Rothsay, 2014)
Acid Mine Drainage:
“Acid mine drainage, Acid and metalliferous drainage (AMD), or acid rock drainage
(ARD), refers to the outflow of acidic water from (usually abandoned) metal mines or
coal mines. However, other areas where the earth has been disturbed (e.g. construc-
tion sites, subdivisions, transportation corridors, etc.) may also contribute acid rock
drainage to the environment. In many localities the liquid that drains from coal stocks,
coal handling facilities, coal washeries, and even coal waste tips can be highly acidic,
and in such cases, it is treated as acid rock drainage. Acid rock drainage occurs natu-
rally within some environments as part of the rock weathering process but is exacer-
bated by large-scale earth disturbances characteristic of mining and other large con-
struction activities, usually within rocks containing an abundance of sulfide minerals.”
(MinTails, 2015)
Development of the Database Management System (DBMS)
64
Dimension Tailings:
Tailings in length, width and depth (dimension).
Environmental protection (Deposit, Air, Water, Soil):
Protection of the environmentSeparation PlantsContamination through air, water
and soil.
Artisanal Mining (Miners/Country):
Artisanal mining by country, especially Asia, Africa & South America.
5.2 Structure of the DBMS
5.2.1 Tables
Building basic tables
Basic tables are the starting point of each construction of databases and are the output
information generated for the databases. Generally, basic tables are created by using
Design View (Microsoft, 2013). The Design View of a table is the typical tool for con-
structing tables in MS Access (Microsoft, 2013). In the program, the field name can be
specified using the ‘Data Type’ dropdown menu(Figure 21). These system suggestions
are mandatory arguments. The subsequent description is filled depending on the sys-
tem requirements. MS Access tables (Microsoft, 2013) also have inbuilt functions like
“Filter” and “Sort” in which a search for a specific entry is possible. However, such
search requests are not robust and hence cannot replace the usefulness of defining
queries.
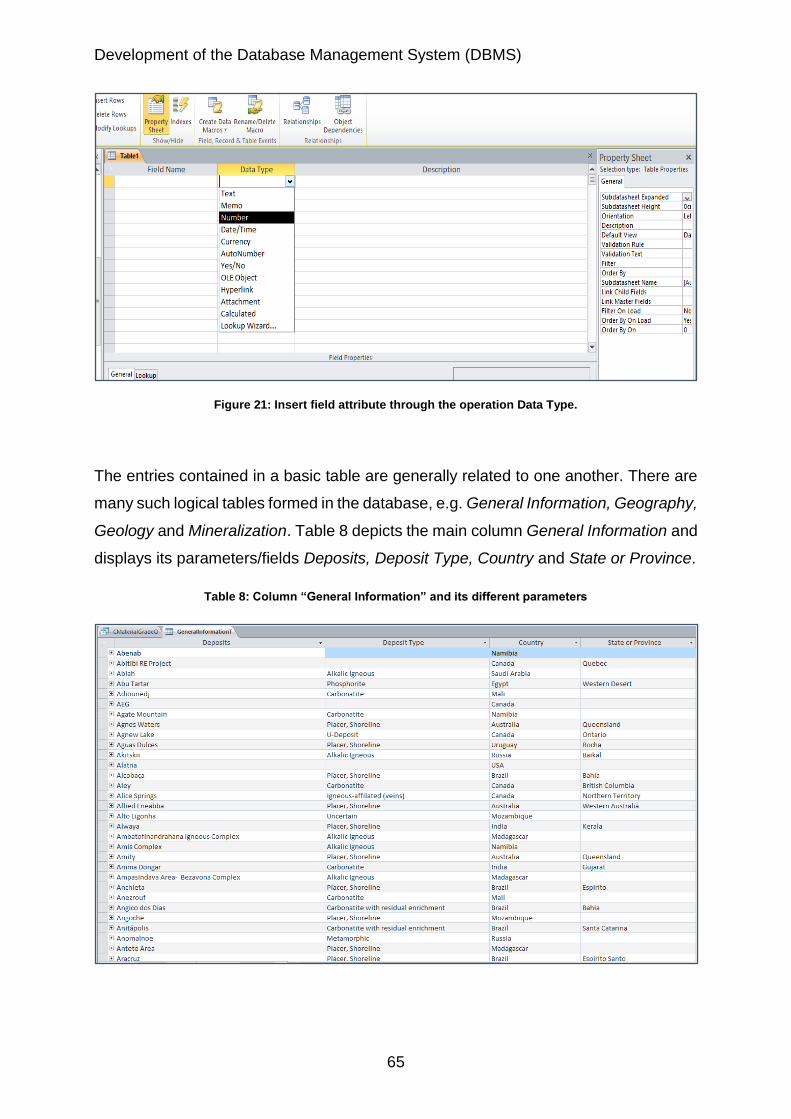
Development of the Database Management System (DBMS)
65
Figure 21: Insert field attribute through the operation Data Type.
The entries contained in a basic table are generally related to one another. There are
many such logical tables formed in the database, e.g. General Information, Geography,
Geology and Mineralization. Table 8 depicts the main column General Information and
displays its parameters/fields Deposits, Deposit Type, Country and State or Province.
Table 8: Column “General Information” and its different parameters
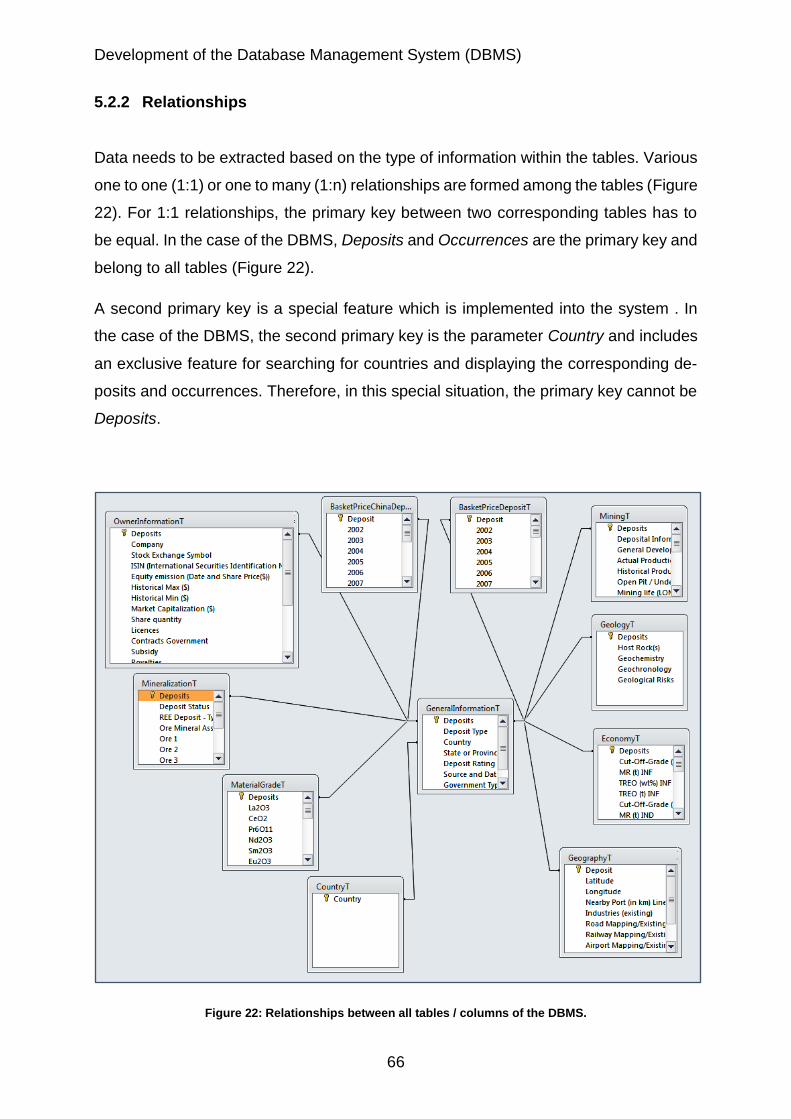
Development of the Database Management System (DBMS)
66
5.2.2 Relationships
Data needs to be extracted based on the type of information within the tables. Various
one to one (1:1) or one to many (1:n) relationships are formed among the tables (Figure
22). For 1:1 relationships, the primary key between two corresponding tables has to
be equal. In the case of the DBMS, Deposits and Occurrences are the primary key and
belong to all tables (Figure 22).
A second primary key is a special feature which is implemented into the system . In
the case of the DBMS, the second primary key is the parameter Country and includes
an exclusive feature for searching for countries and displaying the corresponding de-
posits and occurrences. Therefore, in this special situation, the primary key cannot be
Deposits.
Figure 22: Relationships between all tables / columns of the DBMS.
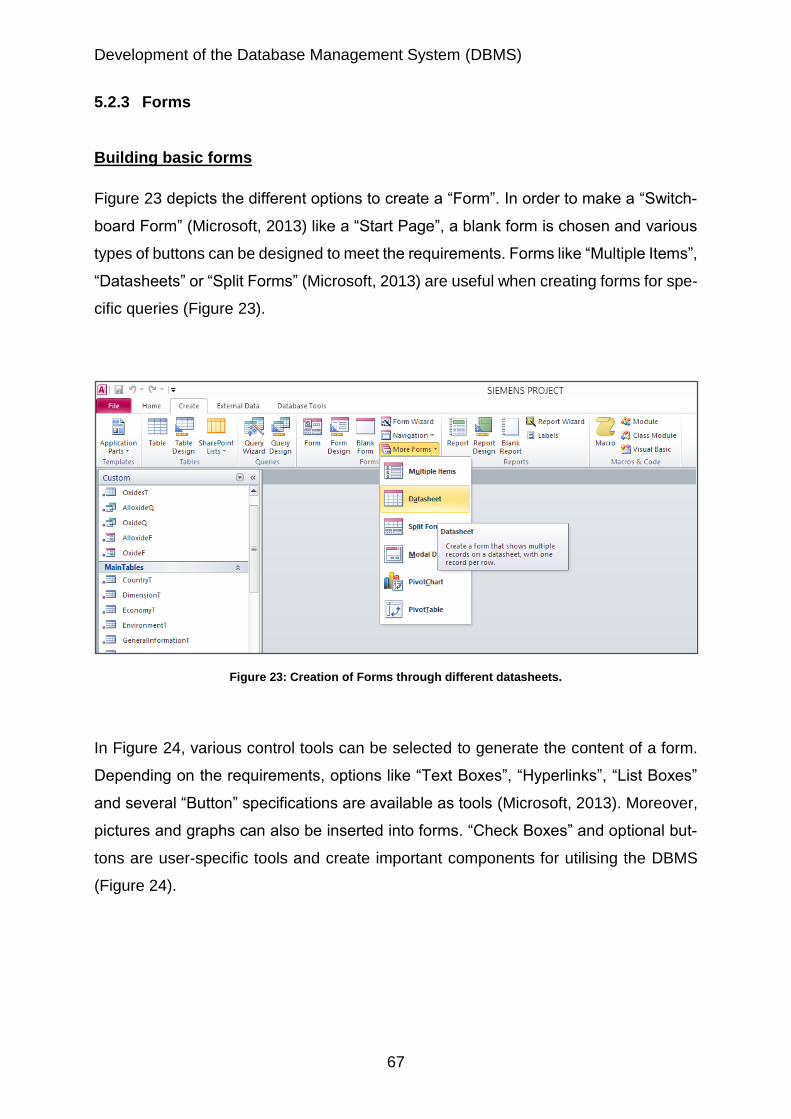
Development of the Database Management System (DBMS)
67
5.2.3 Forms
Building basic forms
Figure 23 depicts the different options to create a “Form”. In order to make a “Switch-
board Form” (Microsoft, 2013) like a “Start Page”, a blank form is chosen and various
types of buttons can be designed to meet the requirements. Forms like “Multiple Items”,
“Datasheets” or “Split Forms” (Microsoft, 2013) are useful when creating forms for spe-
cific queries (Figure 23).
Figure 23: Creation of Forms through different datasheets.
In Figure 24, various control tools can be selected to generate the content of a form.
Depending on the requirements, options like “Text Boxes”, “Hyperlinks”, “List Boxes”
and several “Button” specifications are available as tools (Microsoft, 2013). Moreover,
pictures and graphs can also be inserted into forms. “Check Boxes” and optional but-
tons are user-specific tools and create important components for utilising the DBMS
(Figure 24).
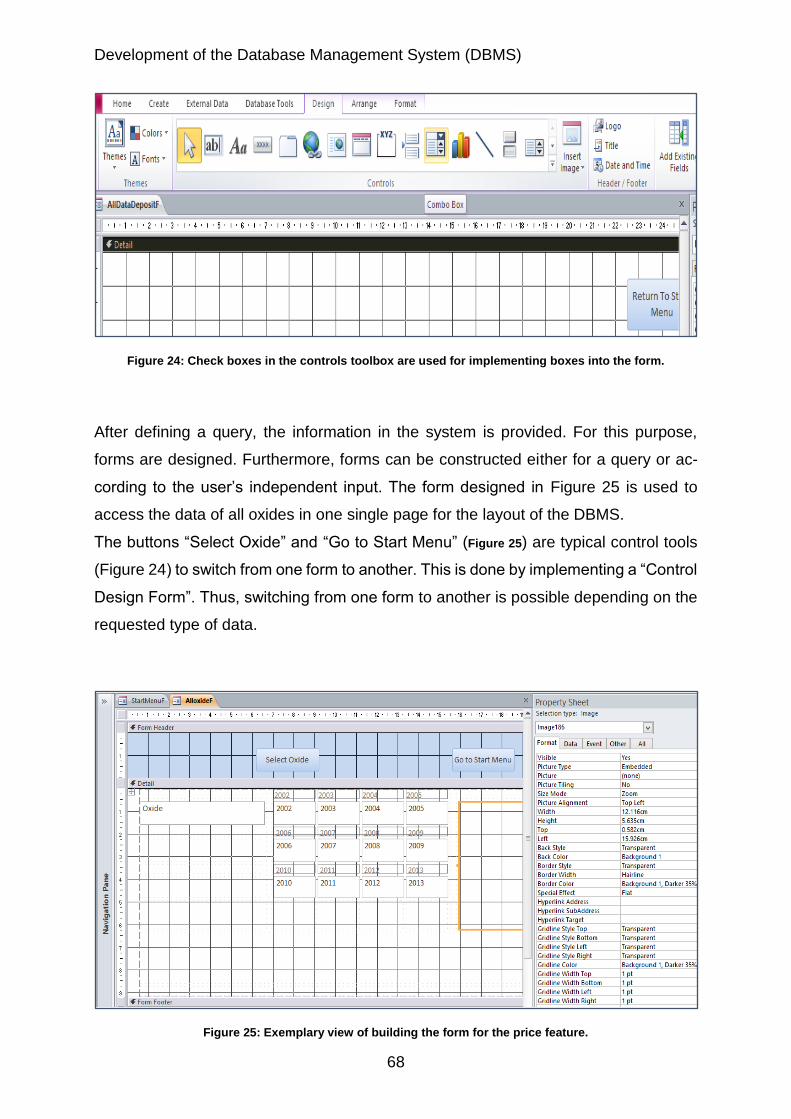
Development of the Database Management System (DBMS)
68
Figure 24: Check boxes in the controls toolbox are used for implementing boxes into the form.
After defining a query, the information in the system is provided. For this purpose,
forms are designed. Furthermore, forms can be constructed either for a query or ac-
cording to the user’s independent input. The form designed in Figure 25 is used to
access the data of all oxides in one single page for the layout of the DBMS.
The buttons “Select Oxide” and “Go to Start Menu” (Figure 25) are typical control tools
(Figure 24) to switch from one form to another. This is done by implementing a “Control
Design Form”. Thus, switching from one form to another is possible depending on the
requested type of data.
Figure 25: Exemplary view of building the form for the price feature.
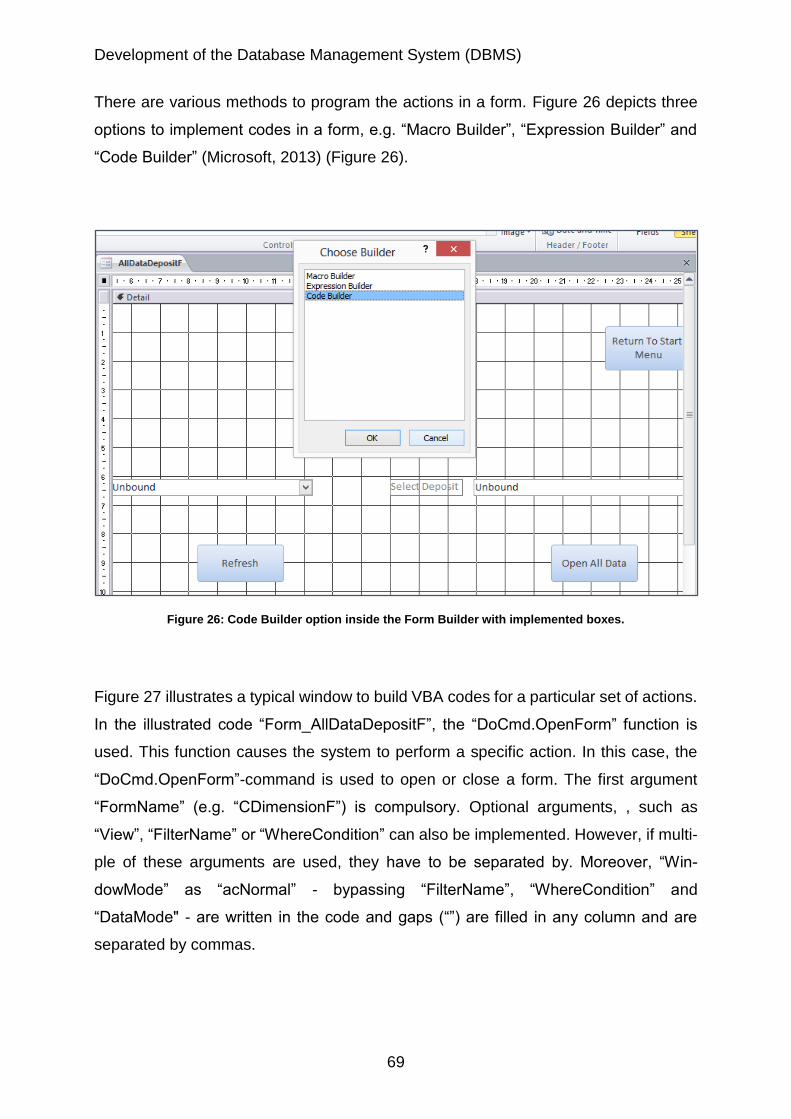
Development of the Database Management System (DBMS)
69
There are various methods to program the actions in a form. Figure 26 depicts three
options to implement codes in a form, e.g. “Macro Builder”, “Expression Builder” and
“Code Builder” (Microsoft, 2013) (Figure 26).
Figure 26: Code Builder option inside the Form Builder with implemented boxes.
Figure 27 illustrates a typical window to build VBA codes for a particular set of actions.
In the illustrated code “Form_AllDataDepositF”, the “DoCmd.OpenForm” function is
used. This function causes the system to perform a specific action. In this case, the
“DoCmd.OpenForm”-command is used to open or close a form. The first argument
“FormName” (e.g. “CDimensionF”) is compulsory. Optional arguments, , such as
“View”, “FilterName” or “WhereCondition” can also be implemented. However, if multi-
ple of these arguments are used, they have to be separated by. Moreover, “Win-
dowMode” as “acNormal” - bypassing “FilterName”, “WhereCondition” and
“DataMode" - are written in the code and gaps (“”) are filled in any column and are
separated by commas.
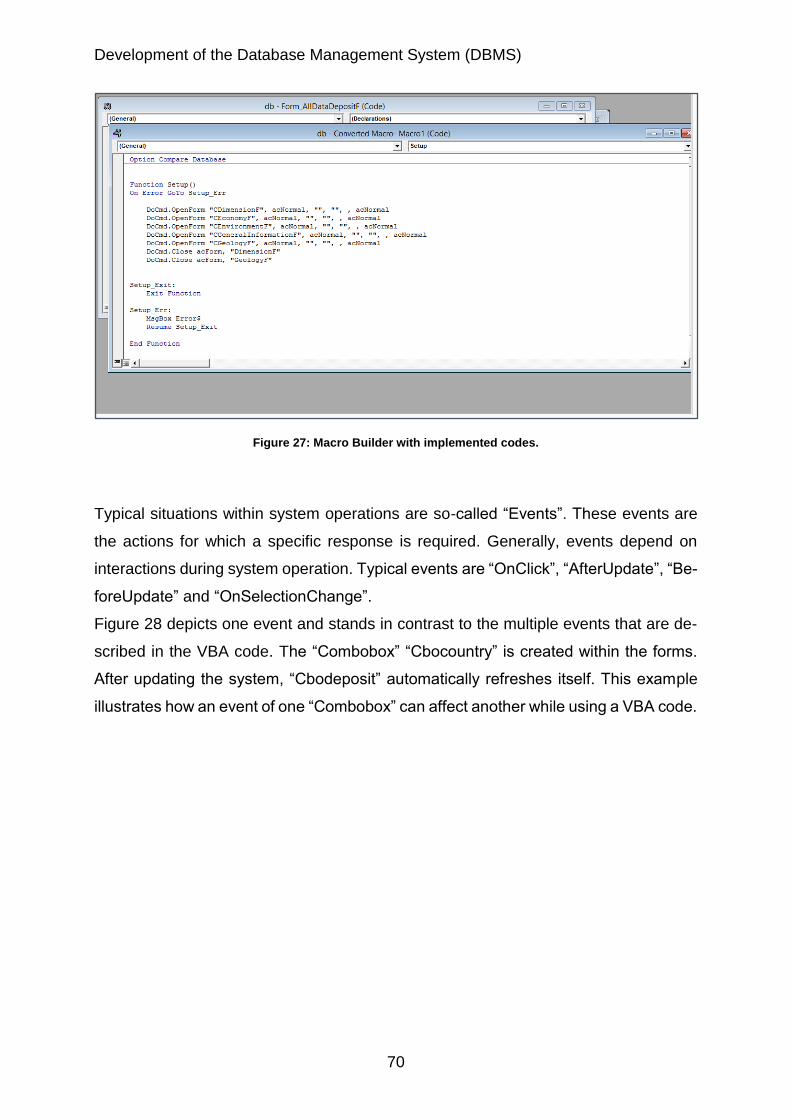
Development of the Database Management System (DBMS)
70
Figure 27: Macro Builder with implemented codes.
Typical situations within system operations are so-called “Events”. These events are
the actions for which a specific response is required. Generally, events depend on
interactions during system operation. Typical events are “OnClick”, “AfterUpdate”, “Be-
foreUpdate” and “OnSelectionChange”.
Figure 28 depicts one event and stands in contrast to the multiple events that are de-
scribed in the VBA code. The “Combobox” “Cbocountry” is created within the forms.
After updating the system, “Cbodeposit” automatically refreshes itself. This example
illustrates how an event of one “Combobox” can affect another while using a VBA code.
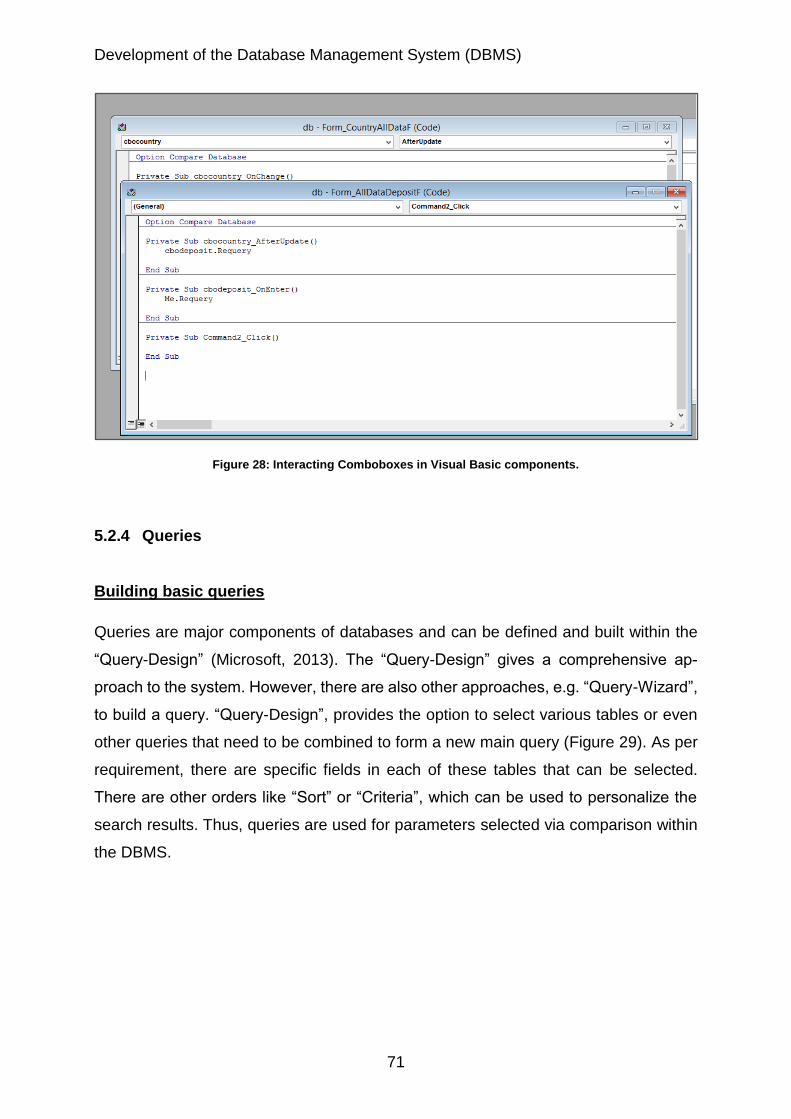
Development of the Database Management System (DBMS)
71
Figure 28: Interacting Comboboxes in Visual Basic components.
5.2.4 Queries
Building basic queries
Queries are major components of databases and can be defined and built within the
“Query-Design” (Microsoft, 2013). The “Query-Design” gives a comprehensive ap-
proach to the system. However, there are also other approaches, e.g. “Query-Wizard”,
to build a query. “Query-Design”, provides the option to select various tables or even
other queries that need to be combined to form a new main query (Figure 29). As per
requirement, there are specific fields in each of these tables that can be selected.
There are other orders like “Sort” or “Criteria”, which can be used to personalize the
search results. Thus, queries are used for parameters selected via comparison within
the DBMS.
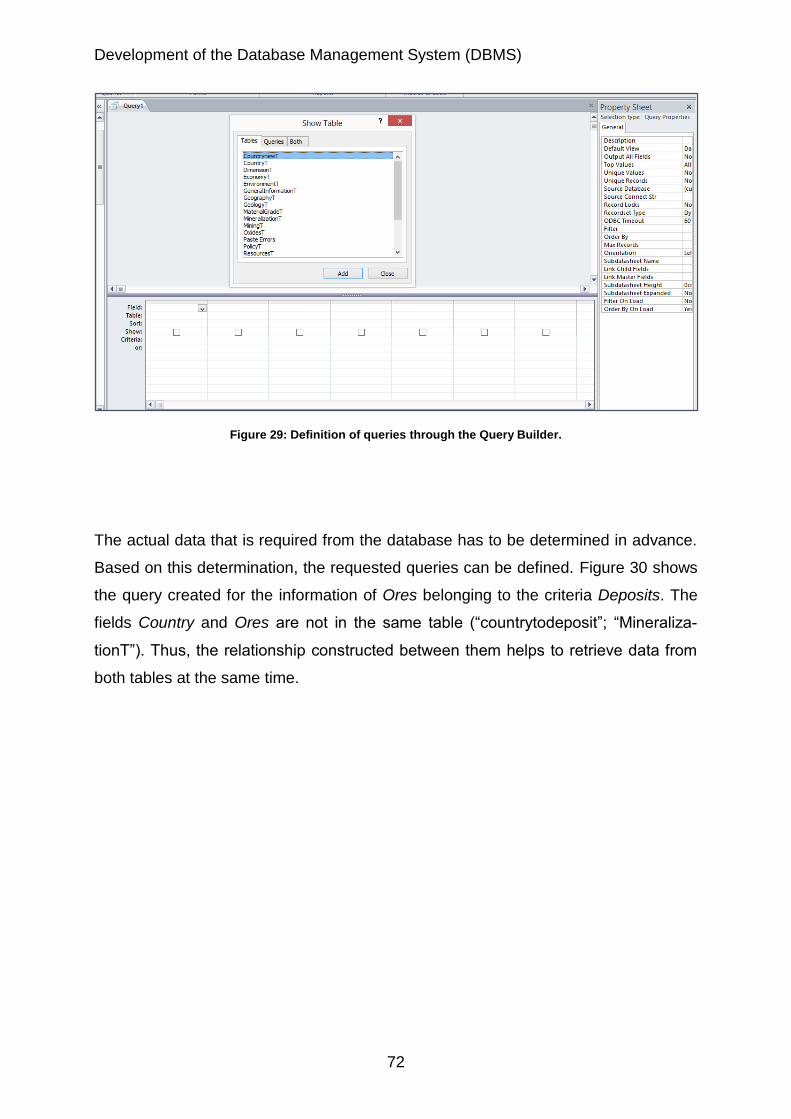
Development of the Database Management System (DBMS)
72
Figure 29: Definition of queries through the Query Builder.
The actual data that is required from the database has to be determined in advance.
Based on this determination, the requested queries can be defined. Figure 30 shows
the query created for the information of Ores belonging to the criteria Deposits. The
fields Country and Ores are not in the same table (“countrytodeposit”; “Mineraliza-
tionT”). Thus, the relationship constructed between them helps to retrieve data from
both tables at the same time.
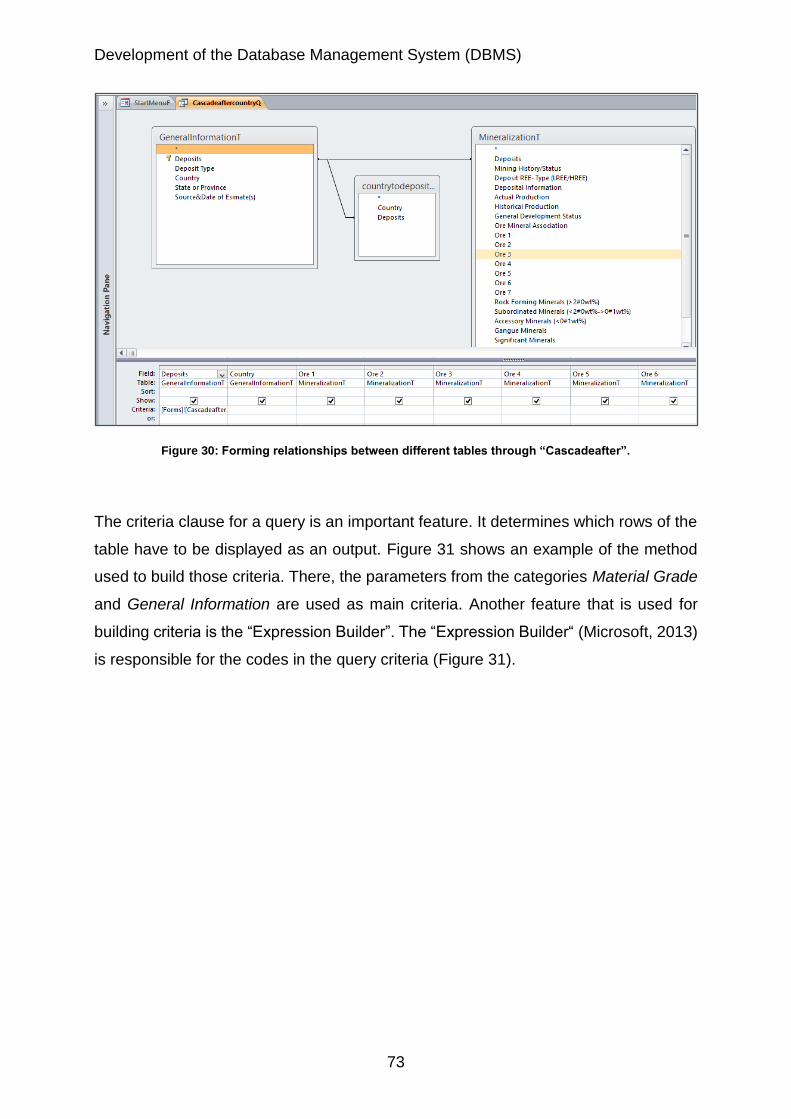
Development of the Database Management System (DBMS)
73
Figure 30: Forming relationships between different tables through “Cascadeafter”.
The criteria clause for a query is an important feature. It determines which rows of the
table have to be displayed as an output. Figure 31 shows an example of the method
used to build those criteria. There, the parameters from the categories Material Grade
and General Information are used as main criteria. Another feature that is used for
building criteria is the “Expression Builder”. The “Expression Builder“ (Microsoft, 2013)
is responsible for the codes in the query criteria (Figure 31).
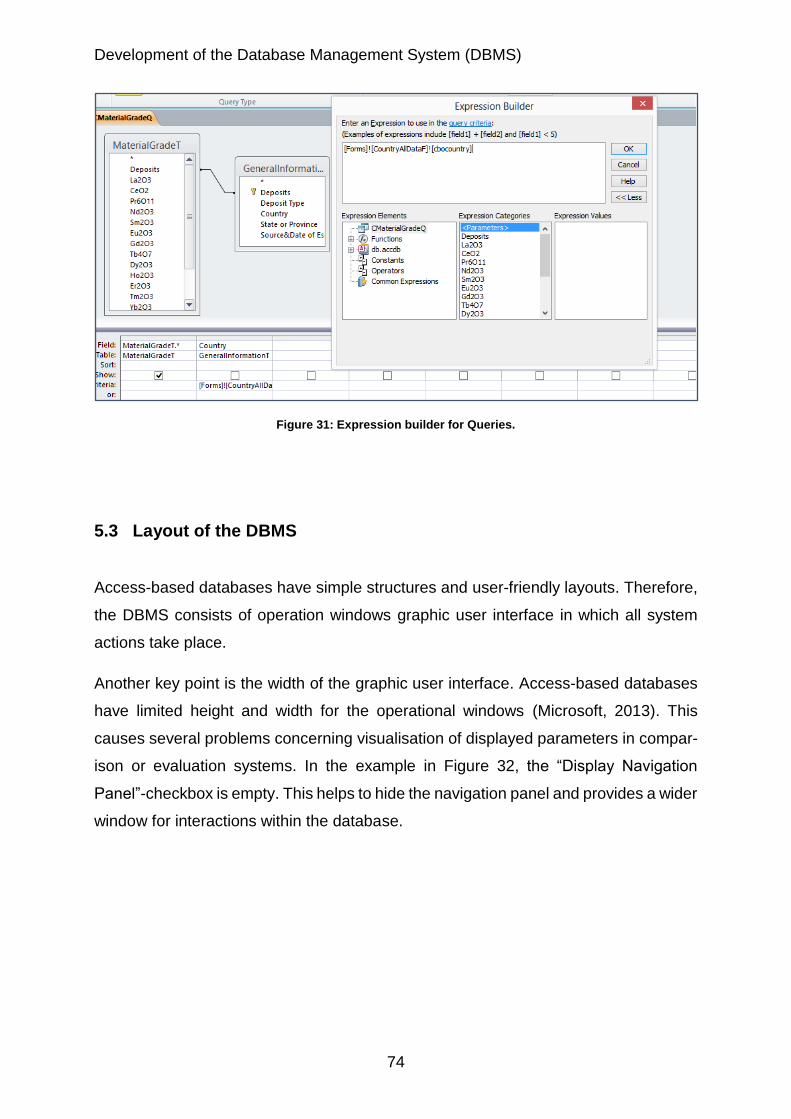
Development of the Database Management System (DBMS)
74
Figure 31: Expression builder for Queries.
5.3 Layout of the DBMS
Access-based databases have simple structures and user-friendly layouts. Therefore,
the DBMS consists of operation windows graphic user interface in which all system
actions take place.
Another key point is the width of the graphic user interface. Access-based databases
have limited height and width for the operational windows (Microsoft, 2013). This
causes several problems concerning visualisation of displayed parameters in compar-
ison or evaluation systems. In the example in Figure 32, the “Display Navigation
Panel”-checkbox is empty. This helps to hide the navigation panel and provides a wider
window for interactions within the database.
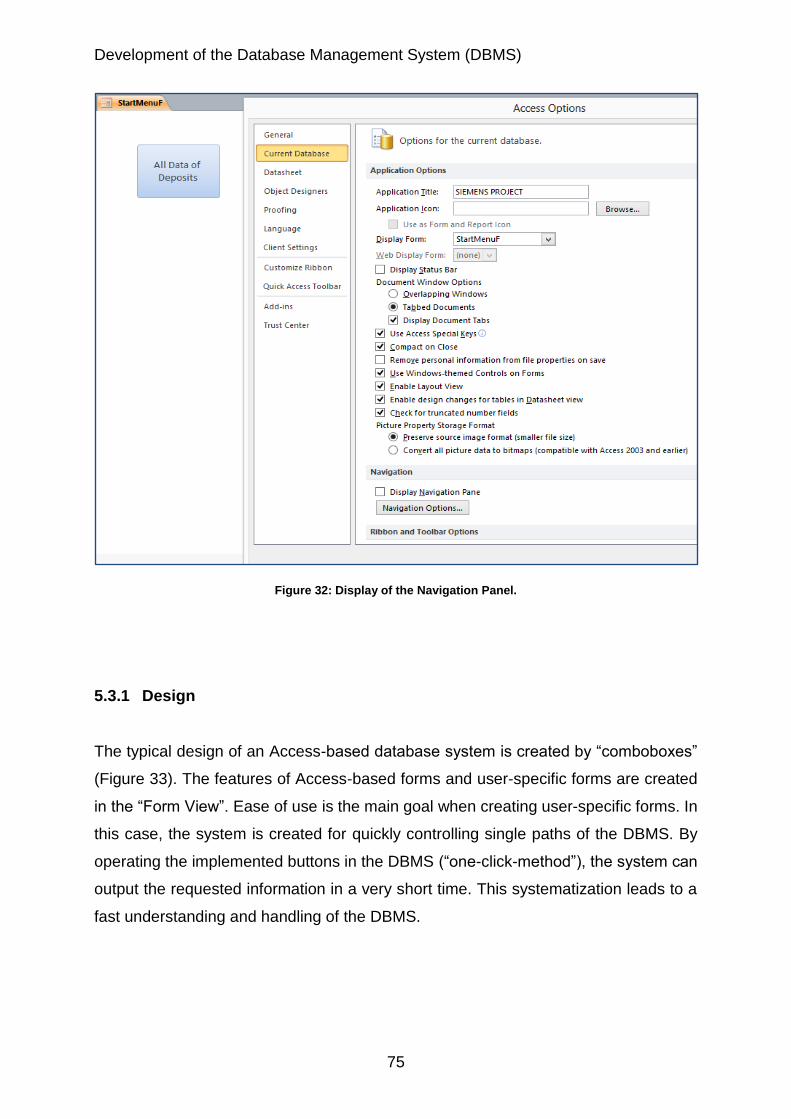
Development of the Database Management System (DBMS)
75
Figure 32: Display of the Navigation Panel.
5.3.1 Design
The typical design of an Access-based database system is created by “comboboxes”
(Figure 33). The features of Access-based forms and user-specific forms are created
in the “Form View”. Ease of use is the main goal when creating user-specific forms. In
this case, the system is created for quickly controlling single paths of the DBMS. By
operating the implemented buttons in the DBMS (“one-click-method”), the system can
output the requested information in a very short time. This systematization leads to a
fast understanding and handling of the DBMS.
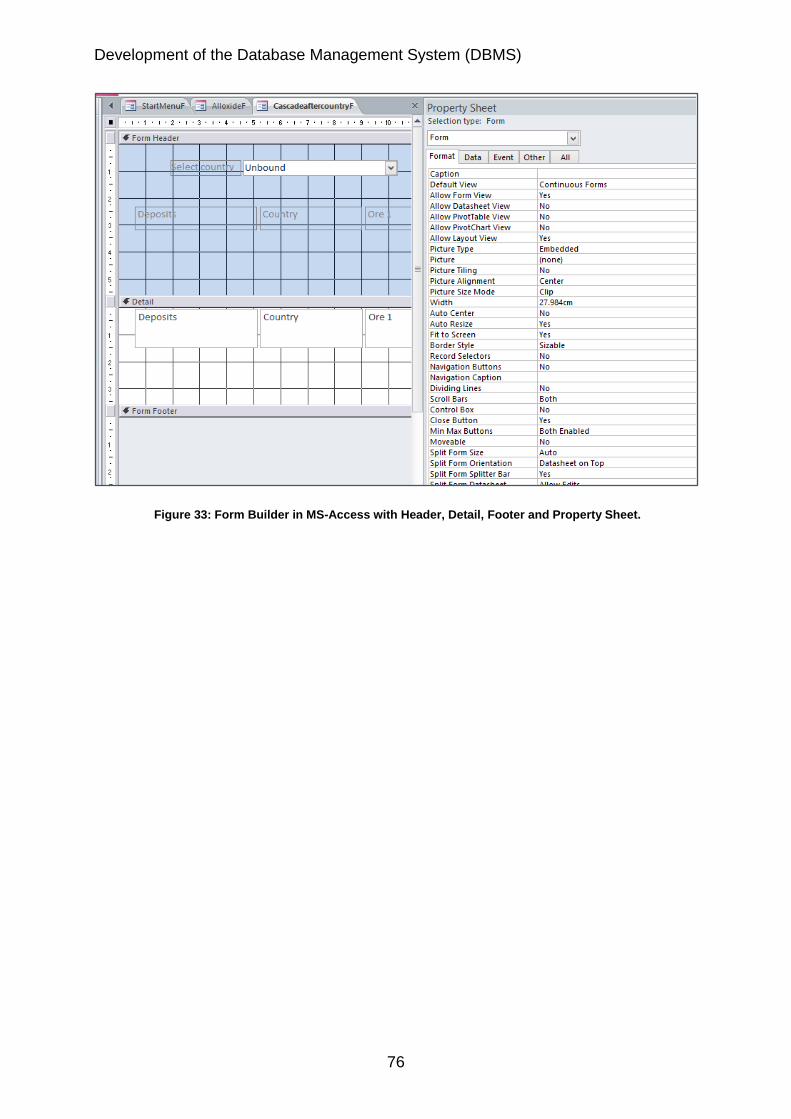
Development of the Database Management System (DBMS)
76
Figure 33: Form Builder in MS-Access with Header, Detail, Footer and Property Sheet.
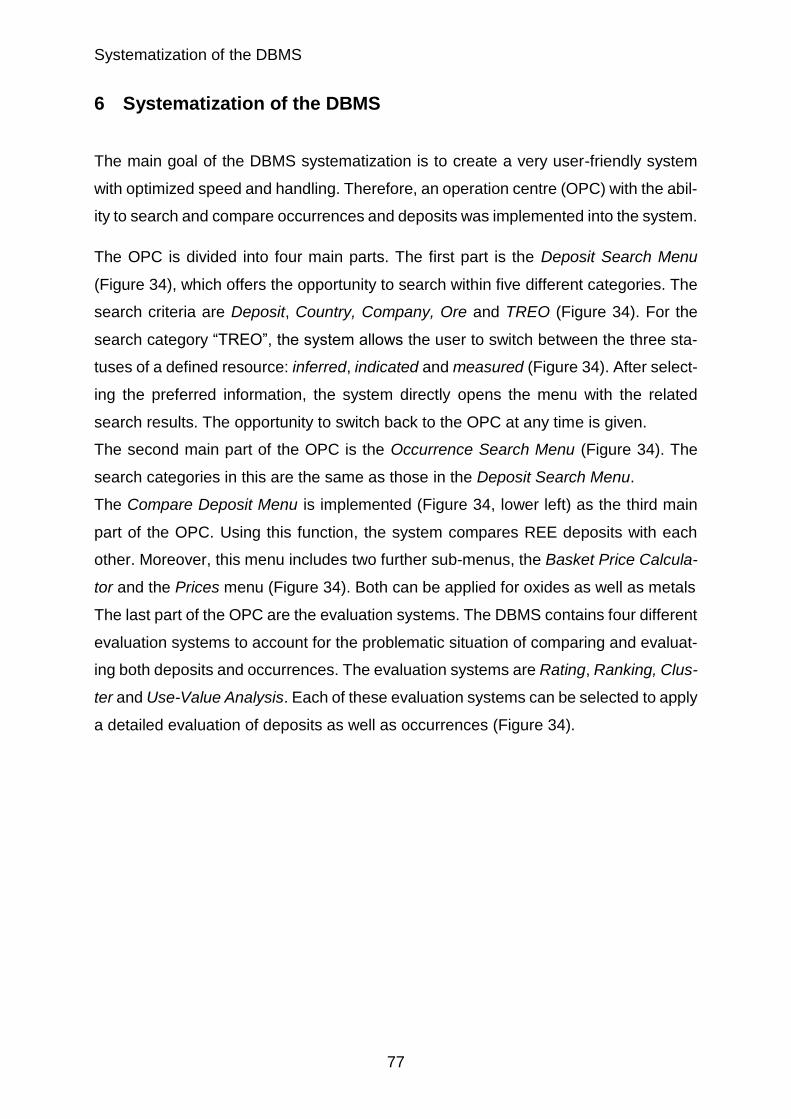
Systematization of the DBMS
77
6 Systematization of the DBMS
The main goal of the DBMS systematization is to create a very user-friendly system
with optimized speed and handling. Therefore, an operation centre (OPC) with the abil-
ity to search and compare occurrences and deposits was implemented into the system.
The OPC is divided into four main parts. The first part is the Deposit Search Menu
(Figure 34), which offers the opportunity to search within five different categories. The
search criteria are Deposit, Country, Company, Ore and TREO (Figure 34). For the
search category “TREO”, the system allows the user to switch between the three sta-
tuses of a defined resource: inferred, indicated and measured (Figure 34). After select-
ing the preferred information, the system directly opens the menu with the related
search results. The opportunity to switch back to the OPC at any time is given.
The second main part of the OPC is the Occurrence Search Menu (Figure 34). The
search categories in this are the same as those in the Deposit Search Menu.
The Compare Deposit Menu is implemented (Figure 34, lower left) as the third main
part of the OPC. Using this function, the system compares REE deposits with each
other. Moreover, this menu includes two further sub-menus, the Basket Price Calcula-
tor and the Prices menu (Figure 34). Both can be applied for oxides as well as metals
The last part of the OPC are the evaluation systems. The DBMS contains four different
evaluation systems to account for the problematic situation of comparing and evaluat-
ing both deposits and occurrences. The evaluation systems are Rating, Ranking, Clus-
ter and Use-Value Analysis. Each of these evaluation systems can be selected to apply
a detailed evaluation of deposits as well as occurrences (Figure 34).
Systematization of the DBMS
78
Figure 34: Operation centre of the DBMS.
6.1 Search Systems
The main categories of the Search Systems are one essential part of the DBMS. There,
a search for any occurrence or deposit can be undertaken. Both systems (Deposit &
Occurrence Search) get the request via the input of a specific feature, e.g. Deposit,
Country, Company or Ore. Furthermore, for the Deposit Search, it is possible to search
within three categories or statuses of the TREO tonnage for the deposits in the DBMS.
To perform such a search, values can be entered – specifically ranges – for the in-
ferred, indicated and measured resource category. Using the Search button (Figure
34), activates the next sub-menu, which is the direct Search Menu.
In this system, any information on the selected deposits will be displayed. Then, it is
possible to switch between the eight main columns, e.g. General Information, Geogra-
phy, Owner Information, Geology, Mineralization, Material Grade, Economy and Min-
ing (Figure 35). The Search Menu displays all of the 120 parameters. Moreover, it
depicts the complete records of the requested deposits (Figure 35). Finally, the system
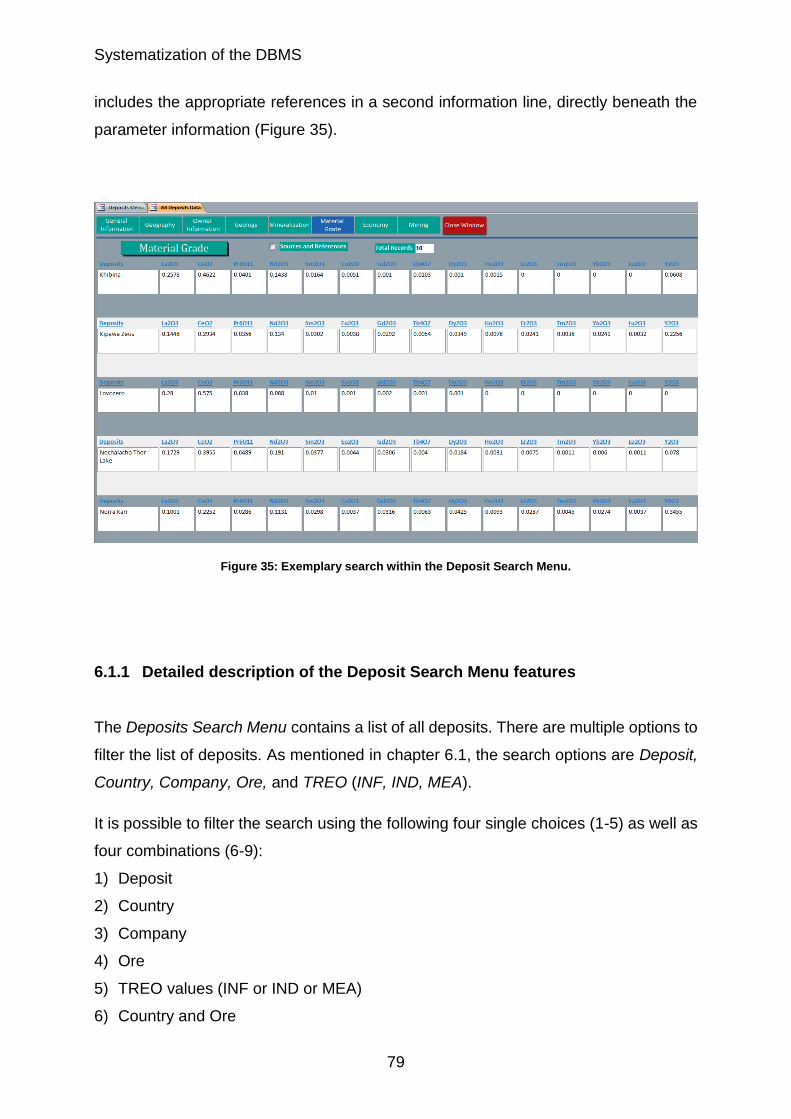
Systematization of the DBMS
79
includes the appropriate references in a second information line, directly beneath the
parameter information (Figure 35).
Figure 35: Exemplary search within the Deposit Search Menu.
6.1.1 Detailed description of the Deposit Search Menu features
The Deposits Search Menu contains a list of all deposits. There are multiple options to
filter the list of deposits. As mentioned in chapter 6.1, the search options are Deposit,
Country, Company, Ore, and TREO (INF, IND, MEA).
It is possible to filter the search using the following four single choices (1-5) as well as
four combinations (6-9):
1) Deposit
2) Country
3) Company
4) Ore
5) TREO values (INF or IND or MEA)
6) Country and Ore
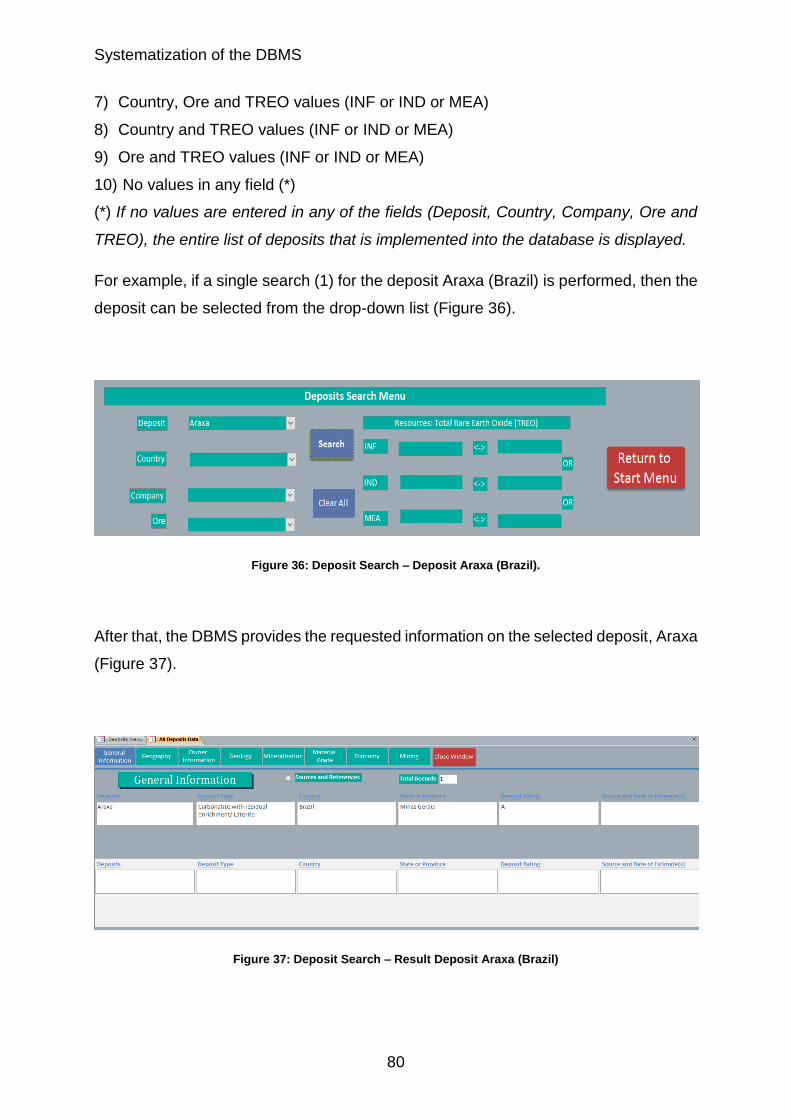
Systematization of the DBMS
80
7) Country, Ore and TREO values (INF or IND or MEA)
8) Country and TREO values (INF or IND or MEA)
9) Ore and TREO values (INF or IND or MEA)
10) No values in any field (*)
(*) If no values are entered in any of the fields (Deposit, Country, Company, Ore and
TREO), the entire list of deposits that is implemented into the database is displayed.
For example, if a single search (1) for the deposit Araxa (Brazil) is performed, then the
deposit can be selected from the drop-down list (Figure 36).
Figure 36: Deposit Search – Deposit Araxa (Brazil).
After that, the DBMS provides the requested information on the selected deposit, Araxa
(Figure 37).
Figure 37: Deposit Search – Result Deposit Araxa (Brazil)
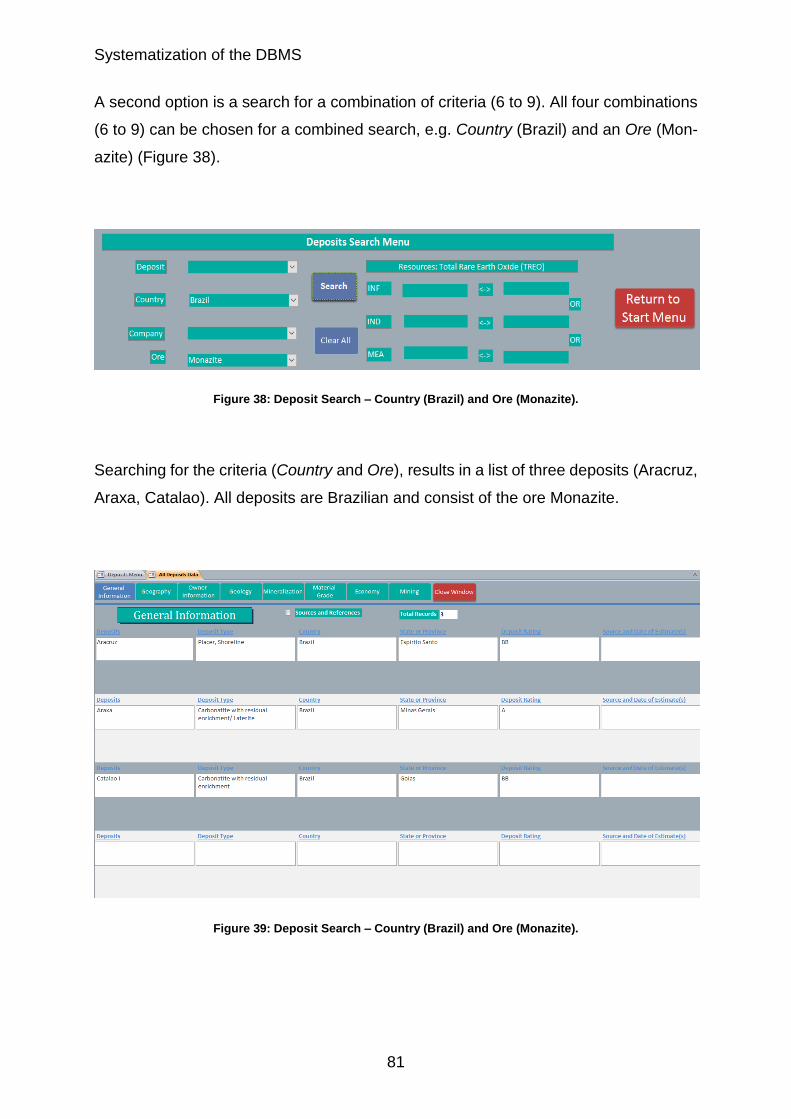
Systematization of the DBMS
81
A second option is a search for a combination of criteria (6 to 9). All four combinations
(6 to 9) can be chosen for a combined search, e.g. Country (Brazil) and an Ore (Mon-
azite) (Figure 38).
Figure 38: Deposit Search – Country (Brazil) and Ore (Monazite).
Searching for the criteria (Country and Ore), results in a list of three deposits (Aracruz,
Araxa, Catalao). All deposits are Brazilian and consist of the ore Monazite.
Figure 39: Deposit Search – Country (Brazil) and Ore (Monazite).
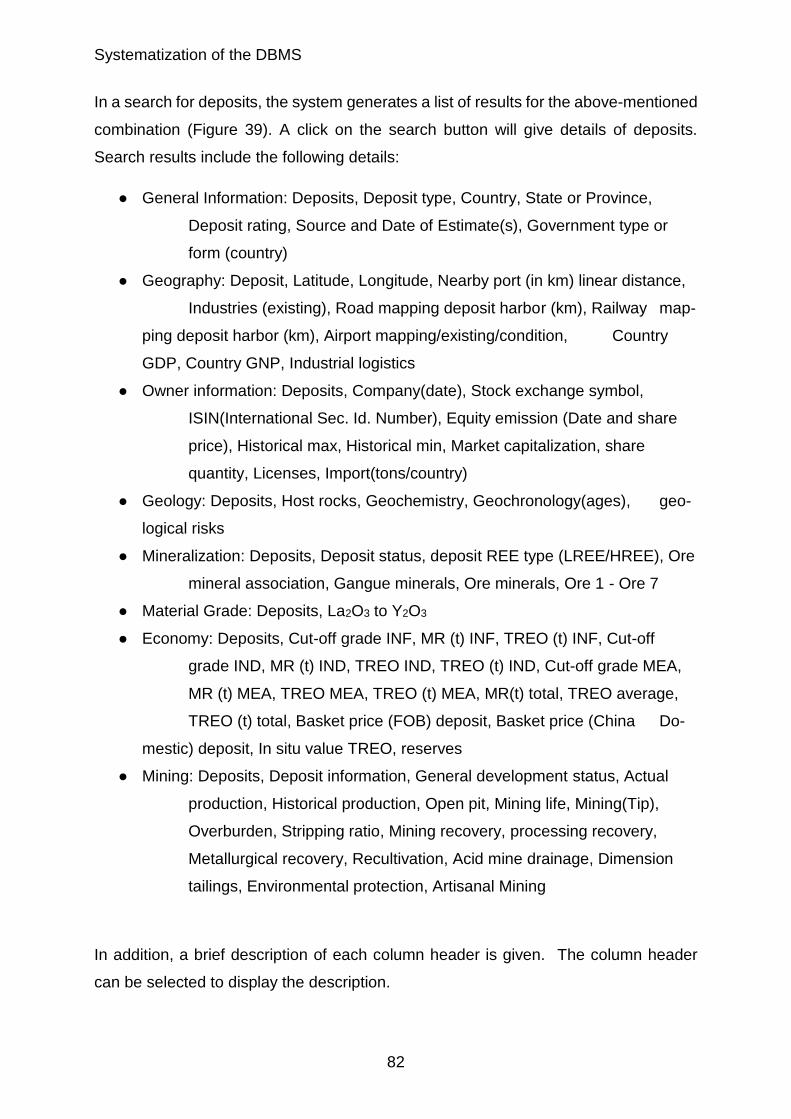
Systematization of the DBMS
82
In a search for deposits, the system generates a list of results for the above-mentioned
combination (Figure 39). A click on the search button will give details of deposits.
Search results include the following details:
● General Information: Deposits, Deposit type, Country, State or Province,
Deposit rating, Source and Date of Estimate(s), Government type or
form (country)
● Geography: Deposit, Latitude, Longitude, Nearby port (in km) linear distance,
Industries (existing), Road mapping deposit harbor (km), Railway map-
ping deposit harbor (km), Airport mapping/existing/condition, Country
GDP, Country GNP, Industrial logistics
● Owner information: Deposits, Company(date), Stock exchange symbol,
ISIN(International Sec. Id. Number), Equity emission (Date and share
price), Historical max, Historical min, Market capitalization, share
quantity, Licenses, Import(tons/country)
● Geology: Deposits, Host rocks, Geochemistry, Geochronology(ages), geo-
logical risks
● Mineralization: Deposits, Deposit status, deposit REE type (LREE/HREE), Ore
mineral association, Gangue minerals, Ore minerals, Ore 1 - Ore 7
● Material Grade: Deposits, La2O3 to Y2O3
● Economy: Deposits, Cut-off grade INF, MR (t) INF, TREO (t) INF, Cut-off
grade IND, MR (t) IND, TREO IND, TREO (t) IND, Cut-off grade MEA,
MR (t) MEA, TREO MEA, TREO (t) MEA, MR(t) total, TREO average,
TREO (t) total, Basket price (FOB) deposit, Basket price (China Do-
mestic) deposit, In situ value TREO, reserves
● Mining: Deposits, Deposit information, General development status, Actual
production, Historical production, Open pit, Mining life, Mining(Tip),
Overburden, Stripping ratio, Mining recovery, processing recovery,
Metallurgical recovery, Recultivation, Acid mine drainage, Dimension
tailings, Environmental protection, Artisanal Mining
In addition, a brief description of each column header is given. The column header
can be selected to display the description.
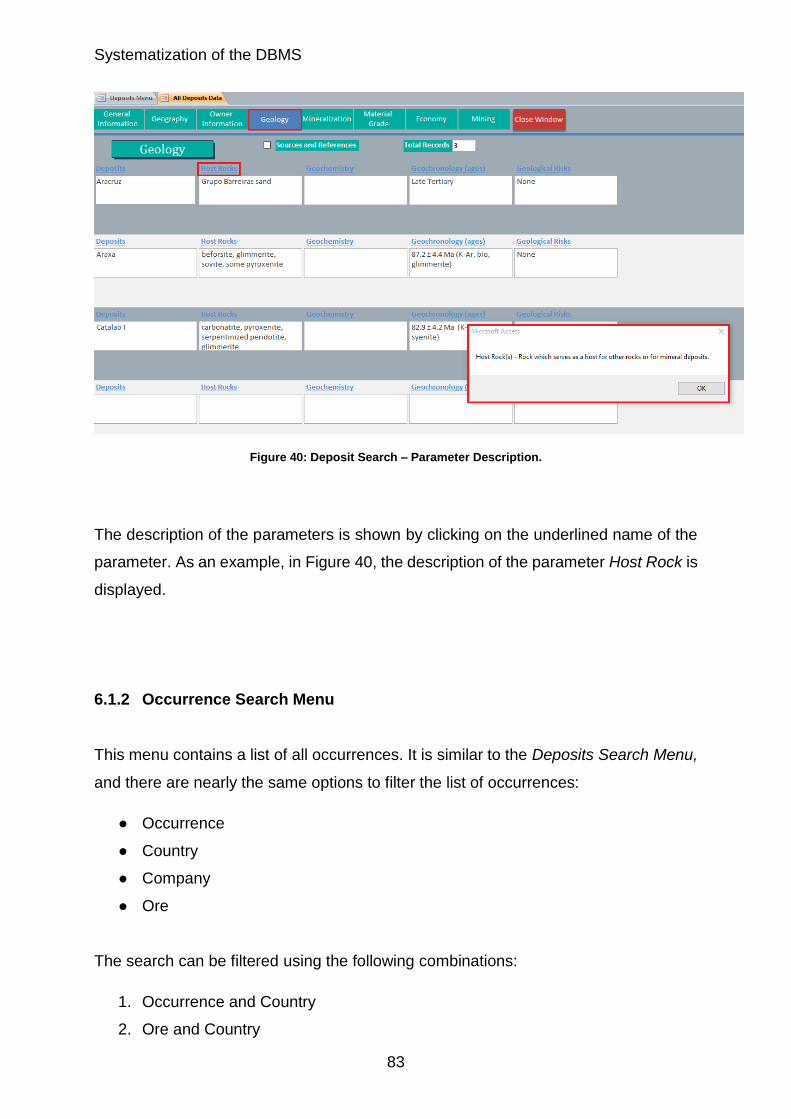
Systematization of the DBMS
83
Figure 40: Deposit Search – Parameter Description.
The description of the parameters is shown by clicking on the underlined name of the
parameter. As an example, in Figure 40, the description of the parameter Host Rock is
displayed.
6.1.2 Occurrence Search Menu
This menu contains a list of all occurrences. It is similar to the Deposits Search Menu,
and there are nearly the same options to filter the list of occurrences:
● Occurrence
● Country
● Company
● Ore
The search can be filtered using the following combinations:
1. Occurrence and Country
2. Ore and Country
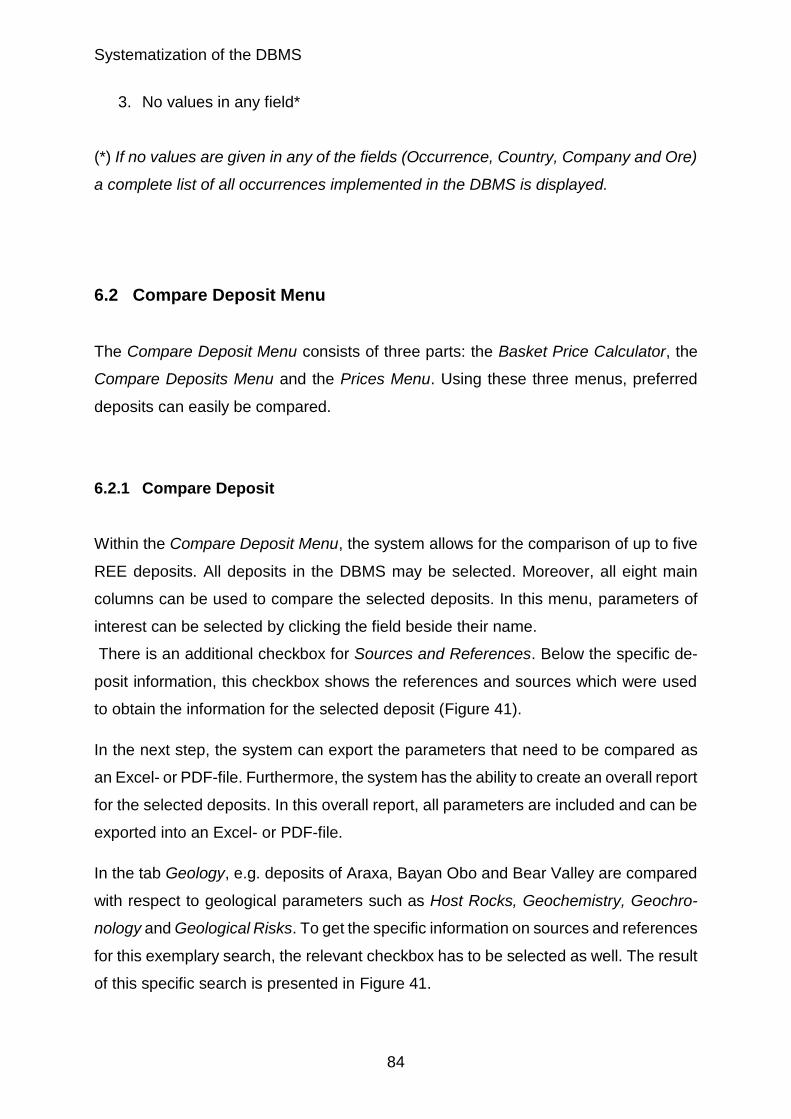
Systematization of the DBMS
84
3. No values in any field*
(*) If no values are given in any of the fields (Occurrence, Country, Company and Ore)
a complete list of all occurrences implemented in the DBMS is displayed.
6.2 Compare Deposit Menu
The Compare Deposit Menu consists of three parts: the Basket Price Calculator, the
Compare Deposits Menu and the Prices Menu. Using these three menus, preferred
deposits can easily be compared.
6.2.1 Compare Deposit
Within the Compare Deposit Menu, the system allows for the comparison of up to five
REE deposits. All deposits in the DBMS may be selected. Moreover, all eight main
columns can be used to compare the selected deposits. In this menu, parameters of
interest can be selected by clicking the field beside their name.
There is an additional checkbox for Sources and References. Below the specific de-
posit information, this checkbox shows the references and sources which were used
to obtain the information for the selected deposit (Figure 41).
In the next step, the system can export the parameters that need to be compared as
an Excel- or PDF-file. Furthermore, the system has the ability to create an overall report
for the selected deposits. In this overall report, all parameters are included and can be
exported into an Excel- or PDF-file.
In the tab Geology, e.g. deposits of Araxa, Bayan Obo and Bear Valley are compared
with respect to geological parameters such as Host Rocks, Geochemistry, Geochro-
nology and Geological Risks. To get the specific information on sources and references
for this exemplary search, the relevant checkbox has to be selected as well. The result
of this specific search is presented in Figure 41.
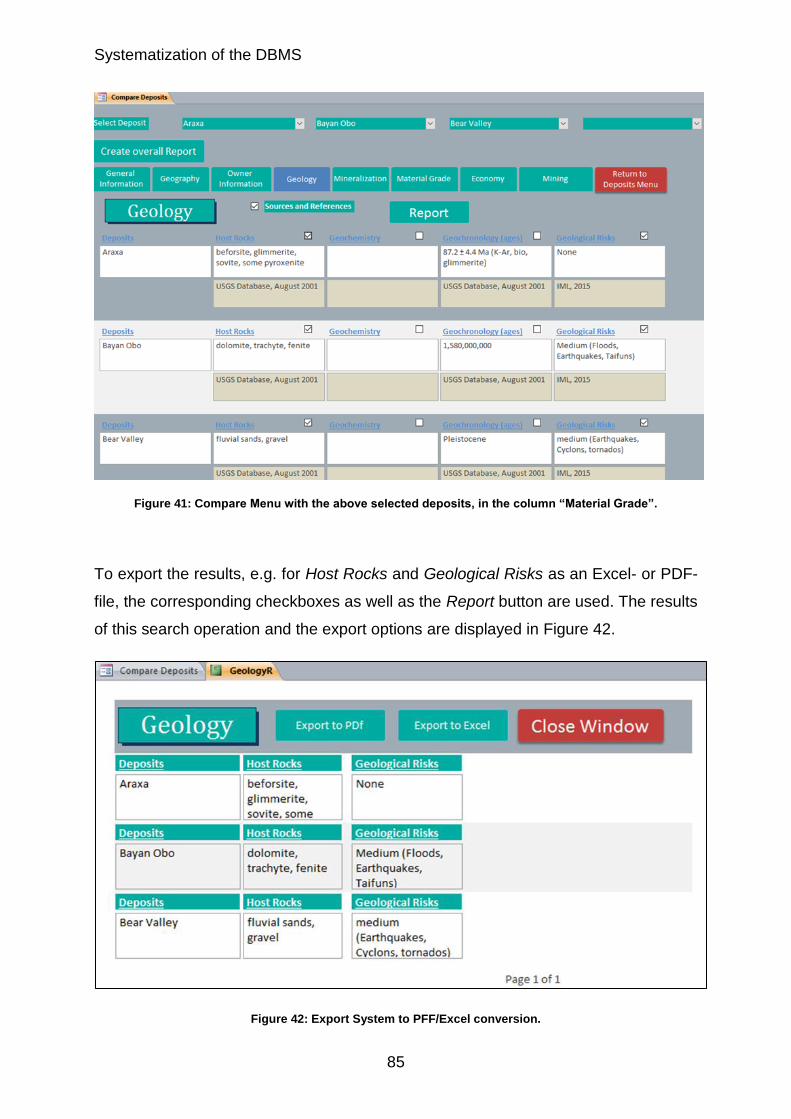
Systematization of the DBMS
85
Figure 41: Compare Menu with the above selected deposits, in the column “Material Grade”.
To export the results, e.g. for Host Rocks and Geological Risks as an Excel- or PDF-
file, the corresponding checkboxes as well as the Report button are used. The results
of this search operation and the export options are displayed in Figure 42.
Figure 42: Export System to PFF/Excel conversion.
Systematization of the DBMS
86
6.2.2 Dynamic Basket Price Calculator
The Basket Price Calculator is a dynamic feature of the DBMS designed to calculate
the Basket Price of a deposit for any year from 2002 to 2015. This feature can also be
used for newly inserted data. It includes two options:
● China Domestic Basket Price Calculator
● FOB Basket Price Calculator
Both options have three timeframes: Yearly, Monthly and Daily Basket Price Calcula-
tor.
If one of the options Yearly, Monthly or Daily is chosen, a new window appears in which
the Basket Price calculation for the selected option is shown (Figure 43). There are
two input options, Deposit and Year (Figure 43). Both options must be filled in to cal-
culate the Basket Price (Figure 43). Using the drop-down list, a deposit for which the
price should be calculated is selected. To complete the calculation, the year must be
selected from a drop down list as well. The system can calculate prices from 2002 to
2015. After selecting a year, the prices of oxides in that year are presented. For exam-
ple, if the year 2015 is selected, it will be shown that the price of La2O3 was 3.2 US-
$/kg in 2015 (Figure 43). The list of oxides for which the prices are displayed for each
year is as follows:
● La2O3
● CeO2
● Pr6O11
● Nd2O3
● Sm2O3
● Eu2O3
● Tb4O7
● Dy2O3
● Y2O3
● Gd2O3 (only available for FOB)
Gd2O3 (partial), Ho2O3, Er2O3, Tm2O3, Yb2O3, and Lu2O3 are excluded due to no
available price data in the China Domestic market.
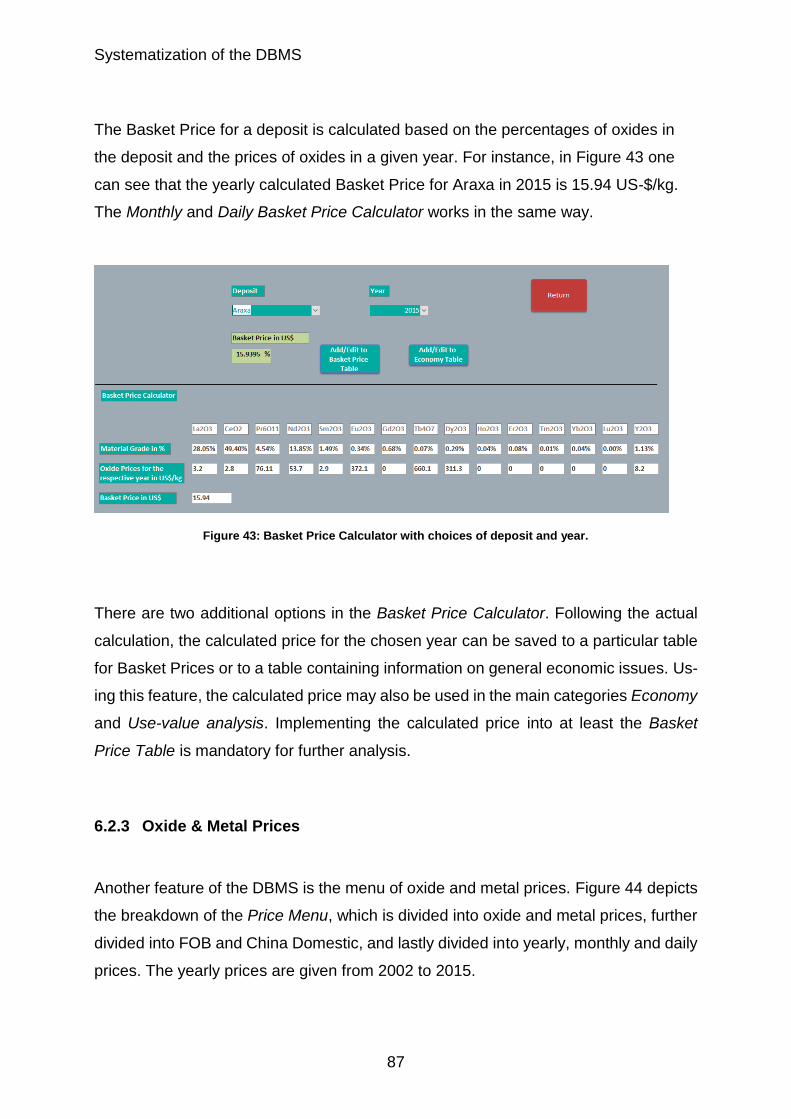
Systematization of the DBMS
87
The Basket Price for a deposit is calculated based on the percentages of oxides in
the deposit and the prices of oxides in a given year. For instance, in Figure 43 one
can see that the yearly calculated Basket Price for Araxa in 2015 is 15.94 US-$/kg.
The Monthly and Daily Basket Price Calculator works in the same way.
Figure 43: Basket Price Calculator with choices of deposit and year.
There are two additional options in the Basket Price Calculator. Following the actual
calculation, the calculated price for the chosen year can be saved to a particular table
for Basket Prices or to a table containing information on general economic issues. Us-
ing this feature, the calculated price may also be used in the main categories Economy
and Use-value analysis. Implementing the calculated price into at least the Basket
Price Table is mandatory for further analysis.
6.2.3 Oxide & Metal Prices
Another feature of the DBMS is the menu of oxide and metal prices. Figure 44 depicts
the breakdown of the Price Menu, which is divided into oxide and metal prices, further
divided into FOB and China Domestic, and lastly divided into yearly, monthly and daily
prices. The yearly prices are given from 2002 to 2015.
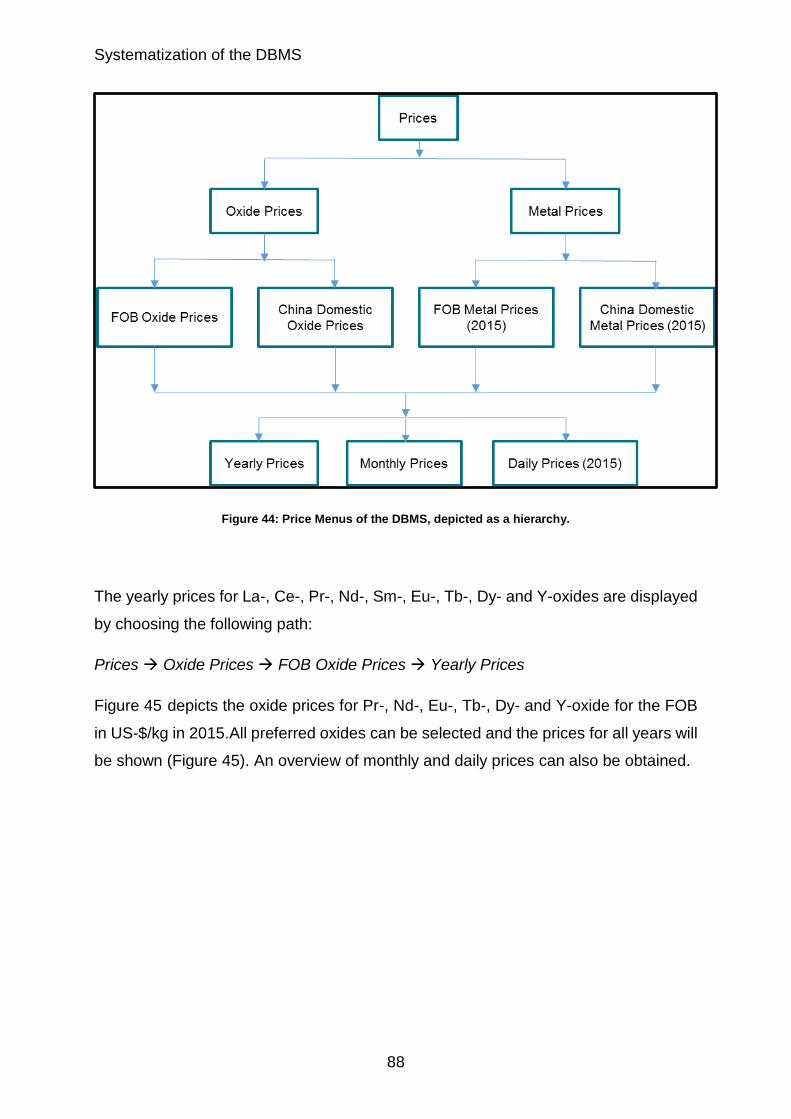
Systematization of the DBMS
88
Figure 44: Price Menus of the DBMS, depicted as a hierarchy.
The yearly prices for La-, Ce-, Pr-, Nd-, Sm-, Eu-, Tb-, Dy- and Y-oxides are displayed
by choosing the following path:
Prices Oxide Prices FOB Oxide Prices Yearly Prices
Figure 45 depicts the oxide prices for Pr-, Nd-, Eu-, Tb-, Dy- and Y-oxide for the FOB
in US-$/kg in 2015.All preferred oxides can be selected and the prices for all years will
be shown (Figure 45). An overview of monthly and daily prices can also be obtained.
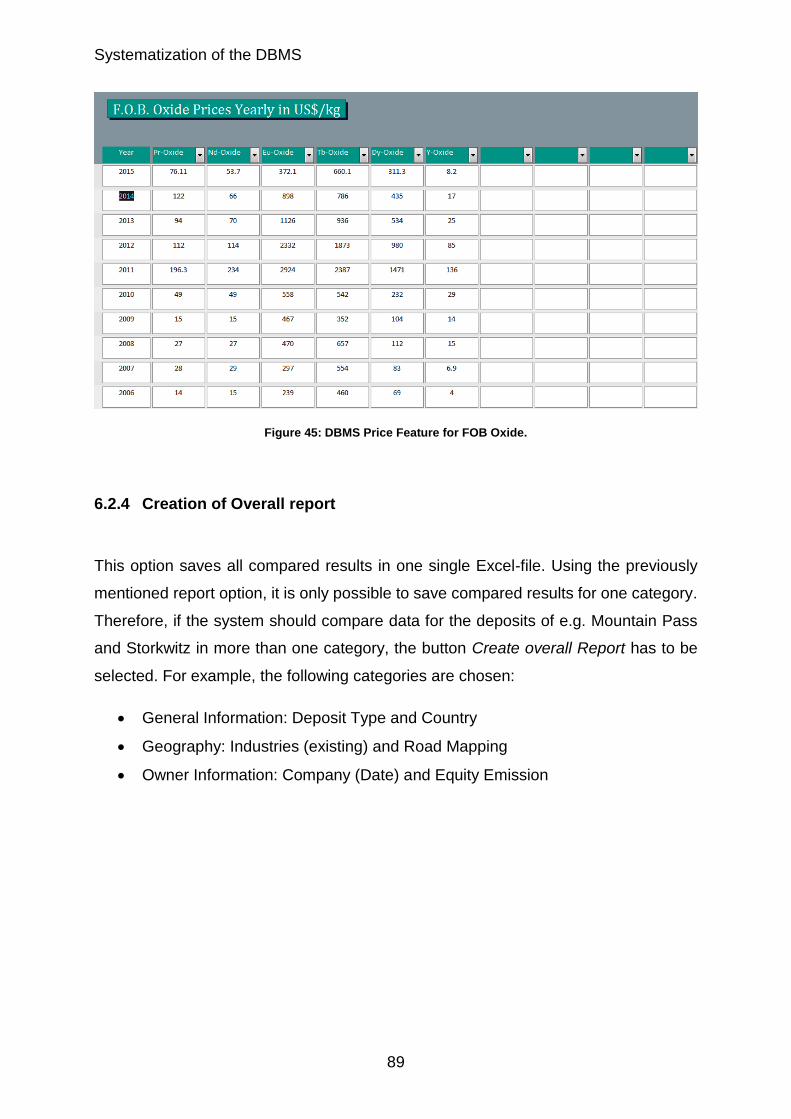
Systematization of the DBMS
89
Figure 45: DBMS Price Feature for FOB Oxide.
6.2.4 Creation of Overall report
This option saves all compared results in one single Excel-file. Using the previously
mentioned report option, it is only possible to save compared results for one category.
Therefore, if the system should compare data for the deposits of e.g. Mountain Pass
and Storkwitz in more than one category, the button Create overall Report has to be
selected. For example, the following categories are chosen:
General Information: Deposit Type and Country
Geography: Industries (existing) and Road Mapping
Owner Information: Company (Date) and Equity Emission
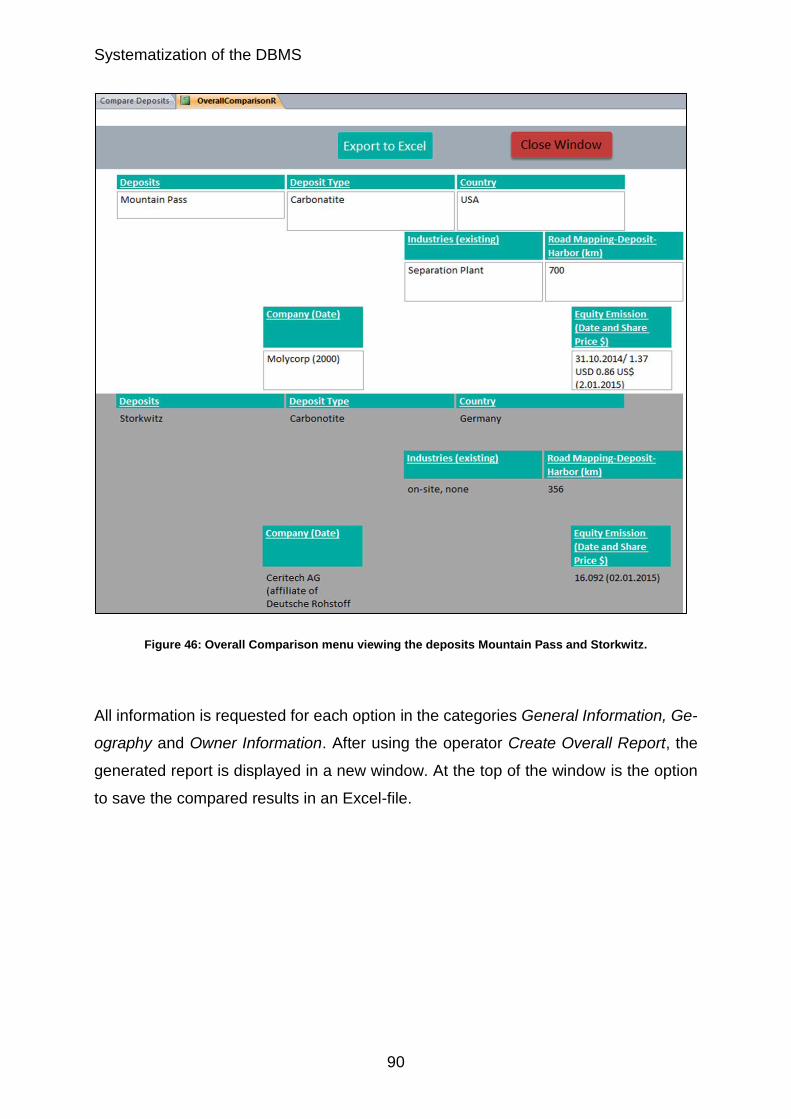
Systematization of the DBMS
90
Figure 46: Overall Comparison menu viewing the deposits Mountain Pass and Storkwitz.
All information is requested for each option in the categories General Information, Ge-
ography and Owner Information. After using the operator Create Overall Report, the
generated report is displayed in a new window. At the top of the window is the option
to save the compared results in an Excel-file.
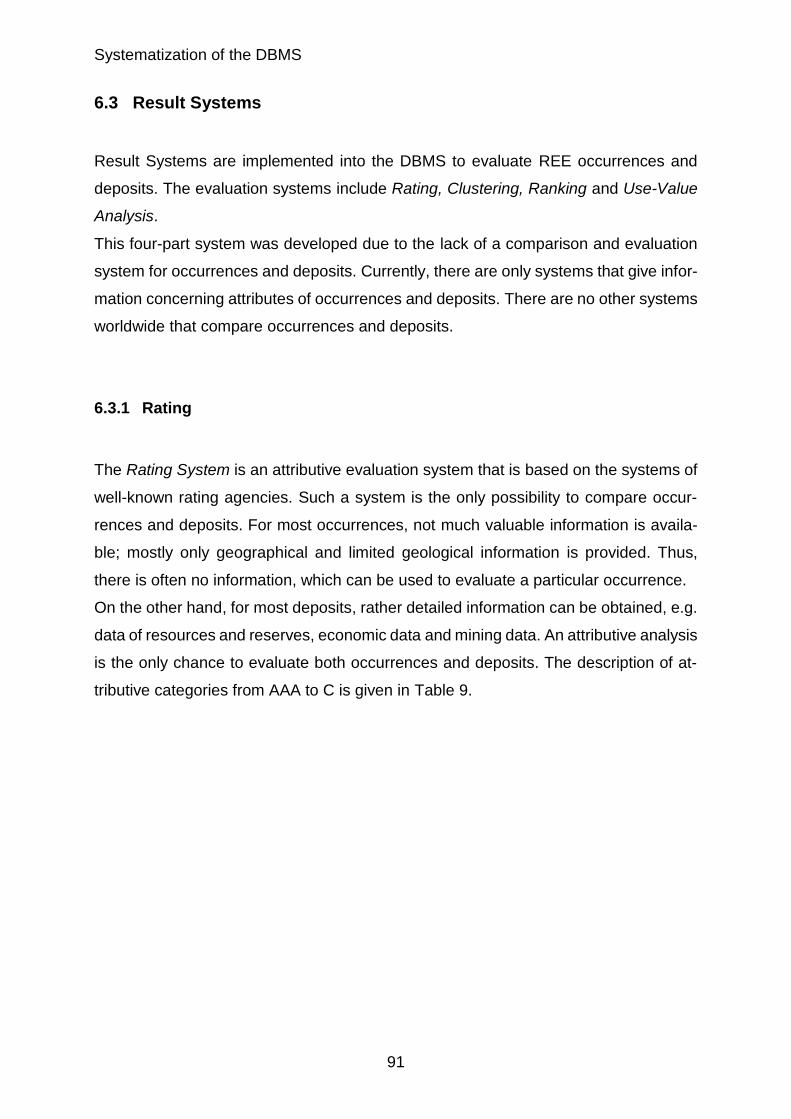
Systematization of the DBMS
91
6.3 Result Systems
Result Systems are implemented into the DBMS to evaluate REE occurrences and
deposits. The evaluation systems include Rating, Clustering, Ranking and Use-Value
Analysis.
This four-part system was developed due to the lack of a comparison and evaluation
system for occurrences and deposits. Currently, there are only systems that give infor-
mation concerning attributes of occurrences and deposits. There are no other systems
worldwide that compare occurrences and deposits.
6.3.1 Rating
The Rating System is an attributive evaluation system that is based on the systems of
well-known rating agencies. Such a system is the only possibility to compare occur-
rences and deposits. For most occurrences, not much valuable information is availa-
ble; mostly only geographical and limited geological information is provided. Thus,
there is often no information, which can be used to evaluate a particular occurrence.
On the other hand, for most deposits, rather detailed information can be obtained, e.g.
data of resources and reserves, economic data and mining data. An attributive analysis
is the only chance to evaluate both occurrences and deposits. The description of at-
tributive categories from AAA to C is given in Table 9.
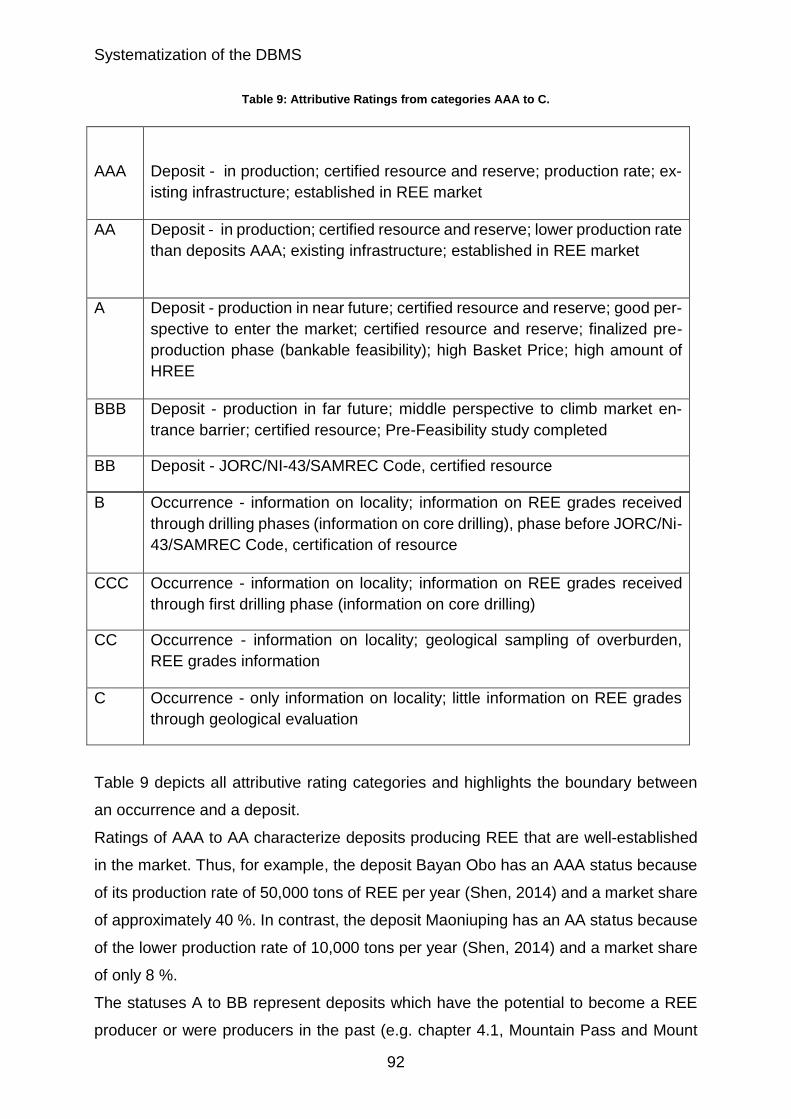
Systematization of the DBMS
92
Table 9: Attributive Ratings from categories AAA to C.
AAA
Deposit - in production; certified resource and reserve; production rate; ex-
isting infrastructure; established in REE market
AA Deposit - in production; certified resource and reserve; lower production rate
than deposits AAA; existing infrastructure; established in REE market
A Deposit - production in near future; certified resource and reserve; good per-
spective to enter the market; certified resource and reserve; finalized pre-
production phase (bankable feasibility); high Basket Price; high amount of
HREE
BBB Deposit - production in far future; middle perspective to climb market en-
trance barrier; certified resource; Pre-Feasibility study completed
BB Deposit - JORC/NI-43/SAMREC Code, certified resource
B Occurrence - information on locality; information on REE grades received
through drilling phases (information on core drilling), phase before JORC/Ni-
43/SAMREC Code, certification of resource
CCC Occurrence - information on locality; information on REE grades received
through first drilling phase (information on core drilling)
CC Occurrence - information on locality; geological sampling of overburden,
REE grades information
C Occurrence - only information on locality; little information on REE grades
through geological evaluation
Table 9 depicts all attributive rating categories and highlights the boundary between
an occurrence and a deposit.
Ratings of AAA to AA characterize deposits producing REE that are well-established
in the market. Thus, for example, the deposit Bayan Obo has an AAA status because
of its production rate of 50,000 tons of REE per year (Shen, 2014) and a market share
of approximately 40 %. In contrast, the deposit Maoniuping has an AA status because
of the lower production rate of 10,000 tons per year (Shen, 2014) and a market share
of only 8 %.
The statuses A to BB represent deposits which have the potential to become a REE
producer or were producers in the past (e.g. chapter 4.1, Mountain Pass and Mount

Systematization of the DBMS
93
Weld). The smallest common denominator in this class is the certification of resource.
Therefore, the boundary for deposits and occurrences is between BB and B. All levels
from B to C, are, per definition, occurrences. They have no certified resource, thus they
are in the beginning phase.
Using the Select View Order option, the deposits can be ordered from highest (AAA)
to lowest (C) or from lowest to highest rating (Figure 47). The results can be filtered to
only show deposits with specific rating using the Show Rating option. The system can
display either a single rating status like AAA or a range like AA to BBB (Figure 47).
Figure 47: Rating system with range of AAA to C and explanations.
This menu also provides the opportunity to generate a report of the rating result by
selecting the Report button.
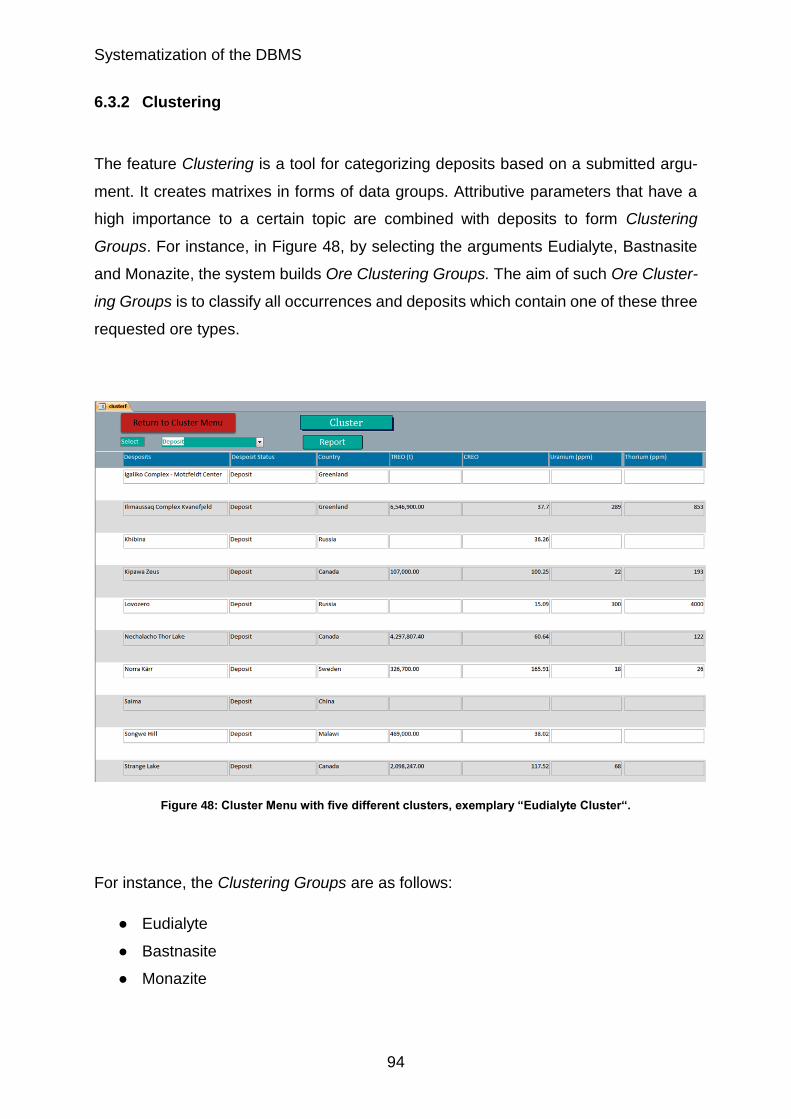
Systematization of the DBMS
94
6.3.2 Clustering
The feature Clustering is a tool for categorizing deposits based on a submitted argu-
ment. It creates matrixes in forms of data groups. Attributive parameters that have a
high importance to a certain topic are combined with deposits to form Clustering
Groups. For instance, in Figure 48, by selecting the arguments Eudialyte, Bastnasite
and Monazite, the system builds Ore Clustering Groups. The aim of such Ore Cluster-
ing Groups is to classify all occurrences and deposits which contain one of these three
requested ore types.
Figure 48: Cluster Menu with five different clusters, exemplary “Eudialyte Cluster“.
For instance, the Clustering Groups are as follows:
● Eudialyte
● Bastnasite
● Monazite
Systematization of the DBMS
95
When one of the three categories is selected, the system will show the list of deposits
and occurrences which contain that argument. In this menu, a field with a Select option
is implemented to decide if only occurrences or deposits, or both shall be selected
(Figure 48).
6.3.3 Ranking
The Ranking system ranks every single attribute from the highest to the lowest value.
In the case of lanthanum, cerium and samarium, as well as for the toxic elements, the
ranking order is reversed (lowest to highest). Each deposit is given a ranking for each
ranked attribute. Ranking is divided into three categories (Figure 49):
● All Ranking
● Material Grade
● Economy
The term All Ranking is a combination of the Material Grade and Economy rankings
and gives the complete ranking of all attributes. The category Material Grade includes
all REO and the toxic elements of uranium and thorium. The criteria which are used for
the Economy Ranking are TREO (t) INF, TREO (t) IND, TREO (t) MEA, TREO (t) total
and FOB Basket Price Ranking.
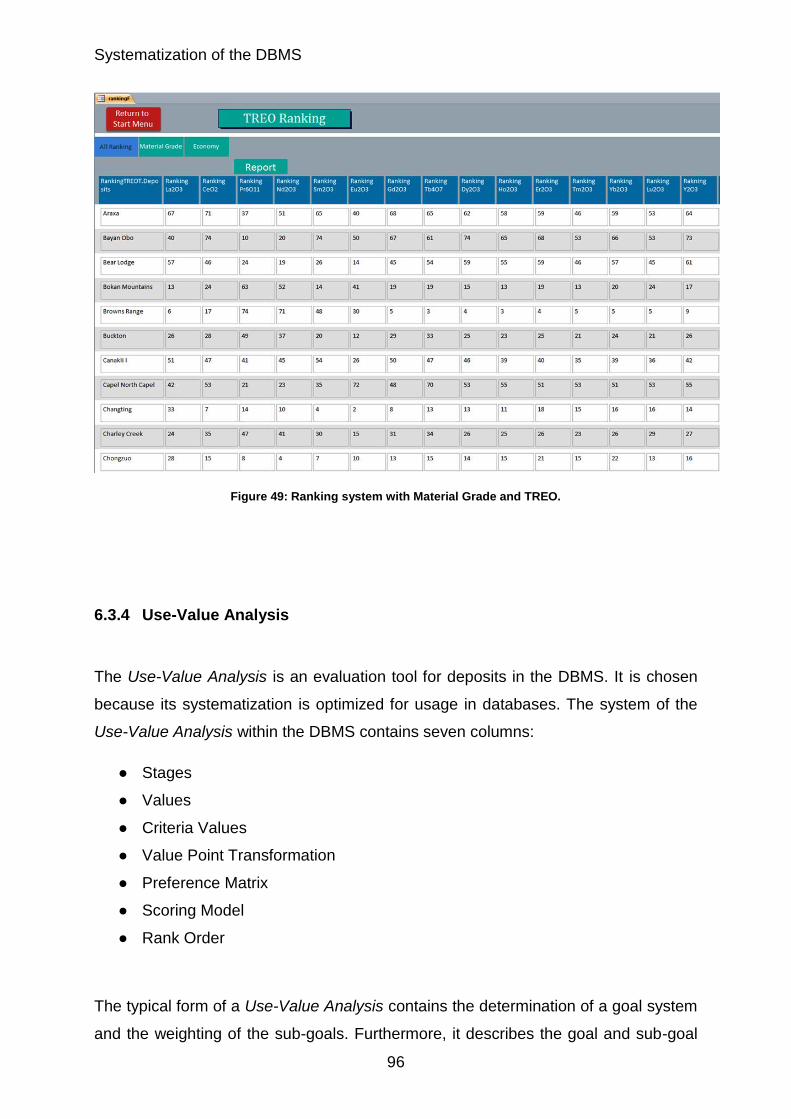
Systematization of the DBMS
96
Figure 49: Ranking system with Material Grade and TREO.
6.3.4 Use-Value Analysis
The Use-Value Analysis is an evaluation tool for deposits in the DBMS. It is chosen
because its systematization is optimized for usage in databases. The system of the
Use-Value Analysis within the DBMS contains seven columns:
● Stages
● Values
● Criteria Values
● Value Point Transformation
● Preference Matrix
● Scoring Model
● Rank Order
The typical form of a Use-Value Analysis contains the determination of a goal system
and the weighting of the sub-goals. Furthermore, it describes the goal and sub-goal
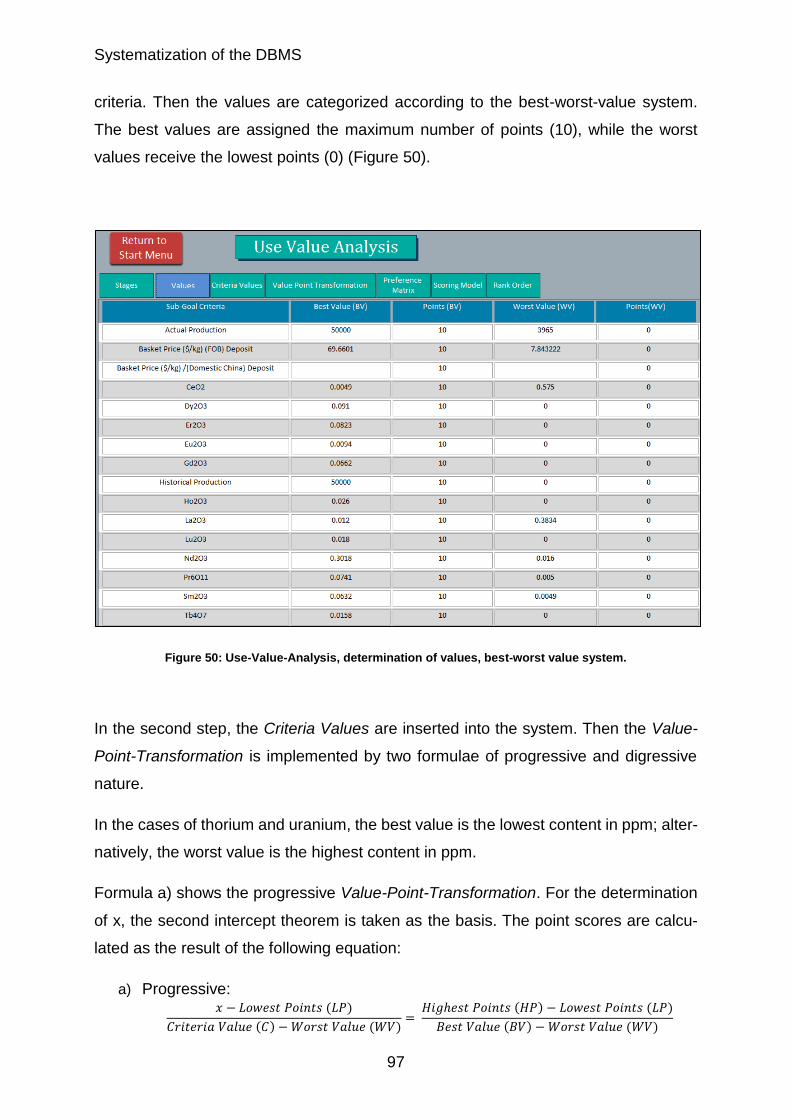
Systematization of the DBMS
97
criteria. Then the values are categorized according to the best-worst-value system.
The best values are assigned the maximum number of points (10), while the worst
values receive the lowest points (0) (Figure 50).
Figure 50: Use-Value-Analysis, determination of values, best-worst value system.
In the second step, the Criteria Values are inserted into the system. Then the Value-
Point-Transformation is implemented by two formulae of progressive and digressive
nature.
In the cases of thorium and uranium, the best value is the lowest content in ppm; alter-
natively, the worst value is the highest content in ppm.
Formula a) shows the progressive Value-Point-Transformation. For the determination
of x, the second intercept theorem is taken as the basis. The point scores are calcu-
lated as the result of the following equation:
a) Progressive: 𝑥 − 𝐿𝑜𝑤𝑒𝑠𝑡 𝑃𝑜𝑖𝑛𝑡𝑠 (𝐿𝑃)
𝐶𝑟𝑖𝑡𝑒𝑟𝑖𝑎 𝑉𝑎𝑙𝑢𝑒 (𝐶) − 𝑊𝑜𝑟𝑠𝑡 𝑉𝑎𝑙𝑢𝑒 (𝑊𝑉)=
𝐻𝑖𝑔ℎ𝑒𝑠𝑡 𝑃𝑜𝑖𝑛𝑡𝑠 (𝐻𝑃) − 𝐿𝑜𝑤𝑒𝑠𝑡 𝑃𝑜𝑖𝑛𝑡𝑠 (𝐿𝑃)
𝐵𝑒𝑠𝑡 𝑉𝑎𝑙𝑢𝑒 (𝐵𝑉) − 𝑊𝑜𝑟𝑠𝑡 𝑉𝑎𝑙𝑢𝑒 (𝑊𝑉)
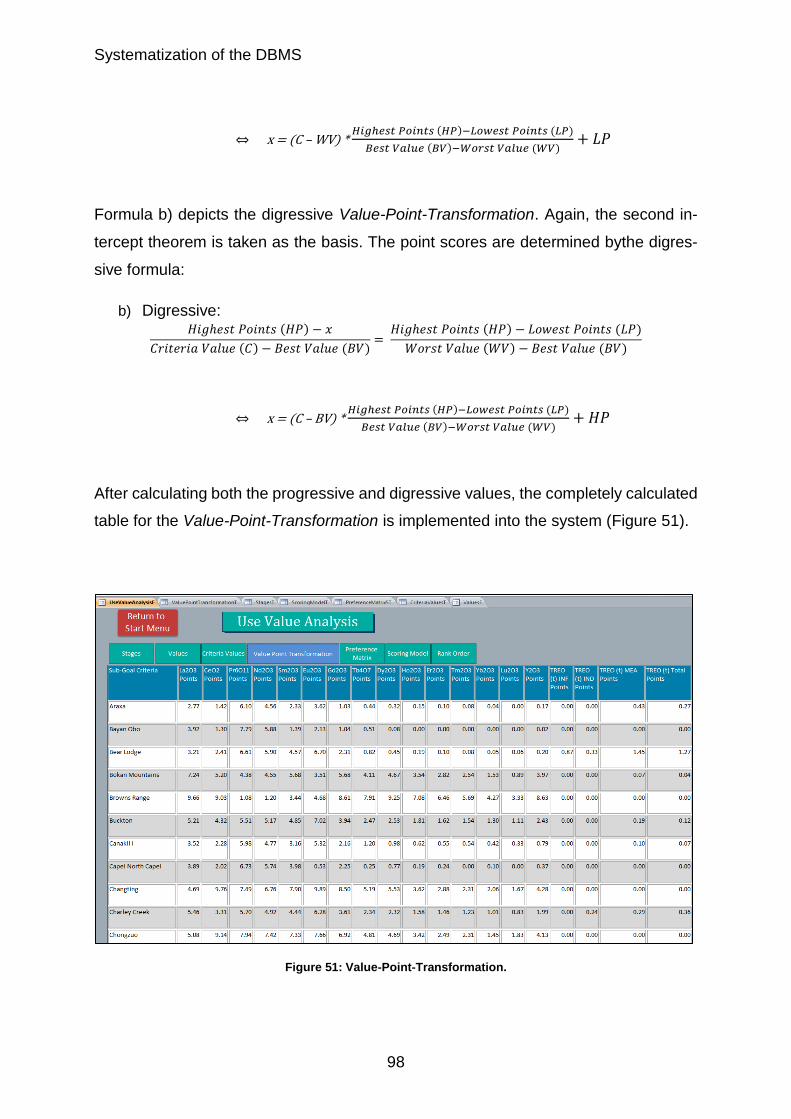
Systematization of the DBMS
98
⇔ x = (C – WV) * 𝐻𝑖𝑔ℎ𝑒𝑠𝑡 𝑃𝑜𝑖𝑛𝑡𝑠 (𝐻𝑃)−𝐿𝑜𝑤𝑒𝑠𝑡 𝑃𝑜𝑖𝑛𝑡𝑠 (𝐿𝑃)
𝐵𝑒𝑠𝑡 𝑉𝑎𝑙𝑢𝑒 (𝐵𝑉)−𝑊𝑜𝑟𝑠𝑡 𝑉𝑎𝑙𝑢𝑒 (𝑊𝑉)+ 𝐿𝑃
Formula b) depicts the digressive Value-Point-Transformation. Again, the second in-
tercept theorem is taken as the basis. The point scores are determined bythe digres-
sive formula:
b) Digressive: 𝐻𝑖𝑔ℎ𝑒𝑠𝑡 𝑃𝑜𝑖𝑛𝑡𝑠 (𝐻𝑃) − 𝑥
𝐶𝑟𝑖𝑡𝑒𝑟𝑖𝑎 𝑉𝑎𝑙𝑢𝑒 (𝐶) − 𝐵𝑒𝑠𝑡 𝑉𝑎𝑙𝑢𝑒 (𝐵𝑉)=
𝐻𝑖𝑔ℎ𝑒𝑠𝑡 𝑃𝑜𝑖𝑛𝑡𝑠 (𝐻𝑃) − 𝐿𝑜𝑤𝑒𝑠𝑡 𝑃𝑜𝑖𝑛𝑡𝑠 (𝐿𝑃)
𝑊𝑜𝑟𝑠𝑡 𝑉𝑎𝑙𝑢𝑒 (𝑊𝑉) − 𝐵𝑒𝑠𝑡 𝑉𝑎𝑙𝑢𝑒 (𝐵𝑉)
⇔ x = (C – BV) * 𝐻𝑖𝑔ℎ𝑒𝑠𝑡 𝑃𝑜𝑖𝑛𝑡𝑠 (𝐻𝑃)−𝐿𝑜𝑤𝑒𝑠𝑡 𝑃𝑜𝑖𝑛𝑡𝑠 (𝐿𝑃)
𝐵𝑒𝑠𝑡 𝑉𝑎𝑙𝑢𝑒 (𝐵𝑉)−𝑊𝑜𝑟𝑠𝑡 𝑉𝑎𝑙𝑢𝑒 (𝑊𝑉)+ 𝐻𝑃
After calculating both the progressive and digressive values, the completely calculated
table for the Value-Point-Transformation is implemented into the system (Figure 51).
Figure 51: Value-Point-Transformation.
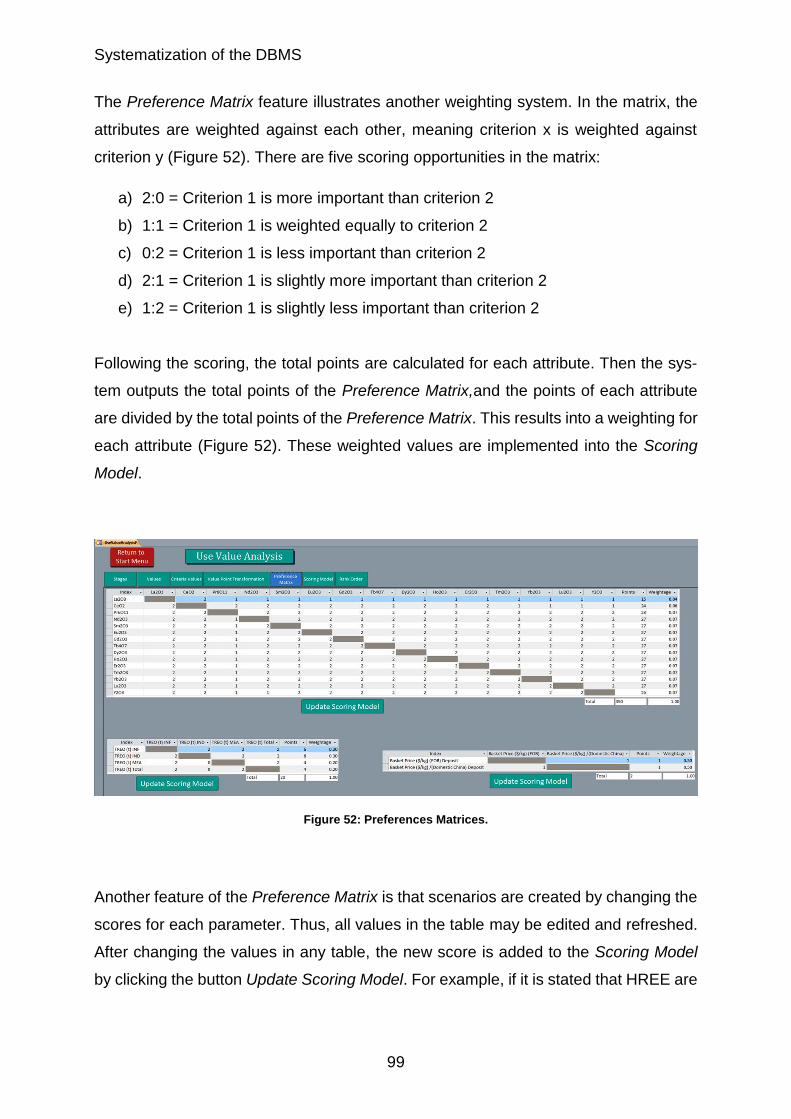
Systematization of the DBMS
99
The Preference Matrix feature illustrates another weighting system. In the matrix, the
attributes are weighted against each other, meaning criterion x is weighted against
criterion y (Figure 52). There are five scoring opportunities in the matrix:
a) 2:0 = Criterion 1 is more important than criterion 2
b) 1:1 = Criterion 1 is weighted equally to criterion 2
c) 0:2 = Criterion 1 is less important than criterion 2
d) 2:1 = Criterion 1 is slightly more important than criterion 2
e) 1:2 = Criterion 1 is slightly less important than criterion 2
Following the scoring, the total points are calculated for each attribute. Then the sys-
tem outputs the total points of the Preference Matrix,and the points of each attribute
are divided by the total points of the Preference Matrix. This results into a weighting for
each attribute (Figure 52). These weighted values are implemented into the Scoring
Model.
Figure 52: Preferences Matrices.
Another feature of the Preference Matrix is that scenarios are created by changing the
scores for each parameter. Thus, all values in the table may be edited and refreshed.
After changing the values in any table, the new score is added to the Scoring Model
by clicking the button Update Scoring Model. For example, if it is stated that HREE are
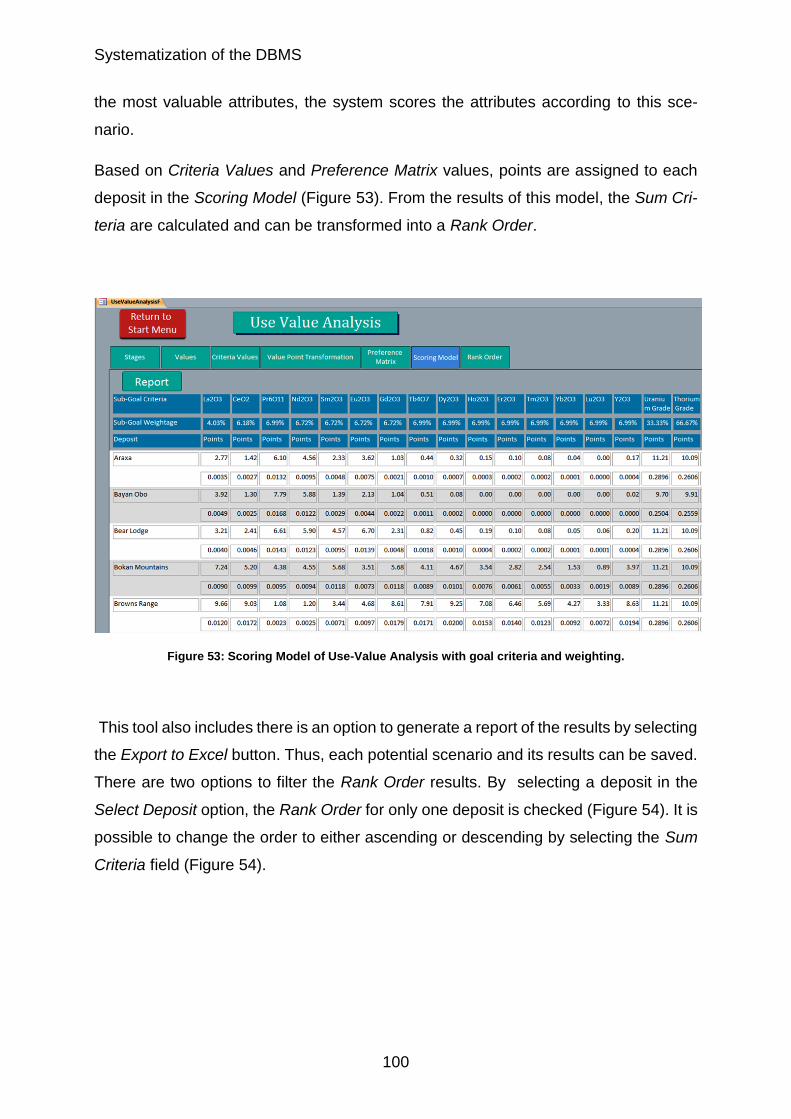
Systematization of the DBMS
100
the most valuable attributes, the system scores the attributes according to this sce-
nario.
Based on Criteria Values and Preference Matrix values, points are assigned to each
deposit in the Scoring Model (Figure 53). From the results of this model, the Sum Cri-
teria are calculated and can be transformed into a Rank Order.
Figure 53: Scoring Model of Use-Value Analysis with goal criteria and weighting.
This tool also includes there is an option to generate a report of the results by selecting
the Export to Excel button. Thus, each potential scenario and its results can be saved.
There are two options to filter the Rank Order results. By selecting a deposit in the
Select Deposit option, the Rank Order for only one deposit is checked (Figure 54). It is
possible to change the order to either ascending or descending by selecting the Sum
Criteria field (Figure 54).
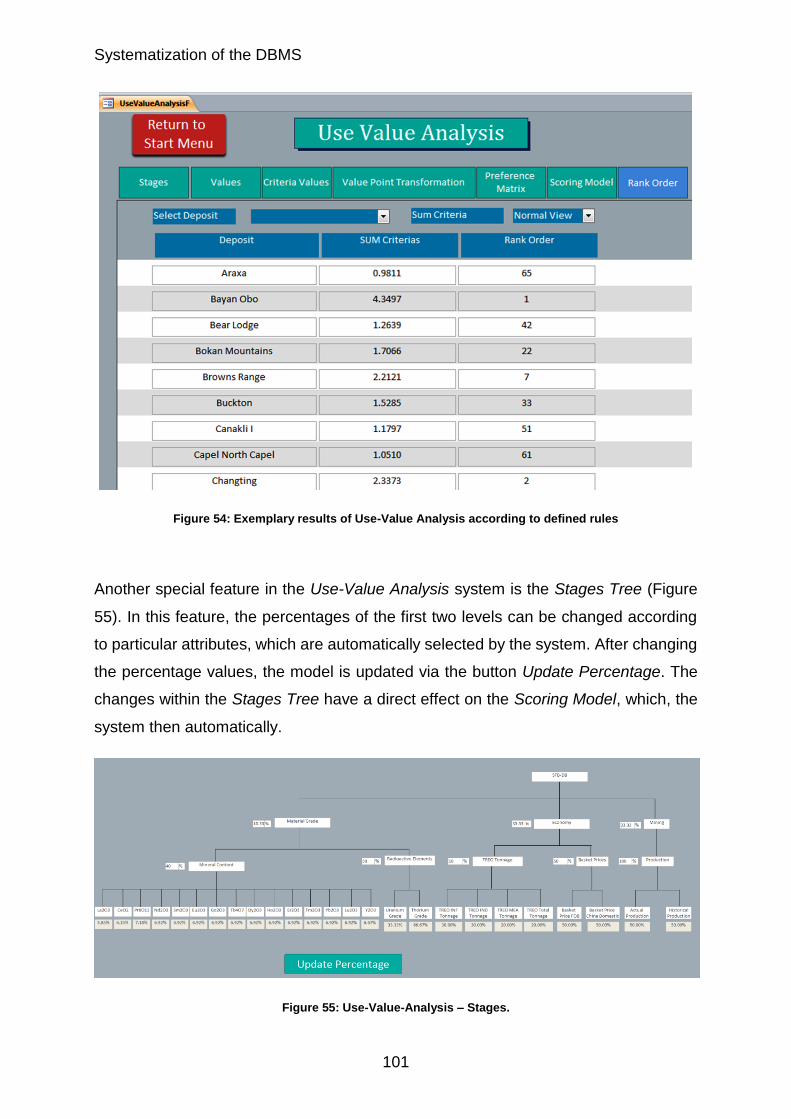
Systematization of the DBMS
101
Figure 54: Exemplary results of Use-Value Analysis according to defined rules
Another special feature in the Use-Value Analysis system is the Stages Tree (Figure
55). In this feature, the percentages of the first two levels can be changed according
to particular attributes, which are automatically selected by the system. After changing
the percentage values, the model is updated via the button Update Percentage. The
changes within the Stages Tree have a direct effect on the Scoring Model, which, the
system then automatically.
Figure 55: Use-Value-Analysis – Stages.
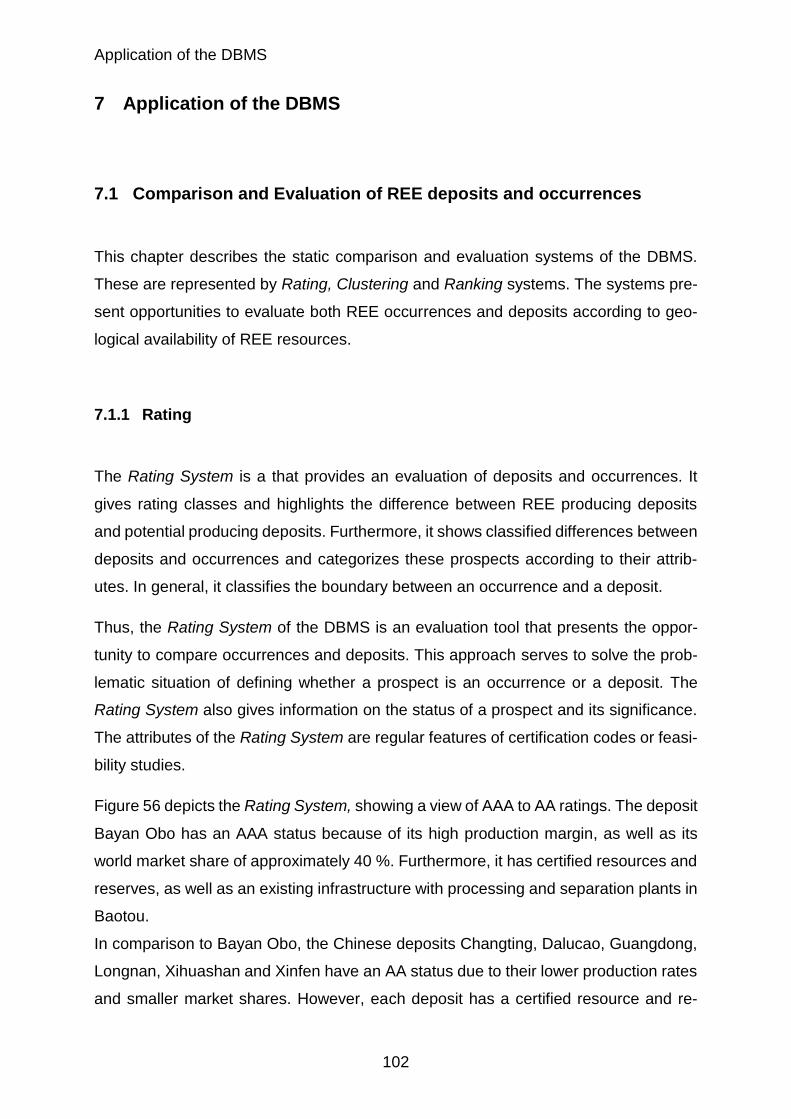
Application of the DBMS
102
7 Application of the DBMS
7.1 Comparison and Evaluation of REE deposits and occurrences
This chapter describes the static comparison and evaluation systems of the DBMS.
These are represented by Rating, Clustering and Ranking systems. The systems pre-
sent opportunities to evaluate both REE occurrences and deposits according to geo-
logical availability of REE resources.
7.1.1 Rating
The Rating System is a that provides an evaluation of deposits and occurrences. It
gives rating classes and highlights the difference between REE producing deposits
and potential producing deposits. Furthermore, it shows classified differences between
deposits and occurrences and categorizes these prospects according to their attrib-
utes. In general, it classifies the boundary between an occurrence and a deposit.
Thus, the Rating System of the DBMS is an evaluation tool that presents the oppor-
tunity to compare occurrences and deposits. This approach serves to solve the prob-
lematic situation of defining whether a prospect is an occurrence or a deposit. The
Rating System also gives information on the status of a prospect and its significance.
The attributes of the Rating System are regular features of certification codes or feasi-
bility studies.
Figure 56 depicts the Rating System, showing a view of AAA to AA ratings. The deposit
Bayan Obo has an AAA status because of its high production margin, as well as its
world market share of approximately 40 %. Furthermore, it has certified resources and
reserves, as well as an existing infrastructure with processing and separation plants in
Baotou.
In comparison to Bayan Obo, the Chinese deposits Changting, Dalucao, Guangdong,
Longnan, Xihuashan and Xinfen have an AA status due to their lower production rates
and smaller market shares. However, each deposit has a certified resource and re-
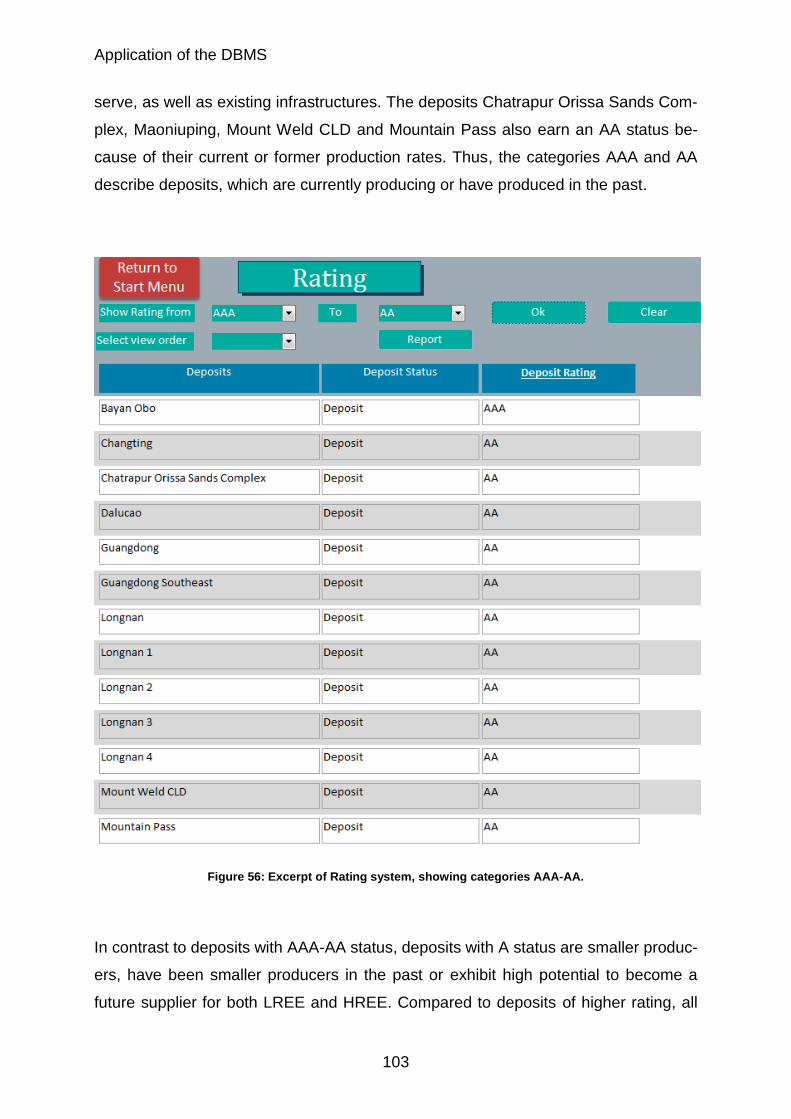
Application of the DBMS
103
serve, as well as existing infrastructures. The deposits Chatrapur Orissa Sands Com-
plex, Maoniuping, Mount Weld CLD and Mountain Pass also earn an AA status be-
cause of their current or former production rates. Thus, the categories AAA and AA
describe deposits, which are currently producing or have produced in the past.
Figure 56: Excerpt of Rating system, showing categories AAA-AA.
In contrast to deposits with AAA-AA status, deposits with A status are smaller produc-
ers, have been smaller producers in the past or exhibit high potential to become a
future supplier for both LREE and HREE. Compared to deposits of higher rating, all
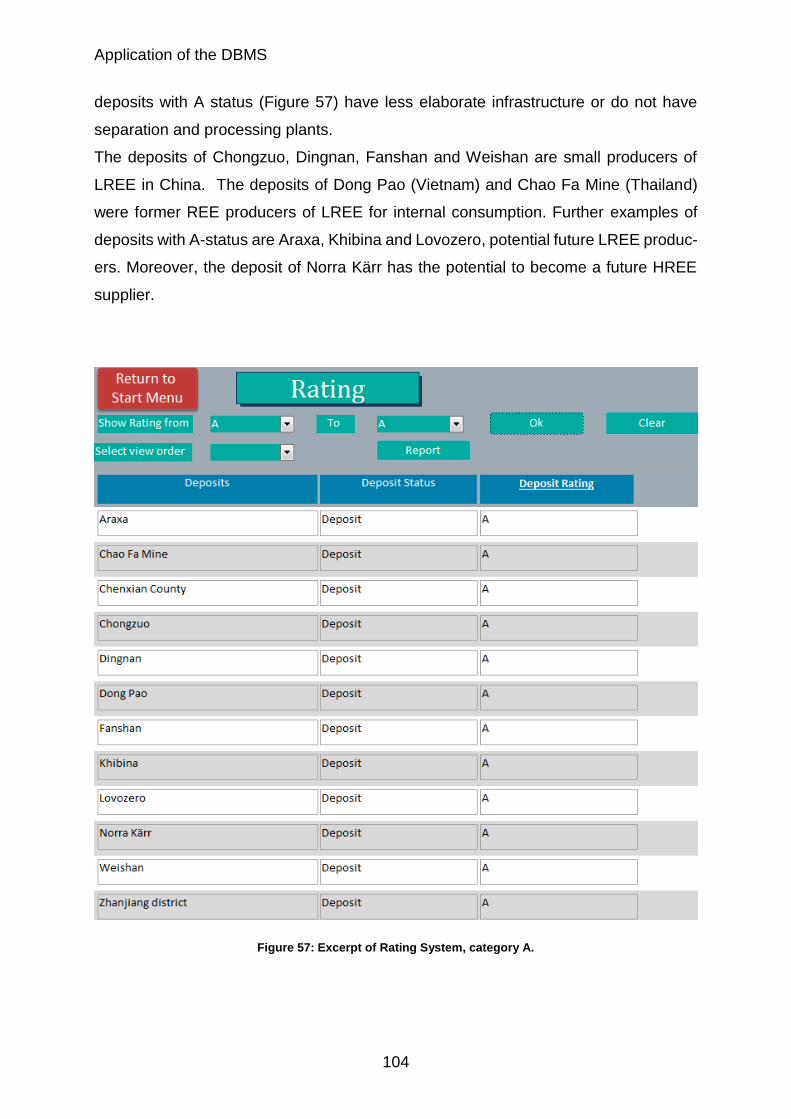
Application of the DBMS
104
deposits with A status (Figure 57) have less elaborate infrastructure or do not have
separation and processing plants.
The deposits of Chongzuo, Dingnan, Fanshan and Weishan are small producers of
LREE in China. The deposits of Dong Pao (Vietnam) and Chao Fa Mine (Thailand)
were former REE producers of LREE for internal consumption. Further examples of
deposits with A-status are Araxa, Khibina and Lovozero, potential future LREE produc-
ers. Moreover, the deposit of Norra Kärr has the potential to become a future HREE
supplier.
Figure 57: Excerpt of Rating System, category A.
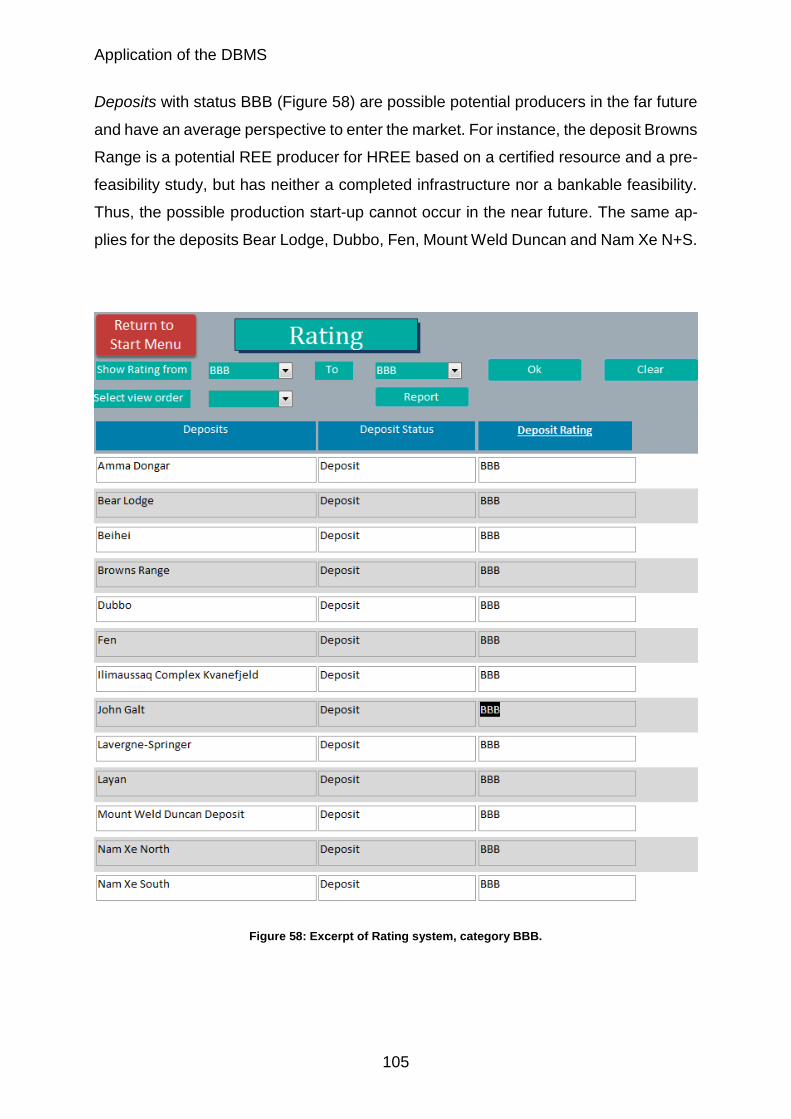
Application of the DBMS
105
Deposits with status BBB (Figure 58) are possible potential producers in the far future
and have an average perspective to enter the market. For instance, the deposit Browns
Range is a potential REE producer for HREE based on a certified resource and a pre-
feasibility study, but has neither a completed infrastructure nor a bankable feasibility.
Thus, the possible production start-up cannot occur in the near future. The same ap-
plies for the deposits Bear Lodge, Dubbo, Fen, Mount Weld Duncan and Nam Xe N+S.
Figure 58: Excerpt of Rating system, category BBB.
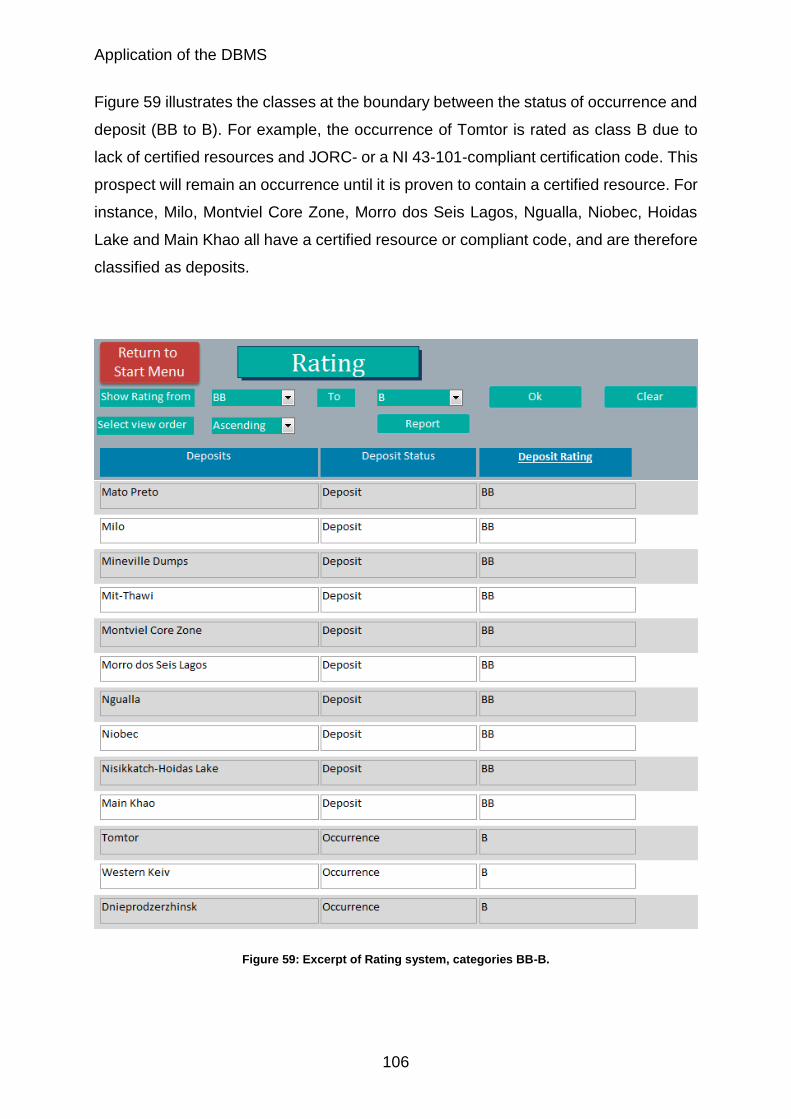
Application of the DBMS
106
Figure 59 illustrates the classes at the boundary between the status of occurrence and
deposit (BB to B). For example, the occurrence of Tomtor is rated as class B due to
lack of certified resources and JORC- or a NI 43-101-compliant certification code. This
prospect will remain an occurrence until it is proven to contain a certified resource. For
instance, Milo, Montviel Core Zone, Morro dos Seis Lagos, Ngualla, Niobec, Hoidas
Lake and Main Khao all have a certified resource or compliant code, and are therefore
classified as deposits.
Figure 59: Excerpt of Rating system, categories BB-B.
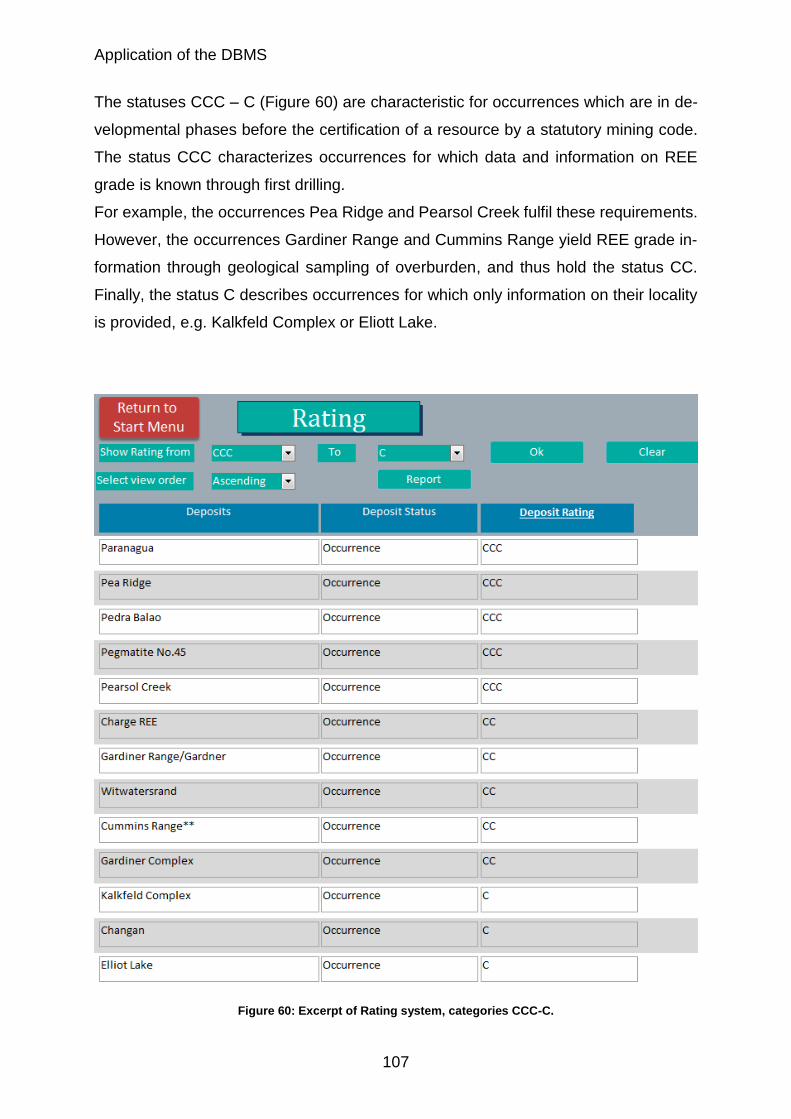
Application of the DBMS
107
The statuses CCC – C (Figure 60) are characteristic for occurrences which are in de-
velopmental phases before the certification of a resource by a statutory mining code.
The status CCC characterizes occurrences for which data and information on REE
grade is known through first drilling.
For example, the occurrences Pea Ridge and Pearsol Creek fulfil these requirements.
However, the occurrences Gardiner Range and Cummins Range yield REE grade in-
formation through geological sampling of overburden, and thus hold the status CC.
Finally, the status C describes occurrences for which only information on their locality
is provided, e.g. Kalkfeld Complex or Eliott Lake.
Figure 60: Excerpt of Rating system, categories CCC-C.
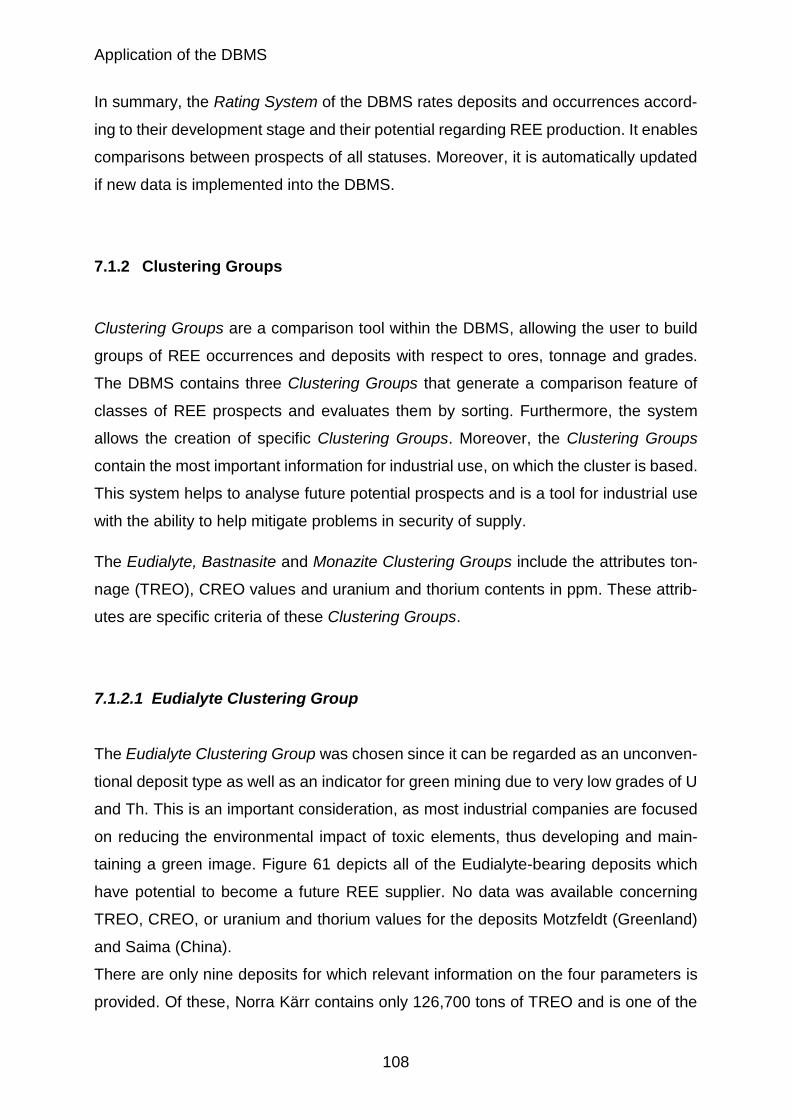
Application of the DBMS
108
In summary, the Rating System of the DBMS rates deposits and occurrences accord-
ing to their development stage and their potential regarding REE production. It enables
comparisons between prospects of all statuses. Moreover, it is automatically updated
if new data is implemented into the DBMS.
7.1.2 Clustering Groups
Clustering Groups are a comparison tool within the DBMS, allowing the user to build
groups of REE occurrences and deposits with respect to ores, tonnage and grades.
The DBMS contains three Clustering Groups that generate a comparison feature of
classes of REE prospects and evaluates them by sorting. Furthermore, the system
allows the creation of specific Clustering Groups. Moreover, the Clustering Groups
contain the most important information for industrial use, on which the cluster is based.
This system helps to analyse future potential prospects and is a tool for industrial use
with the ability to help mitigate problems in security of supply.
The Eudialyte, Bastnasite and Monazite Clustering Groups include the attributes ton-
nage (TREO), CREO values and uranium and thorium contents in ppm. These attrib-
utes are specific criteria of these Clustering Groups.
7.1.2.1 Eudialyte Clustering Group
The Eudialyte Clustering Group was chosen since it can be regarded as an unconven-
tional deposit type as well as an indicator for green mining due to very low grades of U
and Th. This is an important consideration, as most industrial companies are focused
on reducing the environmental impact of toxic elements, thus developing and main-
taining a green image. Figure 61 depicts all of the Eudialyte-bearing deposits which
have potential to become a future REE supplier. No data was available concerning
TREO, CREO, or uranium and thorium values for the deposits Motzfeldt (Greenland)
and Saima (China).
There are only nine deposits for which relevant information on the four parameters is
provided. Of these, Norra Kärr contains only 126,700 tons of TREO and is one of the
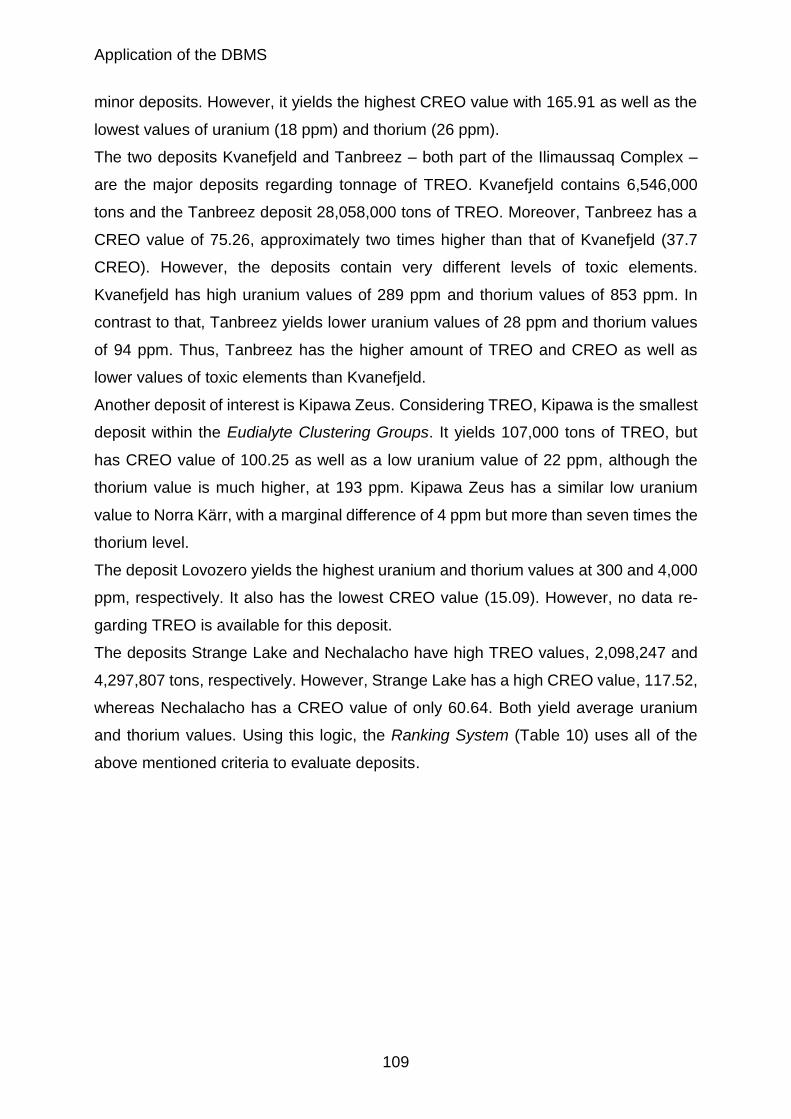
Application of the DBMS
109
minor deposits. However, it yields the highest CREO value with 165.91 as well as the
lowest values of uranium (18 ppm) and thorium (26 ppm).
The two deposits Kvanefjeld and Tanbreez – both part of the Ilimaussaq Complex –
are the major deposits regarding tonnage of TREO. Kvanefjeld contains 6,546,000
tons and the Tanbreez deposit 28,058,000 tons of TREO. Moreover, Tanbreez has a
CREO value of 75.26, approximately two times higher than that of Kvanefjeld (37.7
CREO). However, the deposits contain very different levels of toxic elements.
Kvanefjeld has high uranium values of 289 ppm and thorium values of 853 ppm. In
contrast to that, Tanbreez yields lower uranium values of 28 ppm and thorium values
of 94 ppm. Thus, Tanbreez has the higher amount of TREO and CREO as well as
lower values of toxic elements than Kvanefjeld.
Another deposit of interest is Kipawa Zeus. Considering TREO, Kipawa is the smallest
deposit within the Eudialyte Clustering Groups. It yields 107,000 tons of TREO, but
has CREO value of 100.25 as well as a low uranium value of 22 ppm, although the
thorium value is much higher, at 193 ppm. Kipawa Zeus has a similar low uranium
value to Norra Kärr, with a marginal difference of 4 ppm but more than seven times the
thorium level.
The deposit Lovozero yields the highest uranium and thorium values at 300 and 4,000
ppm, respectively. It also has the lowest CREO value (15.09). However, no data re-
garding TREO is available for this deposit.
The deposits Strange Lake and Nechalacho have high TREO values, 2,098,247 and
4,297,807 tons, respectively. However, Strange Lake has a high CREO value, 117.52,
whereas Nechalacho has a CREO value of only 60.64. Both yield average uranium
and thorium values. Using this logic, the Ranking System (Table 10) uses all of the
above mentioned criteria to evaluate deposits.
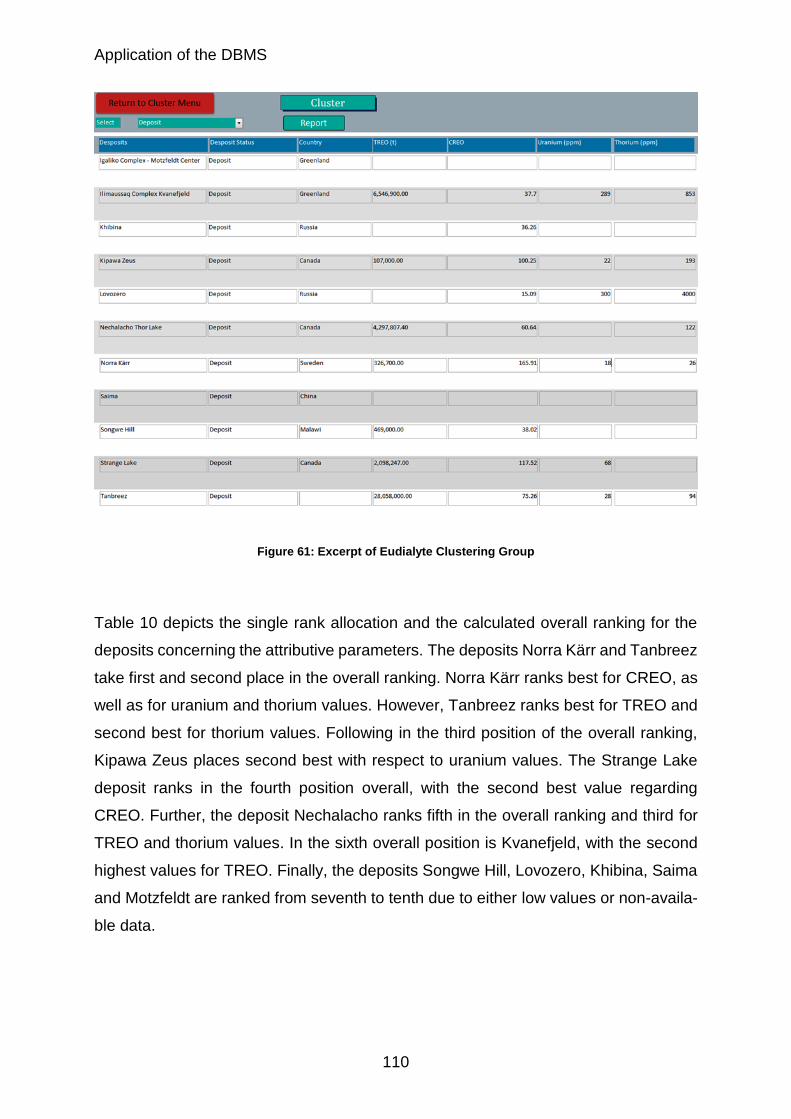
Application of the DBMS
110
Figure 61: Excerpt of Eudialyte Clustering Group
Table 10 depicts the single rank allocation and the calculated overall ranking for the
deposits concerning the attributive parameters. The deposits Norra Kärr and Tanbreez
take first and second place in the overall ranking. Norra Kärr ranks best for CREO, as
well as for uranium and thorium values. However, Tanbreez ranks best for TREO and
second best for thorium values. Following in the third position of the overall ranking,
Kipawa Zeus places second best with respect to uranium values. The Strange Lake
deposit ranks in the fourth position overall, with the second best value regarding
CREO. Further, the deposit Nechalacho ranks fifth in the overall ranking and third for
TREO and thorium values. In the sixth overall position is Kvanefjeld, with the second
highest values for TREO. Finally, the deposits Songwe Hill, Lovozero, Khibina, Saima
and Motzfeldt are ranked from seventh to tenth due to either low values or non-availa-
ble data.
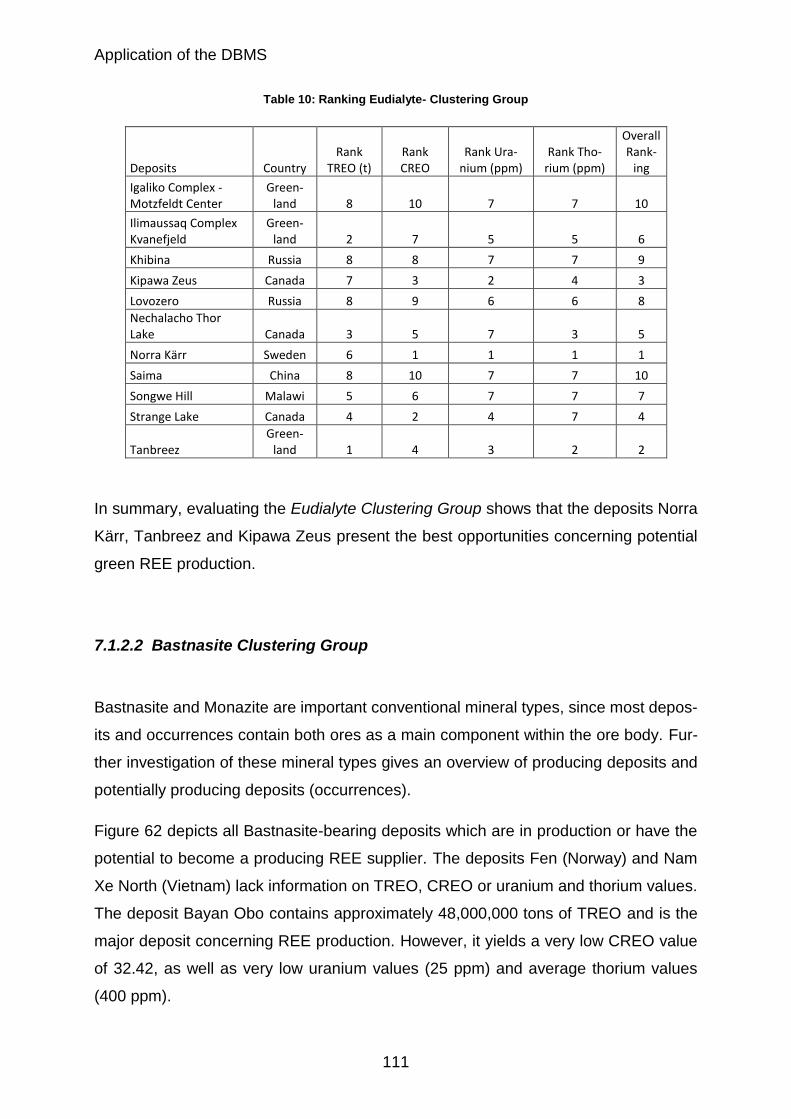
Application of the DBMS
111
Table 10: Ranking Eudialyte- Clustering Group
Deposits Country Rank
TREO (t) Rank CREO
Rank Ura-nium (ppm)
Rank Tho-rium (ppm)
Overall Rank-
ing
Igaliko Complex - Motzfeldt Center
Green-land 8 10 7 7 10
Ilimaussaq Complex Kvanefjeld
Green-land 2 7 5 5 6
Khibina Russia 8 8 7 7 9
Kipawa Zeus Canada 7 3 2 4 3
Lovozero Russia 8 9 6 6 8
Nechalacho Thor Lake Canada 3 5 7 3 5
Norra Kärr Sweden 6 1 1 1 1
Saima China 8 10 7 7 10
Songwe Hill Malawi 5 6 7 7 7
Strange Lake Canada 4 2 4 7 4
Tanbreez Green-
land 1 4 3 2 2
In summary, evaluating the Eudialyte Clustering Group shows that the deposits Norra
Kärr, Tanbreez and Kipawa Zeus present the best opportunities concerning potential
green REE production.
7.1.2.2 Bastnasite Clustering Group
Bastnasite and Monazite are important conventional mineral types, since most depos-
its and occurrences contain both ores as a main component within the ore body. Fur-
ther investigation of these mineral types gives an overview of producing deposits and
potentially producing deposits (occurrences).
Figure 62 depicts all Bastnasite-bearing deposits which are in production or have the
potential to become a producing REE supplier. The deposits Fen (Norway) and Nam
Xe North (Vietnam) lack information on TREO, CREO or uranium and thorium values.
The deposit Bayan Obo contains approximately 48,000,000 tons of TREO and is the
major deposit concerning REE production. However, it yields a very low CREO value
of 32.42, as well as very low uranium values (25 ppm) and average thorium values
(400 ppm).
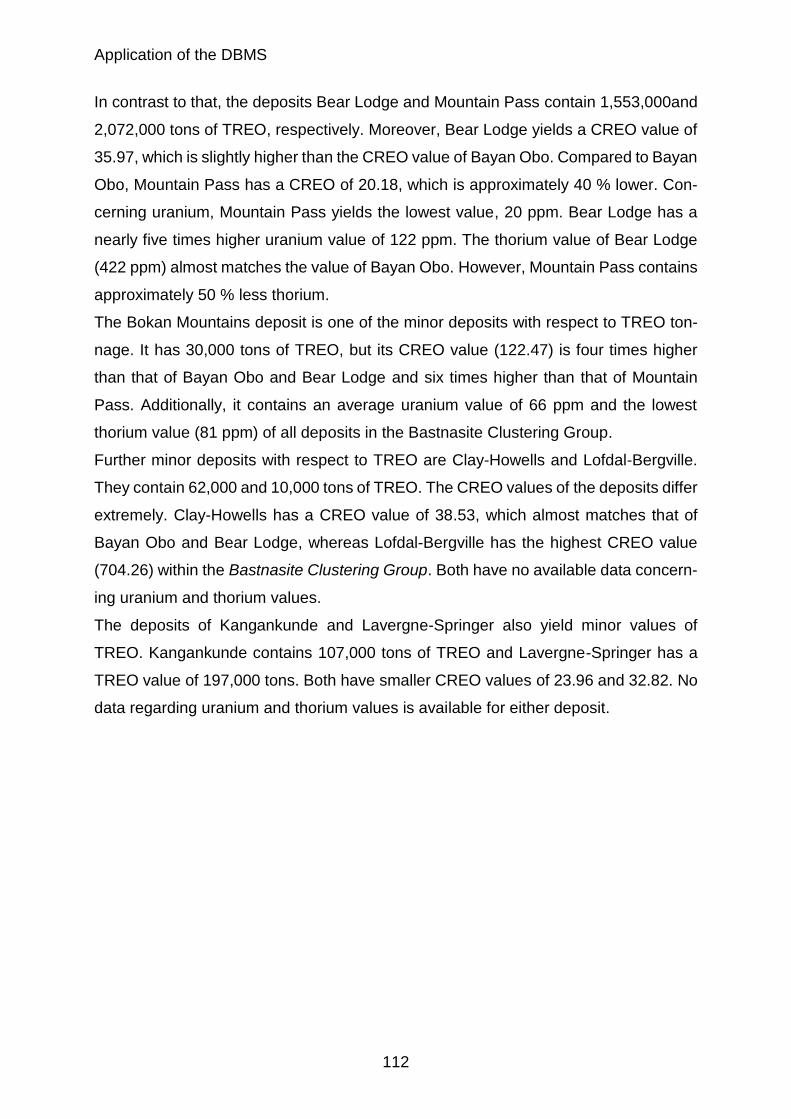
Application of the DBMS
112
In contrast to that, the deposits Bear Lodge and Mountain Pass contain 1,553,000and
2,072,000 tons of TREO, respectively. Moreover, Bear Lodge yields a CREO value of
35.97, which is slightly higher than the CREO value of Bayan Obo. Compared to Bayan
Obo, Mountain Pass has a CREO of 20.18, which is approximately 40 % lower. Con-
cerning uranium, Mountain Pass yields the lowest value, 20 ppm. Bear Lodge has a
nearly five times higher uranium value of 122 ppm. The thorium value of Bear Lodge
(422 ppm) almost matches the value of Bayan Obo. However, Mountain Pass contains
approximately 50 % less thorium.
The Bokan Mountains deposit is one of the minor deposits with respect to TREO ton-
nage. It has 30,000 tons of TREO, but its CREO value (122.47) is four times higher
than that of Bayan Obo and Bear Lodge and six times higher than that of Mountain
Pass. Additionally, it contains an average uranium value of 66 ppm and the lowest
thorium value (81 ppm) of all deposits in the Bastnasite Clustering Group.
Further minor deposits with respect to TREO are Clay-Howells and Lofdal-Bergville.
They contain 62,000 and 10,000 tons of TREO. The CREO values of the deposits differ
extremely. Clay-Howells has a CREO value of 38.53, which almost matches that of
Bayan Obo and Bear Lodge, whereas Lofdal-Bergville has the highest CREO value
(704.26) within the Bastnasite Clustering Group. Both have no available data concern-
ing uranium and thorium values.
The deposits of Kangankunde and Lavergne-Springer also yield minor values of
TREO. Kangankunde contains 107,000 tons of TREO and Lavergne-Springer has a
TREO value of 197,000 tons. Both have smaller CREO values of 23.96 and 32.82. No
data regarding uranium and thorium values is available for either deposit.
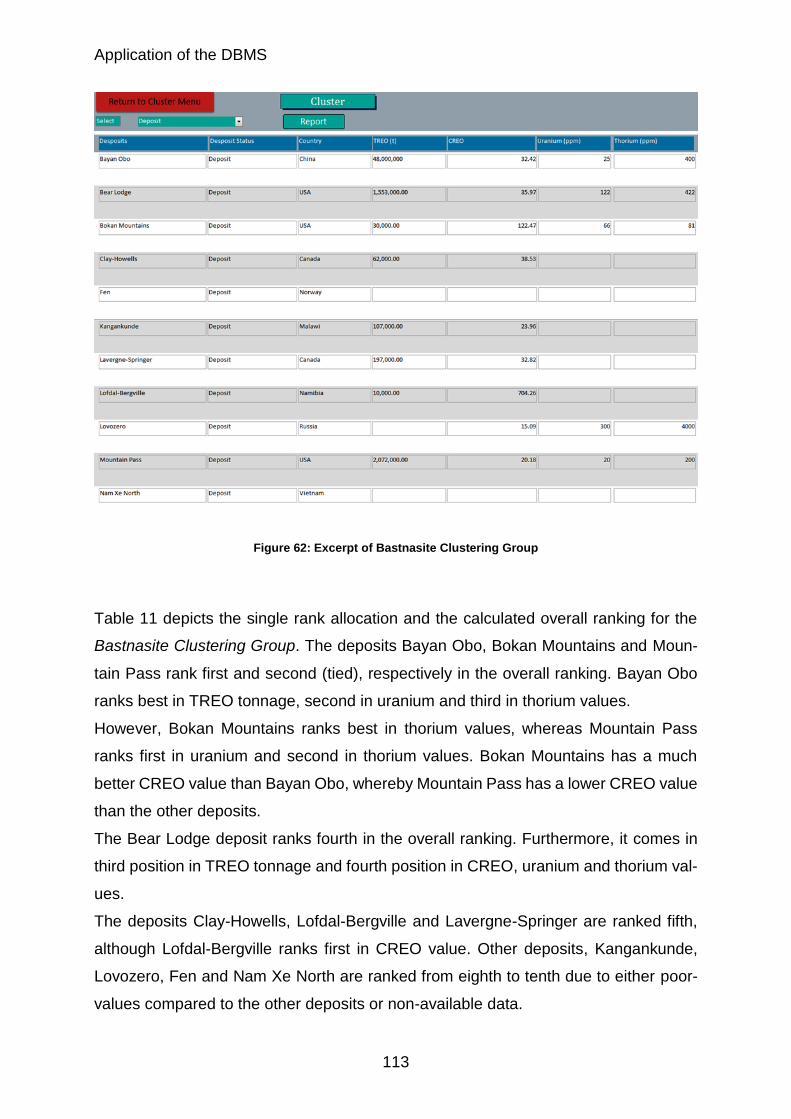
Application of the DBMS
113
Figure 62: Excerpt of Bastnasite Clustering Group
Table 11 depicts the single rank allocation and the calculated overall ranking for the
Bastnasite Clustering Group. The deposits Bayan Obo, Bokan Mountains and Moun-
tain Pass rank first and second (tied), respectively in the overall ranking. Bayan Obo
ranks best in TREO tonnage, second in uranium and third in thorium values.
However, Bokan Mountains ranks best in thorium values, whereas Mountain Pass
ranks first in uranium and second in thorium values. Bokan Mountains has a much
better CREO value than Bayan Obo, whereby Mountain Pass has a lower CREO value
than the other deposits.
The Bear Lodge deposit ranks fourth in the overall ranking. Furthermore, it comes in
third position in TREO tonnage and fourth position in CREO, uranium and thorium val-
ues.
The deposits Clay-Howells, Lofdal-Bergville and Lavergne-Springer are ranked fifth,
although Lofdal-Bergville ranks first in CREO value. Other deposits, Kangankunde,
Lovozero, Fen and Nam Xe North are ranked from eighth to tenth due to either poor-
values compared to the other deposits or non-available data.
Application of the DBMS
114
Table 11: Ranking Bastnasite- Clustering Group
Deposits Country Rank TREO
(t) Rank CREO Rank Ura-
nium (ppm) Rank Tho-
rium (ppm) Overall Ranking
Bayan Obo China 1 6 2 3 1
Bear Lodge USA 3 4 4 4 4
Bokan Moun-tains USA 7 2 3 1 2
Clay-Howells Canada 6 3 6 6 5
Fen Norway 9 10 6 6 10
Kangankunde Malawi 5 7 6 6 8
Lavergne-Springer Canada 4 5 6 6 5
Lofdal-Bergville Namibia 8 1 6 6 5
Lovozero Russia 9 9 5 5 9
Mountain Pass USA 2 8 1 2 2
Nam Xe North Vietnam 9 10 6 6 10
In summary, Bayan Obo can be regarded as the superior deposit within the Bastnasite
Clustering Group. Mountain Pass and Bokan Mountain share the second position in
the ranking. They can both be regarded as future potential producers. However, due
to the fact that Mountain Pass already produced for several decades until the mid-
1990s as well as for a short period until early 2015, it is more likely for this deposit to
go into production, e.g. because of preexisting infrastructure.
7.1.2.3 Monazite Clustering Group
Monazite is the most common mineral in all worldwide REE deposits and occurrences.
Therefore, building a Monazite Clustering Group is essential to this evaluation system.
Figure 63 depicts all Monazite-bearing REE deposits. The deposits in Haikang and
Nanyang (China) have no information due to lack of available data. The deposits Bayan
Obo, Mountain Pass and Bear Lodge are special instances, since they contain both
Monazite and Bastnasite as main minerals.
Application of the DBMS
115
Another special case is the IAC deposit Guangdong Southeast, which also contains
Monazite as a main mineral. However, besides a CREO value, no further information
is available.
The deposits Araxa, Buckton, Canakli I, Hastings, Kutessay II, both Mount Weld de-
posits, Ngualla and Steenkampskraal are typical Monazite-bearing REE deposits. The
deposit Araxa contains 1,190,000 tons of TREO and has a CREO value of 26.11,
whereas the deposit Buckton yields a TREO value of 878,000 and 75.08 in CREO.
Thus, Araxa contains approximately 300,000 more tons of TREO, but Buckton yields
three times the CREO value. No information on uranium and thorium values is availa-
ble for either deposit.
The deposits Canakli I, Hastings and Kutessay II are minor deposits with respect to
tonnage of TREO, containing 42,826, 76,020 and 47,000 tons of TREO, respesctively.
The CREO values of the three deposits vary with respect to to one another. Canakli I
only yields a CREO value of 36.83, whereas Kutessay II contains 128.65 and Hastings
yields 884.86.
The Mount Weld CLD and Mount Weld Duncan contain 1,454,000 and 435,000 tons
of TREO. They also differ with respect to CREO yield, containing 34.89 and 46.88
respectively. Mount Weld Duncan is a minor deposit of the Mount Weld CLD Complex,
thus, the uranium and thorium are equal at 30 ppm and 500 ppm.
The Ngualla (Tanzania) and Steenkampskraal (South Africa) deposits are also special
cases regarding their uranium and thorium values. Ngualla yields the lowest uranium
and thorium contents of all deposits within this Clustering Group, 18 ppm and 43 ppm,
respectively. In comparison, the Steenkampskraal deposit yields the highest thorium
values, 22,600 ppm, and high uranium values of 185 ppm. The deposits also differ in
their TREO tonnage. Ngualla contains 1,748,000 tons and Steenkampskraal only has
93,000 tons of TREO.
There are a couple of additional deposits in this Clustering Group which list partial data
on TREO, CREO and the toxic elements, but all of them lack i a complete data set and
have missing values in at least two of the four parameters. The only exception is the
deposit of Dong Pao (Vietnam), which has a very low CREO value of 18.68 and ura-
nium and thorium values of 124 and 145 ppm.
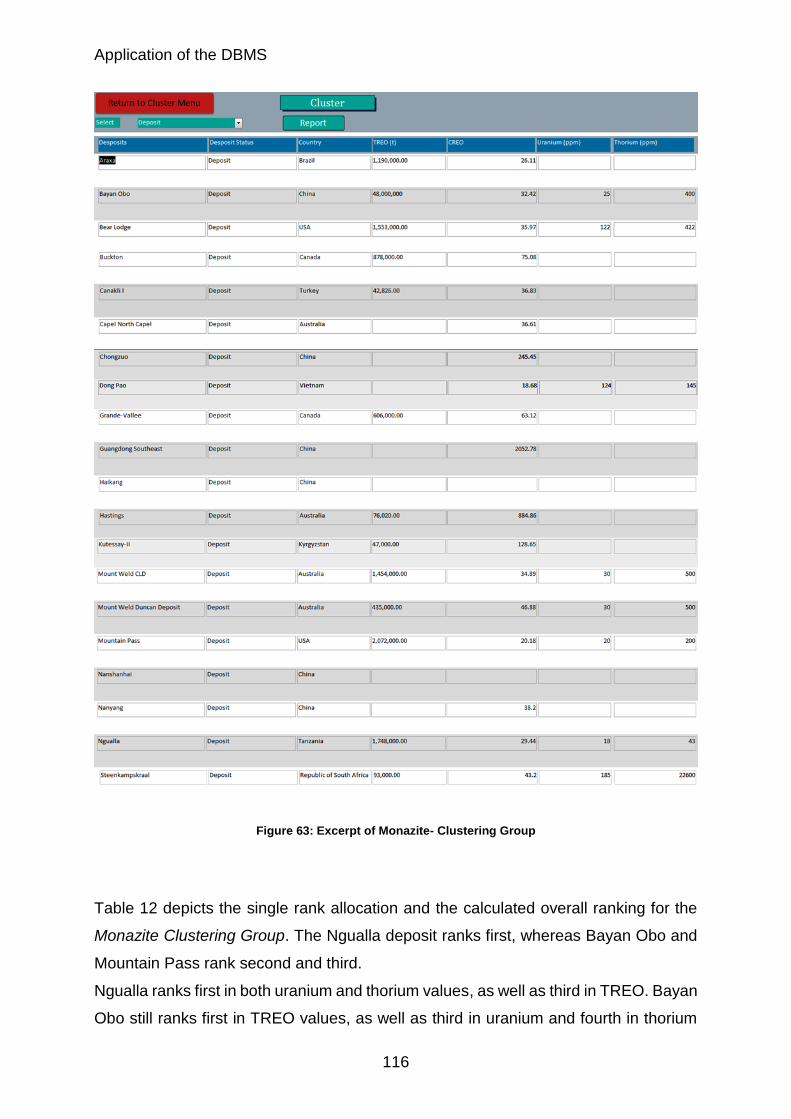
Application of the DBMS
116
Figure 63: Excerpt of Monazite- Clustering Group
Table 12 depicts the single rank allocation and the calculated overall ranking for the
Monazite Clustering Group. The Ngualla deposit ranks first, whereas Bayan Obo and
Mountain Pass rank second and third.
Ngualla ranks first in both uranium and thorium values, as well as third in TREO. Bayan
Obo still ranks first in TREO values, as well as third in uranium and fourth in thorium
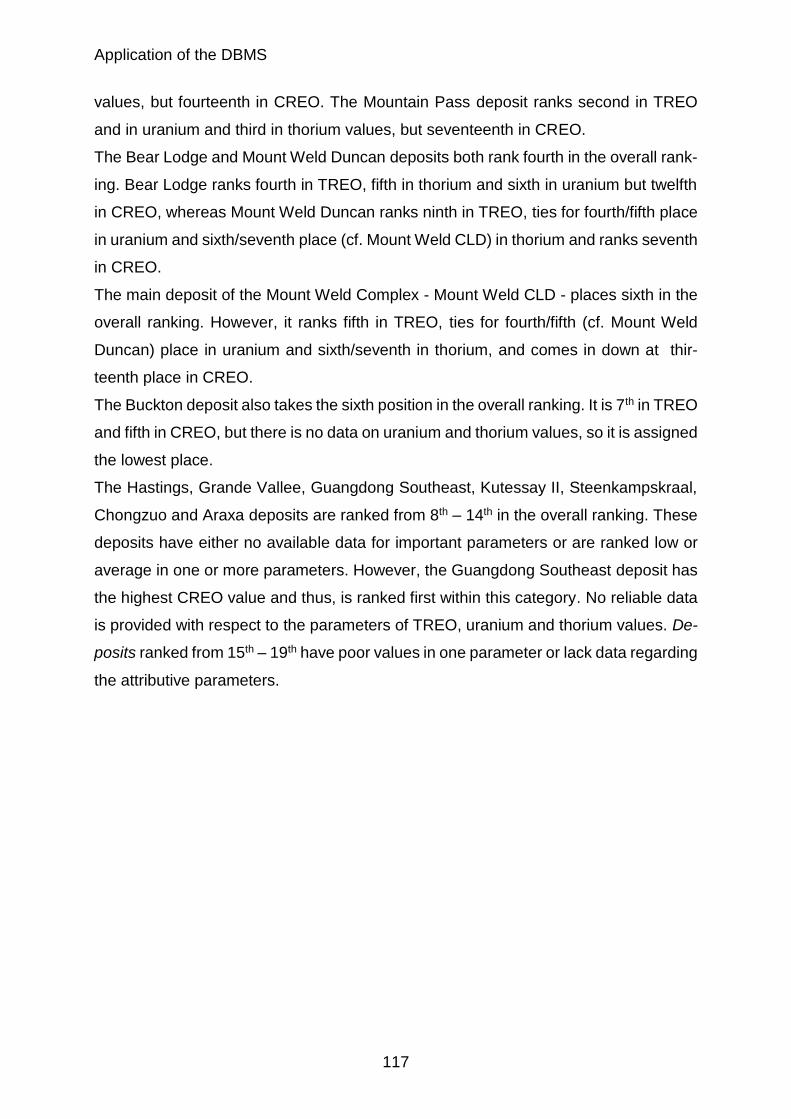
Application of the DBMS
117
values, but fourteenth in CREO. The Mountain Pass deposit ranks second in TREO
and in uranium and third in thorium values, but seventeenth in CREO.
The Bear Lodge and Mount Weld Duncan deposits both rank fourth in the overall rank-
ing. Bear Lodge ranks fourth in TREO, fifth in thorium and sixth in uranium but twelfth
in CREO, whereas Mount Weld Duncan ranks ninth in TREO, ties for fourth/fifth place
in uranium and sixth/seventh place (cf. Mount Weld CLD) in thorium and ranks seventh
in CREO.
The main deposit of the Mount Weld Complex - Mount Weld CLD - places sixth in the
overall ranking. However, it ranks fifth in TREO, ties for fourth/fifth (cf. Mount Weld
Duncan) place in uranium and sixth/seventh in thorium, and comes in down at thir-
teenth place in CREO.
The Buckton deposit also takes the sixth position in the overall ranking. It is 7th in TREO
and fifth in CREO, but there is no data on uranium and thorium values, so it is assigned
the lowest place.
The Hastings, Grande Vallee, Guangdong Southeast, Kutessay II, Steenkampskraal,
Chongzuo and Araxa deposits are ranked from 8th – 14th in the overall ranking. These
deposits have either no available data for important parameters or are ranked low or
average in one or more parameters. However, the Guangdong Southeast deposit has
the highest CREO value and thus, is ranked first within this category. No reliable data
is provided with respect to the parameters of TREO, uranium and thorium values. De-
posits ranked from 15th – 19th have poor values in one parameter or lack data regarding
the attributive parameters.
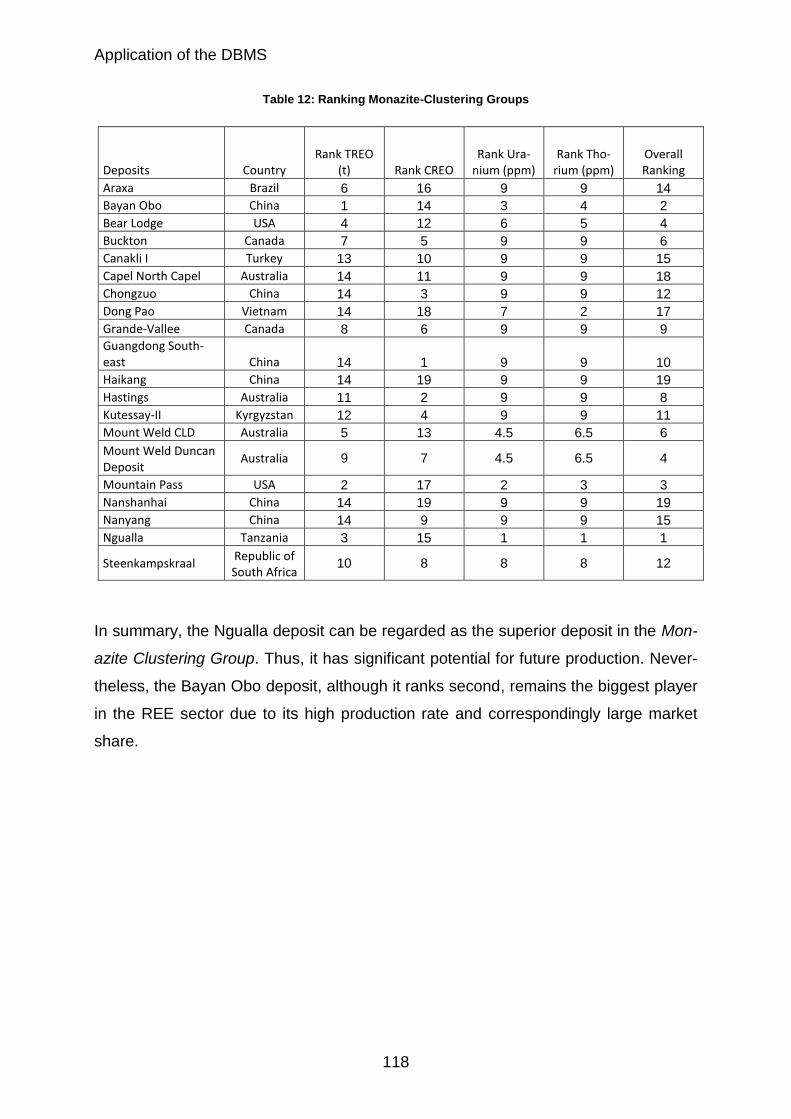
Application of the DBMS
118
Table 12: Ranking Monazite-Clustering Groups
Deposits Country Rank TREO
(t) Rank CREO Rank Ura-
nium (ppm) Rank Tho-
rium (ppm) Overall Ranking
Araxa Brazil 6 16 9 9 14
Bayan Obo China 1 14 3 4 2
Bear Lodge USA 4 12 6 5 4
Buckton Canada 7 5 9 9 6
Canakli I Turkey 13 10 9 9 15
Capel North Capel Australia 14 11 9 9 18
Chongzuo China 14 3 9 9 12
Dong Pao Vietnam 14 18 7 2 17
Grande-Vallee Canada 8 6 9 9 9
Guangdong South-east China 14 1 9 9 10
Haikang China 14 19 9 9 19
Hastings Australia 11 2 9 9 8
Kutessay-II Kyrgyzstan 12 4 9 9 11
Mount Weld CLD Australia 5 13 4.5 6.5 6
Mount Weld Duncan Deposit
Australia 9 7 4.5 6.5 4
Mountain Pass USA 2 17 2 3 3
Nanshanhai China 14 19 9 9 19
Nanyang China 14 9 9 9 15
Ngualla Tanzania 3 15 1 1 1
Steenkampskraal Republic of South Africa
10 8 8 8 12
In summary, the Ngualla deposit can be regarded as the superior deposit in the Mon-
azite Clustering Group. Thus, it has significant potential for future production. Never-
theless, the Bayan Obo deposit, although it ranks second, remains the biggest player
in the REE sector due to its high production rate and correspondingly large market
share.
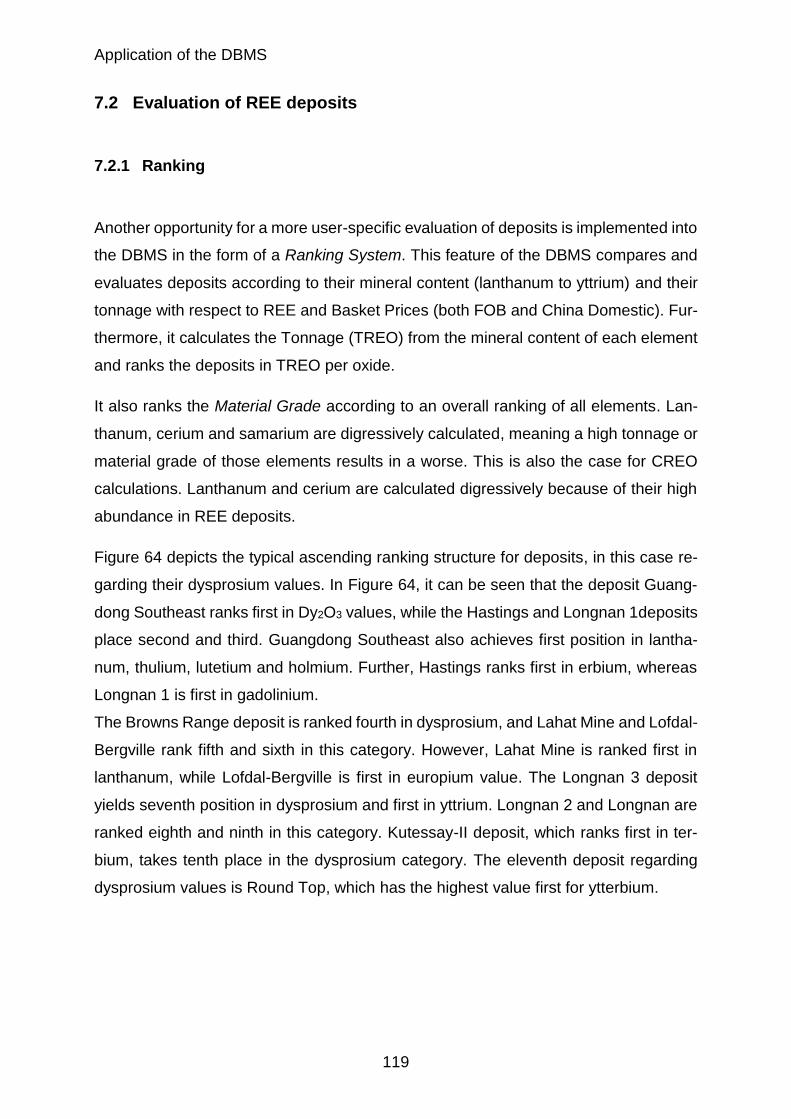
Application of the DBMS
119
7.2 Evaluation of REE deposits
7.2.1 Ranking
Another opportunity for a more user-specific evaluation of deposits is implemented into
the DBMS in the form of a Ranking System. This feature of the DBMS compares and
evaluates deposits according to their mineral content (lanthanum to yttrium) and their
tonnage with respect to REE and Basket Prices (both FOB and China Domestic). Fur-
thermore, it calculates the Tonnage (TREO) from the mineral content of each element
and ranks the deposits in TREO per oxide.
It also ranks the Material Grade according to an overall ranking of all elements. Lan-
thanum, cerium and samarium are digressively calculated, meaning a high tonnage or
material grade of those elements results in a worse. This is also the case for CREO
calculations. Lanthanum and cerium are calculated digressively because of their high
abundance in REE deposits.
Figure 64 depicts the typical ascending ranking structure for deposits, in this case re-
garding their dysprosium values. In Figure 64, it can be seen that the deposit Guang-
dong Southeast ranks first in Dy2O3 values, while the Hastings and Longnan 1deposits
place second and third. Guangdong Southeast also achieves first position in lantha-
num, thulium, lutetium and holmium. Further, Hastings ranks first in erbium, whereas
Longnan 1 is first in gadolinium.
The Browns Range deposit is ranked fourth in dysprosium, and Lahat Mine and Lofdal-
Bergville rank fifth and sixth in this category. However, Lahat Mine is ranked first in
lanthanum, while Lofdal-Bergville is first in europium value. The Longnan 3 deposit
yields seventh position in dysprosium and first in yttrium. Longnan 2 and Longnan are
ranked eighth and ninth in this category. Kutessay-II deposit, which ranks first in ter-
bium, takes tenth place in the dysprosium category. The eleventh deposit regarding
dysprosium values is Round Top, which has the highest value first for ytterbium.
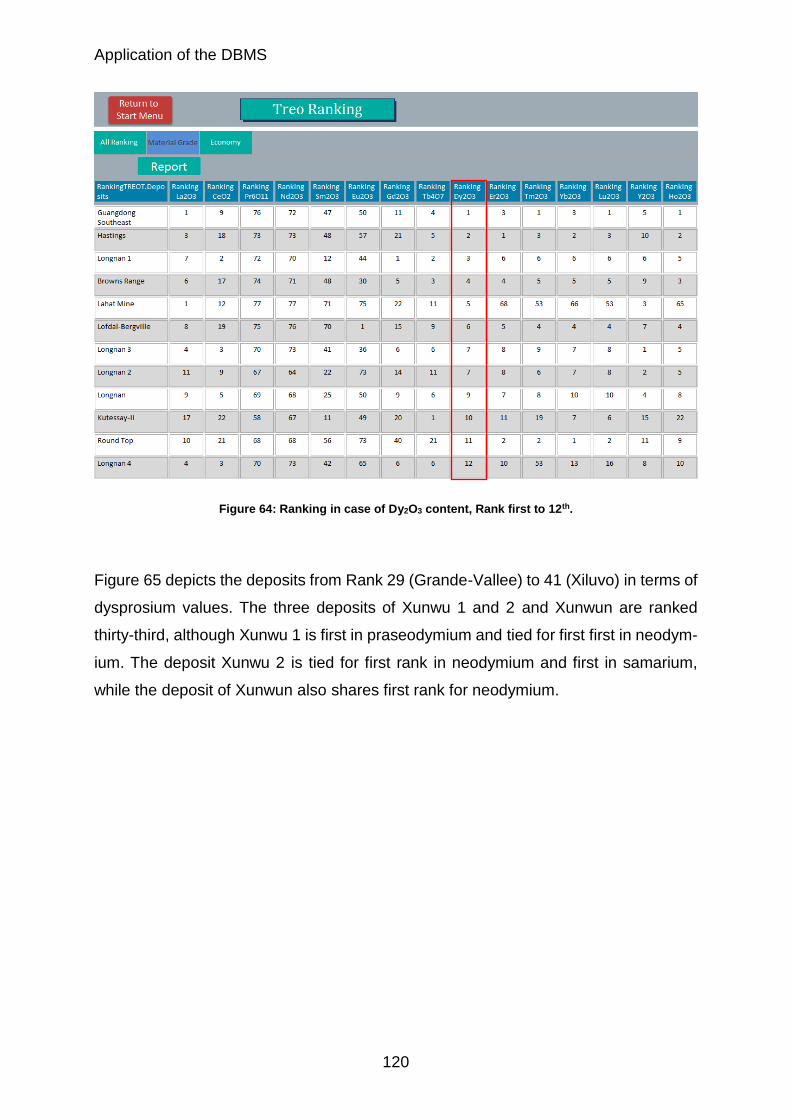
Application of the DBMS
120
Figure 64: Ranking in case of Dy2O3 content, Rank first to 12th.
Figure 65 depicts the deposits from Rank 29 (Grande-Vallee) to 41 (Xiluvo) in terms of
dysprosium values. The three deposits of Xunwu 1 and 2 and Xunwun are ranked
thirty-third, although Xunwu 1 is first in praseodymium and tied for first first in neodym-
ium. The deposit Xunwu 2 is tied for first rank in neodymium and first in samarium,
while the deposit of Xunwun also shares first rank for neodymium.
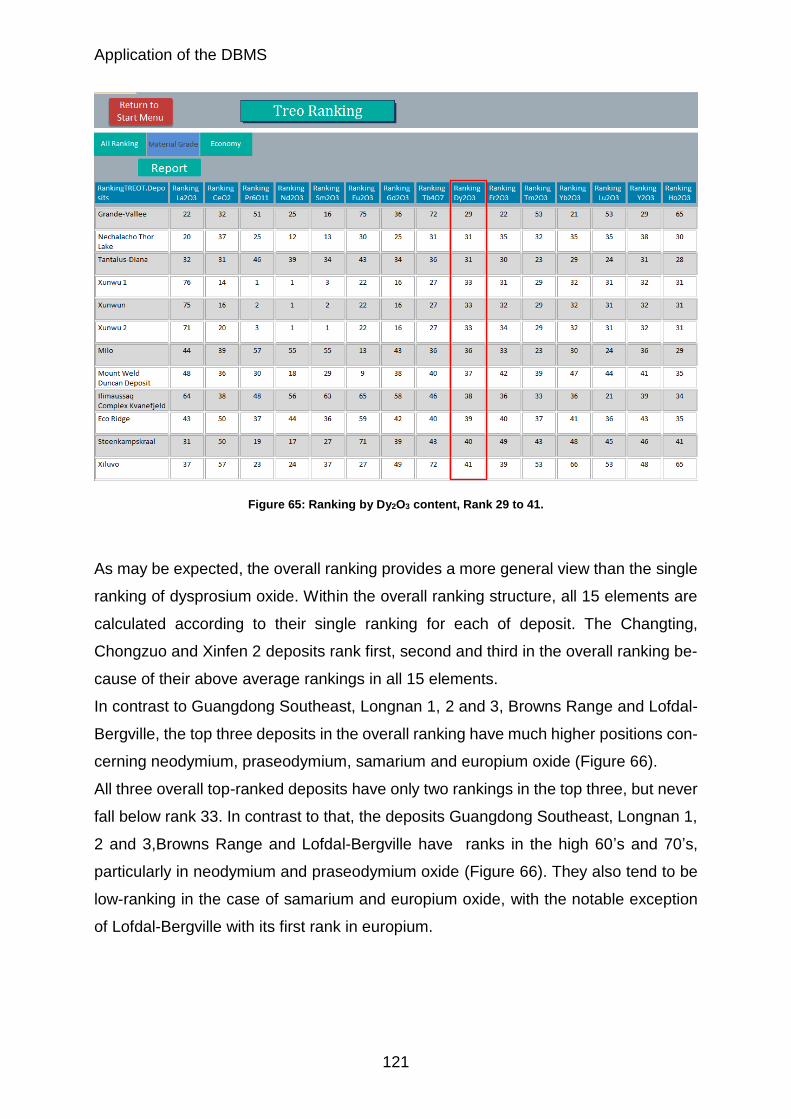
Application of the DBMS
121
Figure 65: Ranking by Dy2O3 content, Rank 29 to 41.
As may be expected, the overall ranking provides a more general view than the single
ranking of dysprosium oxide. Within the overall ranking structure, all 15 elements are
calculated according to their single ranking for each of deposit. The Changting,
Chongzuo and Xinfen 2 deposits rank first, second and third in the overall ranking be-
cause of their above average rankings in all 15 elements.
In contrast to Guangdong Southeast, Longnan 1, 2 and 3, Browns Range and Lofdal-
Bergville, the top three deposits in the overall ranking have much higher positions con-
cerning neodymium, praseodymium, samarium and europium oxide (Figure 66).
All three overall top-ranked deposits have only two rankings in the top three, but never
fall below rank 33. In contrast to that, the deposits Guangdong Southeast, Longnan 1,
2 and 3,Browns Range and Lofdal-Bergville have ranks in the high 60’s and 70’s,
particularly in neodymium and praseodymium oxide (Figure 66). They also tend to be
low-ranking in the case of samarium and europium oxide, with the notable exception
of Lofdal-Bergville with its first rank in europium.
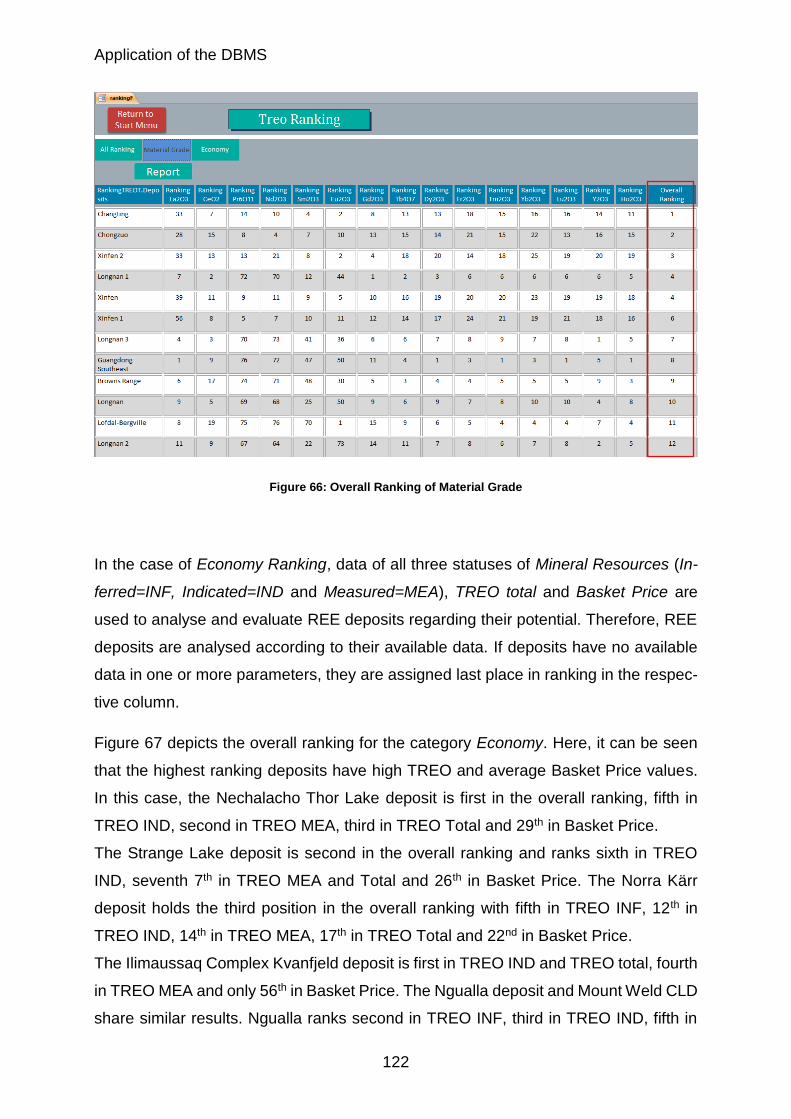
Application of the DBMS
122
Figure 66: Overall Ranking of Material Grade
In the case of Economy Ranking, data of all three statuses of Mineral Resources (In-
ferred=INF, Indicated=IND and Measured=MEA), TREO total and Basket Price are
used to analyse and evaluate REE deposits regarding their potential. Therefore, REE
deposits are analysed according to their available data. If deposits have no available
data in one or more parameters, they are assigned last place in ranking in the respec-
tive column.
Figure 67 depicts the overall ranking for the category Economy. Here, it can be seen
that the highest ranking deposits have high TREO and average Basket Price values.
In this case, the Nechalacho Thor Lake deposit is first in the overall ranking, fifth in
TREO IND, second in TREO MEA, third in TREO Total and 29th in Basket Price.
The Strange Lake deposit is second in the overall ranking and ranks sixth in TREO
IND, seventh 7th in TREO MEA and Total and 26th in Basket Price. The Norra Kärr
deposit holds the third position in the overall ranking with fifth in TREO INF, 12th in
TREO IND, 14th in TREO MEA, 17th in TREO Total and 22nd in Basket Price.
The Ilimaussaq Complex Kvanfjeld deposit is first in TREO IND and TREO total, fourth
in TREO MEA and only 56th in Basket Price. The Ngualla deposit and Mount Weld CLD
share similar results. Ngualla ranks second in TREO INF, third in TREO IND, fifth in
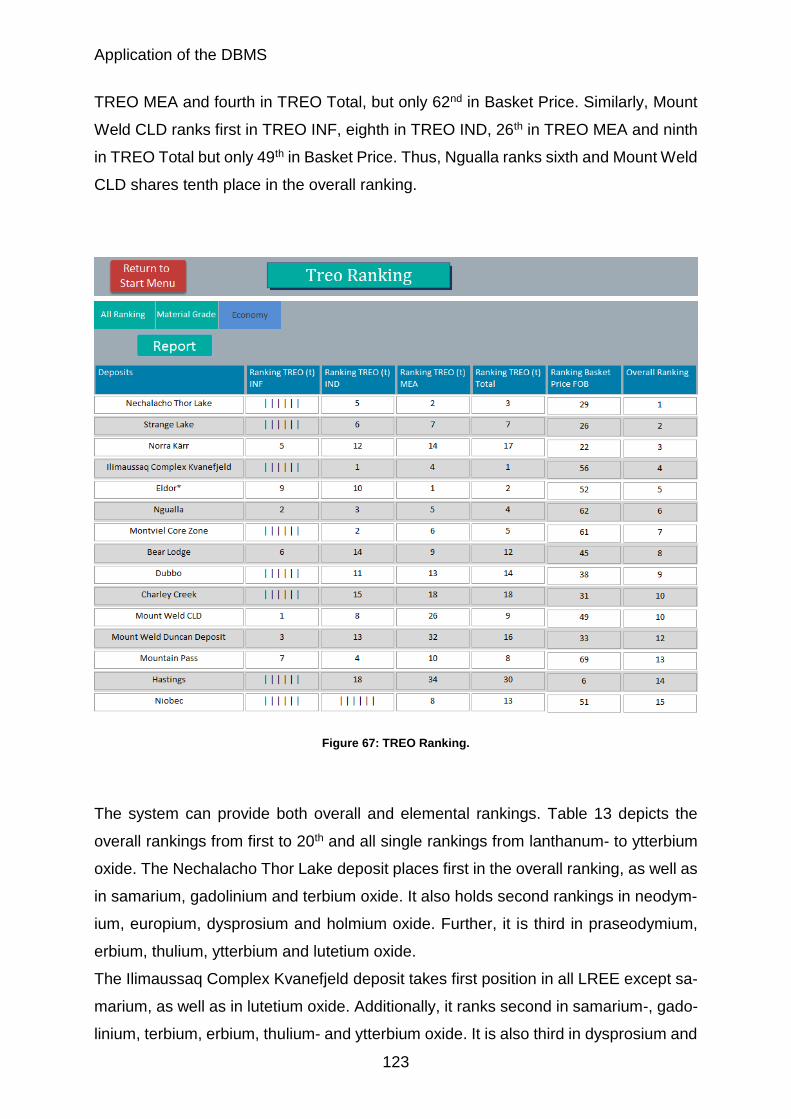
Application of the DBMS
123
TREO MEA and fourth in TREO Total, but only 62nd in Basket Price. Similarly, Mount
Weld CLD ranks first in TREO INF, eighth in TREO IND, 26th in TREO MEA and ninth
in TREO Total but only 49th in Basket Price. Thus, Ngualla ranks sixth and Mount Weld
CLD shares tenth place in the overall ranking.
Figure 67: TREO Ranking.
The system can provide both overall and elemental rankings. Table 13 depicts the
overall rankings from first to 20th and all single rankings from lanthanum- to ytterbium
oxide. The Nechalacho Thor Lake deposit places first in the overall ranking, as well as
in samarium, gadolinium and terbium oxide. It also holds second rankings in neodym-
ium, europium, dysprosium and holmium oxide. Further, it is third in praseodymium,
erbium, thulium, ytterbium and lutetium oxide.
The Ilimaussaq Complex Kvanefjeld deposit takes first position in all LREE except sa-
marium, as well as in lutetium oxide. Additionally, it ranks second in samarium-, gado-
linium, terbium, erbium, thulium- and ytterbium oxide. It is also third in dysprosium and
Application of the DBMS
124
holmium oxide, but only sixth in europium oxide. Due to these relatively high values,
the Kvanefjeld deposit ranks second in the overall ranking.
The third in the overall ranking is the deposit of Strange Lake. It places first in dyspro-
sium to ytterbium oxide, second in lutetium and third in gadolinium and terbium oxide.
In the LREE and europium oxide, it attains ratings in the sixth position or lower. The
major deposits outside China, Mount Weld CLD and Mountain Pass, come in 14th and
19th, respectively.
As described, the Ranking system for TREO per single element directly calculates and
evaluates the deposits with the highest values in all single categories. The system also
gives information regarding whether the deposit is a good LREE/ HREE source. Nev-
ertheless, this particular systematization only takes deposits with available TREO data
into account. The Chinese deposits with no available data on TREO cannot be evalu-
ated using this method.
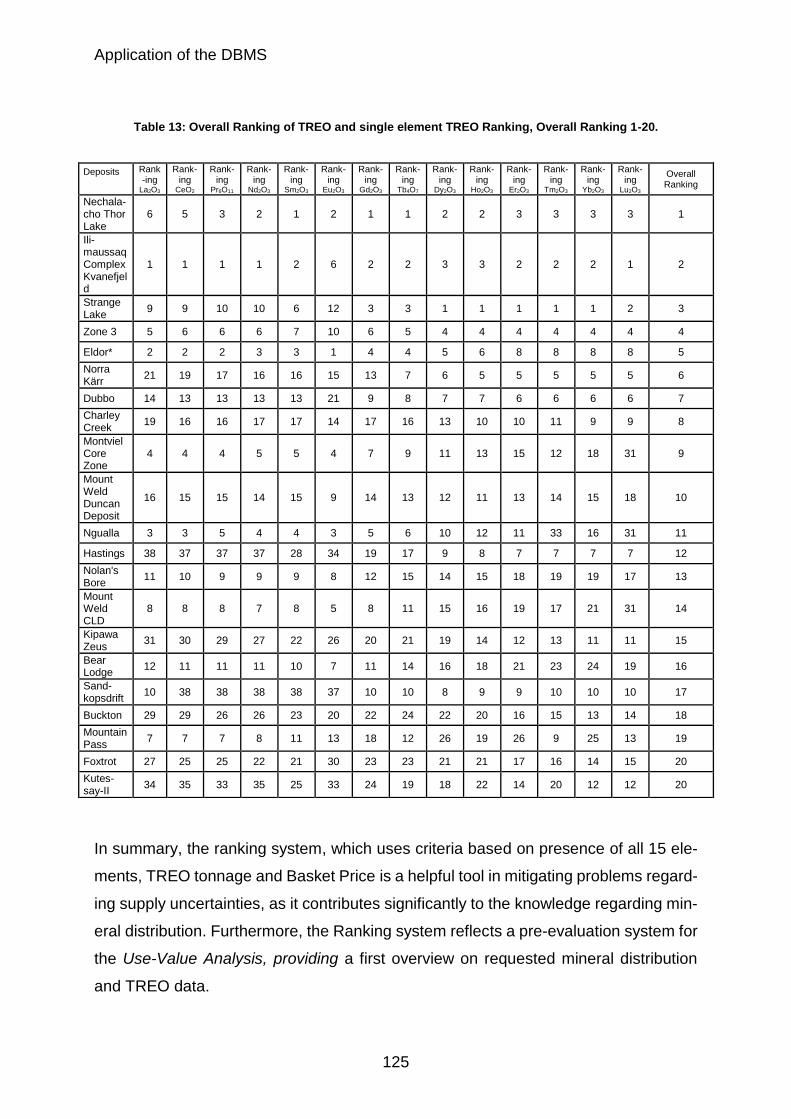
Application of the DBMS
125
Table 13: Overall Ranking of TREO and single element TREO Ranking, Overall Ranking 1-20.
In summary, the ranking system, which uses criteria based on presence of all 15 ele-
ments, TREO tonnage and Basket Price is a helpful tool in mitigating problems regard-
ing supply uncertainties, as it contributes significantly to the knowledge regarding min-
eral distribution. Furthermore, the Ranking system reflects a pre-evaluation system for
the Use-Value Analysis, providing a first overview on requested mineral distribution
and TREO data.
Deposits Rank-ing
La2O3
Rank-ing
CeO2
Rank-ing
Pr6O11
Rank-ing
Nd2O3
Rank-ing
Sm2O3
Rank-ing
Eu2O3
Rank-ing
Gd2O3
Rank-ing
Tb4O7
Rank-ing
Dy2O3
Rank-ing
Ho2O3
Rank-ing
Er2O3
Rank-ing
Tm2O3
Rank-ing
Yb2O3
Rank-ing
Lu2O3
Overall Ranking
Nechala-cho Thor Lake
6 5 3 2 1 2 1 1 2 2 3 3 3 3 1
Ili-maussaq Complex Kvanefjeld
1 1 1 1 2 6 2 2 3 3 2 2 2 1 2
Strange Lake
9 9 10 10 6 12 3 3 1 1 1 1 1 2 3
Zone 3 5 6 6 6 7 10 6 5 4 4 4 4 4 4 4
Eldor* 2 2 2 3 3 1 4 4 5 6 8 8 8 8 5
Norra Kärr
21 19 17 16 16 15 13 7 6 5 5 5 5 5 6
Dubbo 14 13 13 13 13 21 9 8 7 7 6 6 6 6 7
Charley Creek
19 16 16 17 17 14 17 16 13 10 10 11 9 9 8
Montviel Core Zone
4 4 4 5 5 4 7 9 11 13 15 12 18 31 9
Mount Weld Duncan Deposit
16 15 15 14 15 9 14 13 12 11 13 14 15 18 10
Ngualla 3 3 5 4 4 3 5 6 10 12 11 33 16 31 11
Hastings 38 37 37 37 28 34 19 17 9 8 7 7 7 7 12
Nolan's Bore
11 10 9 9 9 8 12 15 14 15 18 19 19 17 13
Mount Weld CLD
8 8 8 7 8 5 8 11 15 16 19 17 21 31 14
Kipawa Zeus
31 30 29 27 22 26 20 21 19 14 12 13 11 11 15
Bear Lodge
12 11 11 11 10 7 11 14 16 18 21 23 24 19 16
Sand-kopsdrift
10 38 38 38 38 37 10 10 8 9 9 10 10 10 17
Buckton 29 29 26 26 23 20 22 24 22 20 16 15 13 14 18
Mountain Pass
7 7 7 8 11 13 18 12 26 19 26 9 25 13 19
Foxtrot 27 25 25 22 21 30 23 23 21 21 17 16 14 15 20
Kutes-say-II
34 35 33 35 25 33 24 19 18 22 14 20 12 12 20
Application of the DBMS
126
7.2.2 Use-Value Analysis
The Use-Value Analysis is the dynamic evaluation system in the DBMS. In this chapter,
REE deposits are analysed according to the attributes Material Grade, Economy and
Mining.
Test cases are generated by the evaluation system of the Use-Value Analysis. These
case studies are created by changing percentage values in three stages (I. – III.). The
Goal Criteria as well as I. and II. Sub-Goal Criteria can be changed by altering both
stages feature (cf. Figure 55) and percentage matrix (cf. Figure 52). In the case of the
Goal Criteria, there are three opportunities (Material Grade, Economy and Mining) to
change the percentage value. Additionally, one can adjust Mineral Contents, Deleteri-
ous Elements, TREO Tonnage, Basket Prices and REE Production in the section I.
Sub-Goal Criterion. In the third stage, the II. Sub-Goal Criterion, percentages are cal-
culated by diversifying the Percentage Matrix.
Use Case I functions as a basic scenario for the Use-Value Analysis. Table 14 illus-
trates the first case; the Goal Criteria Material Grade, Economy and Mining are equal
in percentage, therefore sharing the same importance, with a value of 33.33 %. All
attributes of the I. Sub-Goal Criterion are also equal at 50 %. Finally, attributes of the
third stage are weighted according to their general importance.
The elements oxides La2O3, CeO2 and Sm2O3 have a digressive value due to their non-
criticality (cf. 2.3.2) and high abundance in any deposit (cf. 3.4.1), which result in low
Basket Prices (cf. 4.1.3). All other REE elements, neodymium, praseodymium, HREE
and yttrium are assigned the same percentage proportions. The ratio of thorium to
uranium is set at 2:1 (66.67 & vs. 33.33 %) because of the more problematic handling
of thorium for processing and separating (cf. 3.1). The attributes TERO (t) INF to MEA
and Total are weighted by their level of precision (cf. 3.3.1). Furthermore, the features
of the Basket Price are weighted equally due to their important positions. The attribute
Actual Production has a higher value in percentage than Historical Production. Never-
theless, Historical Production is still important for to potential analysis of deposits (cf.
3.4.1, Mountain Pass).
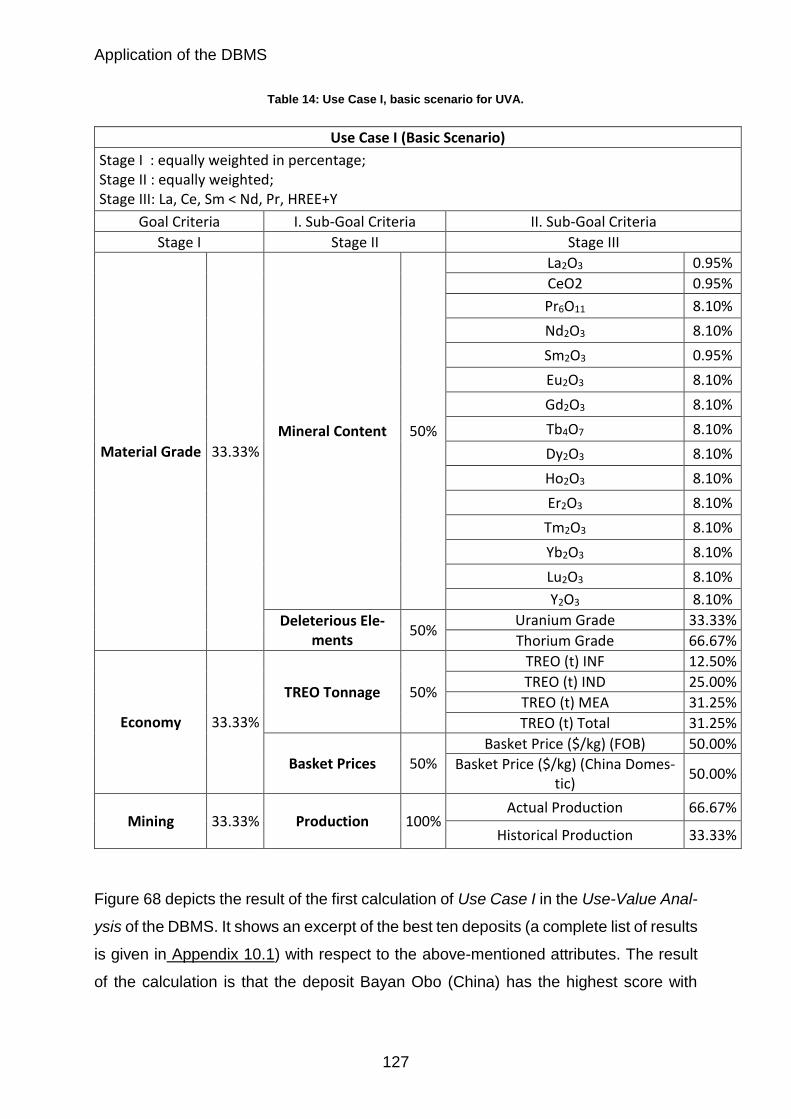
Application of the DBMS
127
Table 14: Use Case I, basic scenario for UVA.
Use Case I (Basic Scenario)
Stage I : equally weighted in percentage; Stage II : equally weighted; Stage III: La, Ce, Sm < Nd, Pr, HREE+Y
Goal Criteria I. Sub-Goal Criteria II. Sub-Goal Criteria
Stage I Stage II Stage III
Material Grade 33.33%
Mineral Content 50%
La2O3 0.95%
CeO2 0.95%
Pr6O11 8.10%
Nd2O3 8.10%
Sm2O3 0.95%
Eu2O3 8.10%
Gd2O3 8.10%
Tb4O7 8.10%
Dy2O3 8.10%
Ho2O3 8.10%
Er2O3 8.10%
Tm2O3 8.10%
Yb2O3 8.10%
Lu2O3 8.10%
Y2O3 8.10%
Deleterious Ele-ments
50% Uranium Grade 33.33%
Thorium Grade 66.67%
Economy 33.33%
TREO Tonnage 50%
TREO (t) INF 12.50%
TREO (t) IND 25.00%
TREO (t) MEA 31.25%
TREO (t) Total 31.25%
Basket Prices 50% Basket Price ($/kg) (FOB) 50.00%
Basket Price ($/kg) (China Domes-tic)
50.00%
Mining 33.33% Production 100% Actual Production 66.67%
Historical Production 33.33%
Figure 68 depicts the result of the first calculation of Use Case I in the Use-Value Anal-
ysis of the DBMS. It shows an excerpt of the best ten deposits (a complete list of results
is given in Appendix 10.1) with respect to the above-mentioned attributes. The result
of the calculation is that the deposit Bayan Obo (China) has the highest score with
Application of the DBMS
128
6.1095 points, approximately 2.1 points above the score of the second deposit, Moun-
tain Pass (4.0167 points). This large difference highlights the superior position of
Bayan Obo under the circumstances used in this basic use case.
Also among the best ten deposits in the results are the Chinese IAC deposits; Chang-
ting ranks third (3.7865 points), Longnan 1 takes the fourth position with 3.7410 points,
Guangdong Southeast ranks sixth with 3.6658 points, Chongzuo takes eighth position
with 3.6101points and Xinfen 1 ranks tenth with 3.5441 points. The potential Heavy
REE deposit Lofdal-Bergville is ranked fifth with a result of 3.6775 points, whereas the
deposits at Browns Range (3.6376 points) and Hastings (3.5597 points) rank in the
seventh and ninth positions, respectively (Figure 68).
Other prospects of interest are the deposits Xinfen and Xinfen 2, which are ranked 13th
with 3.4851 points and 17th with 3.4203 points (cf. Appendix 10.7). Further, the three
South Chinese deposits Longnan, Longnan 2 and 3 are ranked 15th (3.4437 points),
16th (3.4225 points) and 18th (3.3798 points) (cf. Appendix 10.7). The IAC deposits at
Xunwu – Xunwun, Xunwu 1 and 2 – take 21st, 22nd and 23rd position, with point scores
in the range of 3.2682 – 3.2524 points (cf. Appendix 10.7).
The Nechalacho Thor Lake deposit ranks 14th with 3.4625 points, while Ilimaussaq
Complex is in 19th place with 3.3468 points (cf. Appendix 10.7). The other potential
deposit, Ngualla, ranks 20th with 3.2970 points (cf. Appendix 10.7).
However, the producing deposit Mount Weld CLD only attains 24th place in this use
case. It scores 3.1615 points, only half the points awarded to Bayan Obo. The potential
HREE deposits atStrange Lake and Norra Kärr, as well as the producing IAC deposit
Longnan 4 are placed 25th, 27th and 31st, respectively.
The potential deposit Dubbo and the producing deposit at Maoniuping achieve still a
worse rank, at 61st (2.2035 points) and 69th (1.9928 points) place, respectively.
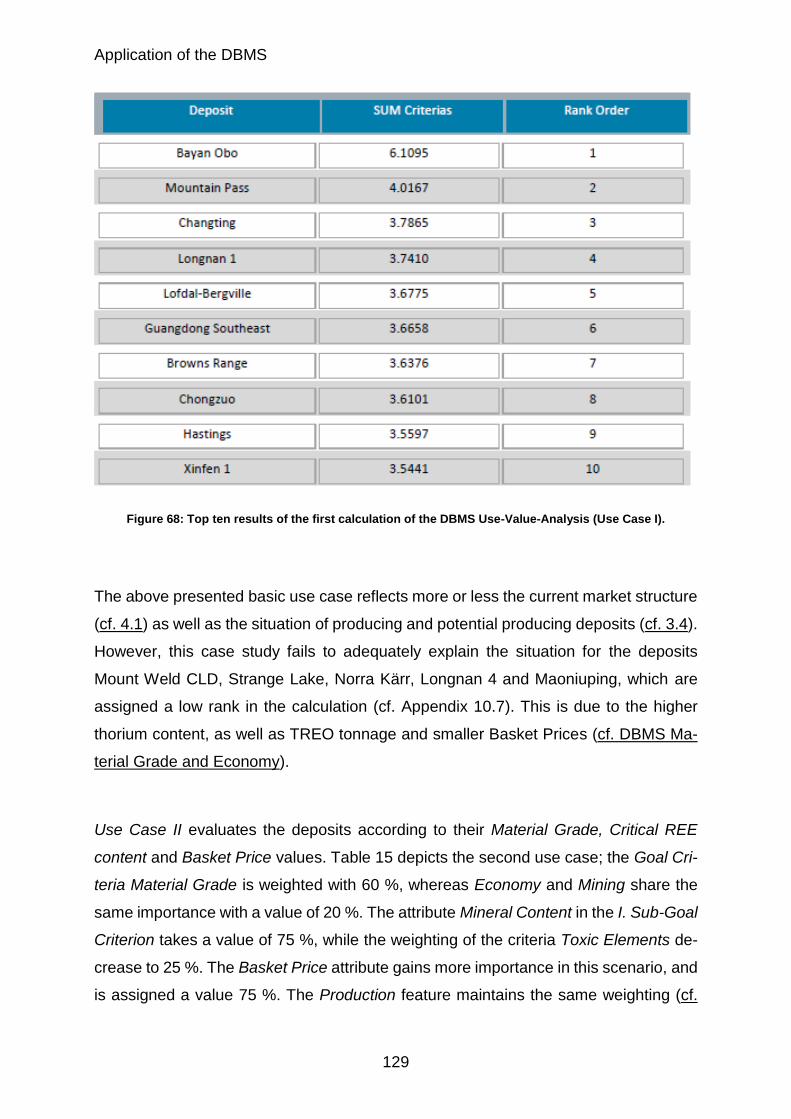
Application of the DBMS
129
Figure 68: Top ten results of the first calculation of the DBMS Use-Value-Analysis (Use Case I).
The above presented basic use case reflects more or less the current market structure
(cf. 4.1) as well as the situation of producing and potential producing deposits (cf. 3.4).
However, this case study fails to adequately explain the situation for the deposits
Mount Weld CLD, Strange Lake, Norra Kärr, Longnan 4 and Maoniuping, which are
assigned a low rank in the calculation (cf. Appendix 10.7). This is due to the higher
thorium content, as well as TREO tonnage and smaller Basket Prices (cf. DBMS Ma-
terial Grade and Economy).
Use Case II evaluates the deposits according to their Material Grade, Critical REE
content and Basket Price values. Table 15 depicts the second use case; the Goal Cri-
teria Material Grade is weighted with 60 %, whereas Economy and Mining share the
same importance with a value of 20 %. The attribute Mineral Content in the I. Sub-Goal
Criterion takes a value of 75 %, while the weighting of the criteria Toxic Elements de-
crease to 25 %. The Basket Price attribute gains more importance in this scenario, and
is assigned a value 75 %. The Production feature maintains the same weighting (cf.
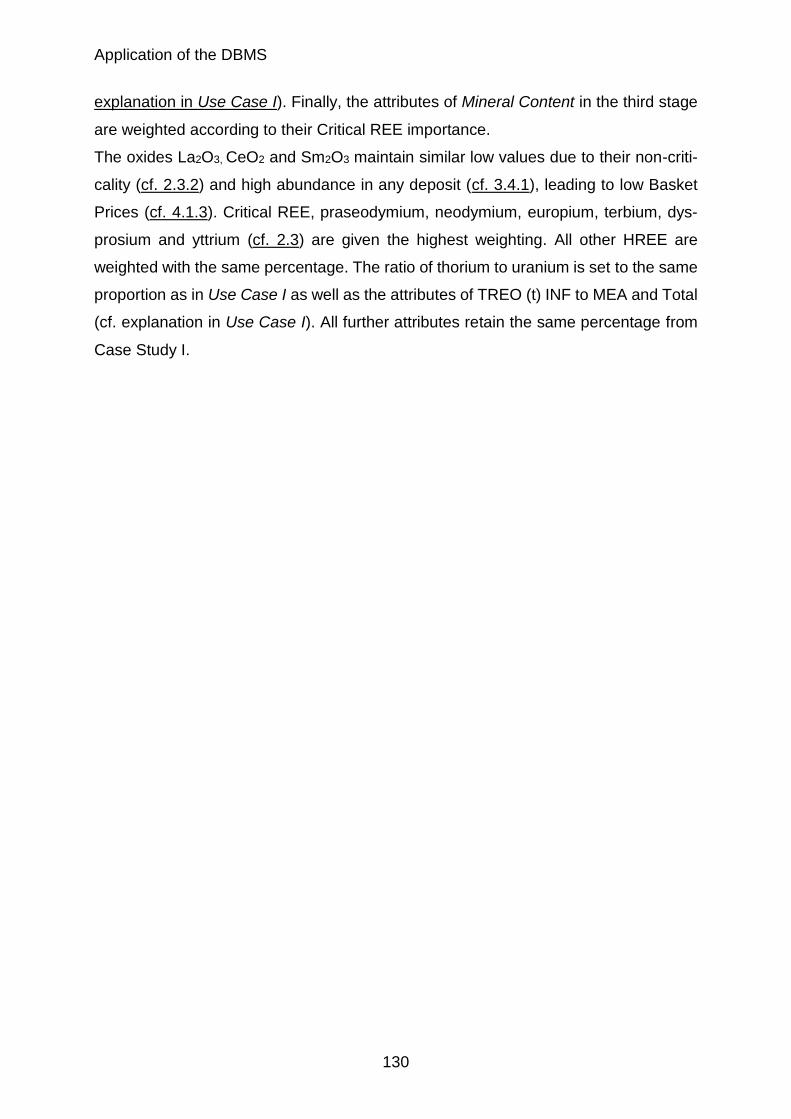
Application of the DBMS
130
explanation in Use Case I). Finally, the attributes of Mineral Content in the third stage
are weighted according to their Critical REE importance.
The oxides La2O3, CeO2 and Sm2O3 maintain similar low values due to their non-criti-
cality (cf. 2.3.2) and high abundance in any deposit (cf. 3.4.1), leading to low Basket
Prices (cf. 4.1.3). Critical REE, praseodymium, neodymium, europium, terbium, dys-
prosium and yttrium (cf. 2.3) are given the highest weighting. All other HREE are
weighted with the same percentage. The ratio of thorium to uranium is set to the same
proportion as in Use Case I as well as the attributes of TREO (t) INF to MEA and Total
(cf. explanation in Use Case I). All further attributes retain the same percentage from
Case Study I.
Application of the DBMS
131
Table 15: Use Case II, Material Grade and CREE scenario for UVA.
Use Case II (Material Grade; Critical REE and Basket Price)
Stage I : Material Grade higher weighted; Stage II : Mineral Content higher weighted; Basket Prices higher weighted; Stage III: Critical elements are higher weighted: La, Ce, Sm < HREE < Critical Elements (Nd, Pr, Eu, Dy, Tb, Y)
Goal Criteria I. Sub-Goal Criteria II. Sub-Goal Criteria
Stage I Stage II Stage III
Material Grade 60%
Mineral Content 75%
La2O3 1.00%
CeO2 1.00%
Pr6O11 11.50%
Nd2O3 11.50%
Sm2O3 1.00%
Eu2O3 11.50%
Gd2O3 6.00%
Tb4O7 11.50%
Dy2O3 11.50%
Ho2O3 5.50%
Er2O3 5.50%
Tm2O3 5.50%
Yb2O3 5.50%
Lu2O3 5.50%
Y2O3 6.00%
Deleterious Ele-ments
25% Uranium Grade 33.33%
Thorium Grade 66.67%
Economy 20%
TREO Tonnage 25%
TREO (t) INF 12.50%
TREO (t) IND 25.00%
TREO (t) MEA 31.25%
TREO (t) Total 31.25%
Basket Prices 75% Basket Price ($/kg) (FOB) 50.00%
Basket Price ($/kg) (China Domes-tic)
50.00%
Mining 20% Production 100% Actual Production 66.67%
Historical Production 33.33%
The results of Use Case II are listed in Figure 69. In this scenario, which focuses more
on Material Grade and less on Economy and Mining, the deposits with high HREE
content achieve the highest rank.
The best-ranked deposit is the IAC deposit Guangdong Southeast with 5.6143 points.
The Changting deposit is second with 5.5857 points, followed by the best non-Chinese
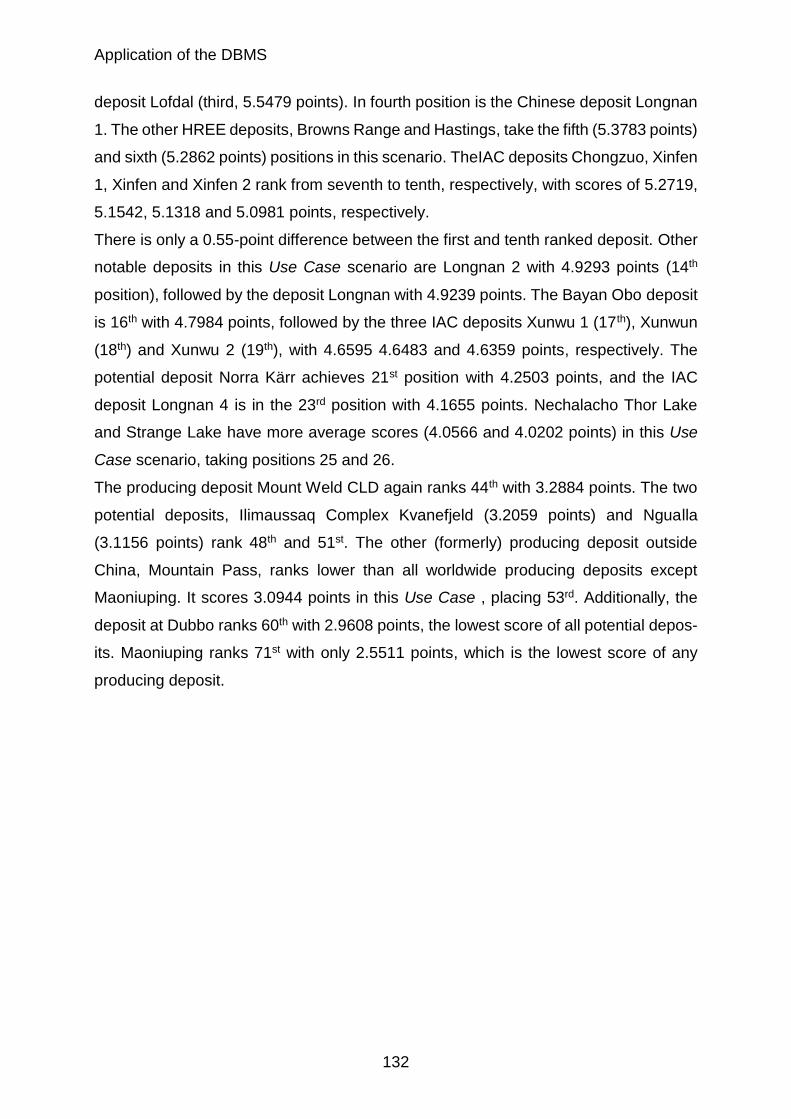
Application of the DBMS
132
deposit Lofdal (third, 5.5479 points). In fourth position is the Chinese deposit Longnan
1. The other HREE deposits, Browns Range and Hastings, take the fifth (5.3783 points)
and sixth (5.2862 points) positions in this scenario. TheIAC deposits Chongzuo, Xinfen
1, Xinfen and Xinfen 2 rank from seventh to tenth, respectively, with scores of 5.2719,
5.1542, 5.1318 and 5.0981 points, respectively.
There is only a 0.55-point difference between the first and tenth ranked deposit. Other
notable deposits in this Use Case scenario are Longnan 2 with 4.9293 points (14th
position), followed by the deposit Longnan with 4.9239 points. The Bayan Obo deposit
is 16th with 4.7984 points, followed by the three IAC deposits Xunwu 1 (17th), Xunwun
(18th) and Xunwu 2 (19th), with 4.6595 4.6483 and 4.6359 points, respectively. The
potential deposit Norra Kärr achieves 21st position with 4.2503 points, and the IAC
deposit Longnan 4 is in the 23rd position with 4.1655 points. Nechalacho Thor Lake
and Strange Lake have more average scores (4.0566 and 4.0202 points) in this Use
Case scenario, taking positions 25 and 26.
The producing deposit Mount Weld CLD again ranks 44th with 3.2884 points. The two
potential deposits, Ilimaussaq Complex Kvanefjeld (3.2059 points) and Ngualla
(3.1156 points) rank 48th and 51st. The other (formerly) producing deposit outside
China, Mountain Pass, ranks lower than all worldwide producing deposits except
Maoniuping. It scores 3.0944 points in this Use Case , placing 53rd. Additionally, the
deposit at Dubbo ranks 60th with 2.9608 points, the lowest score of all potential depos-
its. Maoniuping ranks 71st with only 2.5511 points, which is the lowest score of any
producing deposit.
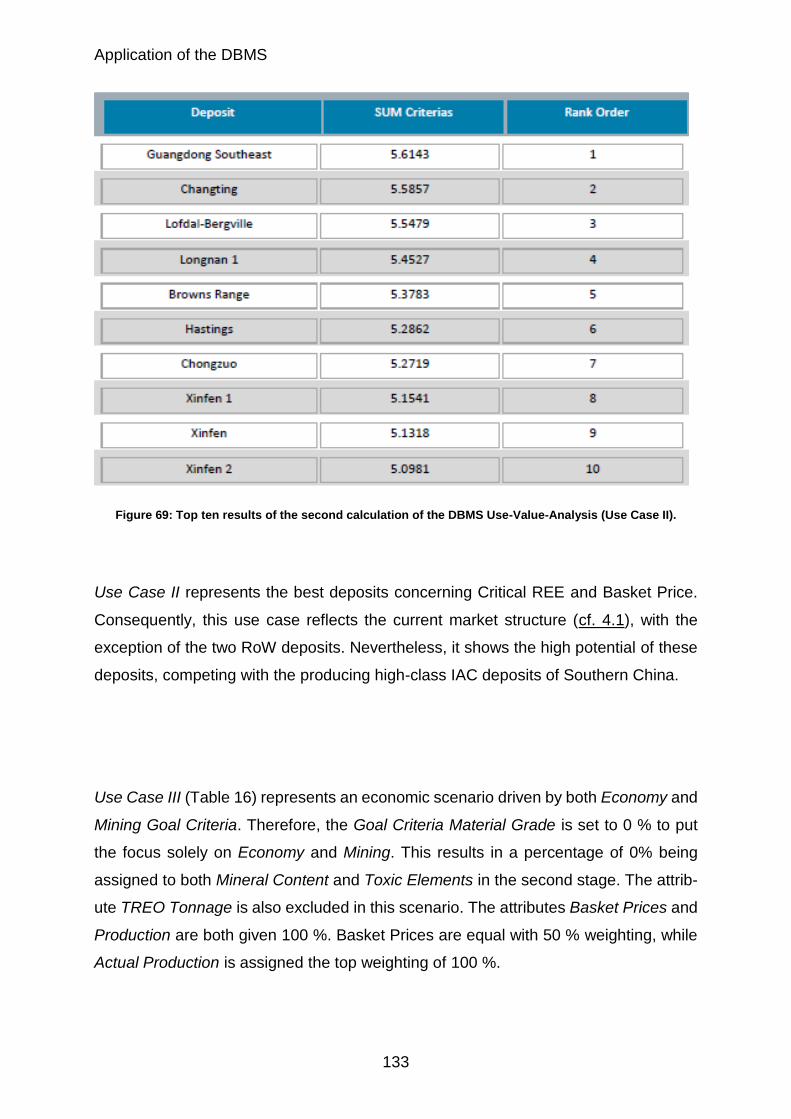
Application of the DBMS
133
Figure 69: Top ten results of the second calculation of the DBMS Use-Value-Analysis (Use Case II).
Use Case II represents the best deposits concerning Critical REE and Basket Price.
Consequently, this use case reflects the current market structure (cf. 4.1), with the
exception of the two RoW deposits. Nevertheless, it shows the high potential of these
deposits, competing with the producing high-class IAC deposits of Southern China.
Use Case III (Table 16) represents an economic scenario driven by both Economy and
Mining Goal Criteria. Therefore, the Goal Criteria Material Grade is set to 0 % to put
the focus solely on Economy and Mining. This results in a percentage of 0% being
assigned to both Mineral Content and Toxic Elements in the second stage. The attrib-
ute TREO Tonnage is also excluded in this scenario. The attributes Basket Prices and
Production are both given 100 %. Basket Prices are equal with 50 % weighting, while
Actual Production is assigned the top weighting of 100 %.
Application of the DBMS
134
Table 16: Use Case III, Economy, Basket Prices and Production.
Use Case III (Economy - Basket Prices - Production)
Stage I : Economy = Mining > Material Grade; Stage II : Basket Prices & Production = 100%; other = 0%; Stage III: Basket Price FOB & China = 50%; Production = 100 %
Goal Criteria I. Sub-Goal Criteria II. Sub-Goal Criteria
Stage I Stage II Stage III
Material Grade 0%
Mineral Content 0%
La2O3 0.00%
CeO2 0.00%
Pr6O11 0.00%
Nd2O3 0.00%
Sm2O3 0.00%
Eu2O3 0.00%
Gd2O3 0.00%
Tb4O7 0.00%
Dy2O3 0.00%
Ho2O3 0.00%
Er2O3 0.00%
Tm2O3 0.00%
Yb2O3 0.00%
Lu2O3 0.00%
Y2O3 0.00%
Deleterious Elements
0% Uranium Grade 0.00%
Thorium Grade 0.00%
Economy 50%
TREO Tonnage 0%
TREO (t) INF 0.00%
TREO (t) IND 0.00%
TREO (t) MEA 0.00%
TREO (t) Total 0.00%
Basket Prices 100% Basket Price ($/kg) (FOB) 50.00%
Basket Price ($/kg) (China Domes-tic)
50.00%
Mining 50% Production 100% Actual Production 100.00%
Historical Production 0.00%
The results of Figure 70 show the result of combining the Basket Price and Production
attributes. This use case shows a slightly different result than Use Case I, except in
the case of Mountain Pass and Ilimaussaq Complex Kvanfjeld.
Once again, Bayan Obo (6.3897 points) tops this list, leading the next competitor by
1.535 points. In rank 2 to 8 are the typical HREE deposits Lofdal-Bergville, Browns
Range and the Chinese IAC deposits Changting, Longnan 1, Chongzuo, Guangdong
Application of the DBMS
135
Southeast, and Xinfen 1. The LREE deposit at Guangdong (4.2561 points) and the
HREE deposit Kutessay II (4.2337 points) take ranks 9 and 10.
All other Chinese IAC deposits are ranked from 12th to 19th, except Longnan 4, which
is ranked 26th with 2.7368 points. The deposit Xinfen is ranked 12th with 4.1669 points,
followed by Longnan 2 with 4.0207 points. Xinfen 2 is ranked 14th with 3.9957 points
and with a gap of 0.05 points, the deposit Longnan 3 is in 15th position with 3.9415
points. Longnan is ranked 16th with 3.8459. Another 0.12 points behind Longnan, is
the deposit Xunwu 1, which is ranked 17th (3.7289 points). Xunwun and Xunwu 1 are
ranked 18th and 19th with 3.7023 and 3.6744 points.
The potential deposit Norra Kärr is ranked 22nd in this use case due to its high Basket
Price value. The high potential HREE deposits Nechalacho Thor Lake and Strange
Lake are in 31st and 32nd rank in this Use Case with 2.5551 and 2.5431 points. Fur-
thermore, the high potential and currently producing deposit Mount Weld CLD takes
position 36. The position of Mount Weld CLD reflects its low Basket Price value in
comparison to that of the highest ranking deposit, Bayan Obo, as well as the other high
potential HREE and IAC deposits.
The potential deposit at Dubbo is ranked 44th with 1.7976 points. Further, the potential
deposit Ngualla places 60th with 1.3114 points, whereas the high potential deposit Ili-
maussaq Complex Kvanefjeld - in case of TREO – takes the 62nd position with only
1.2792 points. The (formerly) producing deposit Mountain Pass is missing in the rank
order 1-10, and is in fact ranked 64th with only 1.1604 points, due to the low Basket
Price. The producing Chinese LREE deposit Maoniuping is only 69th with 0.8963 points
due to a very small Basket Price value and missing production data.
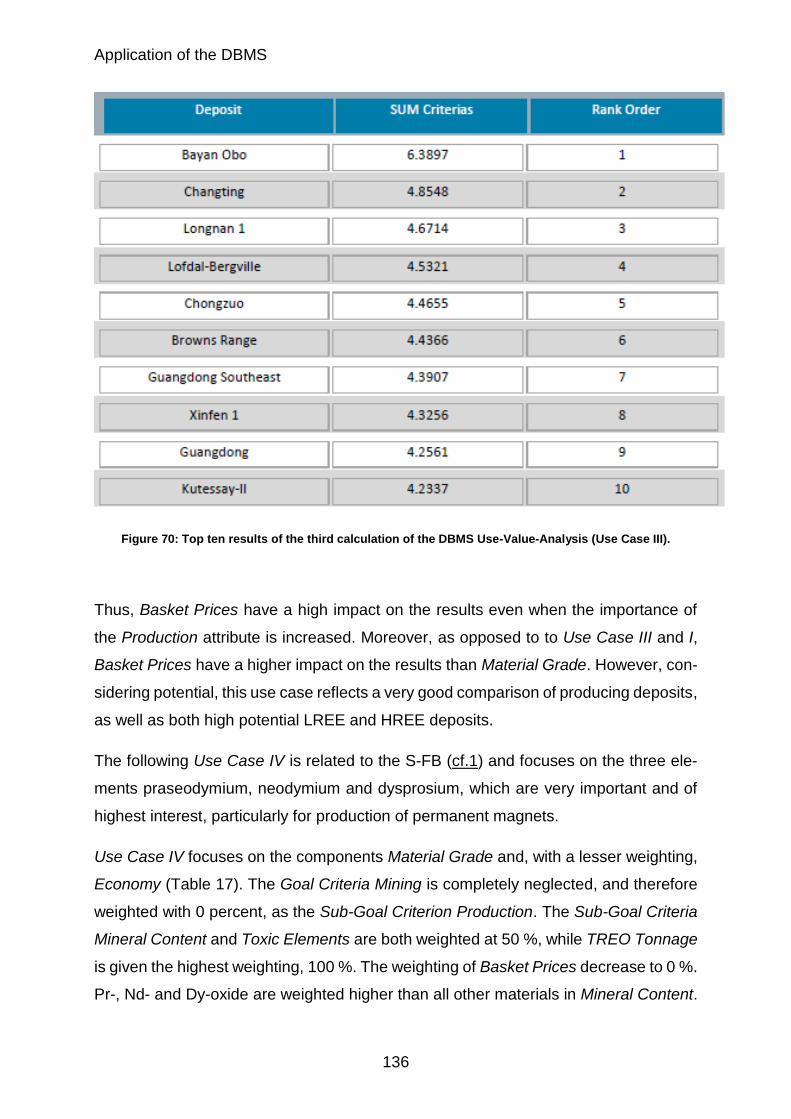
Application of the DBMS
136
Figure 70: Top ten results of the third calculation of the DBMS Use-Value-Analysis (Use Case III).
Thus, Basket Prices have a high impact on the results even when the importance of
the Production attribute is increased. Moreover, as opposed to to Use Case III and I,
Basket Prices have a higher impact on the results than Material Grade. However, con-
sidering potential, this use case reflects a very good comparison of producing deposits,
as well as both high potential LREE and HREE deposits.
The following Use Case IV is related to the S-FB (cf.1) and focuses on the three ele-
ments praseodymium, neodymium and dysprosium, which are very important and of
highest interest, particularly for production of permanent magnets.
Use Case IV focuses on the components Material Grade and, with a lesser weighting,
Economy (Table 17). The Goal Criteria Mining is completely neglected, and therefore
weighted with 0 percent, as the Sub-Goal Criterion Production. The Sub-Goal Criteria
Mineral Content and Toxic Elements are both weighted at 50 %, while TREO Tonnage
is given the highest weighting, 100 %. The weighting of Basket Prices decrease to 0 %.
Pr-, Nd- and Dy-oxide are weighted higher than all other materials in Mineral Content.
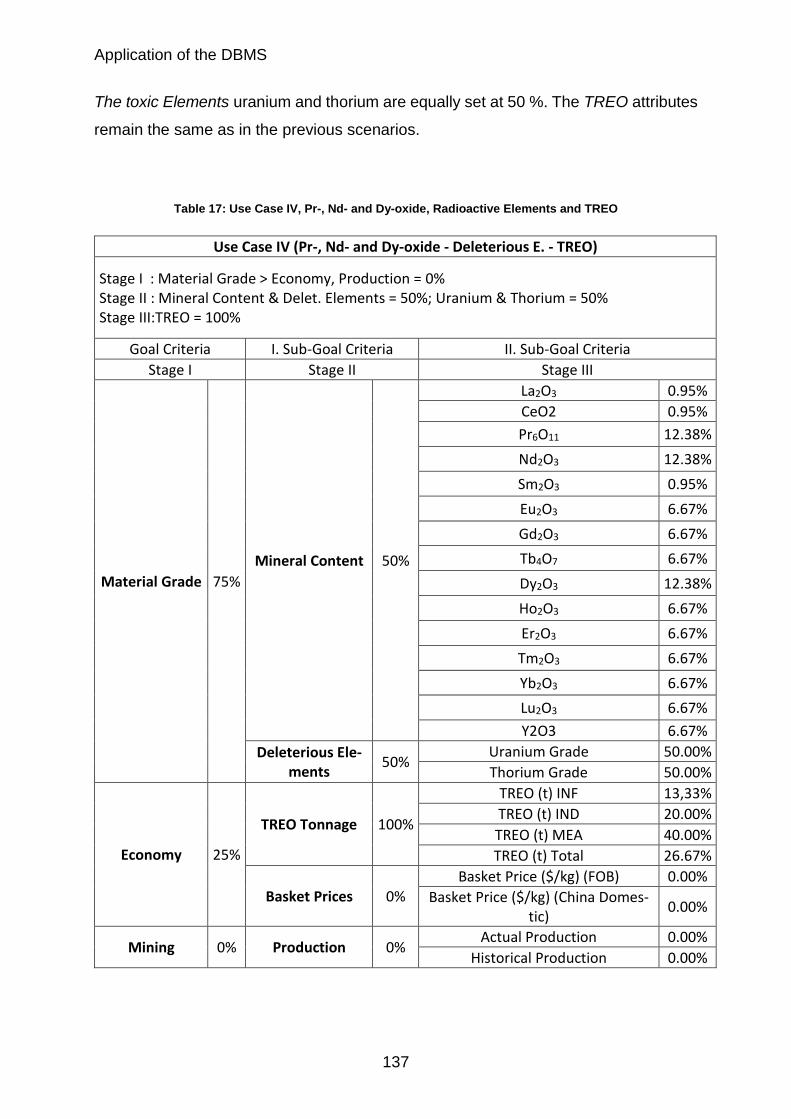
Application of the DBMS
137
The toxic Elements uranium and thorium are equally set at 50 %. The TREO attributes
remain the same as in the previous scenarios.
Table 17: Use Case IV, Pr-, Nd- and Dy-oxide, Radioactive Elements and TREO
Use Case IV (Pr-, Nd- and Dy-oxide - Deleterious E. - TREO)
Stage I : Material Grade > Economy, Production = 0% Stage II : Mineral Content & Delet. Elements = 50%; Uranium & Thorium = 50% Stage III:TREO = 100%
Goal Criteria I. Sub-Goal Criteria II. Sub-Goal Criteria
Stage I Stage II Stage III
Material Grade 75%
Mineral Content 50%
La2O3 0.95%
CeO2 0.95%
Pr6O11 12.38%
Nd2O3 12.38%
Sm2O3 0.95%
Eu2O3 6.67%
Gd2O3 6.67%
Tb4O7 6.67%
Dy2O3 12.38%
Ho2O3 6.67%
Er2O3 6.67%
Tm2O3 6.67%
Yb2O3 6.67%
Lu2O3 6.67%
Y2O3 6.67%
Deleterious Ele-ments
50% Uranium Grade 50.00%
Thorium Grade 50.00%
Economy 25%
TREO Tonnage 100%
TREO (t) INF 13,33%
TREO (t) IND 20.00%
TREO (t) MEA 40.00%
TREO (t) Total 26.67%
Basket Prices 0% Basket Price ($/kg) (FOB) 0.00%
Basket Price ($/kg) (China Domes-tic)
0.00%
Mining 0% Production 0% Actual Production 0.00%
Historical Production 0.00%
Application of the DBMS
138
Figure 71 shows the results of Use Case IV. The ranking order is very different than
those calculated using other scenarios, introducing several new deposits to the top-ten
list. In this ranking, the deposit Nechalacho is ranked first with 6.4615 points and the
deposit Ilimaussaq Complex Kvanefjeld takes second position with 6.3625 points.
Moreover, the deposit Eldor (Canada) takes the fourth position with 6.3512 points and
Round Top (USA) ranks tenth with 5.9309 points.
The other top ten deposits are the typical Chinese IAC deposits Guangdong Southeast,
Longnan 1 and Changting. Guangdong Southeast is ranked third with 6.3542 points,
Longnan 1 seventh with 6.0405 points and Changting ninth with 6.0018 points.
HREE deposits Hastings, Lofdal-Bergville and Browns Range are located fifth, sixth
and eighth within the small score range from 6.1362 to 6.0253 points. The potential
deposits Ngualla and Strange Lake are calculated as 11th and 12th,with 5.9171 and
5.8834 points, respectively.
The first group of Chinese IAC deposits are ranked 13th to 19th. The deposit Chongzuo
ranks 13th with 5.8773 points. The deposits Longnan 3 (5.8630 points) and Longnan 2
(5.8618 points) are ranked 14th and 15th. The three deposits Xinfen, Xinfen 2 and 1
take 17th to 19th rank, within the point range from 5.8101 to 5.8058.
Further, the potential deposit Norra Kärr is placed 22nd with 5.6331 points. From 25th
to 28th come the second group of the Chinese IAC deposits. Xunwu 1 has 5.5941
points, Xunwun scores 5.5903 points and Xunwu 2 is assigned 5.5859 points. The
deposit Longnan 4 scores 5.4522 points. The producing deposit Mount Weld CLD also
is given n an average ranking in this Use Case. It is 44th with 5.0178 points, and the
second highest producing deposit outside China, Mountain Pass, is ranked lower, at
61st place with 4.7958 points. The producing Chinese deposits of Maoniuping and
Bayan Obo rank 70th and 73rd, scoring only 4.5856 and 4.4302 points, respectively.
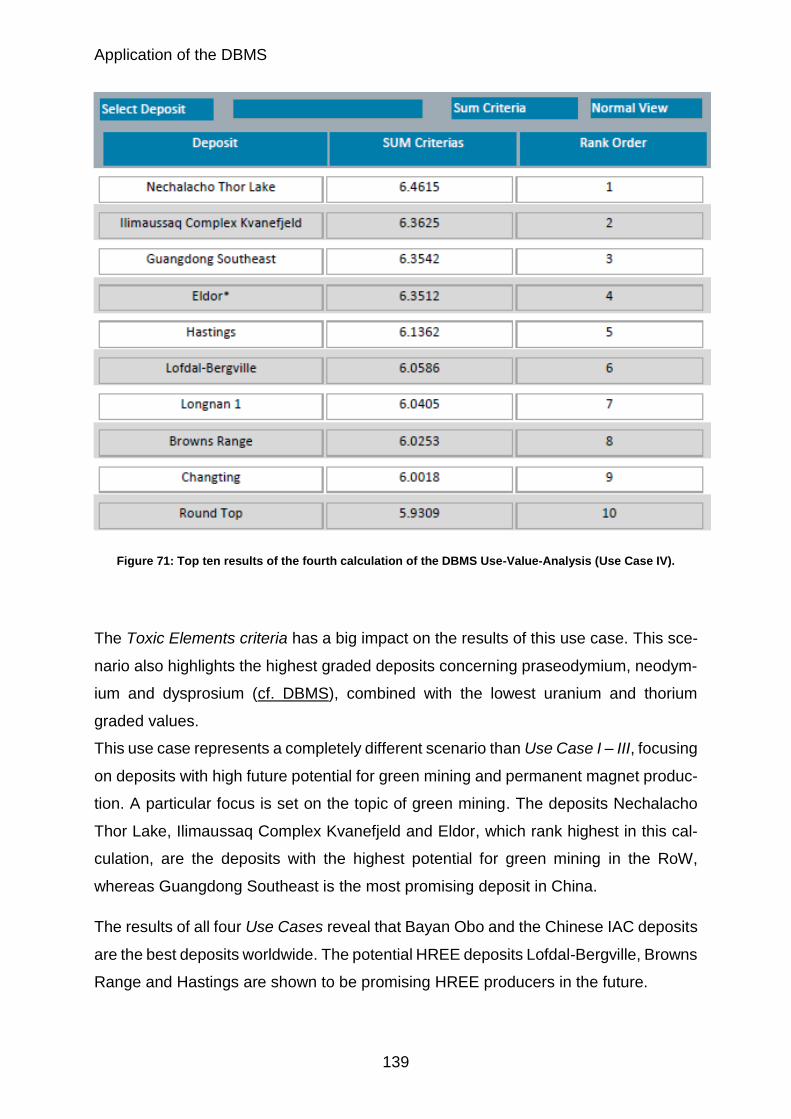
Application of the DBMS
139
Figure 71: Top ten results of the fourth calculation of the DBMS Use-Value-Analysis (Use Case IV).
The Toxic Elements criteria has a big impact on the results of this use case. This sce-
nario also highlights the highest graded deposits concerning praseodymium, neodym-
ium and dysprosium (cf. DBMS), combined with the lowest uranium and thorium
graded values.
This use case represents a completely different scenario than Use Case I – III, focusing
on deposits with high future potential for green mining and permanent magnet produc-
tion. A particular focus is set on the topic of green mining. The deposits Nechalacho
Thor Lake, Ilimaussaq Complex Kvanefjeld and Eldor, which rank highest in this cal-
culation, are the deposits with the highest potential for green mining in the RoW,
whereas Guangdong Southeast is the most promising deposit in China.
The results of all four Use Cases reveal that Bayan Obo and the Chinese IAC deposits
are the best deposits worldwide. The potential HREE deposits Lofdal-Bergville, Browns
Range and Hastings are shown to be promising HREE producers in the future.
Application of the DBMS
140
Particularly high-scoring in all case studies are the IAC deposits Changting and
Longnan, as well as the Lofdal-Bergville, Browns Range and Hastings deposits. The
Mountain Pass deposits only receives a high ranking on one scenario (Use Case I),
and Mount Weld CLD is never given more than an average rating. Thus Mount Weld
CLD and Mountain Pass show no satisfactory results in the Use-Value Analysis. How-
ever, the high ranking of Mountain Pass in Use Case I indicates its potential for future
production.
In Use Case IV, potential REE deposits Ilimaussaq Complex Kvanefjeld, Nechalacho
Thor Lake and Eldor receive the highest ranks due to their low content of toxic ele-
ments. Nechalacho Thor Lake and Ilimaussaq Complex Kvanfjeld are highly Eudialyte-
enriched deposits and show a high potential for green mining.
In summary, the Use-Value Analysis of the DBMS yields extremely different results in
all four presented scenarios (Table 18). Excluding from Use Case IV, Bayan Obo and
the Chinese IAC deposits had the best results of the 77 deposits evaluated. Thus,
economically, they are the best deposits worldwide.
Additionally, potential HREE deposits Lofdal-Bergville, Browns Range and Hastings
reveal high capabilities for producing CREE, and thus, a potential for future production.
However, the deposits Mount Weld CLD and Mountain Pass (USA) yield unsatisfactory
results in all four scenarios. This is also the case for producing LREE deposit Maoniup-
ing, for which requested data is not available for all attributes. The deposits Nechala-
cho Thor Lake, Ilimaussaq Complex Kvanefjeld and Eldor, however, show immense
potential for green mining due to very low values of toxic elements.
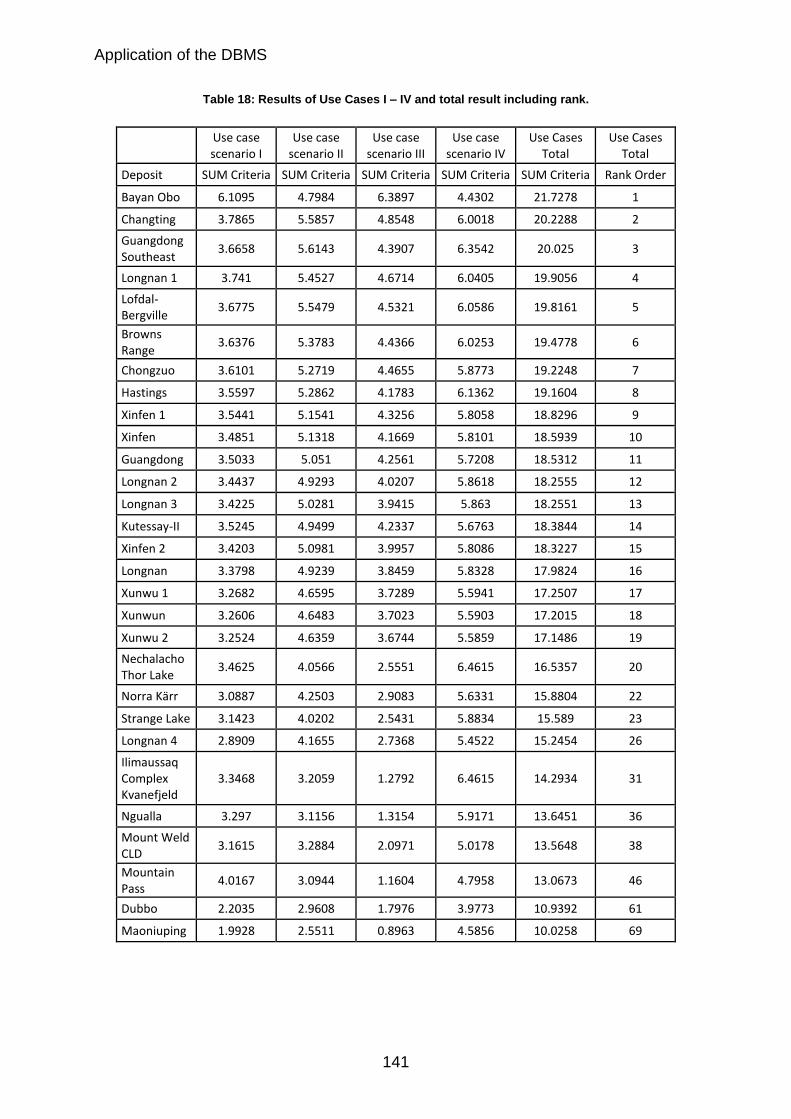
Application of the DBMS
141
Table 18: Results of Use Cases I – IV and total result including rank.
Use case scenario I
Use case scenario II
Use case scenario III
Use case scenario IV
Use Cases Total
Use Cases Total
Deposit SUM Criteria SUM Criteria SUM Criteria SUM Criteria SUM Criteria Rank Order
Bayan Obo 6.1095 4.7984 6.3897 4.4302 21.7278 1
Changting 3.7865 5.5857 4.8548 6.0018 20.2288 2
Guangdong Southeast
3.6658 5.6143 4.3907 6.3542 20.025 3
Longnan 1 3.741 5.4527 4.6714 6.0405 19.9056 4
Lofdal-Bergville
3.6775 5.5479 4.5321 6.0586 19.8161 5
Browns Range
3.6376 5.3783 4.4366 6.0253 19.4778 6
Chongzuo 3.6101 5.2719 4.4655 5.8773 19.2248 7
Hastings 3.5597 5.2862 4.1783 6.1362 19.1604 8
Xinfen 1 3.5441 5.1541 4.3256 5.8058 18.8296 9
Xinfen 3.4851 5.1318 4.1669 5.8101 18.5939 10
Guangdong 3.5033 5.051 4.2561 5.7208 18.5312 11
Longnan 2 3.4437 4.9293 4.0207 5.8618 18.2555 12
Longnan 3 3.4225 5.0281 3.9415 5.863 18.2551 13
Kutessay-II 3.5245 4.9499 4.2337 5.6763 18.3844 14
Xinfen 2 3.4203 5.0981 3.9957 5.8086 18.3227 15
Longnan 3.3798 4.9239 3.8459 5.8328 17.9824 16
Xunwu 1 3.2682 4.6595 3.7289 5.5941 17.2507 17
Xunwun 3.2606 4.6483 3.7023 5.5903 17.2015 18
Xunwu 2 3.2524 4.6359 3.6744 5.5859 17.1486 19
Nechalacho Thor Lake
3.4625 4.0566 2.5551 6.4615 16.5357 20
Norra Kärr 3.0887 4.2503 2.9083 5.6331 15.8804 22
Strange Lake 3.1423 4.0202 2.5431 5.8834 15.589 23
Longnan 4 2.8909 4.1655 2.7368 5.4522 15.2454 26
Ilimaussaq Complex Kvanefjeld
3.3468 3.2059 1.2792 6.4615 14.2934 31
Ngualla 3.297 3.1156 1.3154 5.9171 13.6451 36
Mount Weld CLD
3.1615 3.2884 2.0971 5.0178 13.5648 38
Mountain Pass
4.0167 3.0944 1.1604 4.7958 13.0673 46
Dubbo 2.2035 2.9608 1.7976 3.9773 10.9392 61
Maoniuping 1.9928 2.5511 0.8963 4.5856 10.0258 69
Conclusion
142
8 Conclusion
The final chapter discusses the main results of this dissertation, with a particular em-
phasis on the DBMS. Additionally, a brief outlook on further developments, including
challenges and opportunities within the REE sector, is given. Finally, a concluding
summary completes this dissertation.
8.1 Discussion
It is essential to create a DBMS for REE resources and prospects, since the REE sec-
tor is dominated by Chinese REE producing companies. The main producers are the
Chinese deposits Bayan Obo, Maoniuping, Dalucao, Weishan and the IAC deposits of
Southern China.
The herein presented DBMS system includes search, sort, compare and evaluation
systems. These can quickly create an overview of potential and currently producing
deposits and occurrences. The evaluation systems implemented in the DBMS are Rat-
ing, Clustering, Ranking and a Use-Value Analysis. However, all systems evaluate the
existing prospects for possible future production.
The DBMS provides the opportunity to analyse a complete dataset of all prospects
using the implemented rating system. The rating system includes all occurrences and
deposits worldwide, and rates them according to attributes such as market and statu-
ary mining codes, e.g. JORC, NI 43-101, and SAMREC. These attributes, e.g. certified
resources and reserves, infrastructure and environmental issues, are highly relevant
with regard to the assessment of the whole REE sector. This system functions as a
sorting tool, and thus as a pre-evaluation system.
For instance, the Bayan Obo deposit has certified resources and reserves, existing
infrastructures within the form of processing and separation plants in Baotou and the
highest production rate of all REE deposits worldwide, producing 50,000 tons per year.
Because of this, Bayan Obo is the only deposit which is given the highest Rating, an
AAA status. Other deposits, such as Maoniuping, Dalucao, Weishan and the IAC de-
posits Longnan, Xinfen, Xunwu and Guangdong are given AA status due to their lower
Conclusion
143
production rates. Furthermore, the Mountain Pass (USA) and Mount Weld CLD (Aus-
tralia) deposits are assigned A status because of their unsteady production and strug-
gle with capital expenditures, as well as difficulties in reducing operational costs.
The Rating system includes a complete dataset of all implemented deposits and oc-
currences. Thus, it is a useful tool to analyse the complete REE sector concerning
producing and potential REE-bearing prospects. Moreover, it gives information regard-
ing status, as well as an information portfolio for all prospects in the REE sector.
The evaluation system Clustering is used to subdivide the REE sector into special cat-
egories, each with a specific focal point. The system includes three different Clustering
Groups, separated by mineralogy and economic geology.
In the first Clustering Group, Eudialyte, the potential deposit Norra Kärr (Sweden) ranks
first overall, taking first position in CREO and lowest uranium and thorium values. The
deposit Tanbreez takes the second position, followed by Kipawa Zeus. The Clustering
Group Eudialyte reflects the industrial need for unconventional deposits that have low
amounts of toxic elements as well as high amounts of CREO. This need occurs due to
interest in green mining and separation and thus, the reduction of toxic elements, which
results in a cleaner process chain in separating REE.
In the second Clustering Group, Bastnasite, the Bayan Obo deposit ranks first overall,
scoring first rank in TREO, as well as second in uranium content. The Bokan Mountains
and Mountain Pass deposits share second rank in this Cluster because of their high
ranks in all three parameters (cf. chapter 7.1.2.2, Table 11). Specifically, Bokan Moun-
tains takes first position in thorium and second in CREO values, as well as third in
uranium, whereas Mountain Pass ranks first in uranium and second in both TREO and
thorium content (cf. chapter 7.1.2.2, Table 11). This result is based on a typical per-
ception regarding one of the primarily processed ores within the REE sector. It depicts
REE producing deposits and potential deposits with respect to quantity of resource and
toxic elements.
In the third Clustering Group, Monazite, the most common mineral, and therefore the
most processed ore in the REE sector, is regarded. Within this category, the potential
deposit Ngualla is ranked first in overall ranking with first rank in both uranium and
thorium content and third in TREO. It is followed by the Bayan Obo deposit. Bayan
Obo is ranked first in TREO and third in uranium values. The Mountain Pass deposit
Conclusion
144
ranks third overall, and second both in TREO and uranium content as well as a third
rank in thorium.
Thus, the Clustering Group of Monazite also reflects the current situation of the REE
sector. It displays the potential of deposits with high TREO and low values of toxic
elements, e.g. Ngualla. On the other hand, it highlights the importance of current REE
producers like Bayan Obo and Mountain Pass.
In summary, the Clustering evaluation systems optimize the sorting and evaluation of
specific groups of interest with respect to minerals, mined ores and resources. Addi-
tionally, this evaluation system can be expanded to include other parameters, thus
building specific categories of interest, such as economy, owner information and min-
ing. This leads to an even higher complexity of the evaluation system, but only works
if data of high quality and reliability are available.
The third evaluation system is Ranking, which functions as a pre-evaluation for the
Use-Value Analysis. It is a calculation tool that computes TREO values combined with
Material Grade values of single elements and gives the Ranking based on TREO per
oxide.
The results generated by this calculation are important for an analysis of REE deposits
and resources for future supply. Three different Ranking Systems analyse the Material
Grade, the TREO in tonnage and the combined TREO per oxide. Most oxides are
weighted equally. However, lanthanum, cerium and samarium are weighted digres-
sively, since high contents of these oxides lead to downgrading. This is a consequence
of their high abundance and thus, their lower prices.
It is noticeable that the overall ranking for Material Grade is dominated by the Southern
Chinese IAC deposits (1st to 12th position). The deposit Changting is 1st, Chongzuo
second and Xinfen 2 third in overall ranking according to Material Grade. Longnan 1
and Xinfen are tied for fourth place overall, based on their total combined results. The
deposits Xinfen 1, Longnan 3 and Guangdong Southeast are sixth, seventh and eighth.
The only non-Chinese deposit in the top 10 is Browns Range, with top 5 rankings in
gadolinium to lutetium, as well as holmium. However, Browns Range also scores worse
rankings in praseodymium, neodymium and europium, although all values are within
the top 50. The 10th to 12th positions in Material Grade rankings are taken by the de-
posits Longnan, Lofdal-Bergville and Longnan 2. Thus, the overall ranking of Material
Grade almost parallels the current REE market situation for producing and potential
REE deposits, with the notable exceptions of Mountain Pass and Mount Weld CLD.
Conclusion
145
The Economy Ranking feature evaluates deposits based on their TREO and Basket
Price. The quantity of deposits evaluated by this feature is reduced due to lack of data
for Chinese deposits. Therefore, only the producing deposits Mountain Pass and
Mount Weld CLD, as well as potential deposits outside China, are analysed.
Therefore, the Economy-based ranking yields a very different result than the ranking
described above. It favors the deposits with the highest amount in tonnage TREO and
medium to low Basket Prices, a situation caused by high amounts of LREE and low
amounts of HREE.
The Nechalacho Thor Lake, Strange Lake and Norra Kärr deposits are ranked in the
top 3, due to their high ranks in TREO as well as medium Basket Price ranking. The
potential deposits Ilimaussaq Complex Kvanfjeld and Ngualla are positioned fourth and
sixth, whereas the producing deposits of Mount Weld CLD and Mountain Pass are
ranked 10th and 13th due to smaller values in tonnage of TREO and low Basket Price
rankings.
This ranking feature parallels the actual situation in the REE sector. However, it does
not provide any information regarding feasibility of potential projects; it only displays
the resource potential of all listed deposits.
The last feature in the ranking system combines the parameters of TREO (tonnage)
and mineral distribution of single REO. The correlation between TREO and each single
REO reveals a slightly different view of TREO than the Economy Ranking.
The deposits Nechalacho Thor Lake and Ilimaussaq Complex Kvanefjeld are ranked
first and second in this feature, far ahead of the third, the deposit of Strange Lake.
They achieve the top three results in almost all TREO rankings, except in lanthanum
and cerium for Nechalacho Thor Lake and europium for Ilimaussaq Complex
Kvanefjeld. In comparison with the top two deposits, Strange Lake only reaches top 3
rankings in the HREE segment, from gadolinium to lutetium. The two producing de-
posits Mount Weld CLD and Mountain Pass rank 14th and 19th due to top 10 rankings
in LREE, as well as average rankings in HREE.
In summary, the Ranking evaluation system yields different results within the category
of Material Grade, Economy and TREO. This discrepancy is caused by the missing
data from Chinese deposits regarding TREO (tonnage). Nevertheless, it demonstrates
the potential in resources of deposits like Nechalacho Thor Lake, Ilimaussaq Complex
Kvanefjeld, Strange Lake and Norra Kärr. Also, it displays the current resource status
Conclusion
146
of Mount Weld CLD and Mountain Pass. However, no potential deposits are in produc-
tion and they are unlikely to go into production in the near future due to lack of invest-
ment, higher costs or incomplete finalized feasibility.
The Use-Value Analysis is the main evaluation system in the DBMS. It evaluates de-
posits according to selected parameters in the categories Material Grade, Economy
and Mining. These parameters include mineral content, toxic elements, TREO ton-
nage, Basket Price and production volume. Within the Use-Value Analysis, different
case studies can be created, based on different views of the REE sector.
For instance, in an equally weighted scenario (Use Case I), the deposit Bayan Obo
takes the first position and the deposit Mountain Pass is second. Thus, it displays the
current situation in the REE sector quite well. Producing deposits are high-ranked.
Nevertheless, potential deposits, such as high HREE deposits, e.g. Lofdal-Bergville,
Browns Range, and Hastings, also are ranked highly.
Southern Chinese IAC deposits also attain some of the highest ranks, despite that fact
that they do not have available production data. Nevertheless, the other factors are
strong enough to keep their scores high.
The 2nd Use Case concentrates on Critical REE. Thus, the result favors the deposits
with the highest amount of Critical REE. The IAC deposits of Southern China, e.g.
Guangdong Southeast, Longnan 1 and Xinfen, are located in the top ten of this Use-
Value Analysis. On the other hand, high potential HREE deposits, e.g. Lofdal-Bergville,
Browns Range and Hastings, are also ranked in the top 10. Therefore, Use Case II
highlights both the supremacy of the Southern Chinese IAC deposits with respect to
Critical REE and the high potential of the three above mentioned deposits.
Use Case III evenly mixes the Goal Criteria Economy and Mining. Once again, the
deposit Bayan Obo achieves the highest score. Further high ranks are assigned to the
Chinese IAC deposits and the potential deposits Lofdal-Bergville and Browns Range.
Thus, this Use Case reflects the current economic situation in the REE sector and, in
the case of Lofdal-Bergville and Browns Range, the potential for future production.
Use Case IV assigns rankings based on the combined feature of Material Grade, toxic
elements and TREO (tonnage). This scenario reveals a different result than the other
three. In this case, deposits with high amounts of TREO and low content of toxic ele-
ments are ranked higher.
Conclusion
147
Moreover, there is no supremacy of one deposit, as was the case in the other Use
Cases. All high-ranked deposits score within a very small point range (5.9309 –
6.4615). The top ten ranking deposits include LREE deposits with low values in toxic
elements, e.g. Nechalacho Thor Lake and Ilimaussaq Complex Kvanefjeld, high grade
HREE deposits, e.g Lofdal-Bergville, Browns Range and Hasting, high grade LREE
deposits, e.g. Eldor, Round Top and IAC deposits, e.g. Guangdong Southeast,
Longnan 1 and Changting. Thus, this Use Case includes all potential deposits with low
values in deleterious elements, high-grade Critical REE deposits and high TREO (ton-
nage) deposits.
In summary, the DBMS can identify potential Critical REE deposits, potential deposits
with low values in uranium and thorium and high-grade HREE deposits. Moreover, it
can compare these potential deposits with currently producing deposits, e.g. Bayan
Obo, Mountain Pass and Mount Weld CLD and evaluate these deposits against each
other.
Results indicate that other than Mountain Pass and Mount Weld CLD, only non-Chi-
nese deposits with high amounts of Critical REE might go into production in the near
future. In particular, the deposits Lofdal-Bergville, Browns Range and Hastings are
flagged as high-potential because of their high abundance of critical HREE.
However, worldwide there are no deposits containing high amounts of both LREE and
HREE. Thus, no deposit can serve the market with all critical elements. Prices for REE
decreased over the last four years and are still decreasing, except for the Critical REE,
for which prices reached a phase of stagnation in 2015. Therefore, a focus on CREE
could be an approach to identify potential producing REE companies.
Thus, focussing on either critical LREE or HREE would lead to a cost reduction in terms
of mining, separation, processing and therefore production. In future scenarios, a pos-
sible division in the REE sector might be between NCREE and CREE deposits, rather
than between LREE and HREE deposits.
The rising importance of CREE also changes the view on the demand side, pointing to
an increasing focus on CREE on the demand side as well. Nevertheless, as is illus-
trated in this dissertation, possible producers of REE are struggling due to low prices
and high costs. For the near future, until 2020, there do not seem to be likely potential
producers outside China.
Conclusion
148
However, the question remains, whether there is a market for a “single-element-pro-
ducer” or if the existing market is open to such a producer. There are also other ques-
tions to be answered, e.g. the required volume of REE on the demand side, if and to
which amount the suppliers can reduce costs and the potential effects of the regulation
of the market by China’s policy.
It is also interesting to speculate how Chinese policy regarding HREE production and
internal consumption will develop in the future. In the near future, China might stop
exporting and become an importer of Heavy REE due to its increasing internal con-
sumption. Nevertheless, highly volatile prices and the monopolistic status of China will
certainly play a key role in future market and price analyses.
There is an urgent need to rethink the policies of REE-demanding industrial companies
in terms of process and recovery, as well as purchase of REE. Currently, there are two
possible ways, recycling and replacement, to reduce REE consumption. Both systems
should enable companies to reduce their dependence on REE suppliers. Due to mod-
ern recycling techniques and higher recovery rates, it is likely that in the future, more
REE will be recycled out of specific products. Particularly, in the high-tech industrial
sector, including the production of permanent magnets, wind turbines, electric motors
of vehicles, LED’s, LCD’S and smartphones, there are several opportunities to in-
crease the recycling rate for REE.
Currently, the industry faces many problems due to difficult metallurgical and chemical
extraction processes resulting in high processing costs and extraction difficulties. The
technique of replacement is a form to reduce the use of REE in specific products. Now-
adays, several companies try to implement ferrites into permanent magnets, partially
or wholly replacing REE. In addition, there are companies that have completely re-
moved REE from their production chain for electrical motors (Access Science Editors,
2014). Both solutions may lead to a more independent status concerning the depend-
ence on Chinese REE production and a more positive outlook on supply security.
Conclusion
149
8.2 Concluding Summary
This dissertation analyses current REE prospects concerning geological, mineralogi-
cal, economical, mining and environment-technical attributes by creating a DBMS. An-
other part of this dissertation are the analyses of the CREE and REE market structure.
These features are essential for analysing the REE sector and its prospects. Moreover,
they prove the necessity of developing the DBMS.
The analysis of CREE is an important aspect, especially for future production and sup-
ply and demand issues. In this analysis, REE prospects are evaluated according to the
six CREE; neodymium, praseodymium, europium, terbium, dysprosium and yttrium.
This is important due to the expectation of insufficient supply of these elements in the
future. As the demand for CREE increases over time due to technical development,
the security of supply increases as well.
The analysis of the market structure deals with the aspects of pricing, price develop-
ment and supply and demand. The market for REE is a complex network of supply and
demand. The diverse trading systems are characterised by a high grade of non-trans-
parency. Furthermore, it is a very small market with a small number of participants,
particularly on the supplier side. The channels of trade and pricing are very non-trans-
parent.
It can be concluded that the REE market is monopolistic, as 85 % of the market share
is state-owned by China. The Chinese government regulates the market via the imple-
mentation of export quotas. In 2011, prices increased to a high level due to decreasing
export quotas, a political incident between China and Japan and stockpiling of REE by
distributors. In some cases, the increase was more than 1000 % for both China Do-
mestic and FOB prices.
However, in the following periods, prices decreased, quickly reaching similar levels as
in the periods before. Nevertheless, this enormous peak highlighted the dependence
on China for REE. Moreover, it demonstrated to REE-consuming industries that they
need to find alternative REE suppliers or other methods, e.g. recycling, to meet their
demand.
The main part of developing the DBMS is based on information databases, which con-
tain information on 1190 prospects with known REE enrichment. The data are, how-
Conclusion
150
ever, of varying accuracy and reliability, depending on the degree of exploration un-
dertaken to date. Grade and tonnage information is available for approximately 250
deposits, while more detailed geologic and economic parameters, such as material
grade, defined resources (TREO tonnage) and reserves, CREE and Basket Price are
known for 79 localities. In addition, the database contains entries of the abundances
of toxic elements such as thorium and uranium.
The system contains economic datasets of REE producing companies as well as po-
tential prospects. It allows the user to search for both REE deposits and occurrences
in two specific search systems, whose elements may be combined. The system also
provides tools to define parameters that allow parallel comparison of up to five REE
prospects. Furthermore, an export system that enables a complete systematic export
in both Excel and PDF files is implemented.
The DBMS consists of four evaluation systems that evaluate prospects according to
specific attributes. The 1st evaluation system (Rating) rates occurrences and deposits
using an attributive rating system. This involves a static system with nine rating levels,
based on specific information on the status of the prospects.
Moreover, it includes a Clustering tool that allows the creation of individual REE cluster
groups. This includes three ore cluster groups (Monazite, Bastnasite and Eudialyte).
The DBMS also contains a Ranking system that ranks deposits according to specific
attributes, such as mineral distribution of all REE, TREO tonnage and a combination
of the two values. Moreover, it provides an overall ranking that combines all analysed
attributes.
Another tool is the Use-Value Analysis, which the creation of various use cases based
on weighting input for specific criteria. This feature builds scenarios with different ad-
justment opportunities for material grade, economy and production.
The Use-Value Analysis combines twenty-five specific parameters and calculates them
according to user-defined, weighted arguments. The results extracted out of this sys-
tem mimic various market scenarios.
In this dissertation, four case studies dealing with different scenarios are presented.
These are: (1) a general scenario, which weights all criteria equally, (2) a CREE sce-
nario, (3) a production scenario and (4), a scenario focusing on environmental issues
and element-specific attributes. Evaluating the results of these scenarios reveals that
often, this tool reflects the actual statuses of prospects. Thus, it is likely that this tool
Conclusion
151
can also be used to help in determining which prospects might be significant for future
production.
This Database Management System is interesting for several industrial sectors. In par-
ticular, within the areas of Supply Chain and Business Intelligence, the DBMS could
offer solutions concerning deposit search and compare systems, as well as deposit
evaluation systematics.
There are still many opportunities to extend the DBMS, especially regarding REE mar-
ket structures and mining sectors. Moreover, an extension of the DBMS concerning
price and production predictions, as well as a forecast system for supply and demand
scenarios, would be useful.
Another important issue is that the dataset should include more reliable data on Chi-
nese REE deposits. In particular, it would be very useful to implement the most recent
information on prices. The ideal solution would be to connect the DBMS to a live sys-
tem with regular price updates. However, the current DBMS is already a very useful
tool for industries depending on REE supply and may be helpful in mitigating problems
resulting from supply uncertainty.
Literature
152
9 Literature
Access Science Editors, 2014. Access Science. [Online]
Available at: http://www.accessscience.com/content/rare-earth-elements-recycling-or-
replacement/BR0113142
[Accessed 15th December 2015].
Arafura Resources, 2003. Arafura Resources NL Prospectus, South Perth: Arafura
Resources.
Arafura Resources, 2012. Arafura Resources NL Prospectus, South Perth: Arafura
Resources.
Barros, L., 1997. www.scielo.br/. [Online]
Available at: www.scielo.br/pdf/gp/v4n2/a04v4n2.pdf
[Accessed 2nd December 2012].
British Geological Survey (BGS), 2011. Rare Earth Elements, Nottingham, United
Kingdom: British Geological Survey.
British Geological Survey, 2011. Rare Earth Elements, Nottingham, United Kingdom:
British Geological Survey.
Chakhmouradian, A. & Wall, F., 2012. Rare earth elements: Minerals, mines, magnets
(and more). Elements 8, pp. 333-340.
Chan, V., 2011. Credit Suisse. [Online]
Available at: http://doc.research-and-analytics.csfb.com
[Accessed 12th February 2013].
China Ministry of Commerce, 2013. Technology Metals Research. [Online]
Available at: http://www.techmetalsresearch.com/2013/07/the-second-round-of-
chinese-rare-earth-export-quota-allocations-for-2013/
[Accessed 15th September 2013].
Connelly, N., Damhus, T., Hartshorn, R. & Hutton, A., 2005. Nomenclature of Inorganic
Chemistry: IUPAC Recommendations 2005. RSC Publishing, p. 366.
Dacha Strategic Metals Inc., 2012. A Unique Investment Vehicle for Strategic
Materials, Toronto: Dacha Srtategic Metals.
Darby, S., 2010. Nomura International Ltd.. [Online]
Available at: http://www.nomuraholdings.com/news/nr/
[Accessed 12th December 2012].
Dennis, C., Curtis, L. & Ahmad, A., 2012. The Rare Earths Race - Identifying the
Formula One Cars, Toronto: Dundee Capital Markets - Dundee Security Ltd..
Literature
153
Dominy, S., Noppe, M. & Annels, A., 2002. Errors and uncertainty in Mineral Resource
and Ore Reserve Estimation: The importance of Getting it Right. Explor. Mining Geol.,
Volume Nos. 1-4, pp., pp. 77-98.
Elsner, H., 2012. SE Lagerstätten weltweit - Bewertung durch die DERA. Karslruhe -
Cronimet: s.n.
European Commission, 2014. Press Release Database. [Online]
Available at: http://europa.eu/rapid/press-release_MEMO-14-377_en.htm
[Accessed 5th January 2016].
Factforge, 2013. Factforge. [Online]
Available at: http://factforge.net/resource/dbpedia/Overburden
[Accessed 7th September 2013].
Feess, E., 2004. Mikroökonomie - Eine spieltheoretisch- und anwendungsorientierte
Einführung. 3. ed. Marburg: Metropolis Verlag.
Frontier Rare Earths, 2015. www.frontierrareearths.com. [Online]
Available at: http://www.frontierrareearths.com/rare-earth-uses/
[Accessed 15th December 2015].
Gagliardi, M., 2012. Rare Earths: Worldwide Markets, Applications, Technologies, s.l.:
BCC Research.
Gambogi, J., 2016. USGS. [Online]
Available at: http://minerals.usgs.gov/minerals/pubs/commodity/rare_earths/mcs-
2016-raree.pdf
[Accessed 4th February 2016].
Gocht, W., 1983. Wirtschaftgeologie und Rohstoffpolitik. Untersuchung,
Erschliessung, Bewertung, Verteilung und Nutzung mineralischer Rohsotffe. 2 Hrsg.
Berlin: Springer.
Grasso, V., 2013. Rare Earth Elements in National Defense: Background, Oversight
Issues, and Options for Congress, Washington: Congressional Research Service.
Guilbert, J. & Park Jr., C., 1986. The geology of ore deposits. 4th Hrsg. New York:
W.H. Freeman.
Hartman, H. L., 1996. SME Mining Engineering Handbook. 1 ed. s.l.:Society for Mining,
Metallurgy, and Exploration.
Hatch, G., 2012. Technology Metals Research. [Online]
Available at: http://www.techmetalsresearch.com/2012/12/rare-earth-terminology-a-
quick-refresher-on-the-basics/
[Accessed 11th May 2013].
Literature
154
Hatch, G., 2012. Technology Metals Research. [Online]
Available at: http://www.techmetalsresearch.com/metrics-indices/tmr-advanced-rare-
earth-projects-index/
[Accessed 15th June 2012].
Hatch, G., 2015. Technology Metals Research. [Online]
Available at: http://www.techmetalsresearch.com/metrics-indices/tmr-advanced-rare-
earth-projects-index/
[Accessed 15th August 2015].
Haxel, G., Hedrick, J. & Orris, G., 2002. USGS. [Online]
Available at: http://pubs.usgs.gov/fs/2002/fs087-02/
[Accessed 13th March 2012].
Hedrick, J., 2000. Minerals Yearbook: Volume I - Metals and Minerals. I ed. Reston:
US Geological Survey.
Hitzmann, M., Oreskes, N. & Einaudi, M., 1992. Geological characteristics and tectonic
setting of proterozoic iron oxide deposits. Precambrain Research, Issue 58, pp. 241-
287.
Hoover, 2013. http://www.mindat.org. [Online]
Available at: http://www.mindat.org/glossary/life_of_mine
[Accessed 15th May 2013].
Hu, F.-X.et al., 2011. La(Fe,Si)13-based materials prepared bycoarse rare earth
product during purification. Delft: DDMC.
Investopedia, 2012. http://www.investopedia.com. [Online]
Available at: http://www.investopedia.com/terms/g/gnp.asp
[Accessed 2nd December 2012].
Investopedia, 2012. http://www.investopedia.com. [Online]
Available at: http://www.investopedia.com/terms/s/stocksymbol.asp
[Accessed 2nd December 2012].
ISIN, 2012. http://www.isin.org. [Online]
Available at: http://www.isin.org/isin/
[Accessed 2nd December 2012].
Jamasmie, C., 2015. www.mining.com. [Online]
Available at: http://www.mining.com/molycorp-shuts-down-mountain-pass-rare-earth-
plant/
[Accessed 15th October 2015].
Jamasmie, C., 2015. www.mining.com. [Online]
Available at: http://www.mining.com/china-scraps-decade-old-rare-earths-export-
quotas-44322/
[Accessed 15th February 2015].
Literature
155
JORC, 2004. Australasian Code for Reporting of Exploration Results, Mineral
Resources and Ore Reserves - The JORC Code - 2004 Edition, Australia: The Joint
Ore Reserve Committee of The Australasian Institute of Mining and Metallurgy,
Australian Institute of Geoscientists and Minerals Council of Australia.
JORC, 2012. Australasian Code for Reporting of Exploration Results, Mineral
Resources and Ore Reserves - The JORC Code - 2004 Edition, Australia: The Joint
Ore Reserve Committee of The Australasian Institute of Mining and Metallurgy,
Australian Institute of Geoscientists and Minerals Council of Australia.
Jordens, A., Cheng, Y. & Waters, K., 2013. A review of the beneficiation of rare earth
element bearing minerals. Minerals Engineering, February, pp. 97-114.
Kingsnorth, 2012. Rare Earths Supply Security: Dream or Possibility. Freiberg, s.n., p.
39.
Krishnamurthy, N. & Gupta, C., 2015. Extractive Metallurgy of Rare Earths. 2nd Hrsg.
CRCnetbase: CRC Press.
Kynicky, J., Smith, M. & Xu, C., 2012. Diversity of RE deposits: the key example of
China. Elements, October, Issue 8, pp. 361-367.
Liu, Y. et al., 2015. Mineralogical and geochemical studies of brecciated ores in the
Dulacao REE deposit, Sichuan Province, SW China. Ore Geology Reviews, March.
Los Alamos National Security, 2016. Los Alamos National Laboratory. [Online]
Available at: http://periodic.lanl.gov/index.shtml
[Accessed 5th January 2016].
Lynas Corp., 2013. Lynas Corporation. [Online]
Available at: http://www.lynascorp.com/Pages/what-are-their-prices.aspx
[Accessed 20th May 2013].
Lynas Corp., 2014. Lynas Corp.. [Online]
Available at: http://lynascorp.com/Pages/advanced-materials-plant-kuantan-
malaysia.aspx
[Accessed 15th December 2014].
Lynas Corp., 2014. Lynas Corporation. [Online]
Available at: http://lynascorp.com/Pages/advanced-materials-plant-kuantan-
malaysia.aspx
[Accessed 15th December 2014].
Lynas Corp., 2015. Lynas Corporation. [Online]
Available at: https://www.lynascorp.com/Pages/Mt-Weld-Concentration-Plant.aspx
[Accessed 13th September 2015].
Metal-Pages, 2008. Metal-Pages. [Online]
Available at: http://www.metal-pages.com/news/story/30557/shandong-weishan-to-
Literature
156
become-a-new-rare-earth-base-in-china/
[Accessed 15th July 2015].
Metal-Pages, 2015. Metal-Pages, Argus Media Company. [Online]
Available at: http://www.metal-pages.com/metalprices/rareearths/
[Accessed 31th July 2015].
Microsoft, 2013. Microsoft. [Online]
Available at: https://products.office.com/de-de/access
[Accessed 2012].
mining-onlineexpos, 2013. http://mining.onlineexpos.com. [Online]
Available at: http://mining.onlineexpos.com/cgi-bin/glossary
[Accessed 15th September 2013].
MinTails, 2015. Acid Mine Drainage. [Online]
Available at: http://www.mintails.co.za/acid-mine-drainage
[Accessed 7th December 2015].
Molycorp Inc., 2012. Molycorp Incorporated. [Online]
Available at: http://molycorp.com
[Accessed 17th September 2012].
Molycorp Inc., 2015. Molycorp Incorporated. [Online]
Available at: http://www.molycorp.com/rare-earth-production-rises-in-q4-at-
molycorps-mountain-pass-facility/
[Accessed 15th May 2015].
Molycorp Inc., 2015. Molycorp Incorporated. [Online]
Available at: http://www.molycorp.com/about-us/our-facilities/molycorp-mountain-
pass/
[Accessed 15th August 2015].
Moreno, L., 2011. Jacobs Security Inc.. [Online]
Available at: http://www.jacobsecurities.com/
[Accessed 15th December 2012].
Nickel, E., 1995. The definition of a mineral. The Canadian Mineralogist, pp. 689-690.
Radon, J. et al., 2012. Columbia|SIPA. [Online]
Available at: https://sipa.columbia.edu/academics/capstone-workshops/politics-and-
economics-of-the-rare-earths-industry
[Accessed 6th October 2013].
Rare Earth Technology Alliance, 2015. http://www.rareearthtechalliance.com. [Online]
Available at: http://www.rareearthtechalliance.com/What-are-Rare-Earths
[Accessed 15th December 2015].
Literature
157
Rothsay, 2014. http://www.rothsay.ca. [Online]
Available at: http://www.rothsay.ca/about/glossary/
[Accessed 15th January 2014].
Russell, J. & Cohn, R., 2012. Royalties. 1 ed. s.l.:Book on Demand.
Science Daily, 2012. http://www.sciencedaily.com. [Online]
Available at: http://www.sciencedaily.com/terms/gross_domestic_product.htm
[Accessed 2nd December 2012].
Shen, H., 2012a. Pro Edge Wire. [Online]
Available at: http://www.proedgewire.com/rare-earth-intel/analyzing-chinas-heavy-
rare-earth-element-reserves-part-1-ion-absorbed-clays-illegal-mining/
[Accessed 15th January 2013].
Shen, H., 2012b. Pro Edge Wire. [Online]
Available at: http://www.proedgewire.com/rare-earth-intel/analyzing-chinas-heavy-
rare-earth-element-reserves-part-ii-why-china-will-not-become-a-net-importer-of-rare-
earths/
[Accessed 15th January 2013].
Shen, H., 2014. investorintel.com. [Online]
Available at: http://investorintel.com/technology-metals-intel/chinas-rare-earths-
imports-will-increase/
[Accessed 13th December 2014].
Shiraishi, A., 2010. The rare earths revolution:, Zürich: ETH Zürich.
SKS Business, 2012. http://www.sksbusinessservices.com. [Online]
Available at: http://www.sksbusinessservices.com/knowledge-centre/small-cap
[Accessed 2nd December 2012].
Stylianos-Stavvas, P., 1995. Atlas of the texural patterns of ore minerals and
metallogenic processes. 1 Hrsg. New York: de Gruyter, Berlin.
Sullivan, A. & Sheffrin, S., 2003. Economics: Principles in action. Upper Saddle River,
New Jersey: s.n.
Tasman Metals Ltd., 2015. Tasman Metals. [Online]
Available at: http://www.tasmanmetals.com/s/OresMinerals.asp
[Accessed 23rd November 2015].
Tse, P.-K., 2011. USGS. [Online]
Available at: http://pubs.usgs.gov/of/2011/1042/
[Accessed 13th December 2015].
U.S. Department of Energy, 2010. Critical Metals Strategy, Washington: U.S.
Department of Energy.
Literature
158
USGS, 2012. United States Geological Survey. [Online]
Available at: http://minerals.usgs.gov/minerals/pubs/commodity/rare_earths/mcs-
2012-raree.pdf
[Accessed 1st March 2012].
USGS, 2013. United States Geological Survey. [Online]
Available at: http://minerals.usgs.gov/minerals/pubs/commodity/rare_earths/mcs-
2013-raree.pdf
[Accessed 17th February 2013].
USGS, 2014. United States Geological Survey. [Online]
Available at: http://minerals.usgs.gov/minerals/pubs/commodity/rare_earths/mcs-
2014-raree.pdf
[Accessed 11th March 2014].
USGS, 2015. United States Geological Survey (USGS). [Online]
Available at: http://minerals.usgs.gov/minerals/pubs/commodity/rare_earths/mcs-
2015-raree.pdf
[Accessed 12th February 2015].
Verplanck, P., Van Gosen, B., Seal, R. & McCafferty, A., 2014. USGS. [Online]
Available at: http://pubs.usgs.gov/sir/2010/5070/j/pdf/sir2010-5070J.pdf
[Accessed 3rd April 2015].
Wang, D. et al., 2008. A special orogenic-type rare earth element deposit in
Maoniuping, Sichuan, China. Geology and Geochemistry. Resource Geology, pp. 177-
188.
Worstall, T., 2014. Forbes. [Online]
Available at: http://www.forbes.com/sites/timworstall/2014/08/03/why-lynas-corp-is-
struggling-the-great-rare-earth-shortage-is-truly-over/#28dbd5d882c0
[Accessed 10th February 2015].
Xiaoping, D., 1992. The Middle East has oil. China has rare earths [Interview] 1992.
Zhi Li, L. & Yang, X., 2014. China's RE ore deposits and beneficiation techniques.
Milos, ERES 2014: 1st European RE resources conference.
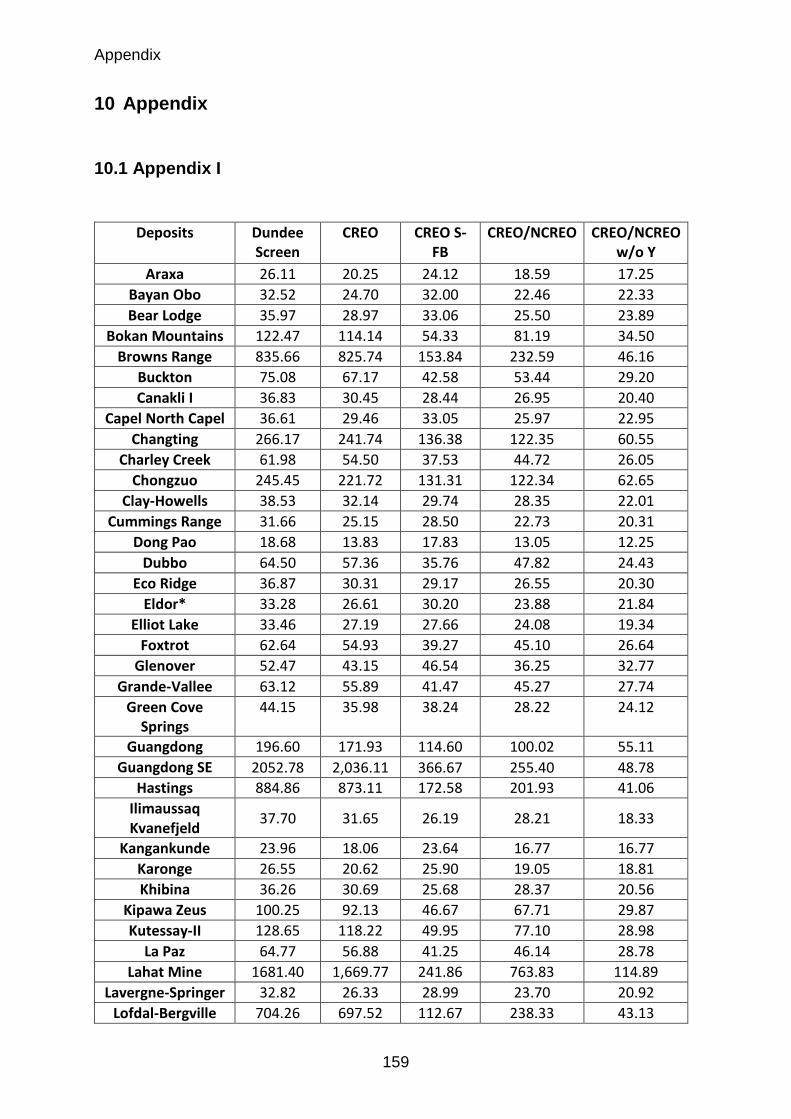
Appendix
159
10 Appendix
10.1 Appendix I
Deposits Dundee Screen
CREO CREO S-FB
CREO/NCREO CREO/NCREO w/o Y
Araxa 26.11 20.25 24.12 18.59 17.25
Bayan Obo 32.52 24.70 32.00 22.46 22.33
Bear Lodge 35.97 28.97 33.06 25.50 23.89
Bokan Mountains 122.47 114.14 54.33 81.19 34.50
Browns Range 835.66 825.74 153.84 232.59 46.16
Buckton 75.08 67.17 42.58 53.44 29.20
Canakli I 36.83 30.45 28.44 26.95 20.40
Capel North Capel 36.61 29.46 33.05 25.97 22.95
Changting 266.17 241.74 136.38 122.35 60.55
Charley Creek 61.98 54.50 37.53 44.72 26.05
Chongzuo 245.45 221.72 131.31 122.34 62.65
Clay-Howells 38.53 32.14 29.74 28.35 22.01
Cummings Range 31.66 25.15 28.50 22.73 20.31
Dong Pao 18.68 13.83 17.83 13.05 12.25
Dubbo 64.50 57.36 35.76 47.82 24.43
Eco Ridge 36.87 30.31 29.17 26.55 20.30
Eldor* 33.28 26.61 30.20 23.88 21.84
Elliot Lake 33.46 27.19 27.66 24.08 19.34
Foxtrot 62.64 54.93 39.27 45.10 26.64
Glenover 52.47 43.15 46.54 36.25 32.77
Grande-Vallee 63.12 55.89 41.47 45.27 27.74
Green Cove Springs
44.15 35.98 38.24 28.22 24.12
Guangdong 196.60 171.93 114.60 100.02 55.11
Guangdong SE 2052.78 2,036.11 366.67 255.40 48.78
Hastings 884.86 873.11 172.58 201.93 41.06
Ilimaussaq Kvanefjeld
37.70 31.65 26.19 28.21 18.33
Kangankunde 23.96 18.06 23.64 16.77 16.77
Karonge 26.55 20.62 25.90 19.05 18.81
Khibina 36.26 30.69 25.68 28.37 20.56
Kipawa Zeus 100.25 92.13 46.67 67.71 29.87
Kutessay-II 128.65 118.22 49.95 77.10 28.98
La Paz 64.77 56.88 41.25 46.14 28.78
Lahat Mine 1681.40 1,669.77 241.86 763.83 114.89
Lavergne-Springer 32.82 26.33 28.99 23.70 20.92
Lofdal-Bergville 704.26 697.52 112.67 238.33 43.13
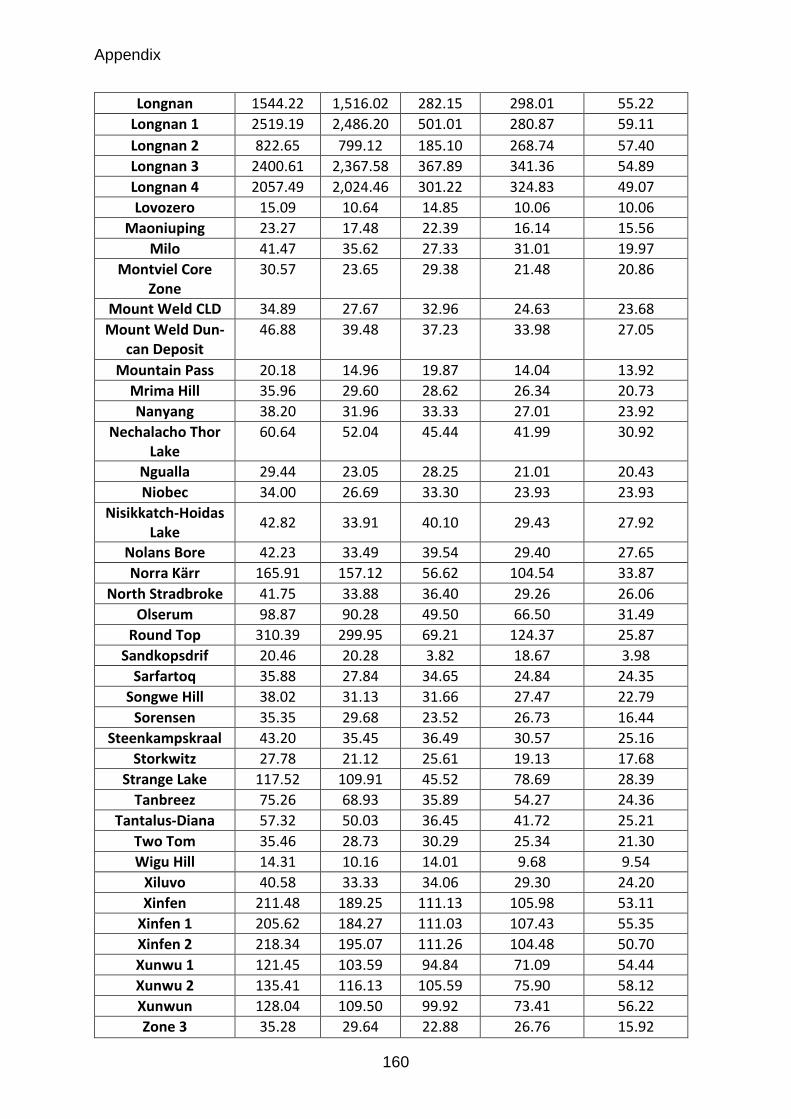
Appendix
160
Longnan 1544.22 1,516.02 282.15 298.01 55.22
Longnan 1 2519.19 2,486.20 501.01 280.87 59.11
Longnan 2 822.65 799.12 185.10 268.74 57.40
Longnan 3 2400.61 2,367.58 367.89 341.36 54.89
Longnan 4 2057.49 2,024.46 301.22 324.83 49.07
Lovozero 15.09 10.64 14.85 10.06 10.06
Maoniuping 23.27 17.48 22.39 16.14 15.56
Milo 41.47 35.62 27.33 31.01 19.97
Montviel Core Zone
30.57 23.65 29.38 21.48 20.86
Mount Weld CLD 34.89 27.67 32.96 24.63 23.68
Mount Weld Dun-can Deposit
46.88 39.48 37.23 33.98 27.05
Mountain Pass 20.18 14.96 19.87 14.04 13.92
Mrima Hill 35.96 29.60 28.62 26.34 20.73
Nanyang 38.20 31.96 33.33 27.01 23.92
Nechalacho Thor Lake
60.64 52.04 45.44 41.99 30.92
Ngualla 29.44 23.05 28.25 21.01 20.43
Niobec 34.00 26.69 33.30 23.93 23.93
Nisikkatch-Hoidas Lake
42.82 33.91 40.10 29.43 27.92
Nolans Bore 42.23 33.49 39.54 29.40 27.65
Norra Kärr 165.91 157.12 56.62 104.54 33.87
North Stradbroke 41.75 33.88 36.40 29.26 26.06
Olserum 98.87 90.28 49.50 66.50 31.49
Round Top 310.39 299.95 69.21 124.37 25.87
Sandkopsdrif 20.46 20.28 3.82 18.67 3.98
Sarfartoq 35.88 27.84 34.65 24.84 24.35
Songwe Hill 38.02 31.13 31.66 27.47 22.79
Sorensen 35.35 29.68 23.52 26.73 16.44
Steenkampskraal 43.20 35.45 36.49 30.57 25.16
Storkwitz 27.78 21.12 25.61 19.13 17.68
Strange Lake 117.52 109.91 45.52 78.69 28.39
Tanbreez 75.26 68.93 35.89 54.27 24.36
Tantalus-Diana 57.32 50.03 36.45 41.72 25.21
Two Tom 35.46 28.73 30.29 25.34 21.30
Wigu Hill 14.31 10.16 14.01 9.68 9.54
Xiluvo 40.58 33.33 34.06 29.30 24.20
Xinfen 211.48 189.25 111.13 105.98 53.11
Xinfen 1 205.62 184.27 111.03 107.43 55.35
Xinfen 2 218.34 195.07 111.26 104.48 50.70
Xunwu 1 121.45 103.59 94.84 71.09 54.44
Xunwu 2 135.41 116.13 105.59 75.90 58.12
Xunwun 128.04 109.50 99.92 73.41 56.22
Zone 3 35.28 29.64 22.88 26.76 15.92
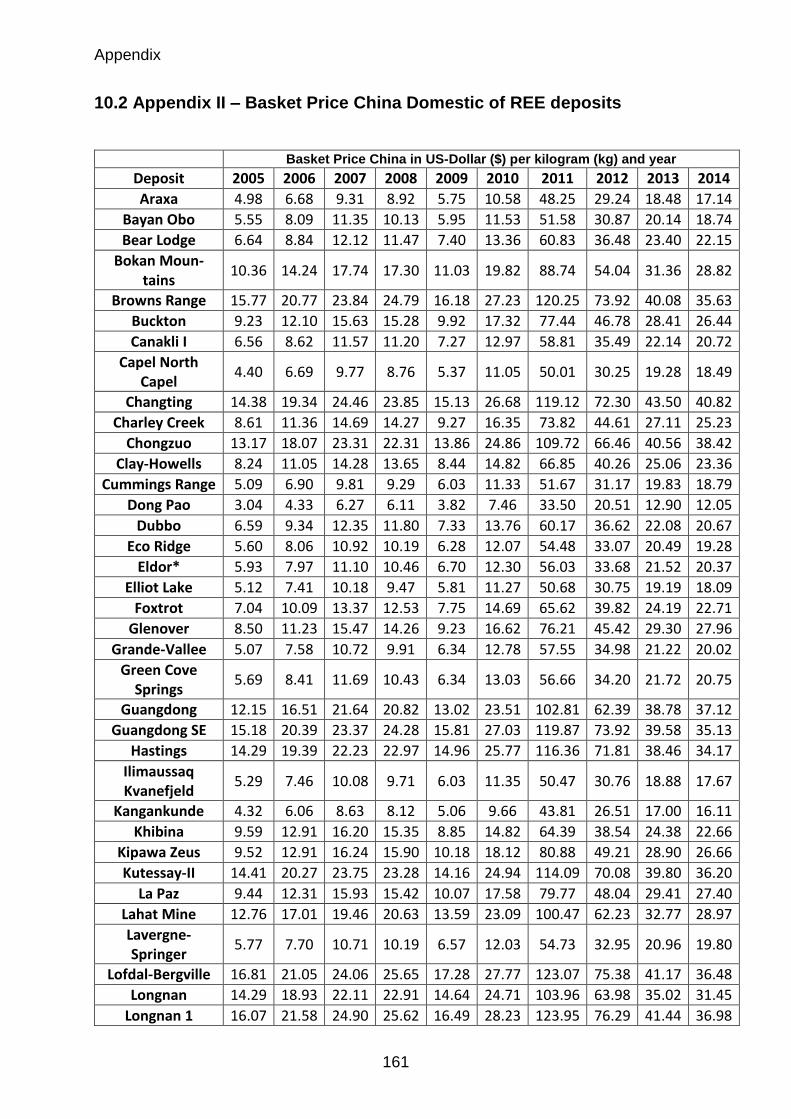
Appendix
161
10.2 Appendix II – Basket Price China Domestic of REE deposits
Basket Price China in US-Dollar ($) per kilogram (kg) and year
Deposit 2005 2006 2007 2008 2009 2010 2011 2012 2013 2014
Araxa 4.98 6.68 9.31 8.92 5.75 10.58 48.25 29.24 18.48 17.14
Bayan Obo 5.55 8.09 11.35 10.13 5.95 11.53 51.58 30.87 20.14 18.74
Bear Lodge 6.64 8.84 12.12 11.47 7.40 13.36 60.83 36.48 23.40 22.15
Bokan Moun-tains
10.36 14.24 17.74 17.30 11.03 19.82 88.74 54.04 31.36 28.82
Browns Range 15.77 20.77 23.84 24.79 16.18 27.23 120.25 73.92 40.08 35.63
Buckton 9.23 12.10 15.63 15.28 9.92 17.32 77.44 46.78 28.41 26.44
Canakli I 6.56 8.62 11.57 11.20 7.27 12.97 58.81 35.49 22.14 20.72
Capel North Capel
4.40 6.69 9.77 8.76 5.37 11.05 50.01 30.25 19.28 18.49
Changting 14.38 19.34 24.46 23.85 15.13 26.68 119.12 72.30 43.50 40.82
Charley Creek 8.61 11.36 14.69 14.27 9.27 16.35 73.82 44.61 27.11 25.23
Chongzuo 13.17 18.07 23.31 22.31 13.86 24.86 109.72 66.46 40.56 38.42
Clay-Howells 8.24 11.05 14.28 13.65 8.44 14.82 66.85 40.26 25.06 23.36
Cummings Range 5.09 6.90 9.81 9.29 6.03 11.33 51.67 31.17 19.83 18.79
Dong Pao 3.04 4.33 6.27 6.11 3.82 7.46 33.50 20.51 12.90 12.05
Dubbo 6.59 9.34 12.35 11.80 7.33 13.76 60.17 36.62 22.08 20.67
Eco Ridge 5.60 8.06 10.92 10.19 6.28 12.07 54.48 33.07 20.49 19.28
Eldor* 5.93 7.97 11.10 10.46 6.70 12.30 56.03 33.68 21.52 20.37
Elliot Lake 5.12 7.41 10.18 9.47 5.81 11.27 50.68 30.75 19.19 18.09
Foxtrot 7.04 10.09 13.37 12.53 7.75 14.69 65.62 39.82 24.19 22.71
Glenover 8.50 11.23 15.47 14.26 9.23 16.62 76.21 45.42 29.30 27.96
Grande-Vallee 5.07 7.58 10.72 9.91 6.34 12.78 57.55 34.98 21.22 20.02
Green Cove Springs
5.69 8.41 11.69 10.43 6.34 13.03 56.66 34.20 21.72 20.75
Guangdong 12.15 16.51 21.64 20.82 13.02 23.51 102.81 62.39 38.78 37.12
Guangdong SE 15.18 20.39 23.37 24.28 15.81 27.03 119.87 73.92 39.58 35.13
Hastings 14.29 19.39 22.23 22.97 14.96 25.77 116.36 71.81 38.46 34.17
Ilimaussaq Kvanefjeld
5.29 7.46 10.08 9.71 6.03 11.35 50.47 30.76 18.88 17.67
Kangankunde 4.32 6.06 8.63 8.12 5.06 9.66 43.81 26.51 17.00 16.11
Khibina 9.59 12.91 16.20 15.35 8.85 14.82 64.39 38.54 24.38 22.66
Kipawa Zeus 9.52 12.91 16.24 15.90 10.18 18.12 80.88 49.21 28.90 26.66
Kutessay-II 14.41 20.27 23.75 23.28 14.16 24.94 114.09 70.08 39.80 36.20
La Paz 9.44 12.31 15.93 15.42 10.07 17.58 79.77 48.04 29.41 27.40
Lahat Mine 12.76 17.01 19.46 20.63 13.59 23.09 100.47 62.23 32.77 28.97
Lavergne-Springer
5.77 7.70 10.71 10.19 6.57 12.03 54.73 32.95 20.96 19.80
Lofdal-Bergville 16.81 21.05 24.06 25.65 17.28 27.77 123.07 75.38 41.17 36.48
Longnan 14.29 18.93 22.11 22.91 14.64 24.71 103.96 63.98 35.02 31.45
Longnan 1 16.07 21.58 24.90 25.62 16.49 28.23 123.95 76.29 41.44 36.98
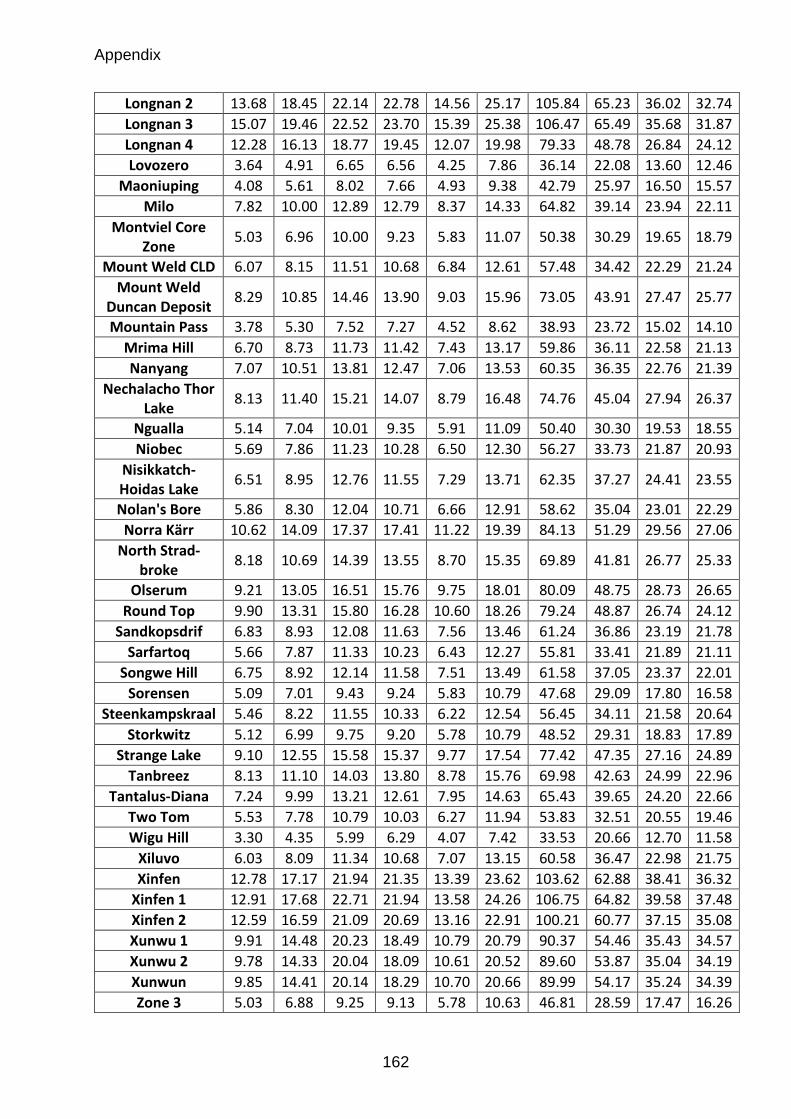
Appendix
162
Longnan 2 13.68 18.45 22.14 22.78 14.56 25.17 105.84 65.23 36.02 32.74
Longnan 3 15.07 19.46 22.52 23.70 15.39 25.38 106.47 65.49 35.68 31.87
Longnan 4 12.28 16.13 18.77 19.45 12.07 19.98 79.33 48.78 26.84 24.12
Lovozero 3.64 4.91 6.65 6.56 4.25 7.86 36.14 22.08 13.60 12.46
Maoniuping 4.08 5.61 8.02 7.66 4.93 9.38 42.79 25.97 16.50 15.57
Milo 7.82 10.00 12.89 12.79 8.37 14.33 64.82 39.14 23.94 22.11
Montviel Core Zone
5.03 6.96 10.00 9.23 5.83 11.07 50.38 30.29 19.65 18.79
Mount Weld CLD 6.07 8.15 11.51 10.68 6.84 12.61 57.48 34.42 22.29 21.24
Mount Weld Duncan Deposit
8.29 10.85 14.46 13.90 9.03 15.96 73.05 43.91 27.47 25.77
Mountain Pass 3.78 5.30 7.52 7.27 4.52 8.62 38.93 23.72 15.02 14.10
Mrima Hill 6.70 8.73 11.73 11.42 7.43 13.17 59.86 36.11 22.58 21.13
Nanyang 7.07 10.51 13.81 12.47 7.06 13.53 60.35 36.35 22.76 21.39
Nechalacho Thor Lake
8.13 11.40 15.21 14.07 8.79 16.48 74.76 45.04 27.94 26.37
Ngualla 5.14 7.04 10.01 9.35 5.91 11.09 50.40 30.30 19.53 18.55
Niobec 5.69 7.86 11.23 10.28 6.50 12.30 56.27 33.73 21.87 20.93
Nisikkatch-Hoidas Lake
6.51 8.95 12.76 11.55 7.29 13.71 62.35 37.27 24.41 23.55
Nolan's Bore 5.86 8.30 12.04 10.71 6.66 12.91 58.62 35.04 23.01 22.29
Norra Kärr 10.62 14.09 17.37 17.41 11.22 19.39 84.13 51.29 29.56 27.06
North Strad-broke
8.18 10.69 14.39 13.55 8.70 15.35 69.89 41.81 26.77 25.33
Olserum 9.21 13.05 16.51 15.76 9.75 18.01 80.09 48.75 28.73 26.65
Round Top 9.90 13.31 15.80 16.28 10.60 18.26 79.24 48.87 26.74 24.12
Sandkopsdrif 6.83 8.93 12.08 11.63 7.56 13.46 61.24 36.86 23.19 21.78
Sarfartoq 5.66 7.87 11.33 10.23 6.43 12.27 55.81 33.41 21.89 21.11
Songwe Hill 6.75 8.92 12.14 11.58 7.51 13.49 61.58 37.05 23.37 22.01
Sorensen 5.09 7.01 9.43 9.24 5.83 10.79 47.68 29.09 17.80 16.58
Steenkampskraal 5.46 8.22 11.55 10.33 6.22 12.54 56.45 34.11 21.58 20.64
Storkwitz 5.12 6.99 9.75 9.20 5.78 10.79 48.52 29.31 18.83 17.89
Strange Lake 9.10 12.55 15.58 15.37 9.77 17.54 77.42 47.35 27.16 24.89
Tanbreez 8.13 11.10 14.03 13.80 8.78 15.76 69.98 42.63 24.99 22.96
Tantalus-Diana 7.24 9.99 13.21 12.61 7.95 14.63 65.43 39.65 24.20 22.66
Two Tom 5.53 7.78 10.79 10.03 6.27 11.94 53.83 32.51 20.55 19.46
Wigu Hill 3.30 4.35 5.99 6.29 4.07 7.42 33.53 20.66 12.70 11.58
Xiluvo 6.03 8.09 11.34 10.68 7.07 13.15 60.58 36.47 22.98 21.75
Xinfen 12.78 17.17 21.94 21.35 13.39 23.62 103.62 62.88 38.41 36.32
Xinfen 1 12.91 17.68 22.71 21.94 13.58 24.26 106.75 64.82 39.58 37.48
Xinfen 2 12.59 16.59 21.09 20.69 13.16 22.91 100.21 60.77 37.15 35.08
Xunwu 1 9.91 14.48 20.23 18.49 10.79 20.79 90.37 54.46 35.43 34.57
Xunwu 2 9.78 14.33 20.04 18.09 10.61 20.52 89.60 53.87 35.04 34.19
Xunwun 9.85 14.41 20.14 18.29 10.70 20.66 89.99 54.17 35.24 34.39
Zone 3 5.03 6.88 9.25 9.13 5.78 10.63 46.81 28.59 17.47 16.26
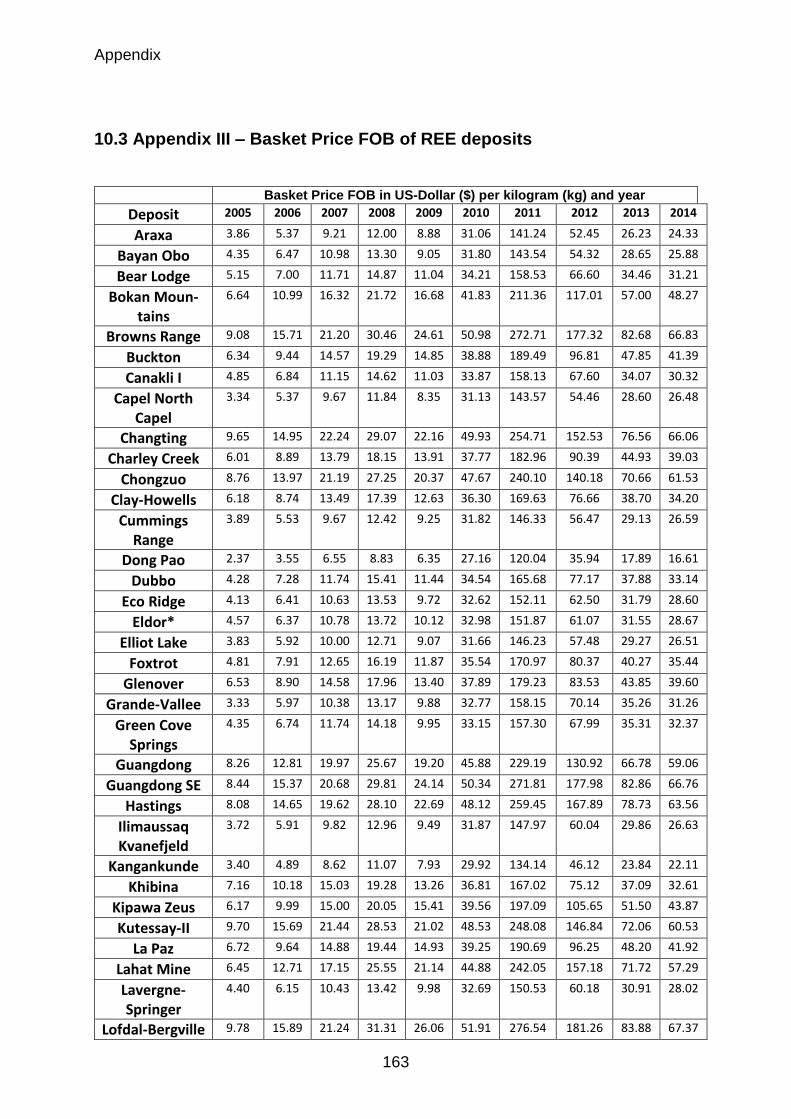
Appendix
163
10.3 Appendix III – Basket Price FOB of REE deposits
Basket Price FOB in US-Dollar ($) per kilogram (kg) and year
Deposit 2005 2006 2007 2008 2009 2010 2011 2012 2013 2014
Araxa 3.86 5.37 9.21 12.00 8.88 31.06 141.24 52.45 26.23 24.33
Bayan Obo 4.35 6.47 10.98 13.30 9.05 31.80 143.54 54.32 28.65 25.88
Bear Lodge 5.15 7.00 11.71 14.87 11.04 34.21 158.53 66.60 34.46 31.21
Bokan Moun-tains
6.64 10.99 16.32 21.72 16.68 41.83 211.36 117.01 57.00 48.27
Browns Range 9.08 15.71 21.20 30.46 24.61 50.98 272.71 177.32 82.68 66.83
Buckton 6.34 9.44 14.57 19.29 14.85 38.88 189.49 96.81 47.85 41.39
Canakli I 4.85 6.84 11.15 14.62 11.03 33.87 158.13 67.60 34.07 30.32
Capel North Capel
3.34 5.37 9.67 11.84 8.35 31.13 143.57 54.46 28.60 26.48
Changting 9.65 14.95 22.24 29.07 22.16 49.93 254.71 152.53 76.56 66.06
Charley Creek 6.01 8.89 13.79 18.15 13.91 37.77 182.96 90.39 44.93 39.03
Chongzuo 8.76 13.97 21.19 27.25 20.37 47.67 240.10 140.18 70.66 61.53
Clay-Howells 6.18 8.74 13.49 17.39 12.63 36.30 169.63 76.66 38.70 34.20
Cummings Range
3.89 5.53 9.67 12.42 9.25 31.82 146.33 56.47 29.13 26.59
Dong Pao 2.37 3.55 6.55 8.83 6.35 27.16 120.04 35.94 17.89 16.61
Dubbo 4.28 7.28 11.74 15.41 11.44 34.54 165.68 77.17 37.88 33.14
Eco Ridge 4.13 6.41 10.63 13.53 9.72 32.62 152.11 62.50 31.79 28.60
Eldor* 4.57 6.37 10.78 13.72 10.12 32.98 151.87 61.07 31.55 28.67
Elliot Lake 3.83 5.92 10.00 12.71 9.07 31.66 146.23 57.48 29.27 26.51
Foxtrot 4.81 7.91 12.65 16.19 11.87 35.54 170.97 80.37 40.27 35.44
Glenover 6.53 8.90 14.58 17.96 13.40 37.89 179.23 83.53 43.85 39.60
Grande-Vallee 3.33 5.97 10.38 13.17 9.88 32.77 158.15 70.14 35.26 31.26
Green Cove Springs
4.35 6.74 11.74 14.18 9.95 33.15 157.30 67.99 35.31 32.37
Guangdong 8.26 12.81 19.97 25.67 19.20 45.88 229.19 130.92 66.78 59.06
Guangdong SE 8.44 15.37 20.68 29.81 24.14 50.34 271.81 177.98 82.86 66.76
Hastings 8.08 14.65 19.62 28.10 22.69 48.12 259.45 167.89 78.73 63.56
Ilimaussaq Kvanefjeld
3.72 5.91 9.82 12.96 9.49 31.87 147.97 60.04 29.86 26.63
Kangankunde 3.40 4.89 8.62 11.07 7.93 29.92 134.14 46.12 23.84 22.11
Khibina 7.16 10.18 15.03 19.28 13.26 36.81 167.02 75.12 37.09 32.61
Kipawa Zeus 6.17 9.99 15.00 20.05 15.41 39.56 197.09 105.65 51.50 43.87
Kutessay-II 9.70 15.69 21.44 28.53 21.02 48.53 248.08 146.84 72.06 60.53
La Paz 6.72 9.64 14.88 19.44 14.93 39.25 190.69 96.25 48.20 41.92
Lahat Mine 6.45 12.71 17.15 25.55 21.14 44.88 242.05 157.18 71.72 57.29
Lavergne-Springer
4.40 6.15 10.43 13.42 9.98 32.69 150.53 60.18 30.91 28.02
Lofdal-Bergville 9.78 15.89 21.24 31.31 26.06 51.91 276.54 181.26 83.88 67.37
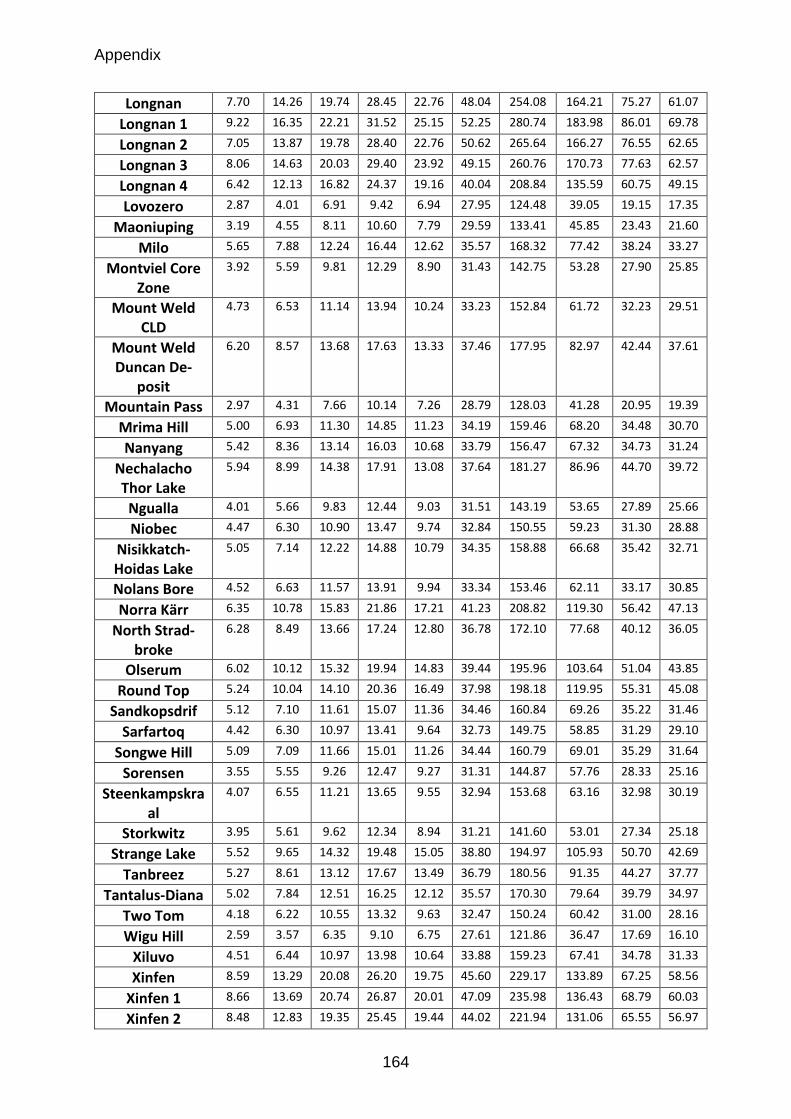
Appendix
164
Longnan 7.70 14.26 19.74 28.45 22.76 48.04 254.08 164.21 75.27 61.07
Longnan 1 9.22 16.35 22.21 31.52 25.15 52.25 280.74 183.98 86.01 69.78
Longnan 2 7.05 13.87 19.78 28.40 22.76 50.62 265.64 166.27 76.55 62.65
Longnan 3 8.06 14.63 20.03 29.40 23.92 49.15 260.76 170.73 77.63 62.57
Longnan 4 6.42 12.13 16.82 24.37 19.16 40.04 208.84 135.59 60.75 49.15
Lovozero 2.87 4.01 6.91 9.42 6.94 27.95 124.48 39.05 19.15 17.35
Maoniuping 3.19 4.55 8.11 10.60 7.79 29.59 133.41 45.85 23.43 21.60
Milo 5.65 7.88 12.24 16.44 12.62 35.57 168.32 77.42 38.24 33.27
Montviel Core Zone
3.92 5.59 9.81 12.29 8.90 31.43 142.75 53.28 27.90 25.85
Mount Weld CLD
4.73 6.53 11.14 13.94 10.24 33.23 152.84 61.72 32.23 29.51
Mount Weld Duncan De-
posit
6.20 8.57 13.68 17.63 13.33 37.46 177.95 82.97 42.44 37.61
Mountain Pass 2.97 4.31 7.66 10.14 7.26 28.79 128.03 41.28 20.95 19.39
Mrima Hill 5.00 6.93 11.30 14.85 11.23 34.19 159.46 68.20 34.48 30.70
Nanyang 5.42 8.36 13.14 16.03 10.68 33.79 156.47 67.32 34.73 31.24
Nechalacho Thor Lake
5.94 8.99 14.38 17.91 13.08 37.64 181.27 86.96 44.70 39.72
Ngualla 4.01 5.66 9.83 12.44 9.03 31.51 143.19 53.65 27.89 25.66
Niobec 4.47 6.30 10.90 13.47 9.74 32.84 150.55 59.23 31.30 28.88
Nisikkatch-Hoidas Lake
5.05 7.14 12.22 14.88 10.79 34.35 158.88 66.68 35.42 32.71
Nolans Bore 4.52 6.63 11.57 13.91 9.94 33.34 153.46 62.11 33.17 30.85
Norra Kärr 6.35 10.78 15.83 21.86 17.21 41.23 208.82 119.30 56.42 47.13
North Strad-broke
6.28 8.49 13.66 17.24 12.80 36.78 172.10 77.68 40.12 36.05
Olserum 6.02 10.12 15.32 19.94 14.83 39.44 195.96 103.64 51.04 43.85
Round Top 5.24 10.04 14.10 20.36 16.49 37.98 198.18 119.95 55.31 45.08
Sandkopsdrif 5.12 7.10 11.61 15.07 11.36 34.46 160.84 69.26 35.22 31.46
Sarfartoq 4.42 6.30 10.97 13.41 9.64 32.73 149.75 58.85 31.29 29.10
Songwe Hill 5.09 7.09 11.66 15.01 11.26 34.44 160.79 69.01 35.29 31.64
Sorensen 3.55 5.55 9.26 12.47 9.27 31.31 144.87 57.76 28.33 25.16
Steenkampskraal
4.07 6.55 11.21 13.65 9.55 32.94 153.68 63.16 32.98 30.19
Storkwitz 3.95 5.61 9.62 12.34 8.94 31.21 141.60 53.01 27.34 25.18
Strange Lake 5.52 9.65 14.32 19.48 15.05 38.80 194.97 105.93 50.70 42.69
Tanbreez 5.27 8.61 13.12 17.67 13.49 36.79 180.56 91.35 44.27 37.77
Tantalus-Diana 5.02 7.84 12.51 16.25 12.12 35.57 170.30 79.64 39.79 34.97
Two Tom 4.18 6.22 10.55 13.32 9.63 32.47 150.24 60.42 31.00 28.16
Wigu Hill 2.59 3.57 6.35 9.10 6.75 27.61 121.86 36.47 17.69 16.10
Xiluvo 4.51 6.44 10.97 13.98 10.64 33.88 159.23 67.41 34.78 31.33
Xinfen 8.59 13.29 20.08 26.20 19.75 45.60 229.17 133.89 67.25 58.56
Xinfen 1 8.66 13.69 20.74 26.87 20.01 47.09 235.98 136.43 68.79 60.03
Xinfen 2 8.48 12.83 19.35 25.45 19.44 44.02 221.94 131.06 65.55 56.97
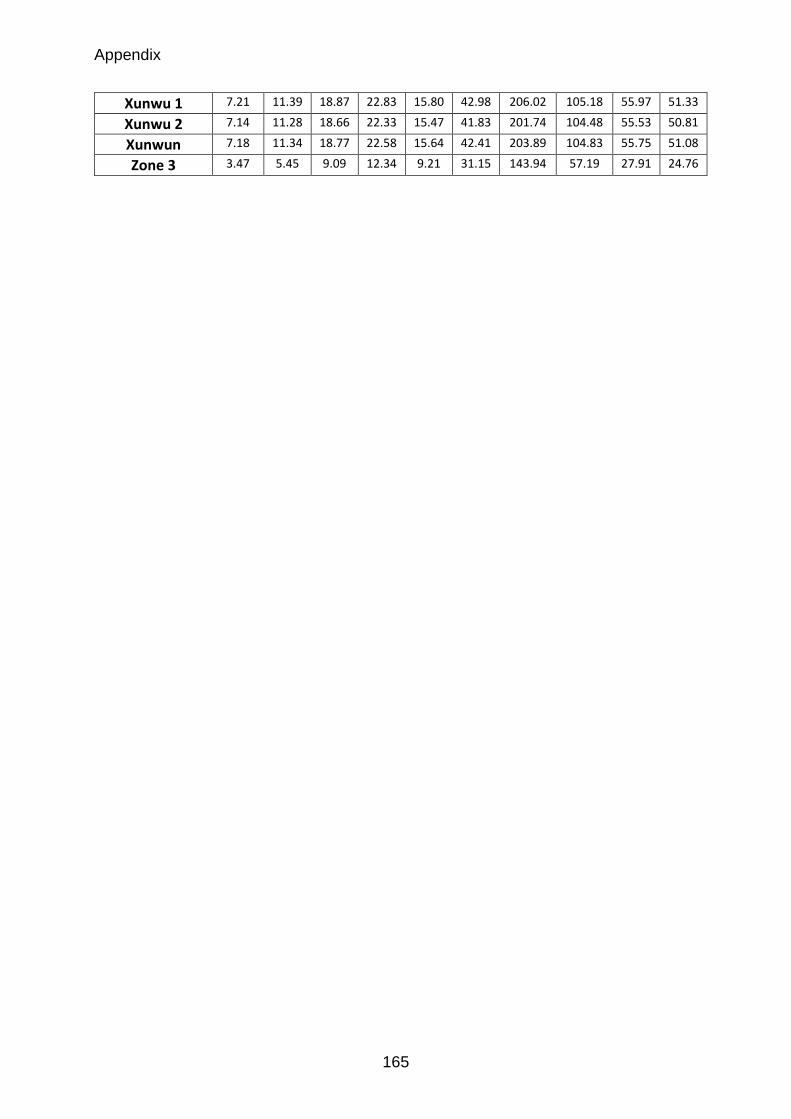
Appendix
165
Xunwu 1 7.21 11.39 18.87 22.83 15.80 42.98 206.02 105.18 55.97 51.33
Xunwu 2 7.14 11.28 18.66 22.33 15.47 41.83 201.74 104.48 55.53 50.81
Xunwun 7.18 11.34 18.77 22.58 15.64 42.41 203.89 104.83 55.75 51.08
Zone 3 3.47 5.45 9.09 12.34 9.21 31.15 143.94 57.19 27.91 24.76
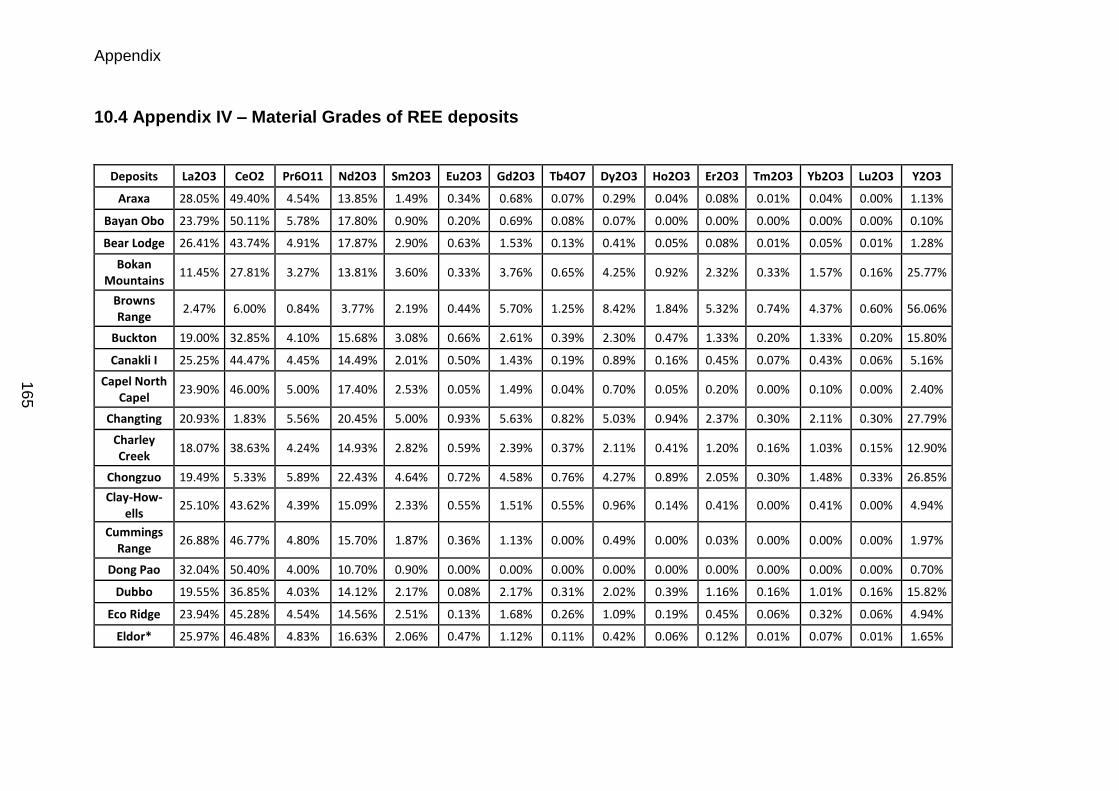
Appendix
10.4 Appendix IV – Material Grades of REE deposits
Deposits La2O3 CeO2 Pr6O11 Nd2O3 Sm2O3 Eu2O3 Gd2O3 Tb4O7 Dy2O3 Ho2O3 Er2O3 Tm2O3 Yb2O3 Lu2O3 Y2O3
Araxa 28.05% 49.40% 4.54% 13.85% 1.49% 0.34% 0.68% 0.07% 0.29% 0.04% 0.08% 0.01% 0.04% 0.00% 1.13%
Bayan Obo 23.79% 50.11% 5.78% 17.80% 0.90% 0.20% 0.69% 0.08% 0.07% 0.00% 0.00% 0.00% 0.00% 0.00% 0.10%
Bear Lodge 26.41% 43.74% 4.91% 17.87% 2.90% 0.63% 1.53% 0.13% 0.41% 0.05% 0.08% 0.01% 0.05% 0.01% 1.28%
Bokan Mountains
11.45% 27.81% 3.27% 13.81% 3.60% 0.33% 3.76% 0.65% 4.25% 0.92% 2.32% 0.33% 1.57% 0.16% 25.77%
Browns Range
2.47% 6.00% 0.84% 3.77% 2.19% 0.44% 5.70% 1.25% 8.42% 1.84% 5.32% 0.74% 4.37% 0.60% 56.06%
Buckton 19.00% 32.85% 4.10% 15.68% 3.08% 0.66% 2.61% 0.39% 2.30% 0.47% 1.33% 0.20% 1.33% 0.20% 15.80%
Canakli I 25.25% 44.47% 4.45% 14.49% 2.01% 0.50% 1.43% 0.19% 0.89% 0.16% 0.45% 0.07% 0.43% 0.06% 5.16%
Capel North Capel
23.90% 46.00% 5.00% 17.40% 2.53% 0.05% 1.49% 0.04% 0.70% 0.05% 0.20% 0.00% 0.10% 0.00% 2.40%
Changting 20.93% 1.83% 5.56% 20.45% 5.00% 0.93% 5.63% 0.82% 5.03% 0.94% 2.37% 0.30% 2.11% 0.30% 27.79%
Charley Creek
18.07% 38.63% 4.24% 14.93% 2.82% 0.59% 2.39% 0.37% 2.11% 0.41% 1.20% 0.16% 1.03% 0.15% 12.90%
Chongzuo 19.49% 5.33% 5.89% 22.43% 4.64% 0.72% 4.58% 0.76% 4.27% 0.89% 2.05% 0.30% 1.48% 0.33% 26.85%
Clay-How-ells
25.10% 43.62% 4.39% 15.09% 2.33% 0.55% 1.51% 0.55% 0.96% 0.14% 0.41% 0.00% 0.41% 0.00% 4.94%
Cummings Range
26.88% 46.77% 4.80% 15.70% 1.87% 0.36% 1.13% 0.00% 0.49% 0.00% 0.03% 0.00% 0.00% 0.00% 1.97%
Dong Pao 32.04% 50.40% 4.00% 10.70% 0.90% 0.00% 0.00% 0.00% 0.00% 0.00% 0.00% 0.00% 0.00% 0.00% 0.70%
Dubbo 19.55% 36.85% 4.03% 14.12% 2.17% 0.08% 2.17% 0.31% 2.02% 0.39% 1.16% 0.16% 1.01% 0.16% 15.82%
Eco Ridge 23.94% 45.28% 4.54% 14.56% 2.51% 0.13% 1.68% 0.26% 1.09% 0.19% 0.45% 0.06% 0.32% 0.06% 4.94%
Eldor* 25.97% 46.48% 4.83% 16.63% 2.06% 0.47% 1.12% 0.11% 0.42% 0.06% 0.12% 0.01% 0.07% 0.01% 1.65%
16
5
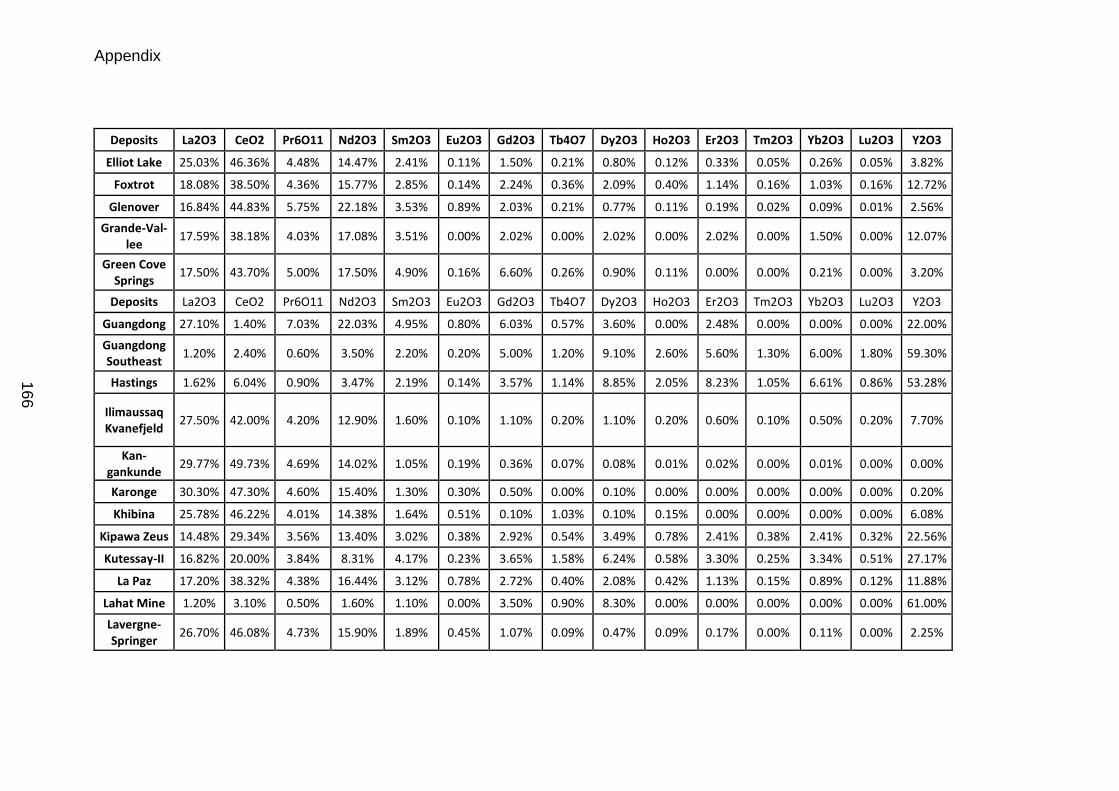
Appendix
Deposits La2O3 CeO2 Pr6O11 Nd2O3 Sm2O3 Eu2O3 Gd2O3 Tb4O7 Dy2O3 Ho2O3 Er2O3 Tm2O3 Yb2O3 Lu2O3 Y2O3
Elliot Lake 25.03% 46.36% 4.48% 14.47% 2.41% 0.11% 1.50% 0.21% 0.80% 0.12% 0.33% 0.05% 0.26% 0.05% 3.82%
Foxtrot 18.08% 38.50% 4.36% 15.77% 2.85% 0.14% 2.24% 0.36% 2.09% 0.40% 1.14% 0.16% 1.03% 0.16% 12.72%
Glenover 16.84% 44.83% 5.75% 22.18% 3.53% 0.89% 2.03% 0.21% 0.77% 0.11% 0.19% 0.02% 0.09% 0.01% 2.56%
Grande-Val-lee
17.59% 38.18% 4.03% 17.08% 3.51% 0.00% 2.02% 0.00% 2.02% 0.00% 2.02% 0.00% 1.50% 0.00% 12.07%
Green Cove Springs
17.50% 43.70% 5.00% 17.50% 4.90% 0.16% 6.60% 0.26% 0.90% 0.11% 0.00% 0.00% 0.21% 0.00% 3.20%
Deposits La2O3 CeO2 Pr6O11 Nd2O3 Sm2O3 Eu2O3 Gd2O3 Tb4O7 Dy2O3 Ho2O3 Er2O3 Tm2O3 Yb2O3 Lu2O3 Y2O3
Guangdong 27.10% 1.40% 7.03% 22.03% 4.95% 0.80% 6.03% 0.57% 3.60% 0.00% 2.48% 0.00% 0.00% 0.00% 22.00%
Guangdong Southeast
1.20% 2.40% 0.60% 3.50% 2.20% 0.20% 5.00% 1.20% 9.10% 2.60% 5.60% 1.30% 6.00% 1.80% 59.30%
Hastings 1.62% 6.04% 0.90% 3.47% 2.19% 0.14% 3.57% 1.14% 8.85% 2.05% 8.23% 1.05% 6.61% 0.86% 53.28%
Ilimaussaq Kvanefjeld
27.50% 42.00% 4.20% 12.90% 1.60% 0.10% 1.10% 0.20% 1.10% 0.20% 0.60% 0.10% 0.50% 0.20% 7.70%
Kan-gankunde
29.77% 49.73% 4.69% 14.02% 1.05% 0.19% 0.36% 0.07% 0.08% 0.01% 0.02% 0.00% 0.01% 0.00% 0.00%
Karonge 30.30% 47.30% 4.60% 15.40% 1.30% 0.30% 0.50% 0.00% 0.10% 0.00% 0.00% 0.00% 0.00% 0.00% 0.20%
Khibina 25.78% 46.22% 4.01% 14.38% 1.64% 0.51% 0.10% 1.03% 0.10% 0.15% 0.00% 0.00% 0.00% 0.00% 6.08%
Kipawa Zeus 14.48% 29.34% 3.56% 13.40% 3.02% 0.38% 2.92% 0.54% 3.49% 0.78% 2.41% 0.38% 2.41% 0.32% 22.56%
Kutessay-II 16.82% 20.00% 3.84% 8.31% 4.17% 0.23% 3.65% 1.58% 6.24% 0.58% 3.30% 0.25% 3.34% 0.51% 27.17%
La Paz 17.20% 38.32% 4.38% 16.44% 3.12% 0.78% 2.72% 0.40% 2.08% 0.42% 1.13% 0.15% 0.89% 0.12% 11.88%
Lahat Mine 1.20% 3.10% 0.50% 1.60% 1.10% 0.00% 3.50% 0.90% 8.30% 0.00% 0.00% 0.00% 0.00% 0.00% 61.00%
Lavergne-Springer
26.70% 46.08% 4.73% 15.90% 1.89% 0.45% 1.07% 0.09% 0.47% 0.09% 0.17% 0.00% 0.11% 0.00% 2.25%
16
6
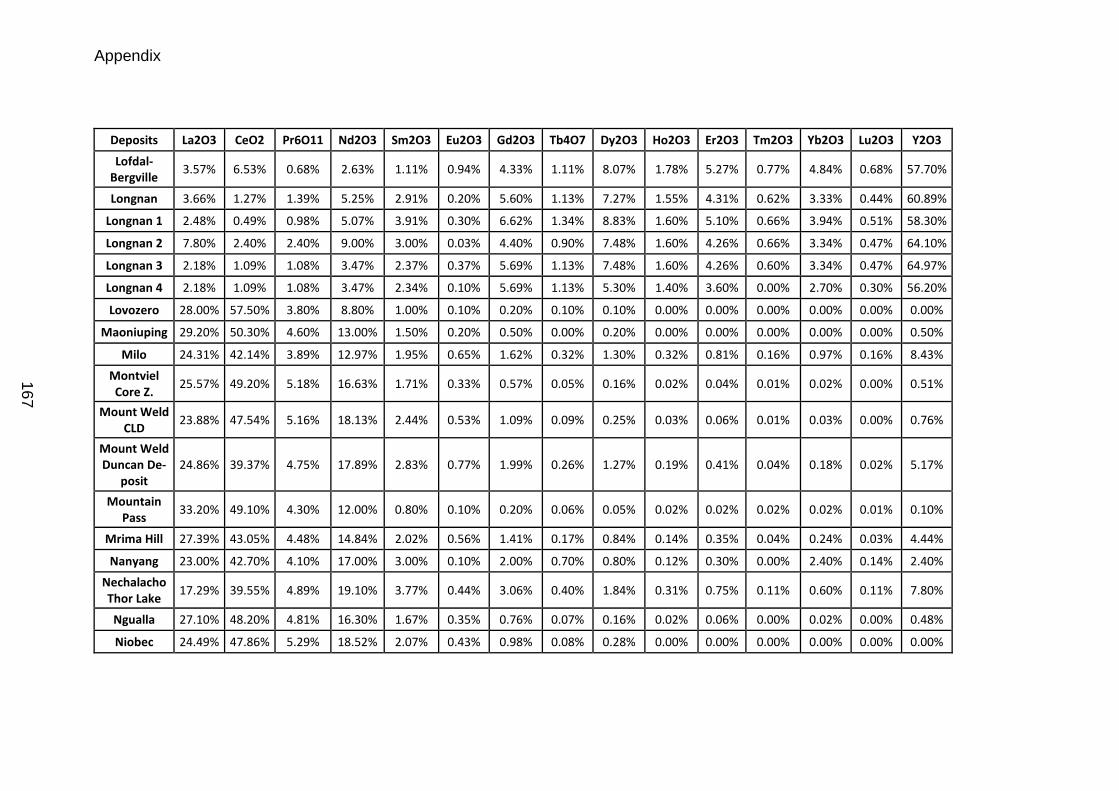
Appendix
Deposits La2O3 CeO2 Pr6O11 Nd2O3 Sm2O3 Eu2O3 Gd2O3 Tb4O7 Dy2O3 Ho2O3 Er2O3 Tm2O3 Yb2O3 Lu2O3 Y2O3
Lofdal-Bergville
3.57% 6.53% 0.68% 2.63% 1.11% 0.94% 4.33% 1.11% 8.07% 1.78% 5.27% 0.77% 4.84% 0.68% 57.70%
Longnan 3.66% 1.27% 1.39% 5.25% 2.91% 0.20% 5.60% 1.13% 7.27% 1.55% 4.31% 0.62% 3.33% 0.44% 60.89%
Longnan 1 2.48% 0.49% 0.98% 5.07% 3.91% 0.30% 6.62% 1.34% 8.83% 1.60% 5.10% 0.66% 3.94% 0.51% 58.30%
Longnan 2 7.80% 2.40% 2.40% 9.00% 3.00% 0.03% 4.40% 0.90% 7.48% 1.60% 4.26% 0.66% 3.34% 0.47% 64.10%
Longnan 3 2.18% 1.09% 1.08% 3.47% 2.37% 0.37% 5.69% 1.13% 7.48% 1.60% 4.26% 0.60% 3.34% 0.47% 64.97%
Longnan 4 2.18% 1.09% 1.08% 3.47% 2.34% 0.10% 5.69% 1.13% 5.30% 1.40% 3.60% 0.00% 2.70% 0.30% 56.20%
Lovozero 28.00% 57.50% 3.80% 8.80% 1.00% 0.10% 0.20% 0.10% 0.10% 0.00% 0.00% 0.00% 0.00% 0.00% 0.00%
Maoniuping 29.20% 50.30% 4.60% 13.00% 1.50% 0.20% 0.50% 0.00% 0.20% 0.00% 0.00% 0.00% 0.00% 0.00% 0.50%
Milo 24.31% 42.14% 3.89% 12.97% 1.95% 0.65% 1.62% 0.32% 1.30% 0.32% 0.81% 0.16% 0.97% 0.16% 8.43%
Montviel Core Z.
25.57% 49.20% 5.18% 16.63% 1.71% 0.33% 0.57% 0.05% 0.16% 0.02% 0.04% 0.01% 0.02% 0.00% 0.51%
Mount Weld CLD
23.88% 47.54% 5.16% 18.13% 2.44% 0.53% 1.09% 0.09% 0.25% 0.03% 0.06% 0.01% 0.03% 0.00% 0.76%
Mount Weld Duncan De-
posit 24.86% 39.37% 4.75% 17.89% 2.83% 0.77% 1.99% 0.26% 1.27% 0.19% 0.41% 0.04% 0.18% 0.02% 5.17%
Mountain Pass
33.20% 49.10% 4.30% 12.00% 0.80% 0.10% 0.20% 0.06% 0.05% 0.02% 0.02% 0.02% 0.02% 0.01% 0.10%
Mrima Hill 27.39% 43.05% 4.48% 14.84% 2.02% 0.56% 1.41% 0.17% 0.84% 0.14% 0.35% 0.04% 0.24% 0.03% 4.44%
Nanyang 23.00% 42.70% 4.10% 17.00% 3.00% 0.10% 2.00% 0.70% 0.80% 0.12% 0.30% 0.00% 2.40% 0.14% 2.40%
Nechalacho Thor Lake
17.29% 39.55% 4.89% 19.10% 3.77% 0.44% 3.06% 0.40% 1.84% 0.31% 0.75% 0.11% 0.60% 0.11% 7.80%
Ngualla 27.10% 48.20% 4.81% 16.30% 1.67% 0.35% 0.76% 0.07% 0.16% 0.02% 0.06% 0.00% 0.02% 0.00% 0.48%
Niobec 24.49% 47.86% 5.29% 18.52% 2.07% 0.43% 0.98% 0.08% 0.28% 0.00% 0.00% 0.00% 0.00% 0.00% 0.00%
16
7

Appendix
Deposits La2O3 CeO2 Pr6O11 Nd2O3 Sm2O3 Eu2O3 Gd2O3 Tb4O7 Dy2O3 Ho2O3 Er2O3 Tm2O3 Yb2O3 Lu2O3 Y2O3
Nisikkatch-Hoidas Lake
20.44% 46.61% 5.97% 20.57% 2.71% 0.54% 1.24% 0.11% 0.35% 0.00% 0.24% 0.00% 0.05% 0.00% 1.17%
Nolans Bore 19.13% 48.72% 5.93% 20.58% 2.30% 0.39% 0.99% 0.08% 0.32% 0.05% 0.09% 0.01% 0.06% 0.01% 1.35%
Norra Kärr 10.01% 22.52% 2.86% 11.31% 2.98% 0.37% 3.16% 0.63% 4.25% 0.93% 2.87% 0.45% 2.74% 0.37% 34.55%
North Strad-broke
21.50% 45.80% 5.30% 18.60% 3.10% 0.80% 1.80% 0.30% 0.60% 0.10% 0.20% 0.00% 0.10% 0.01% 2.50%
Olserum 13.53% 30.71% 3.80% 14.62% 3.38% 0.16% 3.48% 0.65% 3.48% 0.72% 2.02% 0.32% 1.78% 0.32% 21.03%
Round Top 3.74% 14.74% 1.93% 5.25% 1.89% 0.03% 1.87% 0.64% 5.61% 1.42% 5.87% 1.29% 10.23% 1.59% 43.90%
Sandkopsdrif 25.37% 0.44% 0.05% 0.16% 0.02% 0.01% 1.42% 0.17% 0.78% 0.13% 0.32% 0.04% 0.22% 0.03% 4.12%
Sarfartoq 21.58% 49.91% 5.75% 18.82% 1.85% 0.41% 1.02% 0.08% 0.20% 0.00% 0.00% 0.00% 0.00% 0.00% 0.39%
Songwe Hill 24.63% 44.60% 4.77% 16.36% 2.38% 0.57% 1.35% 0.16% 0.79% 0.13% 0.30% 0.04% 0.22% 0.03% 3.67%
Sorensen 27.78% 43.28% 4.03% 11.71% 1.46% 0.13% 1.07% 0.16% 0.97% 0.18% 0.52% 0.07% 0.45% 0.05% 8.12%
Steenkampskraal 20.76% 45.28% 5.12% 17.98% 2.87% 0.07% 1.95% 0.22% 1.00% 0.14% 0.29% 0.03% 0.13% 0.01% 4.14%
Storkwitz 27.38% 48.67% 5.07% 14.19% 1.35% 0.30% 1.12% 0.13% 0.22% 0.07% 0.14% 0.01% 0.12% 0.01% 1.22%
Strange Lake 12.09% 27.98% 3.05% 11.17% 2.60% 0.13% 2.65% 0.57% 4.02% 0.90% 2.88% 0.45% 2.95% 0.42% 28.15%
Tanbreez 17.77% 33.25% 3.23% 12.21% 2.34% 0.25% 2.57% 0.46% 2.87% 0.64% 2.39% 0.30% 2.04% 0.28% 19.38%
Tantalus-Diana 20.84% 38.00% 4.29% 15.32% 2.57% 0.31% 2.08% 0.32% 1.84% 0.38% 1.10% 0.16% 0.98% 0.16% 11.65%
Two Tom 24.37% 46.02% 4.74% 15.90% 2.71% 0.25% 1.61% 0.17% 0.68% 0.09% 0.17% 0.00% 0.09% 0.00% 3.22%
Wigu Hill 38.34% 48.58% 3.61% 8.54% 0.49% 0.11% 0.14% 0.02% 0.03% 0.01% 0.01% 0.00% 0.01% 0.00% 0.13%
Xiluvo 21.68% 46.31% 4.93% 17.24% 2.46% 0.49% 1.48% 0.00% 0.99% 0.00% 0.49% 0.00% 0.00% 0.00% 3.94%
Xinfen 23.57% 2.57% 5.81% 19.33% 4.52% 0.82% 5.38% 0.73% 3.91% 0.77% 2.24% 0.24% 1.37% 0.21% 24.68%
Xinfen 1 26.20% 1.90% 6.00% 21.10% 4.50% 0.71% 4.80% 0.77% 4.10% 0.80% 2.00% 0.20% 1.60% 0.20% 25.10%
Xinfen 2 20.93% 3.23% 5.62% 17.55% 4.54% 0.93% 5.96% 0.68% 3.71% 0.74% 2.48% 0.27% 1.13% 0.21% 24.26%
16
8
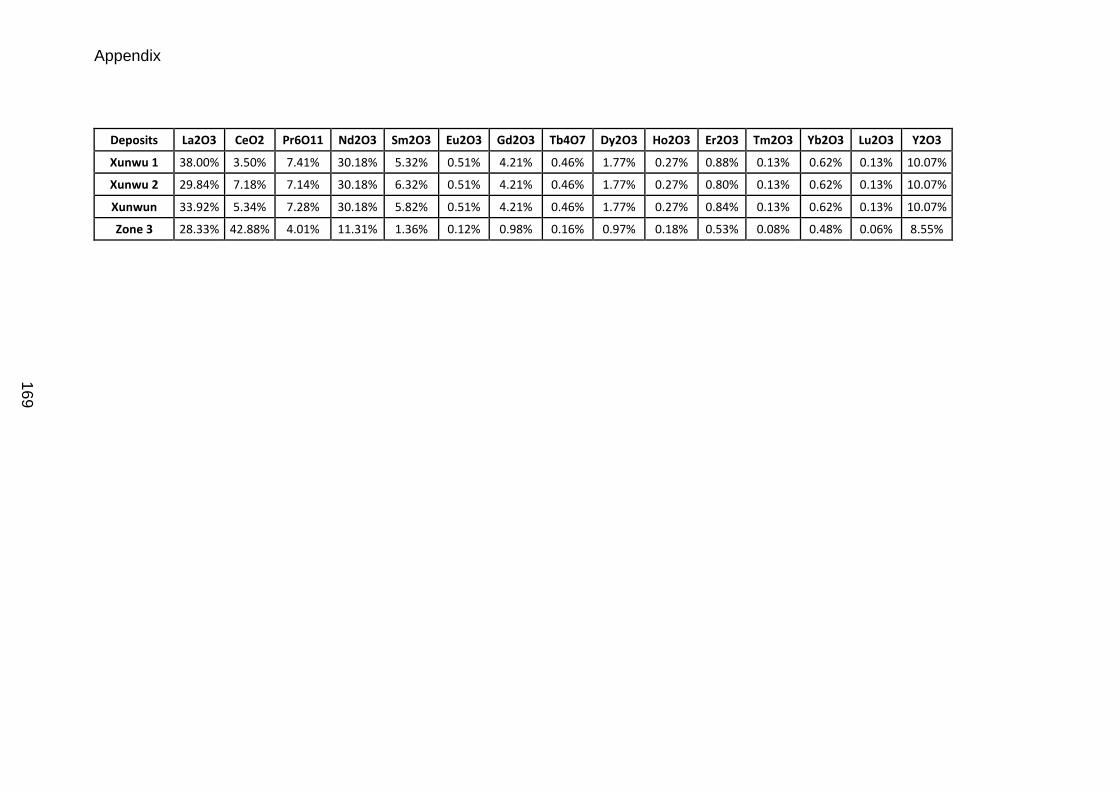
Appendix
Deposits La2O3 CeO2 Pr6O11 Nd2O3 Sm2O3 Eu2O3 Gd2O3 Tb4O7 Dy2O3 Ho2O3 Er2O3 Tm2O3 Yb2O3 Lu2O3 Y2O3
Xunwu 1 38.00% 3.50% 7.41% 30.18% 5.32% 0.51% 4.21% 0.46% 1.77% 0.27% 0.88% 0.13% 0.62% 0.13% 10.07%
Xunwu 2 29.84% 7.18% 7.14% 30.18% 6.32% 0.51% 4.21% 0.46% 1.77% 0.27% 0.80% 0.13% 0.62% 0.13% 10.07%
Xunwun 33.92% 5.34% 7.28% 30.18% 5.82% 0.51% 4.21% 0.46% 1.77% 0.27% 0.84% 0.13% 0.62% 0.13% 10.07%
Zone 3 28.33% 42.88% 4.01% 11.31% 1.36% 0.12% 0.98% 0.16% 0.97% 0.18% 0.53% 0.08% 0.48% 0.06% 8.55%
16
9
16
9
16
8
16
9
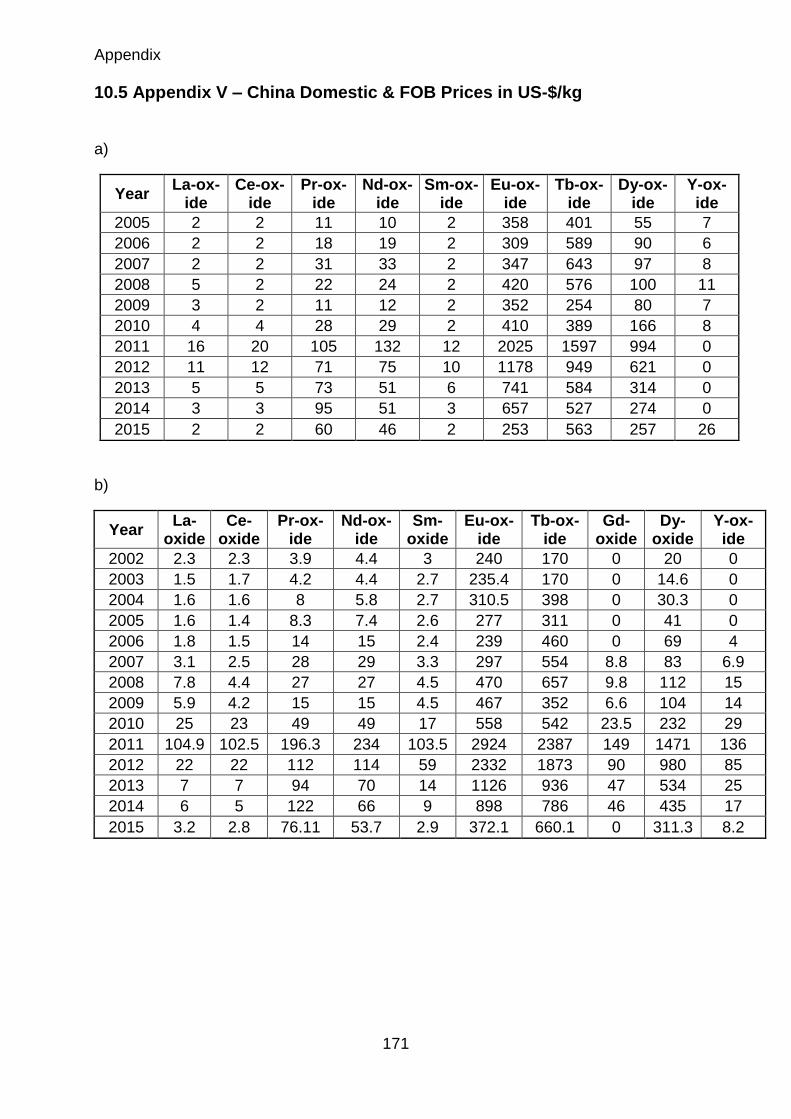
Appendix
171
10.5 Appendix V – China Domestic & FOB Prices in US-$/kg
a)
Year La-ox-
ide Ce-ox-
ide Pr-ox-
ide Nd-ox-
ide Sm-ox-
ide Eu-ox-
ide Tb-ox-
ide Dy-ox-
ide Y-ox-ide
2005 2 2 11 10 2 358 401 55 7
2006 2 2 18 19 2 309 589 90 6
2007 2 2 31 33 2 347 643 97 8
2008 5 2 22 24 2 420 576 100 11
2009 3 2 11 12 2 352 254 80 7
2010 4 4 28 29 2 410 389 166 8
2011 16 20 105 132 12 2025 1597 994 0
2012 11 12 71 75 10 1178 949 621 0
2013 5 5 73 51 6 741 584 314 0
2014 3 3 95 51 3 657 527 274 0
2015 2 2 60 46 2 253 563 257 26
b)
Year La-
oxide Ce-
oxide Pr-ox-
ide Nd-ox-
ide Sm-
oxide Eu-ox-
ide Tb-ox-
ide Gd-
oxide Dy-
oxide Y-ox-ide
2002 2.3 2.3 3.9 4.4 3 240 170 0 20 0
2003 1.5 1.7 4.2 4.4 2.7 235.4 170 0 14.6 0
2004 1.6 1.6 8 5.8 2.7 310.5 398 0 30.3 0
2005 1.6 1.4 8.3 7.4 2.6 277 311 0 41 0
2006 1.8 1.5 14 15 2.4 239 460 0 69 4
2007 3.1 2.5 28 29 3.3 297 554 8.8 83 6.9
2008 7.8 4.4 27 27 4.5 470 657 9.8 112 15
2009 5.9 4.2 15 15 4.5 467 352 6.6 104 14
2010 25 23 49 49 17 558 542 23.5 232 29
2011 104.9 102.5 196.3 234 103.5 2924 2387 149 1471 136
2012 22 22 112 114 59 2332 1873 90 980 85
2013 7 7 94 70 14 1126 936 47 534 25
2014 6 5 122 66 9 898 786 46 435 17
2015 3.2 2.8 76.11 53.7 2.9 372.1 660.1 0 311.3 8.2
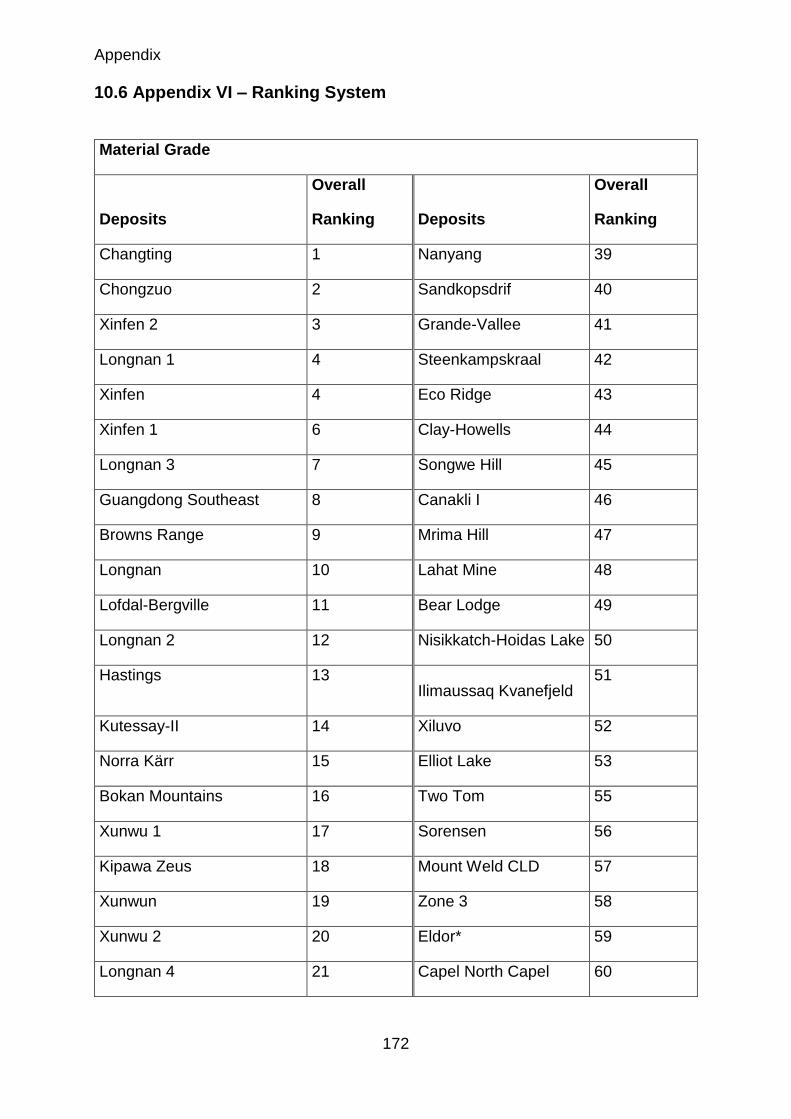
Appendix
172
10.6 Appendix VI – Ranking System
Material Grade
Deposits
Overall
Ranking Deposits
Overall
Ranking
Changting 1 Nanyang 39
Chongzuo 2 Sandkopsdrif 40
Xinfen 2 3 Grande-Vallee 41
Longnan 1 4 Steenkampskraal 42
Xinfen 4 Eco Ridge 43
Xinfen 1 6 Clay-Howells 44
Longnan 3 7 Songwe Hill 45
Guangdong Southeast 8 Canakli I 46
Browns Range 9 Mrima Hill 47
Longnan 10 Lahat Mine 48
Lofdal-Bergville 11 Bear Lodge 49
Longnan 2 12 Nisikkatch-Hoidas Lake 50
Hastings 13 Ilimaussaq Kvanefjeld
51
Kutessay-II 14 Xiluvo 52
Norra Kärr 15 Elliot Lake 53
Bokan Mountains 16 Two Tom 55
Xunwu 1 17 Sorensen 56
Kipawa Zeus 18 Mount Weld CLD 57
Xunwun 19 Zone 3 58
Xunwu 2 20 Eldor* 59
Longnan 4 21 Capel North Capel 60
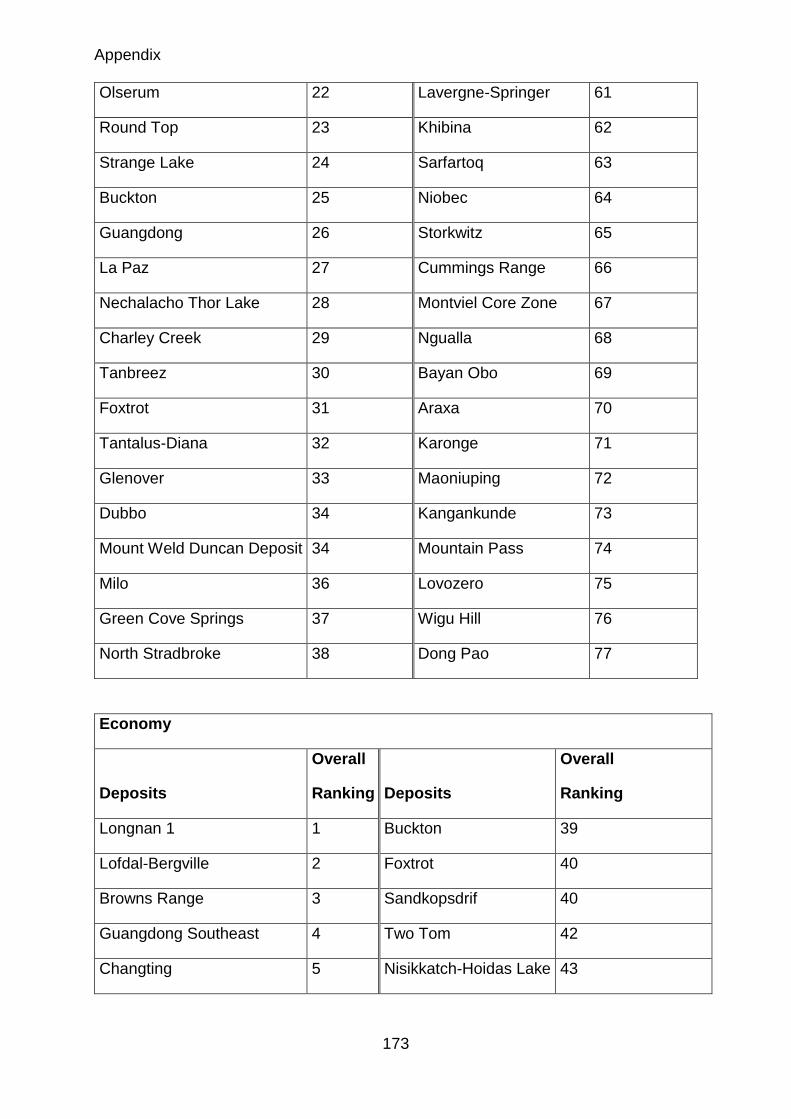
Appendix
173
Olserum 22 Lavergne-Springer 61
Round Top 23 Khibina 62
Strange Lake 24 Sarfartoq 63
Buckton 25 Niobec 64
Guangdong 26 Storkwitz 65
La Paz 27 Cummings Range 66
Nechalacho Thor Lake 28 Montviel Core Zone 67
Charley Creek 29 Ngualla 68
Tanbreez 30 Bayan Obo 69
Foxtrot 31 Araxa 70
Tantalus-Diana 32 Karonge 71
Glenover 33 Maoniuping 72
Dubbo 34 Kangankunde 73
Mount Weld Duncan Deposit 34 Mountain Pass 74
Milo 36 Lovozero 75
Green Cove Springs 37 Wigu Hill 76
North Stradbroke 38 Dong Pao 77
Economy
Deposits
Overall
Ranking Deposits
Overall
Ranking
Longnan 1 1 Buckton 39
Lofdal-Bergville 2 Foxtrot 40
Browns Range 3 Sandkopsdrif 40
Guangdong Southeast 4 Two Tom 42
Changting 5 Nisikkatch-Hoidas Lake 43
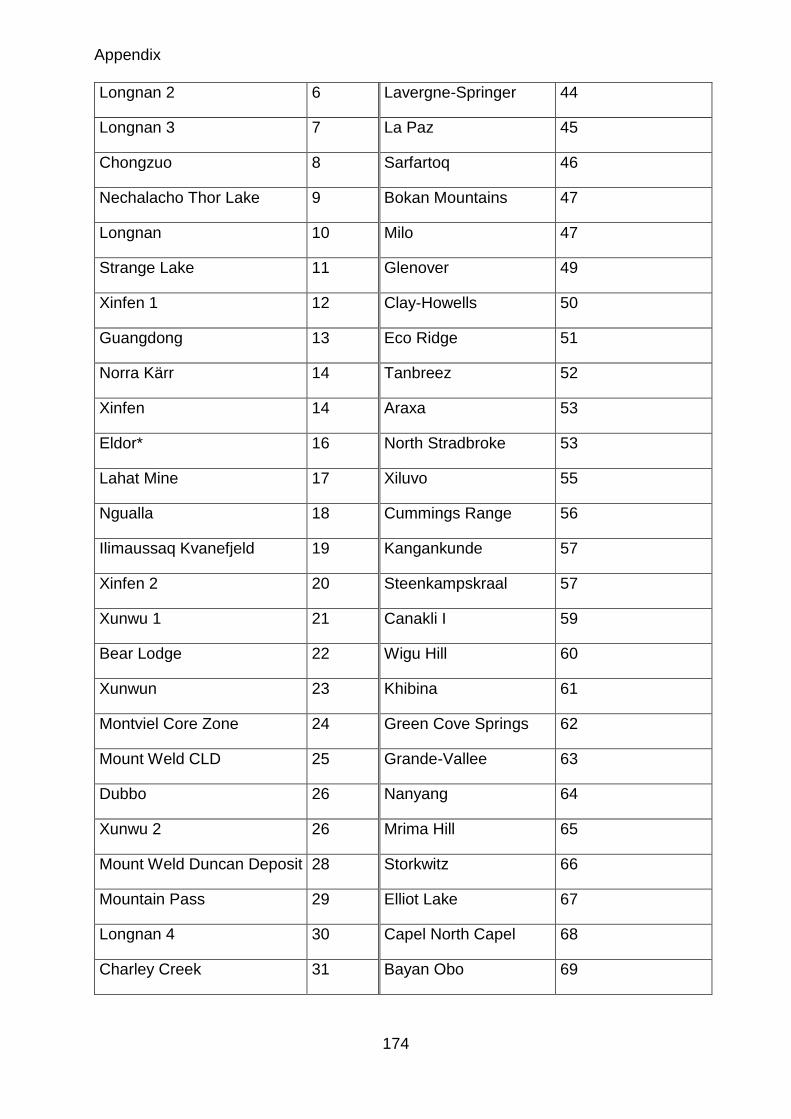
Appendix
174
Longnan 2 6 Lavergne-Springer 44
Longnan 3 7 La Paz 45
Chongzuo 8 Sarfartoq 46
Nechalacho Thor Lake 9 Bokan Mountains 47
Longnan 10 Milo 47
Strange Lake 11 Glenover 49
Xinfen 1 12 Clay-Howells 50
Guangdong 13 Eco Ridge 51
Norra Kärr 14 Tanbreez 52
Xinfen 14 Araxa 53
Eldor* 16 North Stradbroke 53
Lahat Mine 17 Xiluvo 55
Ngualla 18 Cummings Range 56
Ilimaussaq Kvanefjeld 19 Kangankunde 57
Xinfen 2 20 Steenkampskraal 57
Xunwu 1 21 Canakli I 59
Bear Lodge 22 Wigu Hill 60
Xunwun 23 Khibina 61
Montviel Core Zone 24 Green Cove Springs 62
Mount Weld CLD 25 Grande-Vallee 63
Dubbo 26 Nanyang 64
Xunwu 2 26 Mrima Hill 65
Mount Weld Duncan Deposit 28 Storkwitz 66
Mountain Pass 29 Elliot Lake 67
Longnan 4 30 Capel North Capel 68
Charley Creek 31 Bayan Obo 69
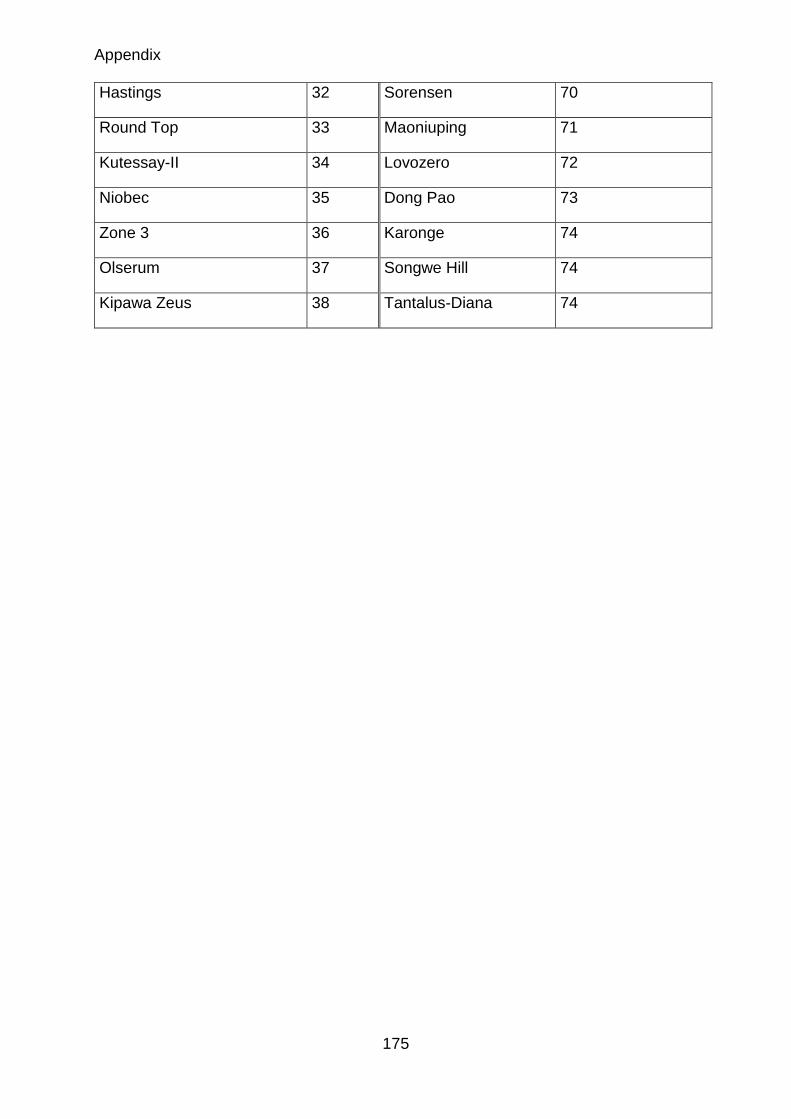
Appendix
175
Hastings 32 Sorensen 70
Round Top 33 Maoniuping 71
Kutessay-II 34 Lovozero 72
Niobec 35 Dong Pao 73
Zone 3 36 Karonge 74
Olserum 37 Songwe Hill 74
Kipawa Zeus 38 Tantalus-Diana 74
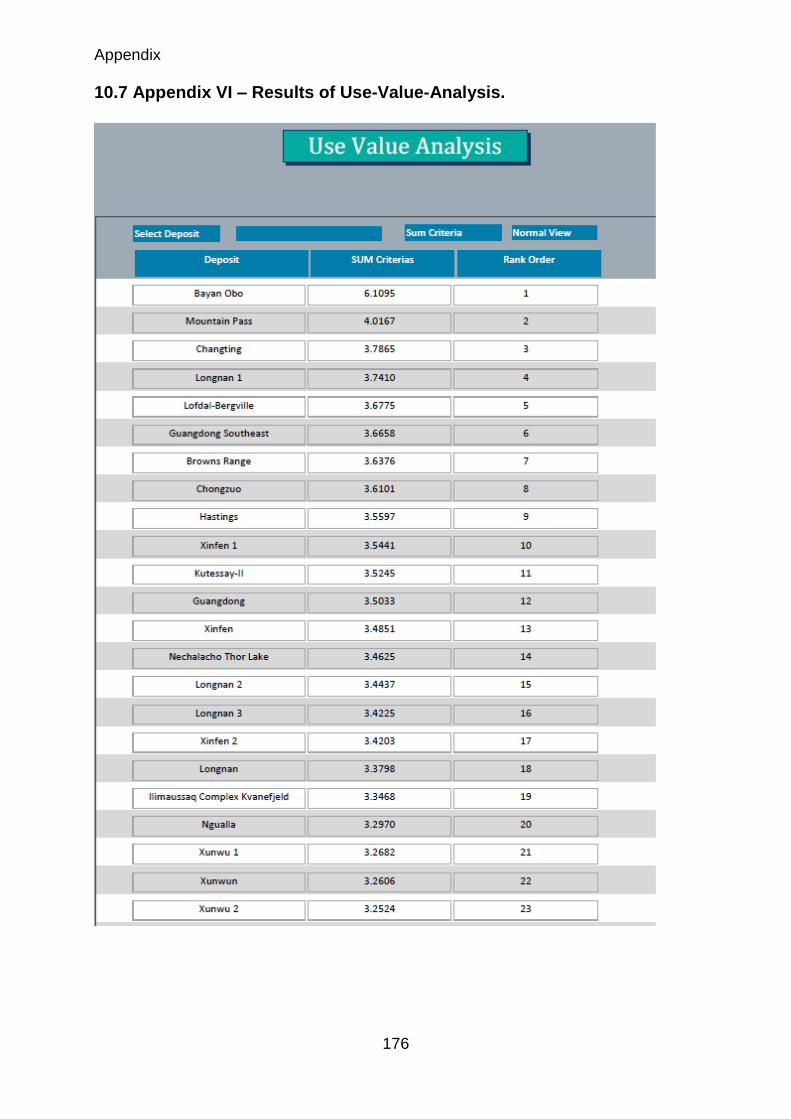
Appendix
176
10.7 Appendix VI – Results of Use-Value-Analysis.
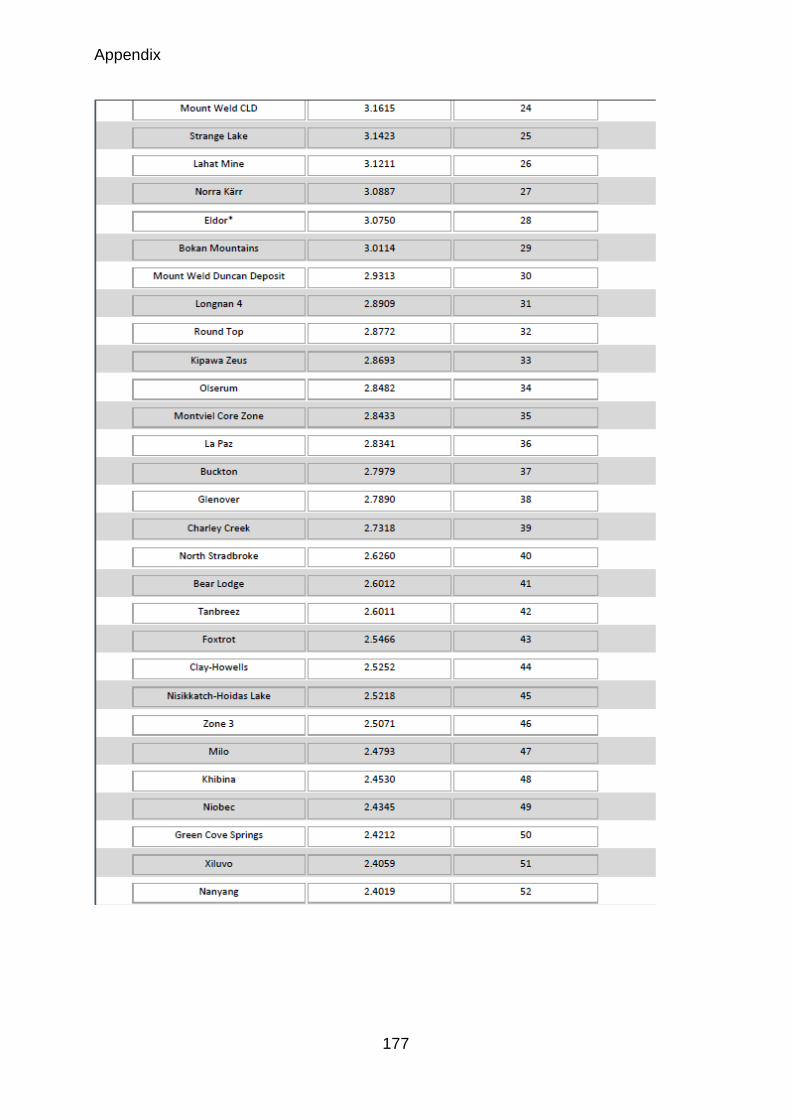
Appendix
177
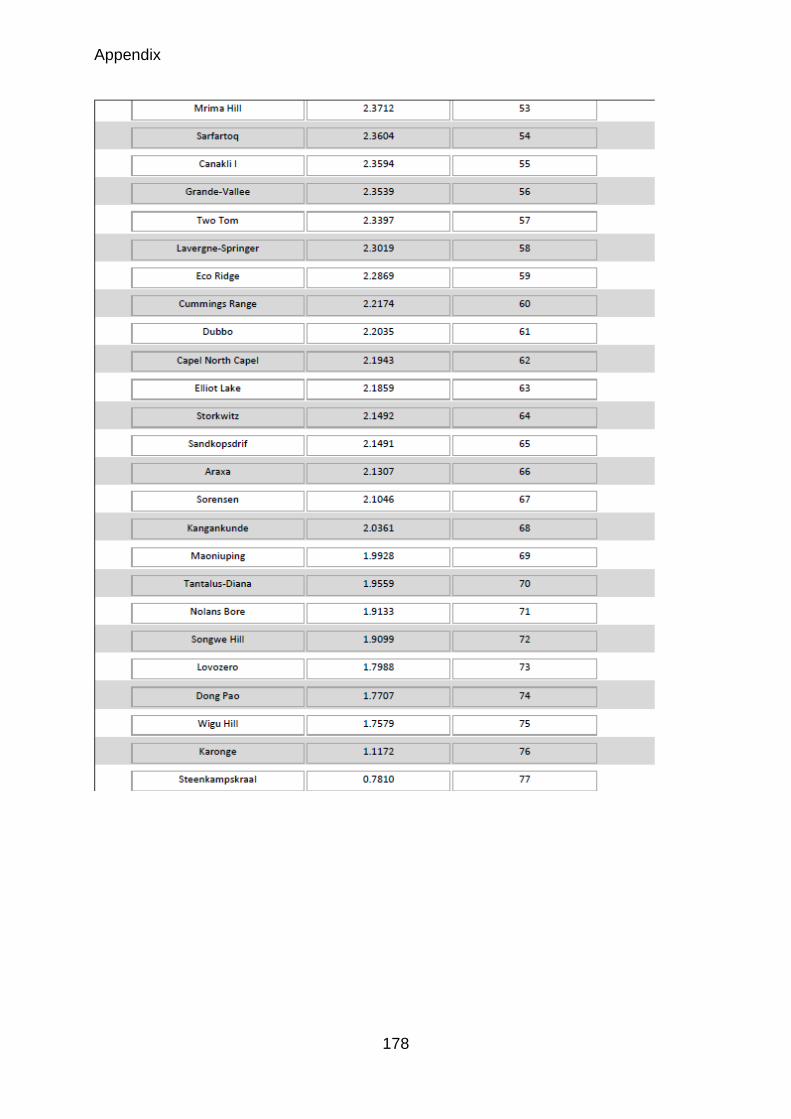
Appendix
178
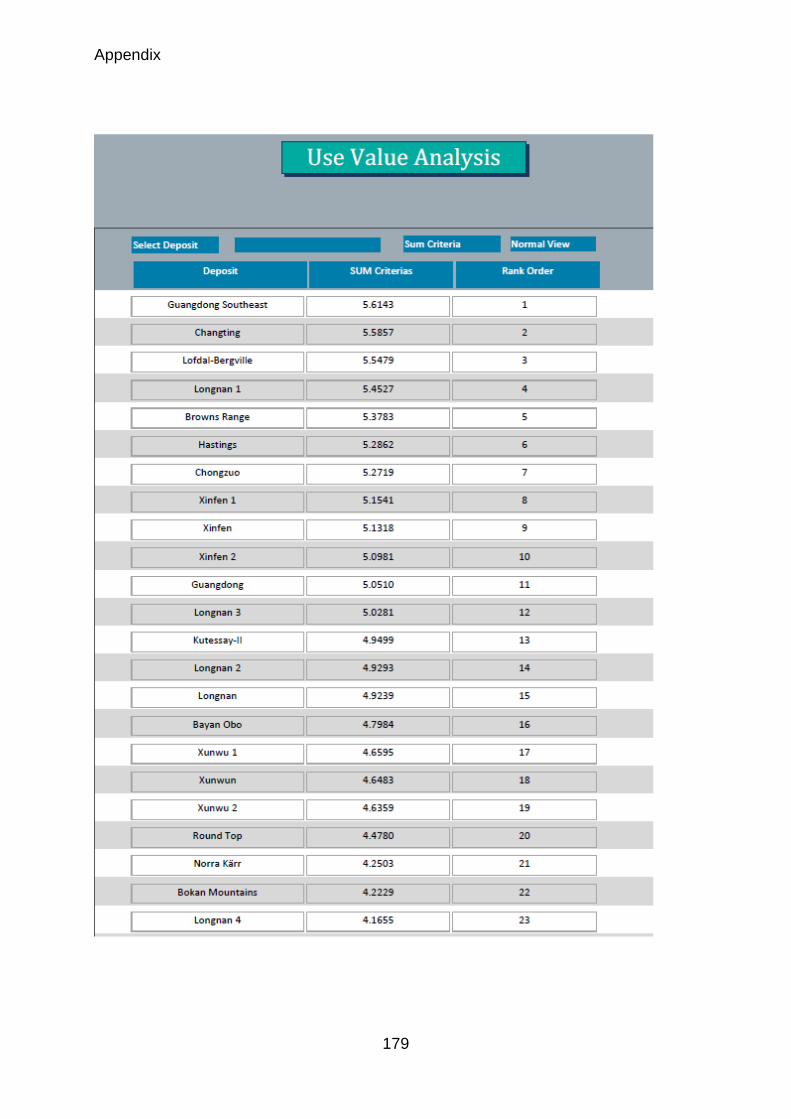
Appendix
179
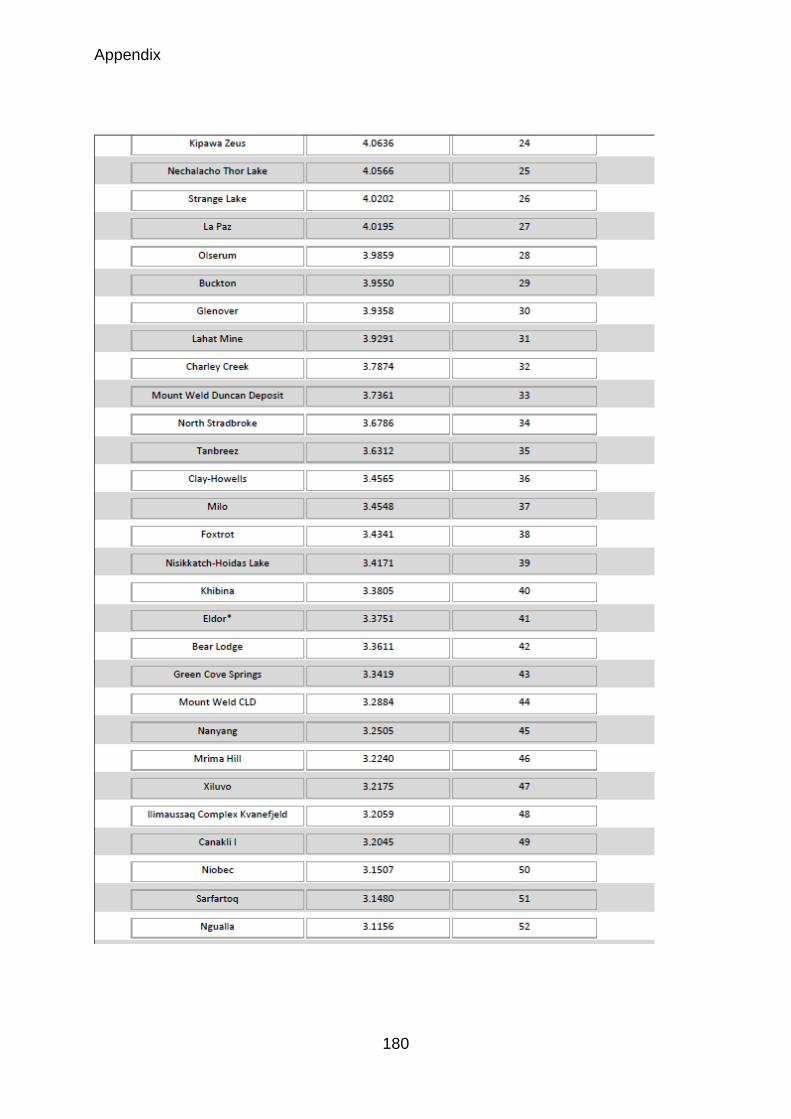
Appendix
180
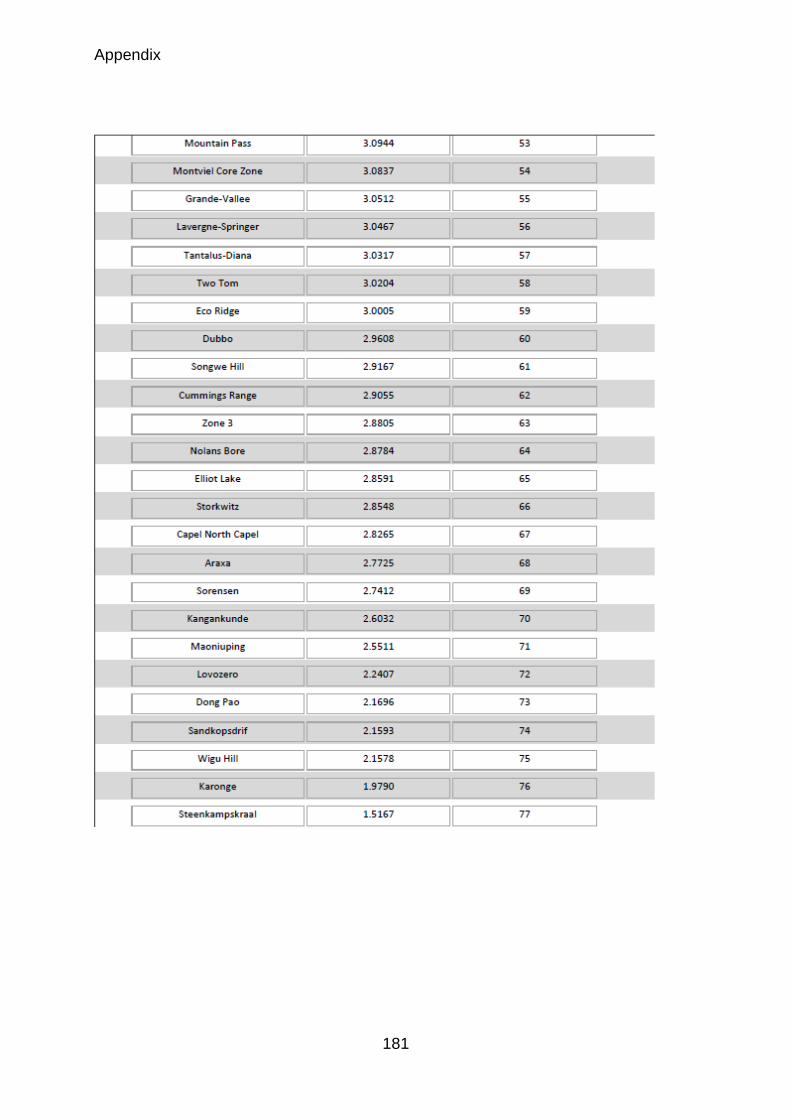
Appendix
181
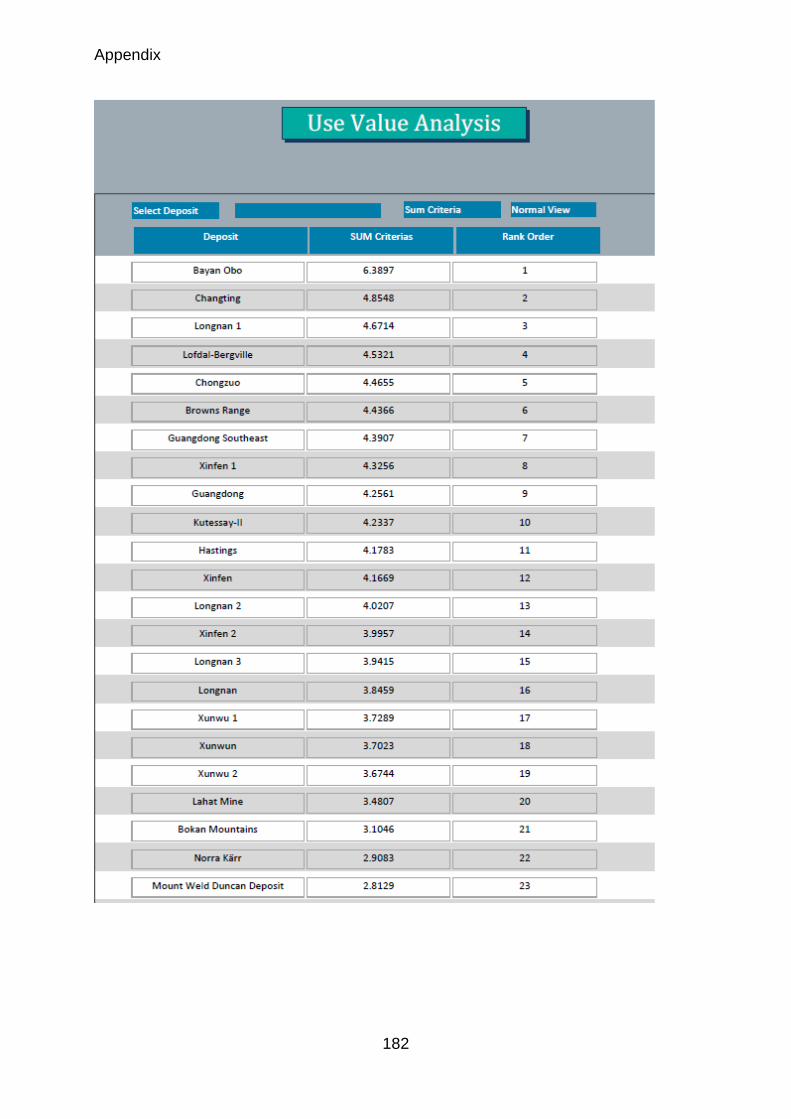
Appendix
182
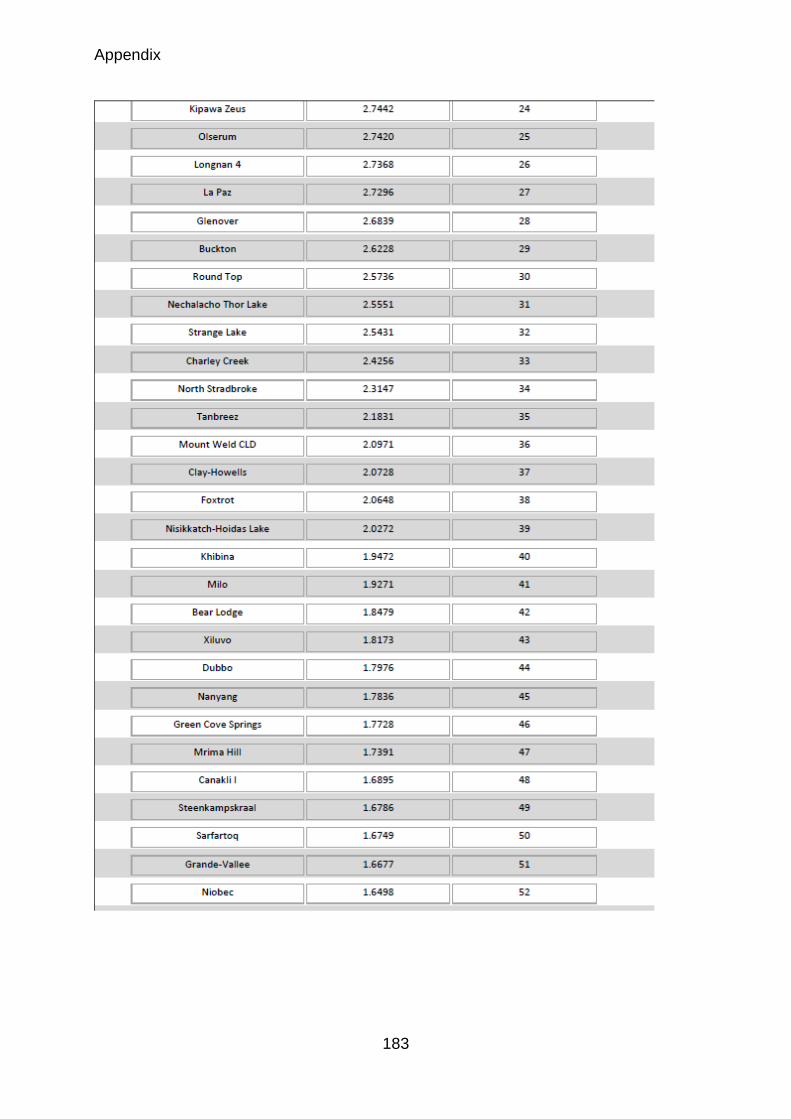
Appendix
183
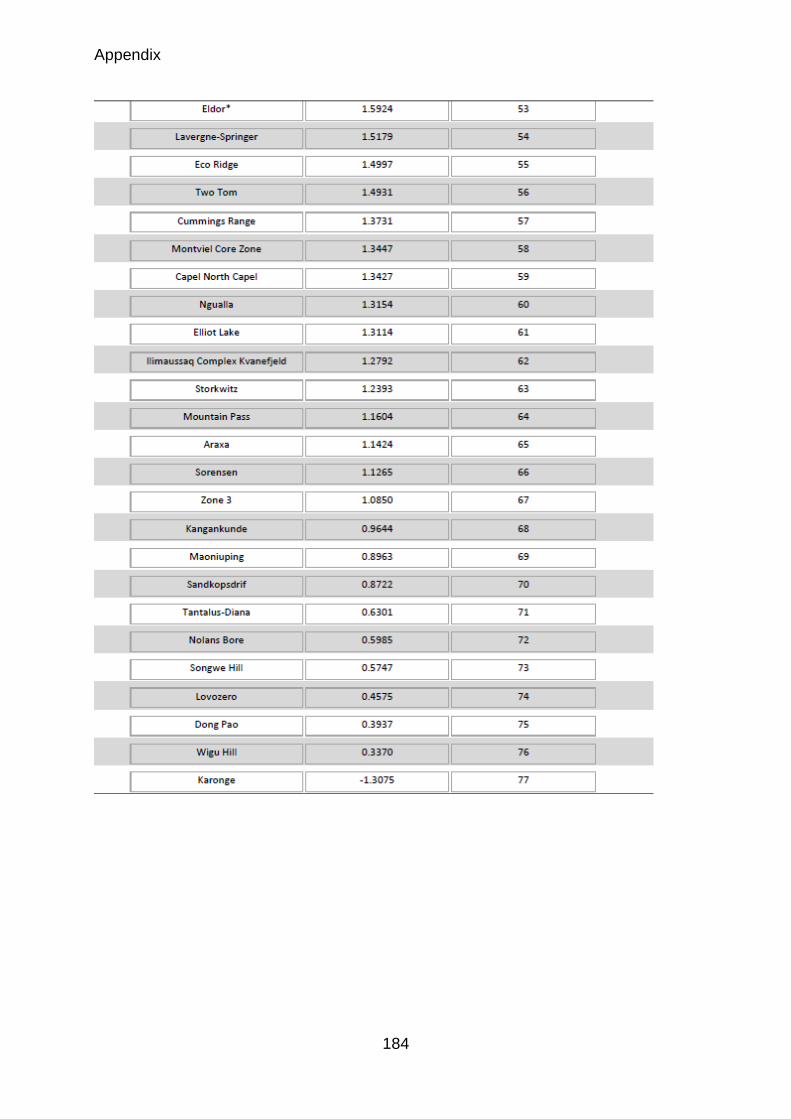
Appendix
184
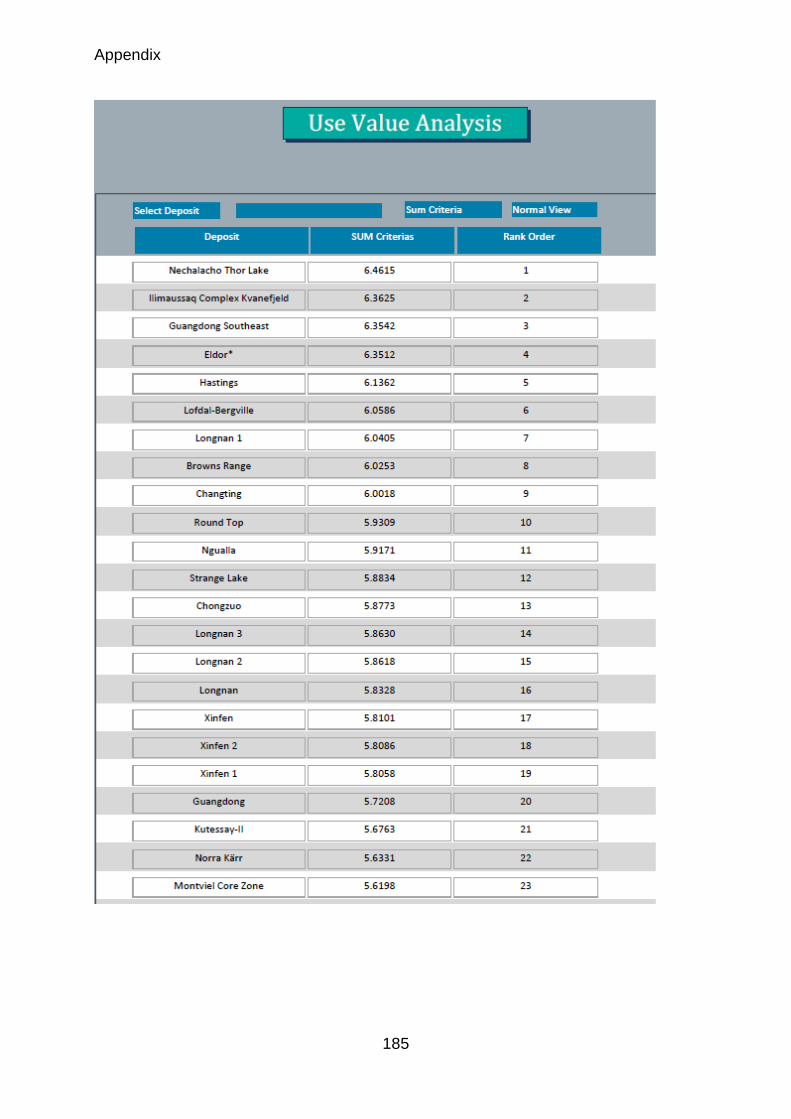
Appendix
185
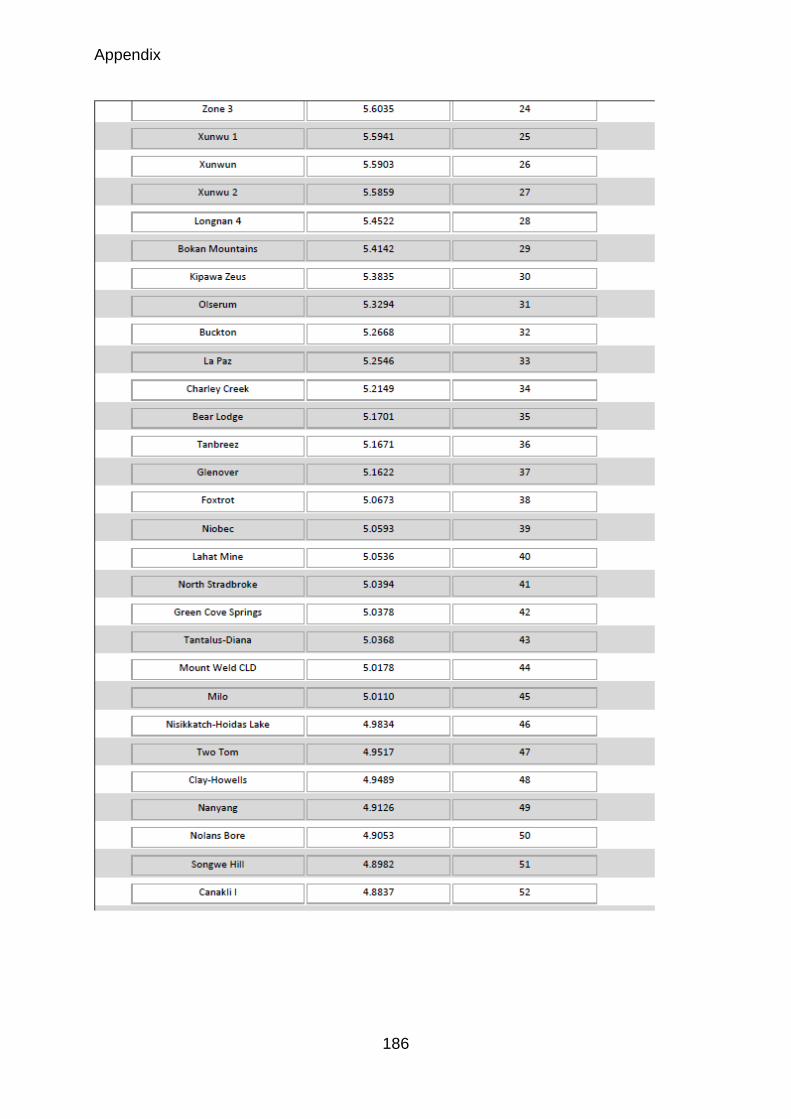
Appendix
186
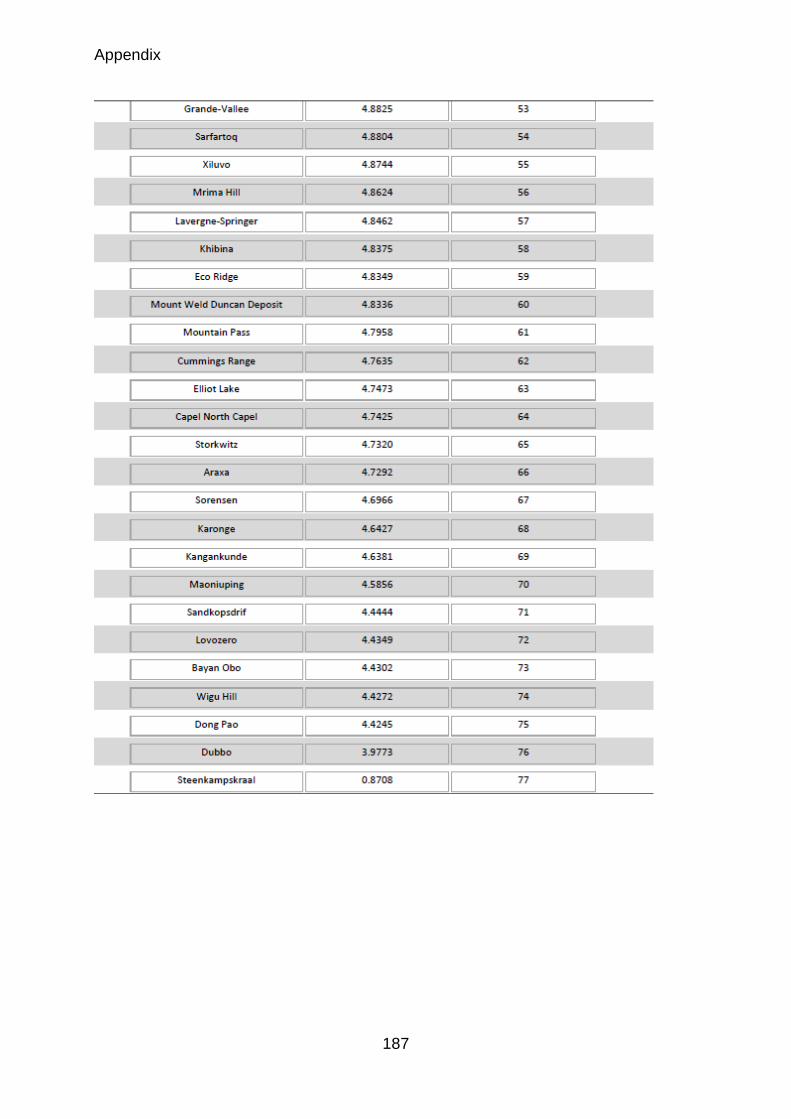
Appendix
187