dividend policy, cash flow, and investment in japan - urfu.ruigup.urfu.ru/docs/bank...
TRANSCRIPT
Dividend policy, cash flow, and investment in Japan
Hideaki Kiyoshi Kato a,*,1, Uri Loewenstein b, Wenyuh Tsay c
aGraduate School of Business Sciences, University of Tsukuba, 3-29-1, Otsuka, Bunkyo, Tokyo 112-0012, JapanbEccles School of Business, University of Utah, Salt Lake City, UT 84112, USA
cCollege of Business Administration, California State University at San Marcos, San Marcos, CA 92096, USA
Abstract
This study provides evidence in support of the cash flow information (CFI) hypothesis focusing
on the Japanese firms. Dividend changes indeed convey information about the firm’s cash flows.
Although the free cash flow hypothesis is to some degree supported by the evidence in firms’
investment behavior, dividend policy is not used by Japanese firms to control the overinvestment
problem. In addition, the dividend clientele effect does not appear significant around dividend
announcements in Japan. Given the specific institutional features of the Japanese market, we find
that investment spending is very sensitive to liquidity constraints for nonkeiretsu firms, but not so for
keiretsu firms.
D 2002 Elsevier Science B.V. All rights reserved.
JEL classification: G32; G35
Keywords: Japan; Dividend; Invesment decision; Free cash flow
1. Introduction
Dividend announcements have been the focus of extensive research in the U.S. markets.
Hypotheses based on the information asymmetry and the overinvestment of free cash flow
provide common interpretation of stock price reactions to dividend announcements.
Announcements of dividend changes are usually associated with significant excess returns
consistent in various ways with these nonmutually exclusive hypotheses. The purpose of
this study is to test these hypotheses in Japan. Moreover, this research also provides general
evidence about the relation between firms’ cash flows and dividend changes. That is, how
0927-538X/02/$ - see front matter D 2002 Elsevier Science B.V. All rights reserved.
PII: S0927 -538X(02 )00068 -9
* Corresponding author. Tel.: +81-3-3942-6881; fax: +81-3-3942-6829.
E-mail address: [email protected] (H.K. Kato).1 Formerly Kiyoshi Kato.
www.elsevier.com/locate/econbase
Pacific-Basin Finance Journal 10 (2002) 443–473
dividends are financed and whether the careful management of dividends is regarded as
important by corporate Japan. Finally, it makes a contribution to the investment literature by
studying the general investment behavior of Japanese firms.
One popular hypothesis, the cash flow information hypothesis, suggests that manage-
ment uses dividends to convey inside information about the firm’s cash flow not available
to other market participants. An announcement of a dividend increase (decrease) is a
declaration by the management of their knowledge of favorable (unfavorable) future
prospects for the firm. Larger changes in the dividend imply greater changes in the firm’s
cash flow. Therefore, the magnitude of the market reaction is positively related to the size
of the dividend change (e.g., Asquith and Mullins, 1983; Denis et al., 1994).
The alternative hypothesis, the free cash flow hypothesis, implies that dividends are
paid out to stockholders in order to prevent managers from building unnecessary empires
in their own narrow interests. Entrenched managers have the tendency to invest free cash
flow in size-increasing but nonprofitable projects. Stockholders would prefer to see an
increase in dividend that would reduce the free cash flow available to the managers. As a
result, stock prices react favorably to announcements of dividend increases and unfavor-
ably to dividend decreases by overinvestors (Lang and Litzenberger, 1989).
Most of the empirical studies that intend to distinguish between these competing
hypotheses focus on the examination of the cumulative excess returns around dividend
announcements. Clearly, either hypothesis is consistent with positive stock price reaction
to an announcement of a dividend increase and a negative reaction to a dividend cut.
Surprisingly, however, when the various studies, which are all carried out using U.S. data,
separate the firms by their growth potential, some find results consistent with the
information hypothesis (Denis et al., 1994; Yoon and Starks, 1995), while others conclude
that the results are consistent with the free cash flows hypothesis (Lang and Litzenberger,
1989).2 Moreover, in an attempt to distinguish between the hypotheses, these studies take
one step further and examine the revisions of analysts’ earning forecasts after the
announcements of dividend changes. Unfortunately, these tests do not help in finding
the elusive consensus either. Denis et al. (1994) and Yoon and Starks (1995) find
significant revisions of analysts’ earning forecasts following dividend announcements,
whereas Lang and Litzenberger (1989) obtain evidence of insignificant revisions.
There is clearly a need for a fresh look at these mixed results. Examining dividend
announcements in Japan can shed light on this debate. This approach is especially
promising because the institutional features of the Japanese market differ substantially
from those of the U.S. market.
One unique institutional feature in Japan is the industrial organization of the firms.
Most companies are affiliated with business groups or keiretsu, and engage in extensive
2 In addition to the debate between these two hypotheses, the dividend clientele hypothesis proposes that the
level of dividend yield also affects the magnitude of the market reaction to the dividend announcements. This
clientele effect results from the investors’ preference for dividend income due to their tax status. These clienteles
are concerned with the level of dividend payout. As suggested by Bajaj and Vijh (1990), if the marginal investors
in high-yield stocks have a preference for dividend, the announcements of dividend changes by higher-yield firms
should lead to greater market reaction to the announcements. As a result, the magnitude of the excess returns
around dividend announcements is positively related to the level of dividend yield.
H.K. Kato et al. / Pacific-Basin Finance Journal 10 (2002) 443–473444
reciprocal shareholding. These companies also have their senior managers on each other’s
boards of directors. In this context, the majority of the shareholders are likely to have
access to the firm’s inside information. Moreover, dividend announcements prior to the ex-
dividend day are not required in Japan and are voluntary. In a recent paper, Kato et al.
(1997) examine voluntary dividend announcements in Japan and document the character-
istics of firms that make such announcements. They find that larger firms and keiretsu
firms make dividend announcements more frequently than smaller firms and nonkeiretsu
firms. More importantly, it appears that firms with greater information asymmetry are less
likely to disclose dividend information. Therefore, the motive to make dividend announce-
ments to reveal inside information (the cash flow information hypothesis) is less clear in
Japan, where the majority of the shareholders are in reality quasi insiders.
Similarly, the desire of managers pursuing their own agendas to invest suboptimally
(the free cash flow hypothesis) should also be examined in a different light. When the
monitoring of management is vigilant due to intercorporate shareholding and close ties
with financial institutions, managers of Japanese firms may adopt a different pattern of
investment behavior. Overall, it is not obvious whether any of these hypotheses will be
supported by evidence obtained from a study conducted in Japan. Indeed, in a recent
article, Dewenter and Warther (1998) suggest that Japanese firms face less information
asymmetry and fewer agency conflicts than U.S. firms.
This research first follows a standard approach to examine the market reaction to
dividend announcements. It tests the competing hypotheses in a simple setting of multiple
regression analyses by examining the combined effects of several explanatory variables,
which are associated with these hypotheses, on the magnitude of abnormal returns around
dividend announcements.
Subsequently, this study implements two direct tests of the hypotheses. First, it
examines in a univariate analysis the cash flow and investment behavior surrounding
dividend announcements. Next, it investigates in a multivariate approach the relationship
between the dividend policy and the investment spending while controlling for other
components of cash flow from operations and financing.
The results of the regression analysis of excess returns indicate that the magnitude of
the market reaction to the announcements is positively related to the size of actual
dividend change and to Tobin’s q ratio, but negatively related to firm size. Contrary to
results in the U.S., we do not find a significant impact of dividend yields on the magnitude
of the market reaction during dividend announcements. These initial results are consistent
with the information hypothesis, but lend no support to the dividend clientele hypothesis
suggested by Bajaj and Vijh (1990) or to the free cash flow hypothesis.
The results of the univariate analysis indicate that dividend changes are related to cash
flow from operation, financing, and investment activities. Firms announcing dividend
increases experienced on average higher earnings, reduced debt ratios, and increased
investment levels. In contrast, dividend-decreasing firms underwent deterioration in
earnings, raised their leverage ratios, and reduced their investment activities. Specifically,
dividend changes not only are associated with earnings prospects in the near future but
also reflect past and current earnings. These results are consistent with Lintner’s (1956)
model on dividend policy and can be compared with the findings in Benartzi et al. (1997),
where dividend changes reflect the past rather than future earnings changes.
H.K. Kato et al. / Pacific-Basin Finance Journal 10 (2002) 443–473 445
Furthermore, the improvement in earnings is accompanied by an increase in investment
activities that suggests an increased confidence in future prospects. The results of this
analysis are also consistent with the cash flow information hypothesis, with one
qualification. Since this analysis focuses on only one dimension of cash flow, it neglects
the simultaneous changes in other cash flow components.
To account for this shortcoming, we employ a multivariate approach in which we
control the available cash flow and the investment opportunities while examining the
dividend policy and investment behavior. This approach originates from the growing body
of literature that studies the relation between investment and cash flow constraints (e.g.,
Fazzari et al., 1988; Oliner and Rudebusch, 1992; Vogt, 1994). The common investment
model in the literature is modified in this paper so that we can investigate the relationship
between dividend changes and investment spending by firms. We find that firms with
more cash flow engage in more investment. This result is consistent with the basic
prediction of the free cash flow hypothesis. However, after controlling for the available
cash flow and investment opportunities, an increase (decrease) in dividend payment is still
followed by an increase (decrease) of the investment level. This evidence is not in line
with the prediction of the free cash flow hypothesis.
As a by-product of this research, we also gain insights into Japanese firms’ investment
behavior. Given the specific institutional background of the Japanese market, this study
finds that investment is very sensitive to liquidity constraints for nonkeiretsu firms, and
less so for keiretsu firms. This result should be compared with the findings by Hoshi et al.
(1991), who studied the investment and liquidity of Japanese industrial groups.
To summarize the results of the hypotheses testing, this study provides evidence in
support of the cash flow information hypothesis. It seems that dividend changes indeed
convey information about the firm’s cash flows. Although the free cash flow hypothesis is
to some degree supported by the evidence in firms’ investment behavior, dividend policy is
not used by Japanese firms to control the overinvestment problem. In addition, the dividend
clientele effect does not appear significant around dividend announcements in Japan.
This paper is organized as follows. Data are described in Section 2. Sections 3, 4, and 5
explain and discuss the results of three separate but sequential analyses. Section 3 examines
the market reaction to dividend announcements. Cash flow behavior around dividend
announcements is presented in Section 4. Section 5 focuses on the relationship between
dividend changes and investment spending. Section 6 offers a summary and conclusion.
2. Samples and data description
The sample of this study includes 2356 newspaper announcements of dividends by the
companies listed in the first section of the Tokyo Stock Exchange (TSE).3 This sample
extends from January 1982 to April 1991. The dates and the contents of these voluntary
3 The TSE has three sections: the first, the second, and the foreign sections. Trading on the first section,
which contains about 1200 firms in January 1991, involves mainly stocks of large firms. The second section
contains stocks of small and growing companies. The first section dominates the other two in trading volume and
market capitalization.
H.K. Kato et al. / Pacific-Basin Finance Journal 10 (2002) 443–473446
dividend announcements were manually collected from the Nihon Keizai Shimbun (the
Japanese Economic Newspaper). These announcements did not state the exact amount of
the coming dividend, but rather only the sign of dividend change; i.e., increase, decrease,
or no change in dividend. It is believed this data set is quite complete for these companies
during the sample period because the Nihon Keizai Shimbun extensively covers economic
and business news in Japan.
Since the analyses of this study involve accounting data and accounting practices are
different for financial institutions, only dividend announcements made by nonfinancial
firms are included. We obtained major data from the QUICK Research Institute. These
data sets contain daily stock closing prices and daily trading volume for each security, and
the daily stock index for the Nikkei Stock Average (Nikkei). When the announcement data
file is combined with the financial data files, the size of the sample is further reduced due
to the availability of data. Consequently, the reduced sample consists of 1362 observa-
tions.
We obtained the annual financial data for nonfinancial firms in the sample from Nikkei
Economic Electronic Data System (NEEDS) files, which is similar to COMPUSTAT in the
U.S. NEEDS files provide financial information from balance sheets and income state-
ments, and other information related to a firm’s characteristics. For example, they contain
basic data on ownership structure, such as percentage of stocks owned by financial
institutions, business corporations, individuals, and foreign investors.
Since some of the analyses do not require dividend announcements, we also construct a
sample of observations from the same population of nonfinancial firms, which may or may
not make dividend announcements. This sample contains the financial information and
firm characteristics of all nonfinancial firms listed in the first section of the Tokyo Stock
Exchange during the sample period of 1982 through 1991.
3. Market reaction to dividend announcements
3.1. Rationale and description of the analysis
The standard event study methodology and the market model are employed to calculate
excess returns around the dividend announcement days. The publication date of the
announcement is used as the announcement date. Then the excess returns 1 day before and
on the announcement day are summed up as the 2-day cumulative abnormal return (CAR)
for each announcement. The estimation period is between 124 and 25 days before the
announcement day. The average 2-day cumulative abnormal returns are significantly
positive, negative, and negative, respectively, for announcements of dividend increases,
dividend decreases, and no changes in dividend.
To inspect the combined effects of various relevant variables in order to shed light on the
competing hypotheses, we run a multiple OLS regression to examine the magnitude of the
market reaction to voluntary dividend announcements. Firm size, the percentage change of
the actual dividend, the expected dividend yield, and Tobin’s q ratio are chosen as the
explanatory variables to test the competing hypotheses. These variables are commonly used
as proxies for different hypotheses in other studies. In addition, two other variables specific
H.K. Kato et al. / Pacific-Basin Finance Journal 10 (2002) 443–473 447
to the institutional features in Japan, keiretsu membership and period dummy for
observations after 1988, are included in the regression.
The explanation and the hypothesized impact of these independent variables on the
magnitude of the market reaction to dividend announcements are the following. The
percentage change of actual dividend (DIVCHG) is defined as the ratio of the actual
dividend change over the previous dividend. Since the dividend announcements did not
contain the size of the dividend payment, the actual dividends are used as proxies for
announced dividends. Therefore, assuming that market has perfect hindsight, we use the
magnitude of the actual dividend change as the proxy for the magnitude of dividend change
conveyed in the dividend announcements. According to the cash flow information (CFI)
hypothesis, a greater change in dividend reflects a greater change in the firm’s cash flow and
as a result, a greater market reaction to the announcements of dividend changes is observed.
So DIVCHG is expected to have a positive impact on the magnitude of cumulative abnormal
returns. A positive impact is, however, also consistent with the free cash flow hypothesis.
Tobin’s q ratio is defined as the sum of the market value of a firm’s equity and the book
value of its liabilities divided by the book value of the total assets.4 With some restrictive
assumptions, Tobin’s q ratio can represent a firm’s investment opportunities. The free cash
flow/overinvestment (FCF) hypothesis suggests that a dividend increase (decrease) by an
overinvesting firm would reduce (increase) its free cash flow, and therefore alleviate
(exacerbate) the overinvesting behavior. Firms with low Tobin’s q ratio are more likely to
be overinvestors, so their announcements of dividend changes should incur greater market
reaction because dividend changes by overinvesting firms should have greater impact on
their investment behavior. By this reasoning, Tobin’s q ratio would have a negative impact
on the magnitude of the market reaction to the dividend announcements if FCF is
supported.5
On the other hand, for firms facing liquidity constraints, dividend changes should have
a significant impact on investment spending, especially those with ample investment
opportunities. That is, dividend changes by firms with more favorable investment
opportunities and tighter liquidity constraints would convey more information about the
possible changes in their future investment behavior and may better reflect the future
prospects of the firms’ earnings growth. Since higher Tobin’s q ratios imply more
profitable investment opportunities, the impact of Tobin’s q ratio on the magnitude of
market reaction is likely to be positive.6
4 We have tried alternative specifications of Tobin’s q ratio and obtained similar results to those reported in
the following sections. One alternative, provided in Chung and Pruit (1994), defines the approximate q ratio as the
sum of the market value of the firm’s common shares, the market value of the firm’s preferred stock, and the value
of the firm’s short-term liabilities net of its short-term assets, divided by the book value of the total assets. They
find that such an approximation explains about 97% of the variability of more complicated measures such as the
one used in Lindenberg and Ross (1981).5 In support of the free cash flow hypothesis, Lang and Litzenberger (1989) find that the magnitude of the price
reaction to the announcements of dividend changes by firms with Tobin’s q ratio less than 1 is greater than that by
firms with Tobin’s q ratio greater than 1. By similar reasoning, we include Tobin’s q ratio in the multiple regression.6 Actually, this prediction is based on the combination of the cash flow information hypothesis and the
pecking order financing theory. In studying the relationship between cash flow and investment, Vogt (1994)
suggests that if the pecking order theory explains the relationship, firms with high q ratio will depend more
heavily on internal cash flows to finance investment spending.
H.K. Kato et al. / Pacific-Basin Finance Journal 10 (2002) 443–473448
Firm size (LOGSIZE) equals the natural log of the market value of a firm’s equity. The
average stock price in a year is used to calculate the equity value in that year. Larger firms
usually have more information readily available in the market than smaller firms. If dividend
announcements are used to reveal some information about the firm’s cash flow, firm size
should have a negative impact on the magnitude of the cumulative abnormal returns. In
contrast, if dividend policy is adopted to control the overinvestment problem and if larger
firms are more mature, have more free cash flow, and are more likely to be overinvestors,
firm size may have a positive effect on the market reaction to dividend announcements.
For completeness, the expected dividend yield (DIVYLD) is included to examine
whether the tax-related clientele effect is prevalent in Japan. The expected dividend yield
is defined as the actual dividend in the previous year divided by the average stock price in
the same year. As suggested by Bajaj and Vijh (1990), firms with high dividend yield are
expected to attract investors with high preference for dividends. These marginal investors
would cause greater market reaction to the announcements of dividend changes by firms
with higher dividend yield. Therefore, the expected dividend yield is anticipated to exert a
positive influence on the magnitude of the excess returns if dividend clienteles are
common in Japan.
KEIRE and PERIOD are two additional variables incorporated to address the issues
specific to the institutional background in Japan. KEIRE is a dummy variable for firms that
belong to one of the six major keiretsu.7 Keiretsu membership has been shown in Kato et
al. (1997) to have a positive influence on a firm’s decision to make voluntary dividend
announcements. It would be interesting to examine whether keiretsu membership has an
impact on the market reaction to the voluntary disclosure. PERIOD is a dummy for
observations that occurred after the tax reform of 1988,8 i.e., from 1989 through 1991. If
the tax-related dividend clientele effect is strong in Japan, this dummy variable for the time
period after the tax reform may explain some variation in the cumulative abnormal returns.
Based on the two frequently proposed hypotheses, Table 1 summarizes the predicted
impacts of several variables on the magnitude of the 2-day cumulative abnormal return
around the dividend announcement day. These two hypotheses are cash flow information
(CFI), and free cash flow (FCF). Column (3), dividend change, contains the aggregate
impact on observations of both dividend increase (1) and decrease (2). The multiple linear
regression model is as follows, and the hypothesized signs of the independent variables are
in the parentheses underneath each variable.
CAR ¼ f ðLOGSIZEð�Þ or ðþÞ
; DIVCHGðþÞ
; DIVYLDðþÞ
; TQð�Þ or ðþÞ
; KEIRE; PERIODÞ:
In aggregating the observations of both dividend increases and decreases, we use the
negative of the cumulative abnormal returns (CAR) and the percentage change of the
7 Keiretsu membership is not clearly defined. As in the study by Hoshi et al. (1991), we adopt the
classification scheme used in Keiretsu no Kenkyu (Research on Industrial Groups). It is better to consider such
classification as a type of group affiliation, rather than as a definition of affiliation.8 The tax reform of 1988, which taxed capital gains for individuals in Japan for the first time, makes
dividends relatively more attractive for individual investors. As for the corporate shareholders, the reform limits
intercorporate trading for dividend capture around the fiscal year end of the firm whose stock is being traded. See
Kato and Loewenstein (1995) for more details.
H.K. Kato et al. / Pacific-Basin Finance Journal 10 (2002) 443–473 449
actual dividend (DIVCHG) for the announcements of dividend decreases. The Tobin’s q
ratio for the previous year is used in the regression analysis. Since all dividend announce-
ments in this study cover the period from 1982 to 1991 and the stock market in Japan was
exuberant in this decade, the time of the announcements may affect the magnitude of the
market reaction. In addition, the rising trend of stock prices may cause inconsistency in
calculating Tobin’s q ratios for the same company in different time periods. The same
concern applies to the estimation of dividend yields. To address this issue, we have tried
incorporating year dummies in the regression analysis. However, these year dummies do
not have a significant impact on the parameter estimates and the significance level of the
proposed independent variables. Therefore, only results from the parsimonious models
without year dummies are reported.
3.2. Results of multiple regressions
The regression results are presented in Table 2. Regressions (1) through (3) are on all
observations, and regressions (4) through (6) are on announcements of dividend changes,
excluding announcements of no change in dividend. Though the adjusted R2 is low among
these models, their F-statistics are all significant at the 1% level. In general, these results
indicate that the size of actual dividend change (DIVCHG), firm size (LOGSIZE), and
Tobin’s q ratio (TQ) are the significant factors affecting the magnitude of the market
reaction to the announcements, while the dividend yield (DIVYLD) is not a significant
explanatory variable.
For regressions of both all observations and only dividend changes, the percentage
change of the actual dividend (DIVCHG) is highly significant. It is significantly positive at
the 1% level in the regressions of all observations. As predicted, the size of the dividend
change indeed has a strong positive effect on the magnitude of the excess returns.
Consistent with the results found in the U.S. market (e.g., Ghosh and Woolridge, 1988;
Table 1
Hypothesized impacts of several variables on the magnitude of the market reactions to the dividend
announcements
Variables Impacts on magnitude of market reaction to dividend announcements
Related hypotheses Dividend increase (1) Dividend decrease (2) Dividend change (3)
Dividend changes CFI (+) (+) (+)
FCF (+) (+) (+)
Firm size CFI (� ?) (� ?) (� ?)
FCF (+?) (+?) (+?)
Tobin’s q ratio FCF (� ) (� ) (� )
CFI (+?) (+?) (+?)
Based on two frequently proposed hypotheses, this table summarizes the predicted impacts of several variables on
the magnitudes of 2-day cumulative abnormal returns around dividend announcement days. These two
hypotheses are cash flow information (CFI), and free cash flow (FCF). Variables examined include firm sizes
(LOGSIZE, the natural log of the market value of a firm’s equities), the magnitude of dividend changes
(DIVCHG), and Tobin’s q ratio (TQ). Column (3), dividend change, contains the aggregate impacts on
observations of both dividend increase (1) and decrease (2).
H.K. Kato et al. / Pacific-Basin Finance Journal 10 (2002) 443–473450
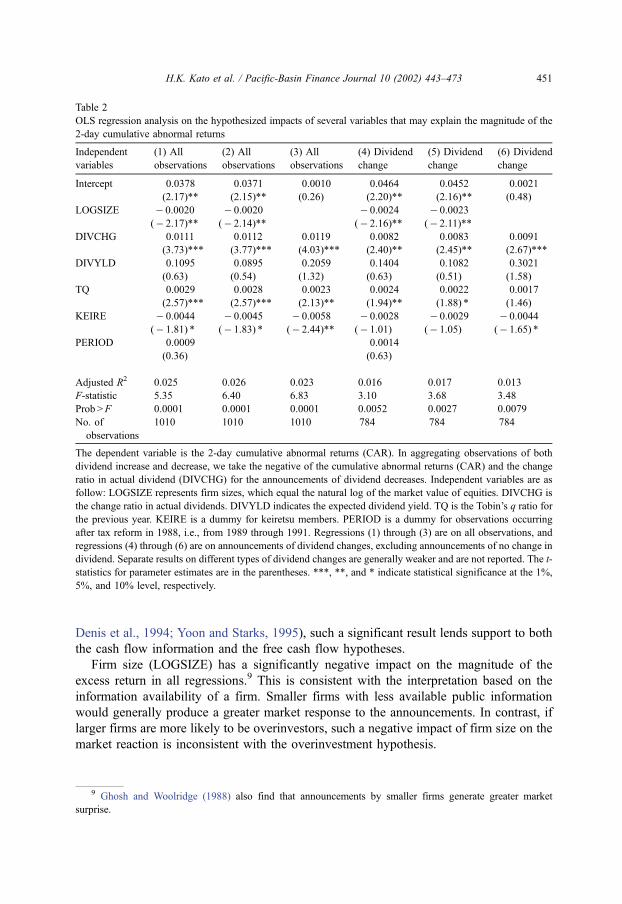
Denis et al., 1994; Yoon and Starks, 1995), such a significant result lends support to both
the cash flow information and the free cash flow hypotheses.
Firm size (LOGSIZE) has a significantly negative impact on the magnitude of the
excess return in all regressions.9 This is consistent with the interpretation based on the
information availability of a firm. Smaller firms with less available public information
would generally produce a greater market response to the announcements. In contrast, if
larger firms are more likely to be overinvestors, such a negative impact of firm size on the
market reaction is inconsistent with the overinvestment hypothesis.
Table 2
OLS regression analysis on the hypothesized impacts of several variables that may explain the magnitude of the
2-day cumulative abnormal returns
Independent
variables
(1) All
observations
(2) All
observations
(3) All
observations
(4) Dividend
change
(5) Dividend
change
(6) Dividend
change
Intercept 0.0378
(2.17)**
0.0371
(2.15)**
0.0010
(0.26)
0.0464
(2.20)**
0.0452
(2.16)**
0.0021
(0.48)
LOGSIZE � 0.0020
(� 2.17)**
� 0.0020
(� 2.14)**
� 0.0024
(� 2.16)**
� 0.0023
(� 2.11)**
DIVCHG 0.0111
(3.73)***
0.0112
(3.77)***
0.0119
(4.03)***
0.0082
(2.40)**
0.0083
(2.45)**
0.0091
(2.67)***
DIVYLD 0.1095
(0.63)
0.0895
(0.54)
0.2059
(1.32)
0.1404
(0.63)
0.1082
(0.51)
0.3021
(1.58)
TQ 0.0029
(2.57)***
0.0028
(2.57)***
0.0023
(2.13)**
0.0024
(1.94)**
0.0022
(1.88) *
0.0017
(1.46)
KEIRE � 0.0044
(� 1.81) *
� 0.0045
(� 1.83) *
� 0.0058
(� 2.44)**
� 0.0028
(� 1.01)
� 0.0029
(� 1.05)
� 0.0044
(� 1.65) *
PERIOD 0.0009
(0.36)
0.0014
(0.63)
Adjusted R2 0.025 0.026 0.023 0.016 0.017 0.013
F-statistic 5.35 6.40 6.83 3.10 3.68 3.48
Prob >F 0.0001 0.0001 0.0001 0.0052 0.0027 0.0079
No. of
observations
1010 1010 1010 784 784 784
The dependent variable is the 2-day cumulative abnormal returns (CAR). In aggregating observations of both
dividend increase and decrease, we take the negative of the cumulative abnormal returns (CAR) and the change
ratio in actual dividend (DIVCHG) for the announcements of dividend decreases. Independent variables are as
follow: LOGSIZE represents firm sizes, which equal the natural log of the market value of equities. DIVCHG is
the change ratio in actual dividends. DIVYLD indicates the expected dividend yield. TQ is the Tobin’s q ratio for
the previous year. KEIRE is a dummy for keiretsu members. PERIOD is a dummy for observations occurring
after tax reform in 1988, i.e., from 1989 through 1991. Regressions (1) through (3) are on all observations, and
regressions (4) through (6) are on announcements of dividend changes, excluding announcements of no change in
dividend. Separate results on different types of dividend changes are generally weaker and are not reported. The t-
statistics for parameter estimates are in the parentheses. ***, **, and * indicate statistical significance at the 1%,
5%, and 10% level, respectively.
9 Ghosh and Woolridge (1988) also find that announcements by smaller firms generate greater market
surprise.
H.K. Kato et al. / Pacific-Basin Finance Journal 10 (2002) 443–473 451
In combination with the results in Kato et al. (1997), this study finds that larger firms
are more likely to make announcements, but the market reaction to the announcements
made by larger firms is usually smaller. The evidence of external market reaction and
internal disclosure decision is actually not contradictory. Whether or not to make a
dividend announcement is an internal corporate decision, subject to managerial discretion.
How the market responds to the announcement is a phenomenon external to the firm and
determined by market forces. The evidence from the regression analysis implies that a
higher degree of information asymmetry results in a stronger market reaction to the
information release. At the same time, reducing information asymmetry does not appear to
be the motivation for voluntary dividend announcements.
Tobin’s q ratio is significant in most regressions. It is highly significant at the 1% level
in the regressions of all observations. Contrary to the prediction of the free cash flow/
overinvestment hypothesis, Tobin’s q ratio has a significantly positive, rather than
negative, impact on excess returns. Dividend announcements by firms of higher Tobin’s
q ratio generate greater, not less, market reaction.10
Expected dividend yield (DIVYLD) is positive but insignificant, which is somewhat
different from the results found in the U.S. (e.g., Bajaj and Vijh, 1990; Denis et al.,
1994).11 The dummy variable for the observations that occurred after the tax reform of
1988 (PERIOD) is not significant either. It indicates that there is no significant difference
in the magnitude of the abnormal returns before and after the tax reform of 1988 in Japan.
Together with the insignificance of the dividend yield variable in the regression analysis, it
seems that the tax-related dividend clientele effect around the dividend announcement day
is not significant in Japan.
The dummy variable for a keiretsu member (KEIRE) is negative and marginally
significant in the regressions of all observations. Keiretsu membership seems to reduce the
market reaction to dividend announcements. This is consistent with the results in Kato et
al. (1997), where keiretsu firms are found to be more likely to make dividend announce-
ments. When announcements made by keiretsu firms are more routine, the magnitude of
the market reaction is smaller.
In summary, the results from the regression analysis provide preliminary evidence in
support of the cash flow information hypothesis, but no significant evidence for the tax-
related dividend clientele effect. Although the significantly positive impact of dividend
changes on CAR is consistent with both CFI and FCF hypotheses, the coefficient estimate of
Tobin’s q ratio is significantly positive, which is opposite to the prediction based on the free
10 This result is consistent with Denis et al. (1994). In the multiple regression, they find that the dummy for
Tobin’s q ratio greater than 1 has a positive impact on the magnitude of the market reaction to the announcements
of dividend increase.11 The study by Kato and Loewenstein (1995), which examines the abnormal returns around ex-dividend
days, finds that the abnormal returns are positively related to dividend yields. Motivated by tax considerations
around the fiscal year end, corporate shareholders are believed to be the major traders around ex-dividend days.
Since corporate shareholders are generally better informed than individual investors, dividend announcements
should have little effect on their evaluation of the firm. In addition, the need to rebalance their portfolio due to
dividend changes is also less immediate for these corporate shareholders because dividend yield is usually low
and the cross-shareholding practice is for long-term purposes.
H.K. Kato et al. / Pacific-Basin Finance Journal 10 (2002) 443–473452
cash flow/overinvestment hypothesis. Although these results provide significant evidence
on the aggregate level, the results from separate regressions on announcements of dividend
increase and decrease are weak in either case. There is room to further examine the causes for
the changes in dividend payments by Japanese firms. In particular, we would like to better
distinguish between the cash flow information and the free cash flow hypotheses in
explaining changes in dividend policy. To do that, we will directly examine the cash flow
behavior around dividend announcements. In contrast to the previous indirect approach, this
is a direct examination of the information content of dividend policy changes.
4. Cash flow behavior around dividend announcements: The univariate approach
4.1. Rationale and description of the analysis
The cash flow position of a firm is determined by the cash inflow and outflow of its
operations, investment, and financing. By the accounting identity, a change of cash flow
from financing (such as dividend payment or issuance of debt) must be met with
corresponding changes of cash flows from operations and investment (such as earnings
and capital expenditure). An examination of cash flow behavior around voluntary dividend
announcements in Japan can provide evidence of the causes and consequences of dividend
changes.
According to the information hypothesis, the announcement of dividend changes reveals
information about a firm’s cash flows. Therefore, it is expected that a dividend increase
(decrease) will accompany an increase (decrease) in cash flow from operations. Whether
both changes occur contemporarily or with some time lag is an empirical issue. Avariant of
the information hypothesis, the ‘‘signalling’’ hypothesis, suggests that dividend changes are
used by the firm to signal the future earnings prospects of the firms. Benartzi et al. (1997),
however, find in the U.S. that dividend changes are associated with earnings performance in
the current and past recent years, rather than the future. Our study addresses this issue in
Japan.
The alternative hypothesis, the free cash flow hypothesis, considers dividend policy as
a device to control the overinvestment problem of firms without attractive investment
opportunities. For overinvestors, dividend increases can reduce the overinvestment by
decreasing free cash flow. Within our framework, the examination of the time-series of
cash flow components, such as earnings and investments, around dividend announcements
can provide some direct evidence of the validity of the two competing hypotheses in
explaining dividend policy in Japan.
We focus the analyses on three cash flow variables related to cash flow from operation,
financing, and investment. These variables are operating income, leverage ratio, and
changes in tangible fixed assets, respectively. The time series data of these variables from
5 years before through 3 years after the voluntary dividend announcements are analyzed.
For the purpose of calculating investment spending and debt level, announcements made
by financial institutions are excluded from the sample due to the difference in accounting
practice and data availability. The resulting sample of 1362 observations is classified into
three groups by the announced type of dividend changes: no change (298 observations),
H.K. Kato et al. / Pacific-Basin Finance Journal 10 (2002) 443–473 453
dividend increase (913), and dividend decrease (151).12 Medians among groups, especially
between dividend decreases and dividend increases, are compared.13
4.2. Operating income as a proxy of cash flow from operations
Operating income, rather than net income, is chosen to represent a firm’s cash flow
position.14 Because net income includes extraordinary income components unrelated to
usual operations (such as profit from trading securities), it is severely subject to managerial
manipulation in Japan.15 The annual operating income is then standardized by annual sales
for cross-sectional comparison.16
The results in Table 3 indicate that dividend changes are usually associated with
earnings changes both before and after the dividend policy change.17 In both Panels A and
B, earnings of the dividend-increase group follows a completely different pattern from the
earnings of the dividend-decrease group, while earnings for the group of no dividend
change is relatively stable. The profitability of dividend-increasing firms has been
increasing through the years as shown in Panel A. In contrast, the dividend-decreasing
firms see their earnings deteriorating until 1 year after they decrease dividends.
Starting 1 year before the dividend change announcements, a significant difference in
earnings exists between the dividend-increase and dividend-decrease groups. The earnings
of the dividend-increase group rise substantially from 1 year before through 1 year after
the dividend announcement, while earnings of the dividend-decrease group fall drastically.
The difference in medians between these two groups is highly significant from 1 year
before through several years after the dividend announcement.
Moreover, the examination of changes in operating income around the announcements
of dividend changes provides additional evidence about the relationship between dividend
changes and changes in earnings condition. The change in operating income in two
consecutive years is standardized by the total assets for cross-sectional comparison. The
results in Panel B confirm the findings in Panel A. The operating income of the dividend-
increasing firms keeps growing at a highly significant level until 2 years after the dividend
12 We use the announcement year (year 0) as the base to aggregate all announcements, which may be made in
different calendar years. Such an aggregate tends to move the average of each group closer to the average of the
whole sample, and attenuate the difference in the medians between dividend increase and dividend decrease
groups. However, this biases the results against finding significant differences between different groups.13 Tompkins (1996) matches firms that cut dividends with firms that do not in the U.S. This study compares
firms announcing dividend increase with firms announcing dividend decrease.14 Denis et al. (1994) and Yoon and Starks (1995) examine the revisions of analysts’ earnings forecasts after
the announcements of dividend changes. Both of them find significant revisions with respect to announced
dividend changes. We do not have the equivalent data of analysts’ earnings forecasts in Japan to follow their
approach. Therefore, we directly examine changes in actual cash flow around dividend announcements.15 For example, Bremer and Kato (1996) find evidence of a deliberate sale of stocks with gains by
institutional investors to manipulate accounting profits. However, similar results are obtained when net income is
used as the measure for cash flows from operations.16 Standardizing the annual operating income by total assets generates similar results.17 These results are consistent with the evidence in Healy and Palepu (1988). They are also partially in line
with a recent study by Benartzi et al. (1997), where they find that dividend changes are associated with past and
current rather than future earnings numbers.
H.K. Kato et al. / Pacific-Basin Finance Journal 10 (2002) 443–473454
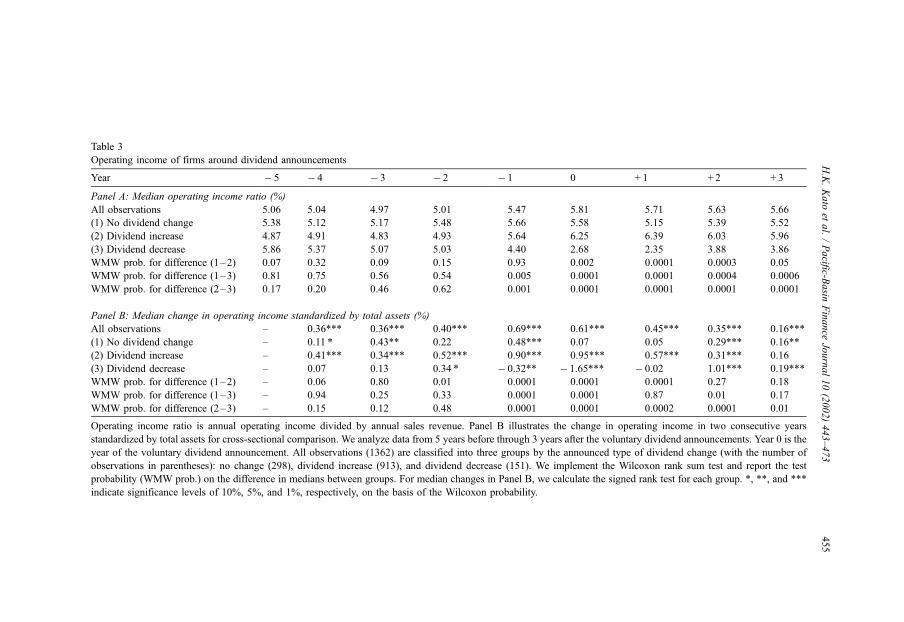
Table 3
Operating income of firms around dividend announcements
Year � 5 � 4 � 3 � 2 � 1 0 + 1 + 2 + 3
Panel A: Median operating income ratio (%)
All observations 5.06 5.04 4.97 5.01 5.47 5.81 5.71 5.63 5.66
(1) No dividend change 5.38 5.12 5.17 5.48 5.66 5.58 5.15 5.39 5.52
(2) Dividend increase 4.87 4.91 4.83 4.93 5.64 6.25 6.39 6.03 5.96
(3) Dividend decrease 5.86 5.37 5.07 5.03 4.40 2.68 2.35 3.88 3.86
WMW prob. for difference (1–2) 0.07 0.32 0.09 0.15 0.93 0.002 0.0001 0.0003 0.05
WMW prob. for difference (1–3) 0.81 0.75 0.56 0.54 0.005 0.0001 0.0001 0.0004 0.0006
WMW prob. for difference (2–3) 0.17 0.20 0.46 0.62 0.001 0.0001 0.0001 0.0001 0.0001
Panel B: Median change in operating income standardized by total assets (%)
All observations – 0.36*** 0.36*** 0.40*** 0.69*** 0.61*** 0.45*** 0.35*** 0.16***
(1) No dividend change – 0.11 * 0.43** 0.22 0.48*** 0.07 0.05 0.29*** 0.16**
(2) Dividend increase – 0.41*** 0.34*** 0.52*** 0.90*** 0.95*** 0.57*** 0.31*** 0.16
(3) Dividend decrease – 0.07 0.13 0.34 * � 0.32** � 1.65*** � 0.02 1.01*** 0.19***
WMW prob. for difference (1–2) – 0.06 0.80 0.01 0.0001 0.0001 0.0001 0.27 0.18
WMW prob. for difference (1–3) – 0.94 0.25 0.33 0.0001 0.0001 0.87 0.01 0.17
WMW prob. for difference (2–3) – 0.15 0.12 0.48 0.0001 0.0001 0.0002 0.0001 0.01
Operating income ratio is annual operating income divided by annual sales revenue. Panel B illustrates the change in operating income in two consecutive years
standardized by total assets for cross-sectional comparison. We analyze data from 5 years before through 3 years after the voluntary dividend announcements. Year 0 is the
year of the voluntary dividend announcement. All observations (1362) are classified into three groups by the announced type of dividend change (with the number of
observations in parentheses): no change (298), dividend increase (913), and dividend decrease (151). We implement the Wilcoxon rank sum test and report the test
probability (WMW prob.) on the difference in medians between groups. For median changes in Panel B, we calculate the signed rank test for each group. *, **, and ***
indicate significance levels of 10%, 5%, and 1%, respectively, on the basis of the Wilcoxon probability.
H.K.Kato
etal./Pacific-B
asin
Finance
Journal10(2002)443–473
455
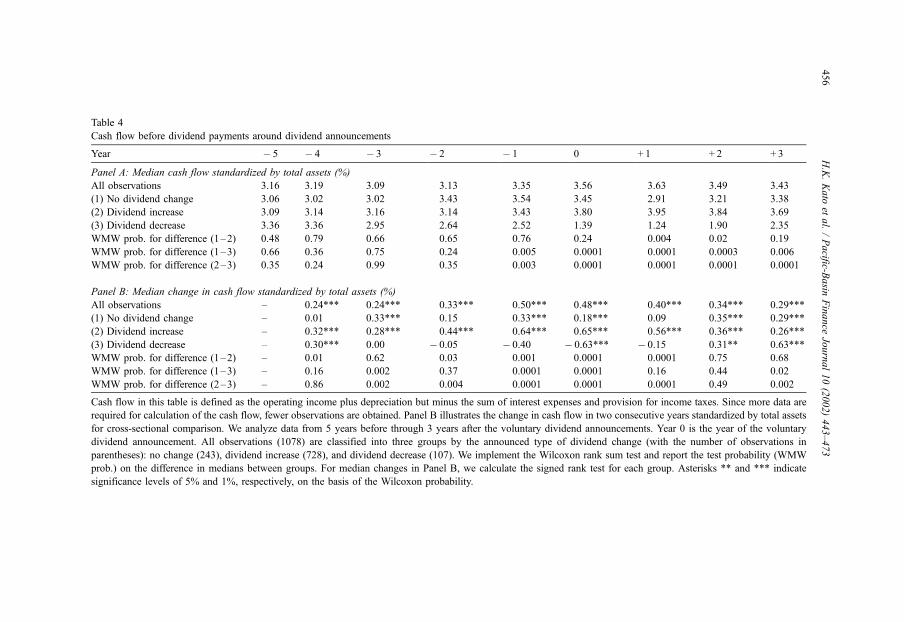
Table 4
Cash flow before dividend payments around dividend announcements
Year � 5 � 4 � 3 � 2 � 1 0 + 1 + 2 + 3
Panel A: Median cash flow standardized by total assets (%)
All observations 3.16 3.19 3.09 3.13 3.35 3.56 3.63 3.49 3.43
(1) No dividend change 3.06 3.02 3.02 3.43 3.54 3.45 2.91 3.21 3.38
(2) Dividend increase 3.09 3.14 3.16 3.14 3.43 3.80 3.95 3.84 3.69
(3) Dividend decrease 3.36 3.36 2.95 2.64 2.52 1.39 1.24 1.90 2.35
WMW prob. for difference (1–2) 0.48 0.79 0.66 0.65 0.76 0.24 0.004 0.02 0.19
WMW prob. for difference (1–3) 0.66 0.36 0.75 0.24 0.005 0.0001 0.0001 0.0003 0.006
WMW prob. for difference (2–3) 0.35 0.24 0.99 0.35 0.003 0.0001 0.0001 0.0001 0.0001
Panel B: Median change in cash flow standardized by total assets (%)
All observations – 0.24*** 0.24*** 0.33*** 0.50*** 0.48*** 0.40*** 0.34*** 0.29***
(1) No dividend change – 0.01 0.33*** 0.15 0.33*** 0.18*** 0.09 0.35*** 0.29***
(2) Dividend increase – 0.32*** 0.28*** 0.44*** 0.64*** 0.65*** 0.56*** 0.36*** 0.26***
(3) Dividend decrease – 0.30*** 0.00 � 0.05 � 0.40 � 0.63*** � 0.15 0.31** 0.63***
WMW prob. for difference (1–2) – 0.01 0.62 0.03 0.001 0.0001 0.0001 0.75 0.68
WMW prob. for difference (1–3) – 0.16 0.002 0.37 0.0001 0.0001 0.16 0.44 0.02
WMW prob. for difference (2–3) – 0.86 0.002 0.004 0.0001 0.0001 0.0001 0.49 0.002
Cash flow in this table is defined as the operating income plus depreciation but minus the sum of interest expenses and provision for income taxes. Since more data are
required for calculation of the cash flow, fewer observations are obtained. Panel B illustrates the change in cash flow in two consecutive years standardized by total assets
for cross-sectional comparison. We analyze data from 5 years before through 3 years after the voluntary dividend announcements. Year 0 is the year of the voluntary
dividend announcement. All observations (1078) are classified into three groups by the announced type of dividend change (with the number of observations in
parentheses): no change (243), dividend increase (728), and dividend decrease (107). We implement the Wilcoxon rank sum test and report the test probability (WMW
prob.) on the difference in medians between groups. For median changes in Panel B, we calculate the signed rank test for each group. Asterisks ** and *** indicate
significance levels of 5% and 1%, respectively, on the basis of the Wilcoxon probability.
H.K.Kato
etal./Pacific-B
asin
Finance
Journal10(2002)443–473
456
announcement. The growth rate is especially high in the years around the announcement of
a dividend increase. Even more dramatic results are observed for the dividend-decreasing
firms. Their operating income significantly dwindled by about 1.65% of total assets in the
year when they announced the dividend decrease. However, the earnings of these firms
bounce back 2 years after the dividend decrease. Apparently, these firms take measures to
improve their operating income including the decrease in dividends.
Since the operating income of a firm is not necessarily equivalent to a firm’s cash flow
available for dividend payment and investment, we define the approximate cash flow of a
firm as the operating income plus depreciation, less the sum of interest expenses and
provision for income taxes. This measure will be used in the analysis of investment
behavior in the next section. We follow the same procedure as above and find that the cash
flow available for dividend payment and investment exhibits a similar pattern to that of
operating income. For completeness, results are presented in Table 4.
In general, the announcements of dividend changes do reveal information about the
announcing firms’ cash flow from operations. These results are consistent with the cash
flow information hypothesis. Two points are noteworthy. First, this study finds that
dividend changes reflect not only future earnings expectation but also past earnings
performance. Second, corporate shareholders, who hold the majority of the equity shares
in Japan, appear to be better informed than individual shareholders. The management of
these firms would have less motivation and be under less pressure to ‘‘signal’’ what they
know. As shown in Kato et al. (1997), reducing information asymmetry among share-
holders does not appear to be the major motivation for voluntary disclosure.
4.3. Relationship between dividend changes and earnings changes
To further explore whether dividend changes signal future earnings growth or reflect
past earnings performance, we adopt an approach similar to the one used in Benartzi et al.
(1997) to examine whether current dividend changes signal future earnings growth.
Extending this analysis, we also inspect how past performance in earnings affects current
dividend changes.
Since the interest is on dividend changes, announcements of no dividend change are
excluded from the sample. Dependent variables of the regression analyses are the change
in earnings in year 0, 1, or 2 relative to the year of the dividend announcement,
respectively. Dividend change in the announcement year divided by previous dividend
is used as the primary explanatory variable. As in typical studies of earnings forecast, we
selectively add six accounting ratios in the year prior to dividend announcement as control
variables. These six accounting variables are operating income, working capital, debt,
changes in working capital, change in revenue, and change in total assets. All six are
standardized by total assets.
In Panel A of Table 5, a very strong positive relation is found between concurrent
dividend changes and earnings changes in regression (1). As shown in regressions (2) and
(3), the current dividend changes also have some explanatory power on the earnings
changes in the following 2 years after the dividend announcement, though the magnitude
of coefficient estimate of dividend changes is much smaller than that in regression (1).
However, the coefficient estimates of dividend changes have negative signs in these two
H.K. Kato et al. / Pacific-Basin Finance Journal 10 (2002) 443–473 457
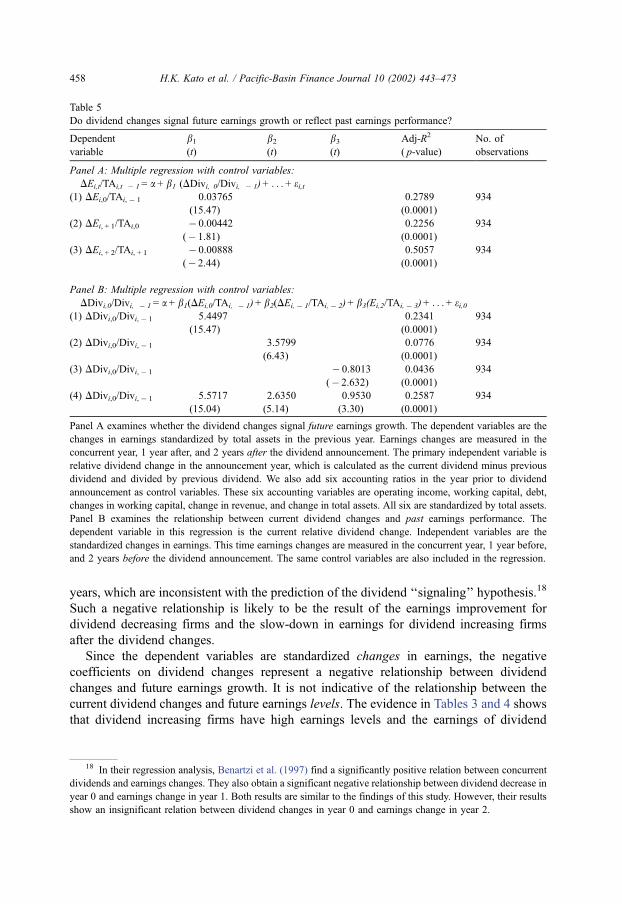
years, which are inconsistent with the prediction of the dividend ‘‘signaling’’ hypothesis.18
Such a negative relationship is likely to be the result of the earnings improvement for
dividend decreasing firms and the slow-down in earnings for dividend increasing firms
after the dividend changes.
Since the dependent variables are standardized changes in earnings, the negative
coefficients on dividend changes represent a negative relationship between dividend
changes and future earnings growth. It is not indicative of the relationship between the
current dividend changes and future earnings levels. The evidence in Tables 3 and 4 shows
that dividend increasing firms have high earnings levels and the earnings of dividend
18 In their regression analysis, Benartzi et al. (1997) find a significantly positive relation between concurrent
dividends and earnings changes. They also obtain a significant negative relationship between dividend decrease in
year 0 and earnings change in year 1. Both results are similar to the findings of this study. However, their results
show an insignificant relation between dividend changes in year 0 and earnings change in year 2.
Table 5
Do dividend changes signal future earnings growth or reflect past earnings performance?
Dependent
variable
b1
(t)
b2
(t)
b3
(t)
Adj-R2
( p-value)
No. of
observations
Panel A: Multiple regression with control variables:
DEi,t/TAi,t � 1 = a+ b1 (DDivi, 0/Divi, � 1) + . . .+ ei,t(1) DEi,0/TAi, � 1 0.03765
(15.47)
0.2789
(0.0001)
934
(2) DEi, + 1/TAi,0 � 0.00442
(� 1.81)
0.2256
(0.0001)
934
(3) DEi, + 2/TAi, + 1 � 0.00888
(� 2.44)
0.5057
(0.0001)
934
Panel B: Multiple regression with control variables:
DDivi,0/Divi, � 1 = a+ b1(DEi,0/TAi, � 1) + b2(DEi,� 1/TAi,� 2) + b3(Ei,2/TAi,� 3) + . . .+ ei,0(1) DDivi,0/Divi,� 1 5.4497
(15.47)
0.2341
(0.0001)
934
(2) DDivi,0/Divi,� 1 3.5799
(6.43)
0.0776
(0.0001)
934
(3) DDivi,0/Divi,� 1 � 0.8013
(� 2.632)
0.0436
(0.0001)
934
(4) DDivi,0/Divi,� 1 5.5717
(15.04)
2.6350
(5.14)
0.9530
(3.30)
0.2587
(0.0001)
934
Panel A examines whether the dividend changes signal future earnings growth. The dependent variables are the
changes in earnings standardized by total assets in the previous year. Earnings changes are measured in the
concurrent year, 1 year after, and 2 years after the dividend announcement. The primary independent variable is
relative dividend change in the announcement year, which is calculated as the current dividend minus previous
dividend and divided by previous dividend. We also add six accounting ratios in the year prior to dividend
announcement as control variables. These six accounting variables are operating income, working capital, debt,
changes in working capital, change in revenue, and change in total assets. All six are standardized by total assets.
Panel B examines the relationship between current dividend changes and past earnings performance. The
dependent variable in this regression is the current relative dividend change. Independent variables are the
standardized changes in earnings. This time earnings changes are measured in the concurrent year, 1 year before,
and 2 years before the dividend announcement. The same control variables are also included in the regression.
H.K. Kato et al. / Pacific-Basin Finance Journal 10 (2002) 443–473458
decreasing firms are relatively low from 1 year before through several years after the
announcements of dividend changes. Put together, these results suggest that dividend
changes are associated with earnings levels around the dividend announcements, but
dividend increases (decreases) are not a good indicator of continued growth (decline) in
future earnings.
To explore the other side of the story, we examine the relationship between current
dividend changes and past earnings performance. With the current relative dividend
change as the dependent variable in this regression, we use the standardized changes in
earnings as the explanatory variables. Standardized earnings changes are measured in the
concurrent year, 1 year before, and 2 years before the dividend announcement. The same
control variables in the first regression are also included in the analysis.
Panel B of Table 5 shows interesting results consistent with the evidence in the cash
flow analysis. As shown in regressions (1) and (2), not only current changes in earnings
but also earnings changes 1 year before the dividend changes have a very significant
positive impact on the current dividend changes. It seems that, as the firms build up their
coffers, they are likely to increase dividend payments. Although the variable of earnings
changes 2 years before the dividend announcement has a negative impact in regression (3),
it becomes positive when the other two variables of earnings changes are present in model
(4). Overall, these results confirm the findings in the examination of cash flow behavior
around the dividend announcement. It appears that dividend changes signal less of the
continued earnings changes in the future, but reflect more of the concurrent earnings
changes and the past earnings performance.
4.4. Change in the leverage ratio and financing decisions
To gain additional insights, we examine other components of cash flow as well.
Change in total liabilities, rather than long-term debt, is used to represent the cash flow
related to financing. The choice of this variable is justified by corporate financing
practices in Japan. Because of cross-shareholding and close relationships with suppliers
and customers, not only long-term debt but also short-term liabilities can be considered
financing alternatives. In the analysis, total liabilities are standardized by total assets to
avoid size-related biases.
The results in Table 6 display significantly different patterns in the change of leverage
ratios between the dividend-increase and dividend-decrease groups around dividend
announcement. Panel A shows a general trend of declining debt ratio for all observations
from 5 years before through 3 years after the dividend announcement, which matches the
general trend of reducing leverage ratios among Japanese corporations during the sample
period. For the whole period, the dividend-increase group significantly decreases its debt
ratios from 79.8% to 66.5%, whereas the dividend-decrease group reduces the leverage
ratio only from 80.7% to 75.4%. The debt ratios of dividend-increasing firms and
dividend-decreasing firms appear similar at first; then from year � 1 on, the difference
starts to grow significantly. In year � 1, dividend-increasing firms’ debt ratios fell
significantly, while dividend-decreasing firms’ leverage ratios increase, though not
significantly, for three consecutive years. As shown in Panel B, the difference in median
percentage changes between these two groups is significant for these three years.
H.K. Kato et al. / Pacific-Basin Finance Journal 10 (2002) 443–473 459
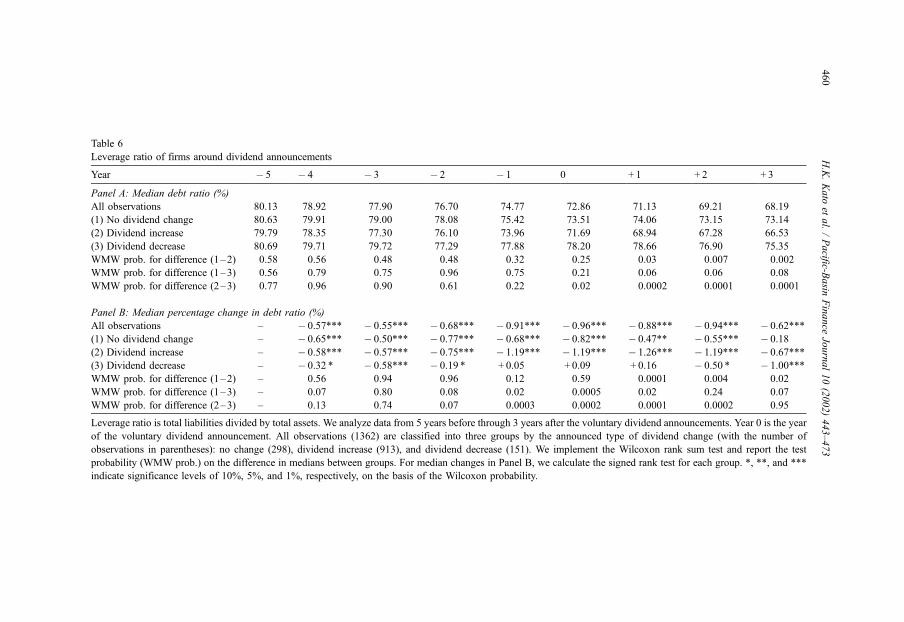
Table 6
Leverage ratio of firms around dividend announcements
Year � 5 � 4 � 3 � 2 � 1 0 + 1 + 2 + 3
Panel A: Median debt ratio (%)
All observations 80.13 78.92 77.90 76.70 74.77 72.86 71.13 69.21 68.19
(1) No dividend change 80.63 79.91 79.00 78.08 75.42 73.51 74.06 73.15 73.14
(2) Dividend increase 79.79 78.35 77.30 76.10 73.96 71.69 68.94 67.28 66.53
(3) Dividend decrease 80.69 79.71 79.72 77.29 77.88 78.20 78.66 76.90 75.35
WMW prob. for difference (1–2) 0.58 0.56 0.48 0.48 0.32 0.25 0.03 0.007 0.002
WMW prob. for difference (1–3) 0.56 0.79 0.75 0.96 0.75 0.21 0.06 0.06 0.08
WMW prob. for difference (2–3) 0.77 0.96 0.90 0.61 0.22 0.02 0.0002 0.0001 0.0001
Panel B: Median percentage change in debt ratio (%)
All observations – � 0.57*** � 0.55*** � 0.68*** � 0.91*** � 0.96*** � 0.88*** � 0.94*** � 0.62***
(1) No dividend change – � 0.65*** � 0.50*** � 0.77*** � 0.68*** � 0.82*** � 0.47** � 0.55*** � 0.18
(2) Dividend increase – � 0.58*** � 0.57*** � 0.75*** � 1.19*** � 1.19*** � 1.26*** � 1.19*** � 0.67***
(3) Dividend decrease – � 0.32 * � 0.58*** � 0.19 * + 0.05 + 0.09 + 0.16 � 0.50 * � 1.00***
WMW prob. for difference (1–2) – 0.56 0.94 0.96 0.12 0.59 0.0001 0.004 0.02
WMW prob. for difference (1–3) – 0.07 0.80 0.08 0.02 0.0005 0.02 0.24 0.07
WMW prob. for difference (2–3) – 0.13 0.74 0.07 0.0003 0.0002 0.0001 0.0002 0.95
Leverage ratio is total liabilities divided by total assets. We analyze data from 5 years before through 3 years after the voluntary dividend announcements. Year 0 is the year
of the voluntary dividend announcement. All observations (1362) are classified into three groups by the announced type of dividend change (with the number of
observations in parentheses): no change (298), dividend increase (913), and dividend decrease (151). We implement the Wilcoxon rank sum test and report the test
probability (WMW prob.) on the difference in medians between groups. For median changes in Panel B, we calculate the signed rank test for each group. *, **, and ***
indicate significance levels of 10%, 5%, and 1%, respectively, on the basis of the Wilcoxon probability.
H.K.Kato
etal./Pacific-B
asin
Finance
Journal10(2002)443–473
460
Combined with the results in Tables 3 and 4, the change in debt ratio is found to be
closely linked to earnings performance. When firms in the dividend-increase group have
significantly higher earnings performance from year � 1 on, they may depend more on the
internal financing for their operating and investing activities. Although the amount of their
liability increases due to increases in business activity, the size of total assets expands even
more. As a result, a decrease in the leverage ratio for dividend-increasing firms is
observed. In contrast, firms in the dividend-decrease group with declining earnings may
have to depend on external financing to supplement their needs for cash flow.
4.5. Investment as estimated by change in tangible fixed assets
The change in tangible fixed assets is used as a proxy for the annual investment
spending. This measure is then standardized by total assets for aggregate analysis and
cross-sectional comparisons. The investment activity of dividend announcing firms is
illustrated in Table 7. In general, the growth rates of the firms’ tangible fixed assets in
Panel A have been positive and increasing over time, indicating an expanding base of
tangible fixed assets. Dividend-increase and dividend-decrease groups do not exhibit a
significant difference in annual investment activities before the announcements of the
dividend change. The growth rate in tangible fixed assets of both groups is similar until
they make dividend announcements.
After making dividend announcements, however, the two groups adopt distinctly
different investment policies. Firms in the dividend-increase group greatly expand annual
investment at a magnitude much greater than those firms with no dividend change. In
contrast, dividend-decrease firms even shrink their tangible fixed assets 1 year after the
dividend announcements. It seems that dividend-decreasing firms with deteriorating
earnings do not have enough cash flow to continue their usual level of investment. They
even appear to sell some of their inefficient fixed assets to support the needs for cash
flows. After their earnings improve in years + 2 and + 3, they resume their normal
investment activities.
To gain a better understanding about the investment behavior, we also examine the
change in investment level with respect to dividend changes. Since the change in tangible
fixed assets is used as a proxy for annual investment, the change in the investment level is
the result of twice differencing tangible fixed assets.19 Again, distinctively different
investment behaviors are found between dividend-increasing and dividend-decreasing
firms around the year of dividend announcements. Panel B of Table 7 shows that dividend-
increasing firms significantly increase their investment activities beyond their usual
19 The annual investment (INV) is previously calculated as the change in tangible fixed assets (TFA); i.e.,
INVt=TFAt�TFAt � 1. Accordingly,
DINVt ¼ INVt � INVt�1 ¼ TFAt � 2TFAt�1 þ TFAt�2:
In using this equation to calculate the change in the investment level, we implicitly assume that the investment level
of a firm in the previous year represents the normal investment level of the firm. Such a measure is problematic
whenever cyclical fluctuation in investment activities by firms is common. Two reasons lend some support in using
such a simplification: first, the relatively stable base of tangible fixed assets is used for the calculation; and second,
the use of medians, instead of means, in the analyses alleviates this measurement problem.
H.K. Kato et al. / Pacific-Basin Finance Journal 10 (2002) 443–473 461
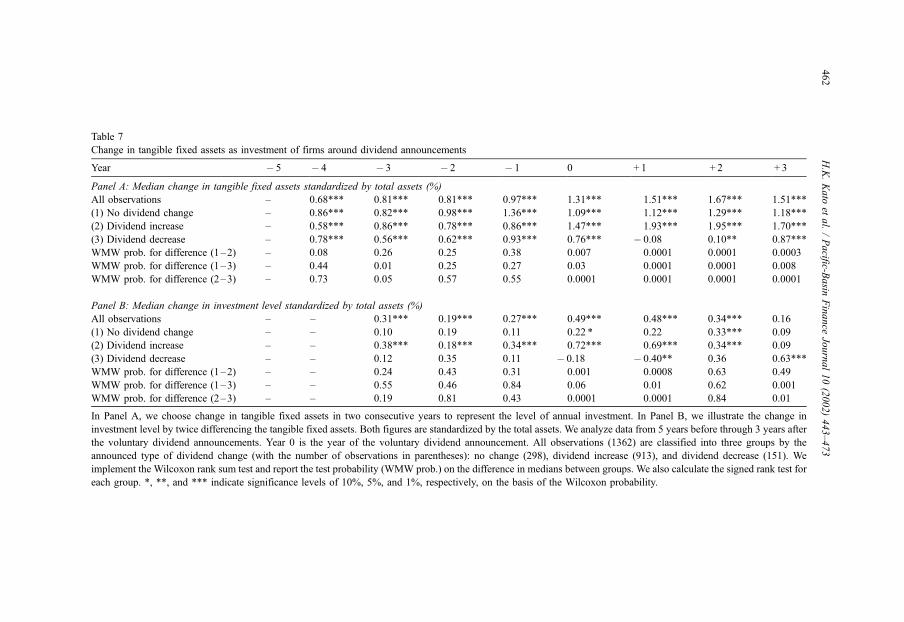
Table 7
Change in tangible fixed assets as investment of firms around dividend announcements
Year � 5 � 4 � 3 � 2 � 1 0 + 1 + 2 + 3
Panel A: Median change in tangible fixed assets standardized by total assets (%)
All observations – 0.68*** 0.81*** 0.81*** 0.97*** 1.31*** 1.51*** 1.67*** 1.51***
(1) No dividend change – 0.86*** 0.82*** 0.98*** 1.36*** 1.09*** 1.12*** 1.29*** 1.18***
(2) Dividend increase – 0.58*** 0.86*** 0.78*** 0.86*** 1.47*** 1.93*** 1.95*** 1.70***
(3) Dividend decrease – 0.78*** 0.56*** 0.62*** 0.93*** 0.76*** � 0.08 0.10** 0.87***
WMW prob. for difference (1–2) – 0.08 0.26 0.25 0.38 0.007 0.0001 0.0001 0.0003
WMW prob. for difference (1–3) – 0.44 0.01 0.25 0.27 0.03 0.0001 0.0001 0.008
WMW prob. for difference (2–3) – 0.73 0.05 0.57 0.55 0.0001 0.0001 0.0001 0.0001
Panel B: Median change in investment level standardized by total assets (%)
All observations – – 0.31*** 0.19*** 0.27*** 0.49*** 0.48*** 0.34*** 0.16
(1) No dividend change – – 0.10 0.19 0.11 0.22 * 0.22 0.33*** 0.09
(2) Dividend increase – – 0.38*** 0.18*** 0.34*** 0.72*** 0.69*** 0.34*** 0.09
(3) Dividend decrease – – 0.12 0.35 0.11 � 0.18 � 0.40** 0.36 0.63***
WMW prob. for difference (1–2) – – 0.24 0.43 0.31 0.001 0.0008 0.63 0.49
WMW prob. for difference (1–3) – – 0.55 0.46 0.84 0.06 0.01 0.62 0.001
WMW prob. for difference (2–3) – – 0.19 0.81 0.43 0.0001 0.0001 0.84 0.01
In Panel A, we choose change in tangible fixed assets in two consecutive years to represent the level of annual investment. In Panel B, we illustrate the change in
investment level by twice differencing the tangible fixed assets. Both figures are standardized by the total assets. We analyze data from 5 years before through 3 years after
the voluntary dividend announcements. Year 0 is the year of the voluntary dividend announcement. All observations (1362) are classified into three groups by the
announced type of dividend change (with the number of observations in parentheses): no change (298), dividend increase (913), and dividend decrease (151). We
implement the Wilcoxon rank sum test and report the test probability (WMW prob.) on the difference in medians between groups. We also calculate the signed rank test for
each group. *, **, and *** indicate significance levels of 10%, 5%, and 1%, respectively, on the basis of the Wilcoxon probability.
H.K.Kato
etal./Pacific-B
asin
Finance
Journal10(2002)443–473
462
investment level starting 1 year before through 2 years after the dividend increase. In
contrast, dividend-decreasing firms cannot maintain their previous investment level in the
year of and 1 year after announcing a dividend decrease.
Since the free cash flow hypothesis is supposed to be valid for firms without profitable
investment opportunities, we repeat the analysis on both low-Tobin q firms and high-q
firms.20 We have tried several alternative specifications to classify low- and high-q firms.
The results for high- and low-q firms alike are, however, qualitatively similar to the ones
reported in Table 7 regardless of the specification of the Tobin’s q measures. At least for
our crude measures of Tobin q, dividend changes appear to predict better the future firms’
investment behavior than do the traditional measures of growth.
In summary, the results from the analyses of cash flow behavior around dividend
announcements show that firms announcing a dividend increase are characterized by
higher earnings, lower debt ratios, and increase investment levels. On the other hand,
dividend-decreasing firms experience a deterioration in earnings, raise their leverage
ratios, and reduce investment activities. The internal financing through earnings and the
external financing through debt seem to substitute for each other. Moreover, successful
firms with high earnings tend to increase their investment activities. Basically, the results
of these univariate analyses do not support the free cash flow hypothesis, which weakly
implies that an increase in dividend by overinvesting firms would accompany a
decrease, or at least not an increase, in investment levels. This study finds that both
low- and high-q firms increase their investment after announcing a dividend increase.
Furthermore, dividend-decreasing firms not only decrease their investments, but even
reduce the size of their tangible fixed assets after the announcement of a dividend
decrease.21
20 We cannot use the criteria of Tobin’s q ratio equal to one to distinguish overinvesting firms from value-
maximizing firms. Most studies use the ratio of the market value over the book value of a firm (either equities or
total assets) as a proxy for Tobin’s q ratio. We calculate both ratios for all nonfinancial firms in the NEEDS
(annual financial data) file from 1982 to 1991. Out of the available 6953 observations, about 97% of the
observations have a ratio greater than 1 due to unusually high stock prices in Japan during our sample period.
Moreover, note that the sample period is characterized by rising stock prices in Japan. This trend of stock prices
may cause biases in calculating Tobin q ratios for the same company but in different time periods. For example,
one company, with similar investment opportunities and investment behavior over time, would have a relatively
low q in the early 1980s and a high q in the late 1980s simply because its stock price greatly appreciated in the
1980s. In this case, this company may be classified as an overinvestor in the early 1980s and value-maximizer in
the late 1980s. To address this issue, we take the average Tobin’s q ratio of companies during the study period.
The top and bottom 5% companies are excluded as outliers. The next top 35% of firms are selected as high-q
firms and the next bottom 35% of firms are classified as low-q firms, while the middle 20% are not included in
either group for the purpose of our analysis.21 We repeat the univariate analysis with a control sample of nonannouncing firms obtained from the NEEDS
files (overall 3236 observations). We find very similar but weaker results for this sample. The one exception is
that dividend reducing firms which do not make announcements, do not reduce their investment in tangible assets
around the dividend cut. We describe the results as weaker because the differences between dividend increasing
firms and dividend decreasing firms in terms of earnings, debt ratios, and investment, are smaller and less
significant. One interpretation for these differences between the samples is that Japanese managers use this
additional degree of freedom (to make an announcement or not) as a way to strengthen the signal. This is similar
to U.S. managers who use increases in a regular dividend as a stronger signal than a declaration of a special or
extra dividend.
H.K. Kato et al. / Pacific-Basin Finance Journal 10 (2002) 443–473 463
So far, this study has concentrated on univariate analyses that omit the interactions
between the various components of cash flow. A supplemental approach is to control for
the available cash flows and investment opportunities while examining the relationship
between changes in dividend payments and investment spending. In the next section, we
examine the combined effects of all related cash flow components on the investment
activities of firms.
5. Investment behavior and dividend policy
5.1. Rationale and description of investment models
A recent stream of research examines the impacts of cash flows and investment
opportunities on the firms’ investment activities.22 Typically, a time-series and cross-
sectional regression framework is employed for the following reduced investment
equation:
ðINV=KÞit ¼ ai þ at þ b1ðCF=KÞit þ b2ðTQÞit þ b3ðREV=KÞit þ eit; ð1Þ
where (INV/K)it represents the annual investment (INV) for the firm in year t scaled by the
firm’s capital stock (K), ai and at are firm- and year-specific fixed effects. TQ is the
Tobin’s q ratio; REV/K equals the annual revenue standardized by the capital stock. CF/K
refers to the cash flows standardized by the capital stock.
To examine the relationship between the dividend policy and the investment behavior,
we modify the common investment model (1) in an attempt to distinguish between the
competing hypotheses. Because the impact of dividend changes is the focus of the
analysis, we include the change in dividend payment (DDIV) as a new independent
variable. Whether the dividend change in one period affects the investments in the
concurrent or a later period is an empirical issue. To prevent the possible omission of
explanatory variables, we include both the concurrent and the lagged dividend changes in
the model. With such additions, the cash flow measure in the original investment model
needs to be revised to account for the effect of the dividend change on the available cash
flow. Therefore, the cash flow before dividend payment (CFBD) is used in the model,
which is the cash flow available for dividend payment and investment. The CFBD of a
firm is calculated as the operating income plus depreciation, less the sum of interest
expenses and provision for income taxes.23
In addition, the revenue variable in the original model is replaced by the growth rate in
revenue (REVGRW). Presumably, the revenue growth rate is a better proxy for a firm’s
short-term investment opportunities than the revenue measure. This measure of short-term
growth opportunity supplements the firm’s long-term investment prospect proxied by the
Tobin’s q ratio in the equation. In the model, we use the lagged measures of Tobin’s q ratio
22 Recent examples are Fazzari et al. (1988), Oliner and Rudebusch (1992), and Vogt (1994).23 The median cash flow changes around the year of the dividend announcements are presented in Table 4.
H.K. Kato et al. / Pacific-Basin Finance Journal 10 (2002) 443–473464
and revenue growth rate as the explanatory variables for the annual investment level of
firms.24 The modified basic empirical investment model is
ðINV=TFAÞit ¼ ait þ b1ðCFBD=TFAÞit þ b2ðTQÞi;t�1 þ b3ðREVGRWÞi;t�1
þ b4ðDDIV=TFAÞi;t�1 þ b5ðDDIV=TFAÞi;t þ eit; ð2Þ
where the annual investment (INV) is calculated as the change in the tangible fixed assets
(DTFA). All the relevant variables are scaled by the size of tangible fixed assets (a proxy
for the capital stock, K, in the original investment model (1)). By applying this basic
investment model, we are able to examine the interaction between the change in dividend
payments and the investment activities while controlling for the cash flow and investment
opportunities.
In order to check whether dividend announcements are related to the free cash flow
hypothesis, we first examine the basic investment model (2) for our sample of firms
making dividend announcements from 1982 through 1991. For this sample, we have only
sufficient data to perform an ordinary least square regression.25 However, if there is any
systematic difference in the investment behavior between announcing and nonannouncing
observations, the estimation results from this analysis may not be representative of the
investment behavior of all Japanese firms.
Empirically, the investment model estimates the sensitivity of investment activities with
respect to internal cash flow. However, if a firm goes to the capital markets for external
funds in a certain year, the investment activities may appear to be less sensitive to the
internally generated cash flow in several years following the external financing. Such
impacts from external financing may bias the estimation of the cash flow sensitivity of
investment behavior. To further control for the cash flow from external financing, we add
two more cash flow components related to financing activities in the investment model.
Change in liabilities (DLIAB) is employed as a proxy for debt financing, and change in
paid-in capital (DPICA) is used to represent equity financing. The expanded empirical
investment model is
ðINV=TFAÞit ¼ ai þ at þ b1ðCFBD=TFAÞi;t þ b2ðTQÞi;t�1 þ b3ðREVGRWÞi;t�1
þ b4ðDDIV=TFAÞi;t�1 þ b5ðDDIV=TFAÞi;t þ b6ðDLIAB=TFAÞi;tþ b7ðDPICA=TFAÞi;t þ eit: ð3Þ
Basically, the sum of DLIAB, DPICA, and DIV represents the cash flow from financing
activities, while CFBD and INVare proxies for the remaining two components of the cash
flow statement (cash flow from operating and investing activities).
To generalize the analysis of investment behavior to the entire corporate sector in
Japan, we examine observations from the universe of nonfinancial Japanese firms in the
24 We find similar but slightly weaker results when we use the contemporary measures of these variables in
the investment model.25 ai and at are replaced by an intercept, ait, in the investment model (2) for OLS regression. Alternatively, we
have tried using year dummies to represent the year effect. We obtain results similar to those reported in Table 8.
H.K. Kato et al. / Pacific-Basin Finance Journal 10 (2002) 443–473 465
first section of the TSE, which may or may not make dividend announcements during the
same period. This sample is obtained from the NEEDS data files, and its comprehensive
nature allows us to conduct a time-series and cross-sectional analysis. This time-series and
cross-sectional regression has an advantage over the OLS regression for at least two
reasons: first, the changes in the cash flow components in a specific year or during a short
period may not accurately represent the usual interaction among all these cash flow
components.26 Second, accounting figures may be more easily maneuvered in a specific
year, but not so over a longer period of time. Therefore, examining the expanded
investment model (3) in the framework of complete time series observations will allow
this study to obtain consistent estimates of relatively stable and long-term relationships
between the investment spending and the change in dividend payment and other
independent variables.
5.2. Hypotheses for the estimates of the explanatory variables
The two proxies of investment opportunities (PTQ and PREVGRW) should have,
ceteris paribus, a positive impact on the level of annual investment. To support the free
cash flow hypothesis, the coefficient estimate of the standardized cash flow (SCF =CFBD/
TFA) should be positive because it indicates that firms with more free cash flow are more
likely to make larger investment. However, if liquidity constraints exist and if external
financing is relatively costly due to information asymmetry, the pecking order theory
(Myers and Majluf, 1984) also predicts a positive impact of the internal cash flow on the
investment spending. Therefore, a positive coefficient for the cash flow variable is by itself
not a confirmation of the free cash flow hypothesis.
One contribution of this study is to examine the effect of changes in the dividend policy
in the framework of investment behavior. That is, we incorporate the concurrent and
lagged changes in dividend payments (SCDIV and PSCDIV) in the investment model so
that we can directly test the free cash flow hypothesis. Holding other cash flow
components constant, the overinvestment hypothesis implies that an increase (decrease)
in dividend of overinvestors would accompany or lead to a decrease (increase) in their
investment level. Accordingly, the change in dividend payment should have a negative
coefficient if the dividend policy in Japan is adopted to control the overinvestment
problem. In contrast, a significantly positive coefficient of dividend change variable will
be consistent with the implication of the cash flow information hypothesis. In this case,
firms that raise their dividends are apparently aware of lucrative investment opportunities
and, therefore, tend to increase their investments.
Once again, however, a negative coefficient estimate of dividend change is not only
consistent with the free cash flow hypothesis but also with the pecking order theory. The
pecking order theory suggests that firms will seek internal financing first for investment
needs when external financing is relatively costly. If dividend policy is decided after the
investment decisions have been planned, the management will keep down the dividend
payments and obtain needed financing internally for investments. To distinguish between
26 For example, debt and equity financings do not occur often. Therefore, we do not include them in the OLS
regression to prevent possible bias in estimation.
H.K. Kato et al. / Pacific-Basin Finance Journal 10 (2002) 443–473466
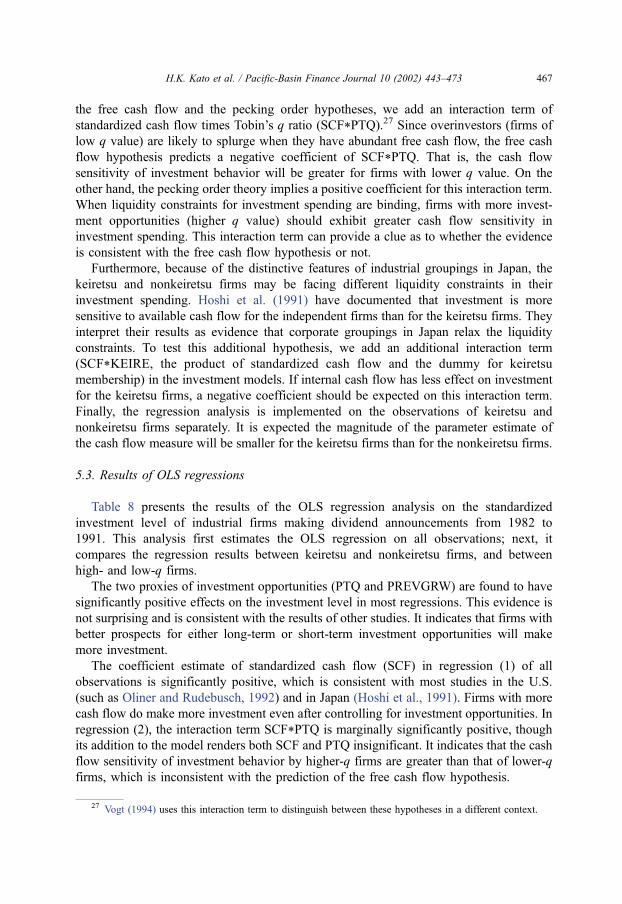
the free cash flow and the pecking order hypotheses, we add an interaction term of
standardized cash flow times Tobin’s q ratio (SCF*PTQ).27 Since overinvestors (firms of
low q value) are likely to splurge when they have abundant free cash flow, the free cash
flow hypothesis predicts a negative coefficient of SCF*PTQ. That is, the cash flow
sensitivity of investment behavior will be greater for firms with lower q value. On the
other hand, the pecking order theory implies a positive coefficient for this interaction term.
When liquidity constraints for investment spending are binding, firms with more invest-
ment opportunities (higher q value) should exhibit greater cash flow sensitivity in
investment spending. This interaction term can provide a clue as to whether the evidence
is consistent with the free cash flow hypothesis or not.
Furthermore, because of the distinctive features of industrial groupings in Japan, the
keiretsu and nonkeiretsu firms may be facing different liquidity constraints in their
investment spending. Hoshi et al. (1991) have documented that investment is more
sensitive to available cash flow for the independent firms than for the keiretsu firms. They
interpret their results as evidence that corporate groupings in Japan relax the liquidity
constraints. To test this additional hypothesis, we add an additional interaction term
(SCF*KEIRE, the product of standardized cash flow and the dummy for keiretsu
membership) in the investment models. If internal cash flow has less effect on investment
for the keiretsu firms, a negative coefficient should be expected on this interaction term.
Finally, the regression analysis is implemented on the observations of keiretsu and
nonkeiretsu firms separately. It is expected the magnitude of the parameter estimate of
the cash flow measure will be smaller for the keiretsu firms than for the nonkeiretsu firms.
5.3. Results of OLS regressions
Table 8 presents the results of the OLS regression analysis on the standardized
investment level of industrial firms making dividend announcements from 1982 to
1991. This analysis first estimates the OLS regression on all observations; next, it
compares the regression results between keiretsu and nonkeiretsu firms, and between
high- and low-q firms.
The two proxies of investment opportunities (PTQ and PREVGRW) are found to have
significantly positive effects on the investment level in most regressions. This evidence is
not surprising and is consistent with the results of other studies. It indicates that firms with
better prospects for either long-term or short-term investment opportunities will make
more investment.
The coefficient estimate of standardized cash flow (SCF) in regression (1) of all
observations is significantly positive, which is consistent with most studies in the U.S.
(such as Oliner and Rudebusch, 1992) and in Japan (Hoshi et al., 1991). Firms with more
cash flow do make more investment even after controlling for investment opportunities. In
regression (2), the interaction term SCF*PTQ is marginally significantly positive, though
its addition to the model renders both SCF and PTQ insignificant. It indicates that the cash
flow sensitivity of investment behavior by higher-q firms are greater than that of lower-q
firms, which is inconsistent with the prediction of the free cash flow hypothesis.
27 Vogt (1994) uses this interaction term to distinguish between these hypotheses in a different context.
H.K. Kato et al. / Pacific-Basin Finance Journal 10 (2002) 443–473 467
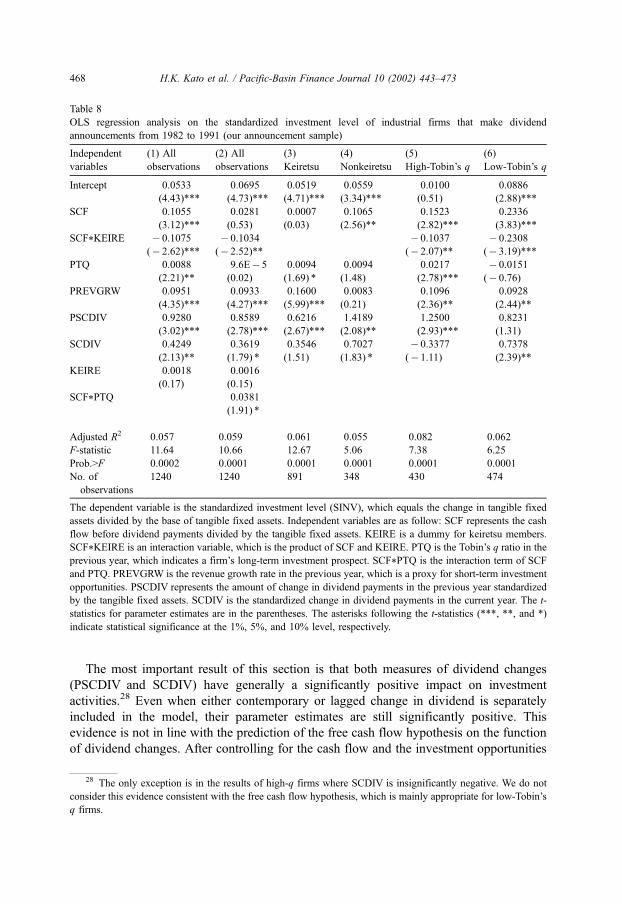
The most important result of this section is that both measures of dividend changes
(PSCDIV and SCDIV) have generally a significantly positive impact on investment
activities.28 Even when either contemporary or lagged change in dividend is separately
included in the model, their parameter estimates are still significantly positive. This
evidence is not in line with the prediction of the free cash flow hypothesis on the function
of dividend changes. After controlling for the cash flow and the investment opportunities
Table 8
OLS regression analysis on the standardized investment level of industrial firms that make dividend
announcements from 1982 to 1991 (our announcement sample)
Independent
variables
(1) All
observations
(2) All
observations
(3)
Keiretsu
(4)
Nonkeiretsu
(5)
High-Tobin’s q
(6)
Low-Tobin’s q
Intercept 0.0533
(4.43)***
0.0695
(4.73)***
0.0519
(4.71)***
0.0559
(3.34)***
0.0100
(0.51)
0.0886
(2.88)***
SCF 0.1055
(3.12)***
0.0281
(0.53)
0.0007
(0.03)
0.1065
(2.56)**
0.1523
(2.82)***
0.2336
(3.83)***
SCF*KEIRE � 0.1075
(� 2.62)***
� 0.1034
(� 2.52)**
� 0.1037
(� 2.07)**
� 0.2308
(� 3.19)***
PTQ 0.0088
(2.21)**
9.6E� 5
(0.02)
0.0094
(1.69) *
0.0094
(1.48)
0.0217
(2.78)***
� 0.0151
(� 0.76)
PREVGRW 0.0951
(4.35)***
0.0933
(4.27)***
0.1600
(5.99)***
0.0083
(0.21)
0.1096
(2.36)**
0.0928
(2.44)**
PSCDIV 0.9280
(3.02)***
0.8589
(2.78)***
0.6216
(2.67)***
1.4189
(2.08)**
1.2500
(2.93)***
0.8231
(1.31)
SCDIV 0.4249
(2.13)**
0.3619
(1.79) *
0.3546
(1.51)
0.7027
(1.83) *
� 0.3377
(� 1.11)
0.7378
(2.39)**
KEIRE 0.0018
(0.17)
0.0016
(0.15)
SCF*PTQ 0.0381
(1.91) *
Adjusted R2 0.057 0.059 0.061 0.055 0.082 0.062
F-statistic 11.64 10.66 12.67 5.06 7.38 6.25
Prob.>F 0.0002 0.0001 0.0001 0.0001 0.0001 0.0001
No. of
observations
1240 1240 891 348 430 474
The dependent variable is the standardized investment level (SINV), which equals the change in tangible fixed
assets divided by the base of tangible fixed assets. Independent variables are as follow: SCF represents the cash
flow before dividend payments divided by the tangible fixed assets. KEIRE is a dummy for keiretsu members.
SCF*KEIRE is an interaction variable, which is the product of SCF and KEIRE. PTQ is the Tobin’s q ratio in the
previous year, which indicates a firm’s long-term investment prospect. SCF*PTQ is the interaction term of SCF
and PTQ. PREVGRW is the revenue growth rate in the previous year, which is a proxy for short-term investment
opportunities. PSCDIV represents the amount of change in dividend payments in the previous year standardized
by the tangible fixed assets. SCDIV is the standardized change in dividend payments in the current year. The t-
statistics for parameter estimates are in the parentheses. The asterisks following the t-statistics (***, **, and *)
indicate statistical significance at the 1%, 5%, and 10% level, respectively.
28 The only exception is in the results of high-q firms where SCDIV is insignificantly negative. We do not
consider this evidence consistent with the free cash flow hypothesis, which is mainly appropriate for low-Tobin’s
q firms.
H.K. Kato et al. / Pacific-Basin Finance Journal 10 (2002) 443–473468
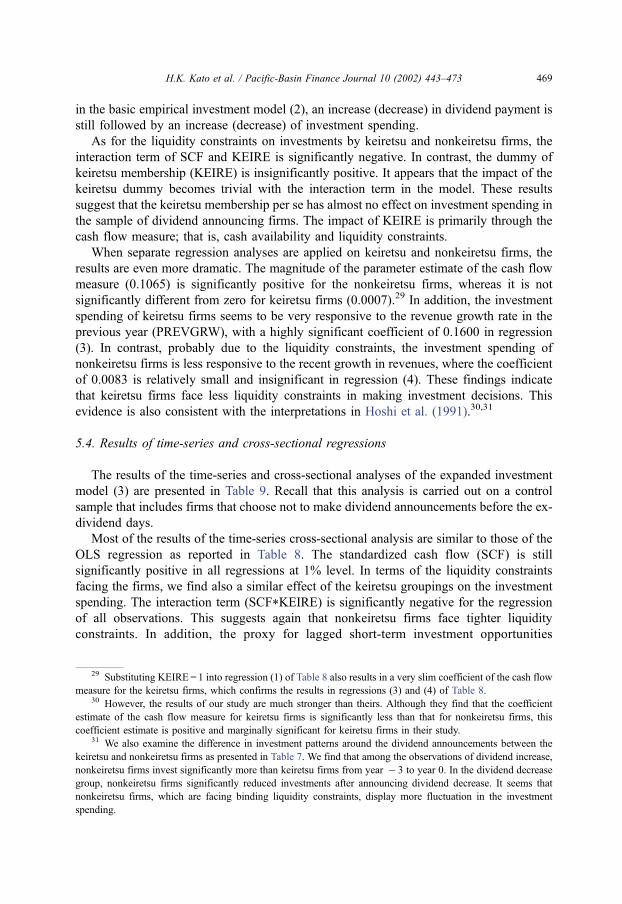
in the basic empirical investment model (2), an increase (decrease) in dividend payment is
still followed by an increase (decrease) of investment spending.
As for the liquidity constraints on investments by keiretsu and nonkeiretsu firms, the
interaction term of SCF and KEIRE is significantly negative. In contrast, the dummy of
keiretsu membership (KEIRE) is insignificantly positive. It appears that the impact of the
keiretsu dummy becomes trivial with the interaction term in the model. These results
suggest that the keiretsu membership per se has almost no effect on investment spending in
the sample of dividend announcing firms. The impact of KEIRE is primarily through the
cash flow measure; that is, cash availability and liquidity constraints.
When separate regression analyses are applied on keiretsu and nonkeiretsu firms, the
results are even more dramatic. The magnitude of the parameter estimate of the cash flow
measure (0.1065) is significantly positive for the nonkeiretsu firms, whereas it is not
significantly different from zero for keiretsu firms (0.0007).29 In addition, the investment
spending of keiretsu firms seems to be very responsive to the revenue growth rate in the
previous year (PREVGRW), with a highly significant coefficient of 0.1600 in regression
(3). In contrast, probably due to the liquidity constraints, the investment spending of
nonkeiretsu firms is less responsive to the recent growth in revenues, where the coefficient
of 0.0083 is relatively small and insignificant in regression (4). These findings indicate
that keiretsu firms face less liquidity constraints in making investment decisions. This
evidence is also consistent with the interpretations in Hoshi et al. (1991).30,31
5.4. Results of time-series and cross-sectional regressions
The results of the time-series and cross-sectional analyses of the expanded investment
model (3) are presented in Table 9. Recall that this analysis is carried out on a control
sample that includes firms that choose not to make dividend announcements before the ex-
dividend days.
Most of the results of the time-series cross-sectional analysis are similar to those of the
OLS regression as reported in Table 8. The standardized cash flow (SCF) is still
significantly positive in all regressions at 1% level. In terms of the liquidity constraints
facing the firms, we find also a similar effect of the keiretsu groupings on the investment
spending. The interaction term (SCF*KEIRE) is significantly negative for the regression
of all observations. This suggests again that nonkeiretsu firms face tighter liquidity
constraints. In addition, the proxy for lagged short-term investment opportunities
29 Substituting KEIRE= 1 into regression (1) of Table 8 also results in a very slim coefficient of the cash flow
measure for the keiretsu firms, which confirms the results in regressions (3) and (4) of Table 8.30 However, the results of our study are much stronger than theirs. Although they find that the coefficient
estimate of the cash flow measure for keiretsu firms is significantly less than that for nonkeiretsu firms, this
coefficient estimate is positive and marginally significant for keiretsu firms in their study.31 We also examine the difference in investment patterns around the dividend announcements between the
keiretsu and nonkeiretsu firms as presented in Table 7. We find that among the observations of dividend increase,
nonkeiretsu firms invest significantly more than keiretsu firms from year � 3 to year 0. In the dividend decrease
group, nonkeiretsu firms significantly reduced investments after announcing dividend decrease. It seems that
nonkeiretsu firms, which are facing binding liquidity constraints, display more fluctuation in the investment
spending.
H.K. Kato et al. / Pacific-Basin Finance Journal 10 (2002) 443–473 469
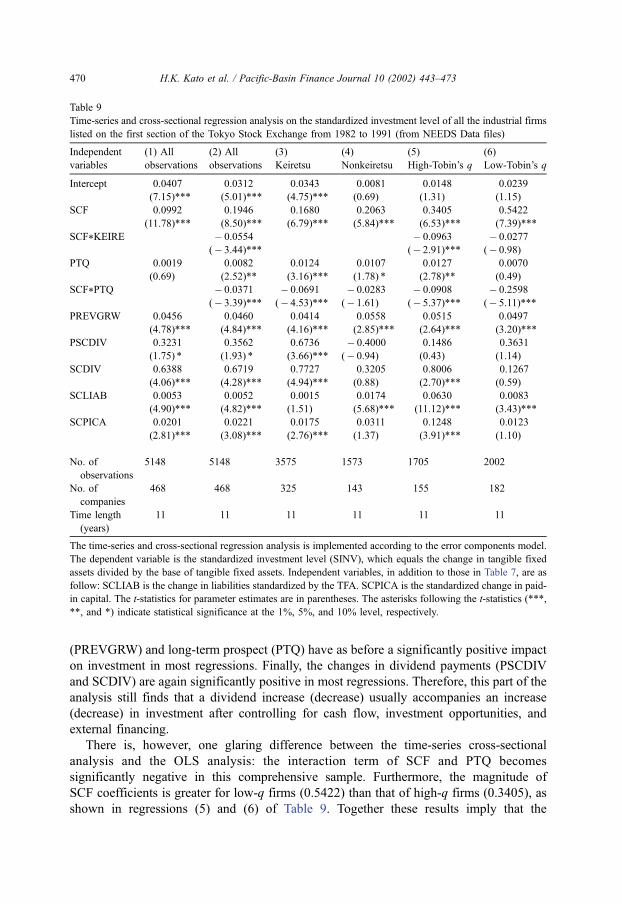
(PREVGRW) and long-term prospect (PTQ) have as before a significantly positive impact
on investment in most regressions. Finally, the changes in dividend payments (PSCDIV
and SCDIV) are again significantly positive in most regressions. Therefore, this part of the
analysis still finds that a dividend increase (decrease) usually accompanies an increase
(decrease) in investment after controlling for cash flow, investment opportunities, and
external financing.
There is, however, one glaring difference between the time-series cross-sectional
analysis and the OLS analysis: the interaction term of SCF and PTQ becomes
significantly negative in this comprehensive sample. Furthermore, the magnitude of
SCF coefficients is greater for low-q firms (0.5422) than that of high-q firms (0.3405), as
shown in regressions (5) and (6) of Table 9. Together these results imply that the
Table 9
Time-series and cross-sectional regression analysis on the standardized investment level of all the industrial firms
listed on the first section of the Tokyo Stock Exchange from 1982 to 1991 (from NEEDS Data files)
Independent
variables
(1) All
observations
(2) All
observations
(3)
Keiretsu
(4)
Nonkeiretsu
(5)
High-Tobin’s q
(6)
Low-Tobin’s q
Intercept 0.0407
(7.15)***
0.0312
(5.01)***
0.0343
(4.75)***
0.0081
(0.69)
0.0148
(1.31)
0.0239
(1.15)
SCF 0.0992
(11.78)***
0.1946
(8.50)***
0.1680
(6.79)***
0.2063
(5.84)***
0.3405
(6.53)***
0.5422
(7.39)***
SCF*KEIRE � 0.0554
(� 3.44)***
� 0.0963
(� 2.91)***
� 0.0277
(� 0.98)
PTQ 0.0019
(0.69)
0.0082
(2.52)**
0.0124
(3.16)***
0.0107
(1.78) *
0.0127
(2.78)**
0.0070
(0.49)
SCF*PTQ � 0.0371
(� 3.39)***
� 0.0691
(� 4.53)***
� 0.0283
(� 1.61)
� 0.0908
(� 5.37)***
� 0.2598
(� 5.11)***
PREVGRW 0.0456
(4.78)***
0.0460
(4.84)***
0.0414
(4.16)***
0.0558
(2.85)***
0.0515
(2.64)***
0.0497
(3.20)***
PSCDIV 0.3231
(1.75) *
0.3562
(1.93) *
0.6736
(3.66)***
� 0.4000
(� 0.94)
0.1486
(0.43)
0.3631
(1.14)
SCDIV 0.6388
(4.06)***
0.6719
(4.28)***
0.7727
(4.94)***
0.3205
(0.88)
0.8006
(2.70)***
0.1267
(0.59)
SCLIAB 0.0053
(4.90)***
0.0052
(4.82)***
0.0015
(1.51)
0.0174
(5.68)***
0.0630
(11.12)***
0.0083
(3.43)***
SCPICA 0.0201
(2.81)***
0.0221
(3.08)***
0.0175
(2.76)***
0.0311
(1.37)
0.1248
(3.91)***
0.0123
(1.10)
No. of
observations
5148 5148 3575 1573 1705 2002
No. of
companies
468 468 325 143 155 182
Time length
(years)
11 11 11 11 11 11
The time-series and cross-sectional regression analysis is implemented according to the error components model.
The dependent variable is the standardized investment level (SINV), which equals the change in tangible fixed
assets divided by the base of tangible fixed assets. Independent variables, in addition to those in Table 7, are as
follow: SCLIAB is the change in liabilities standardized by the TFA. SCPICA is the standardized change in paid-
in capital. The t-statistics for parameter estimates are in parentheses. The asterisks following the t-statistics (***,
**, and *) indicate statistical significance at the 1%, 5%, and 10% level, respectively.
H.K. Kato et al. / Pacific-Basin Finance Journal 10 (2002) 443–473470
sensitivity of investment spending to available cash flows by low-q firms is greater than
that of high-q firms.
This is by far the strongest evidence in our paper in support of the free cash flow
hypothesis. Note that in explaining the relationship between cash flows and investment
behavior, this result applies to the general population of Japanese firms rather than just to
firms that choose to make voluntary dividend announcements.
One interpretation of this curious distinction between the results of the primary sample
(dividend announcing firms) and the control sample (the comprehensive sample) is that
firms that make voluntary dividend announcements are better monitored and more
‘‘forthcoming’’ in terms of serving their shareholders. In contrast, firms that do not make
dividend announcements are more ‘‘secretive’’ and are more involved in activities that
benefit managers, perhaps at the expense of other claimholders.32
6. Summary and concluding remark
A popular avenue of research to address the importance of dividend policy on firm
value in the U.S. markets is to examine the market reaction to the dividend announce-
ments. Many studies document a positive stock price reaction to dividend initiation or
dividend increases and a negative market reaction to dividend cuts or omissions. The
reason for these stock price reactions is, however, less clear. Two hypotheses are
frequently proposed to explain the market reaction to the announcement of dividend
changes: the cash flow information and the free cash flow/overinvestment. Under these
hypotheses, dividend changes are considered either a signaling device for future cash flow
or a monitoring device for controlling the overinvestment of free cash flow. Each of these
hypotheses is supported by various empirical studies in the U.S. markets. To date, there is
still no consensus on this issue.
This study of dividend announcements in Japan sheds additional light on the continuing
debate. In addition to providing new evidence from a different institutional background,
we also apply various improved approaches to test directly the competing hypotheses.
First, we examine the cash flow and investment behavior around the dividend announce-
ments. Second, we investigate the relationship between dividend policy, available cash
flows, and investment behavior.
The findings of this study are generally supportive of the cash flow information
hypothesis. Although dividend announcements do not appear to be associated with active
signaling, the announcements of dividend changes do convey information about the
announcing firm’s cash flow from operations. Furthermore, dividend changes are not only
associated with earnings prospects in the near future but also reflect past and current
earnings performance.
Interestingly, the results show that dividend announcing firms and the general
population of firms exhibit different patterns of investment behavior. It seems that the
investment activities of dividend announcing firms are in line with the description of the
32 Kato et al. (1997) find that larger firms and keiretsu firms make announcements more frequently than
smaller firms with greater information asymmetry. Our interpretation is certainly in line with these results.
H.K. Kato et al. / Pacific-Basin Finance Journal 10 (2002) 443–473 471
pecking order theory. In contrast, the investment behavior of firms in the comprehensive
control sample is consistent with prediction of the free cash flow hypothesis. Specifically,
firms with more cash flow do invest more, and firms with lower q value, which are more
likely to be overinvestors, are more subject to cash flow constraints in their investment
spending.
If we focus, however, on our primary sample of firms that make voluntary dividend
announcements, the free cash flow hypothesis does not predict correctly the market
reaction to dividend announcements in Japan. Dividend announcements by firms with
higher q value incur greater market reaction than announcements by firms of lower q
value, which is inconsistent with the free cash flow hypothesis. Furthermore, after
controlling for cash flow, investment opportunities, and external financing, an increase
(decrease) in dividend usually accompanies an increase (decrease) in investment. Appa-
rently, dividend policy is not adopted actively in Japan as a device to control the
overinvestment problems, as the free cash flow hypothesis implies.33
This last result should come as no surprise considering the institutional background of
the Japanese market. The backbone of the free cash flow hypothesis is the agency problem
between management and shareholders. In the Japanese industrial structure, the agency
problems between management and shareholders is believed to be less severe because of
the close monitoring by the major corporate shareholders and the affiliated financial
institutions. All of our results for the sample of dividend announcing firms support this
belief. Nevertheless, there are some hints for the general population of Japanese firms that
suggest that the free cash flow problem might exists in Japan even though dividend policy
is clearly not used as a device to control this problem there.
References
Asquith, P., Mullins Jr., D., 1983. The impact of initiating dividend payments on shareholders’ wealth. Journal of
Business 56, 77–96.
Bajaj, M., Vijh, A., 1990. Dividend clienteles and the information content of dividend changes. Journal of
Financial Economics 26, 193–219.
Benartzi, S., Michaely, R., Thaler, R., 1997. Do changes in dividends signal the future or the past? Journal of
Finance 52, 1007–1034.
Bremer, M., Kato, K., 1996. Trading volume for winners and losers on the Tokyo Stock Exchange. Journal of
Financial and Quantitative Analysis 31, 127–142.
Chung, K., Pruit, S., 1994. A simple approximation of Tobin’s q. Financial Management 23, 70–74.
Denis, D., Denis, D., Sarin, A., 1994. The information content of dividend changes: Cash flow signaling, over-
investment, and dividend clienteles. Journal of Financial and Quantitative Analysis 29, 567–587.
Dewenter, K., Warther, V., 1998. Dividends, asymmetric information, and agency conflicts: Evidence from a
comparison of the dividend policies of Japanese and U.S. firms. Journal of Finance 53, 879–904.
Fazzari, S., Hubbard, R., Peterson, B., 1988. Financing constraints and corporate investment. Brookings Papers
on Economic Activity 1, 141–195.
33 This statement can be substantiated by the sources of empirical evidence that support the free cash flow
hypothesis. Among evidence in favor of the free cash flow hypothesis, most are usually related to financial
policies other than dividend policy, such as securities-offering announcements (Pilotte, 1992), tender offers (Lang
et al., 1991), self-tender offers (Perfect et al., 1995), and going-private transactions (Lehn and Poulsen, 1989).
Only rare evidence is associated with dividend announcements (Lang and Litzenberger, 1989).
H.K. Kato et al. / Pacific-Basin Finance Journal 10 (2002) 443–473472
Ghosh, C., Woolridge, J., 1988. An analysis of shareholder reaction to dividend cuts and omissions. Journal of
Financial Research 4, 281–294.
Healy, P., Palepu, K., 1988. Earnings information conveyed by dividend initiations and omissions. Journal of
Financial Economics 21, 149–175.
Hoshi, T., Kashyap, A., Scharfstein, D., 1991. Corporate structure, liquidity, and investment: Evidence from
Japanese industrial groups. Quarterly Journal of Economics 106, 33–60.
Kato, K., Loewenstein, U., 1995. The ex-dividend-day behavior of stock prices: The case of Japan. Review of
Financial Studies 8, 817–847.
Kato, K., Loewenstein, U., Tsay, W., 1997. Voluntary dividend announcements in Japan. Pacific-Basin Finance
Journal 5, 167–193.
Keiretsu no Kenkyu (Research on Industrial Groups), 1991. Annual publication. Keizai Chosa Kyokai, Tokyo.
Lang, L., Litzenberger, R., 1989. Dividend announcements: Cash flow signaling vs. free cash flow hypothesis?
Journal of Financial Economics 24, 181–191.
Lang, L., Stulz, R., Walkling, R., 1991. A test of the free cash flow hypothesis: The case of bidder returns. Journal
of Financial Economics 29, 315–335.
Lehn, K., Poulsen, A., 1989. Free cash flow and stockholder gains in going private transactions. Journal of
Finance 44, 771–789.
Lindenberg, E., Ross, S., 1981. Tobin’s q ratio and industrial organization. Journal of Business 54, 1–32.
Lintner, J., 1956. Distribution and incomes of corporations among dividends, retained earnings and taxes.
American Economic Review 46, 97–113, May.
Myers, S., Majluf, N., 1984. Corporate financing and investment decisions when firms have information that
investors do not have. Journal of Financial Economics 13, 187–221.
Oliner, S., Rudebusch, G., 1992. Sources of the financing hierarchy for business investment. Review of Eco-
nomics and Statistics 74, 643–654.
Perfect, S., Peterson, D., Peterson, P., 1995. Self-tender offers: the effects of free cash flow, cash flow signaling,
and the measurement of Tobin’s q. Journal of Banking and Finance 19, 1005–1023.
Pilotte, E., 1992. Growth opportunities and the stock price response to new financing. Journal of Business 65,
371–394.
Tompkins, J., 1996. Dividend cuts: ten years of cash flow evidence, working paper.
Vogt, S., 1994. The cash flow/investment relationship: evidence from U.S. manufacturing firms. Financial
Management 23, 3–20.
Yoon, P.S., Starks, L., 1995. Signaling, investment opportunities, and dividend announcements. Review of
Financial Studies 8, 995–1018.
H.K. Kato et al. / Pacific-Basin Finance Journal 10 (2002) 443–473 473