
Analysis of paired tumor and normal molecular phenotypes in TCGA
Andrew GrossTCGA Annual Meeting
May 11, 2015
TCGA is a blessing and a curse

TCGA is a blessing and a curse
Blessing
● No platform left behind
● Unprecedented cohort sizes
● Panoramic view into the tumor's biology

TCGA is a blessing and a curse
Blessing
● No platform left behind
● Unprecedented cohort sizes
● Panoramic view into the tumor's biology
The PANCAN Curse● Integrating data is hard● Methods get very
complicated very quickly
Danger Sign- Bruce Stockwell, CC-BY2.0

How do we break the PANCAN curse?
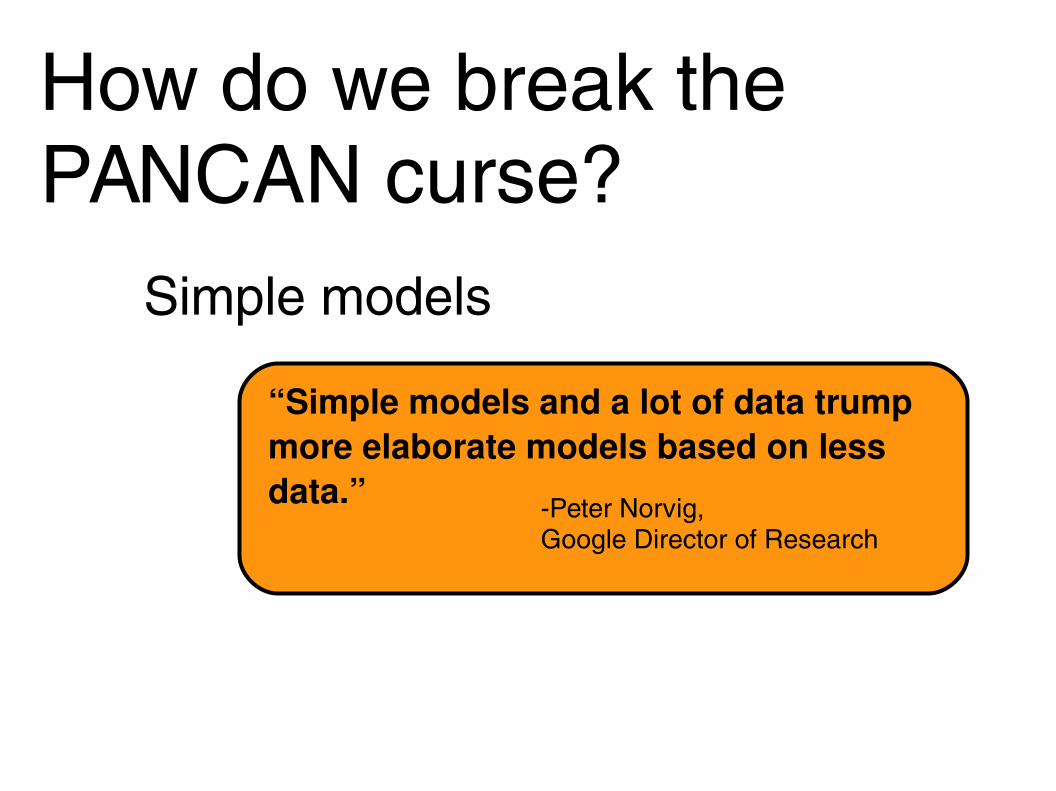
How do we break the PANCAN curse?
Simple models
“Simple models and a lot of data trump more elaborate models based on less data.” -Peter Norvig,
Google Director of Research

How do we break the PANCAN curse?
Incremental and transparent methods
Study goalsBetter understand the tumor phenotype.
Provide scope to molecular events often observed in specific tissue cohorts.

Study goalsBetter understand the tumor phenotype.
Provide scope to molecular events often observed in specific tissue cohorts.
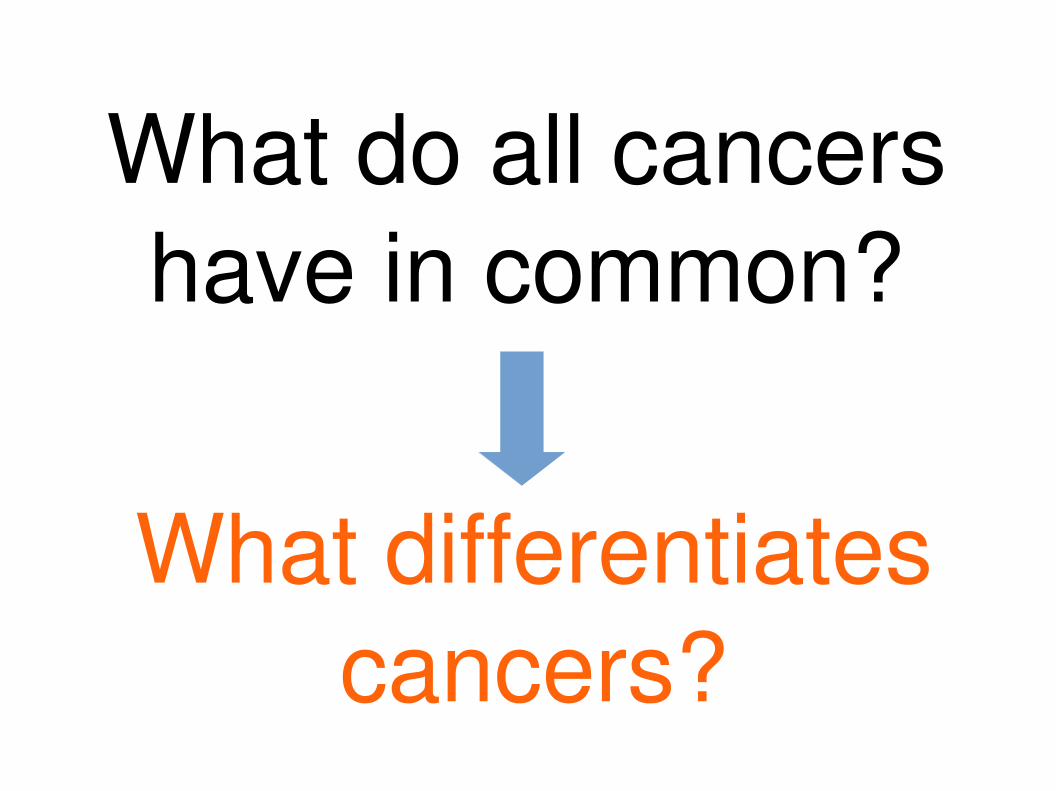
What do all cancers have in common?
What differentiates cancers?

A simple model of differential expression
Expression profile for single gene across PANCAN cohort

A simple model of differential expression
Expression profile for single gene across PANCAN cohort
Filter unmatched patients
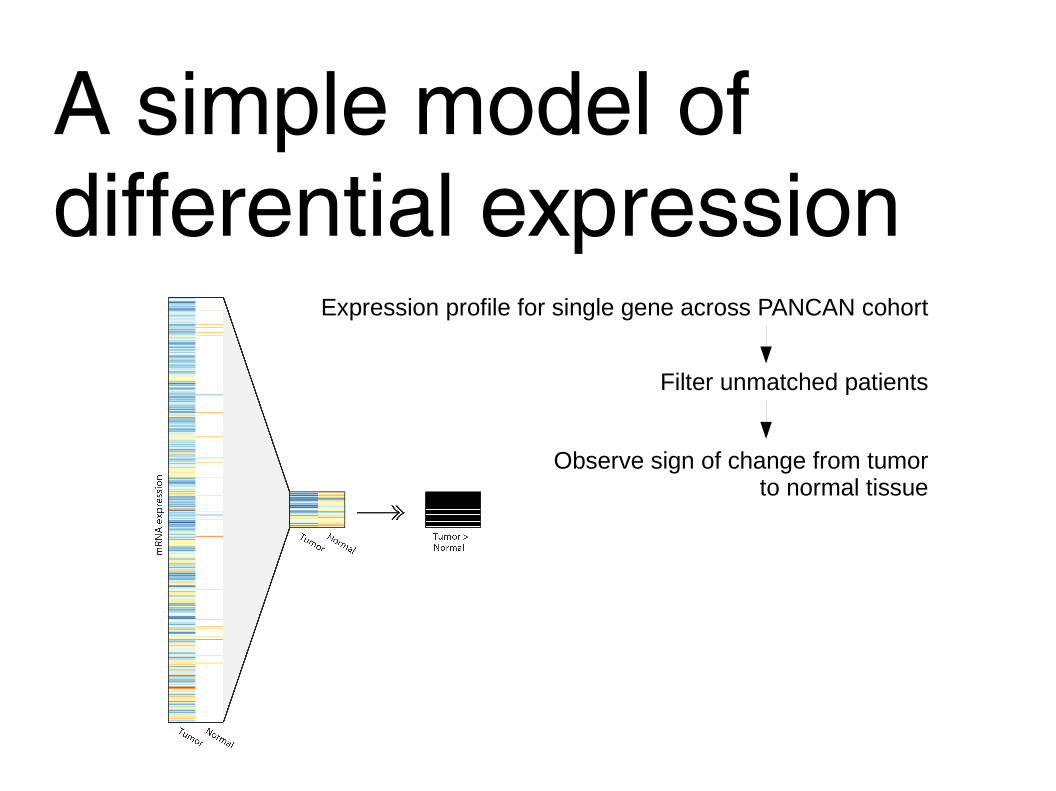
A simple model of differential expression
Expression profile for single gene across PANCAN cohort
Filter unmatched patients
Observe sign of change from tumorto normal tissue

A simple model of differential expression
Expression profile for single gene across PANCAN cohort
Filter unmatched patients
Observe sign of change from tumorto normal tissue
Count fraction of cohort withover-expression of gene

A simple model of differential expression
Null Hypothesis: F_g = 50%, gene is unchanged in tumor cells
Fraction overexpressed: fraction of patients in a cohort with overexpression of a gene

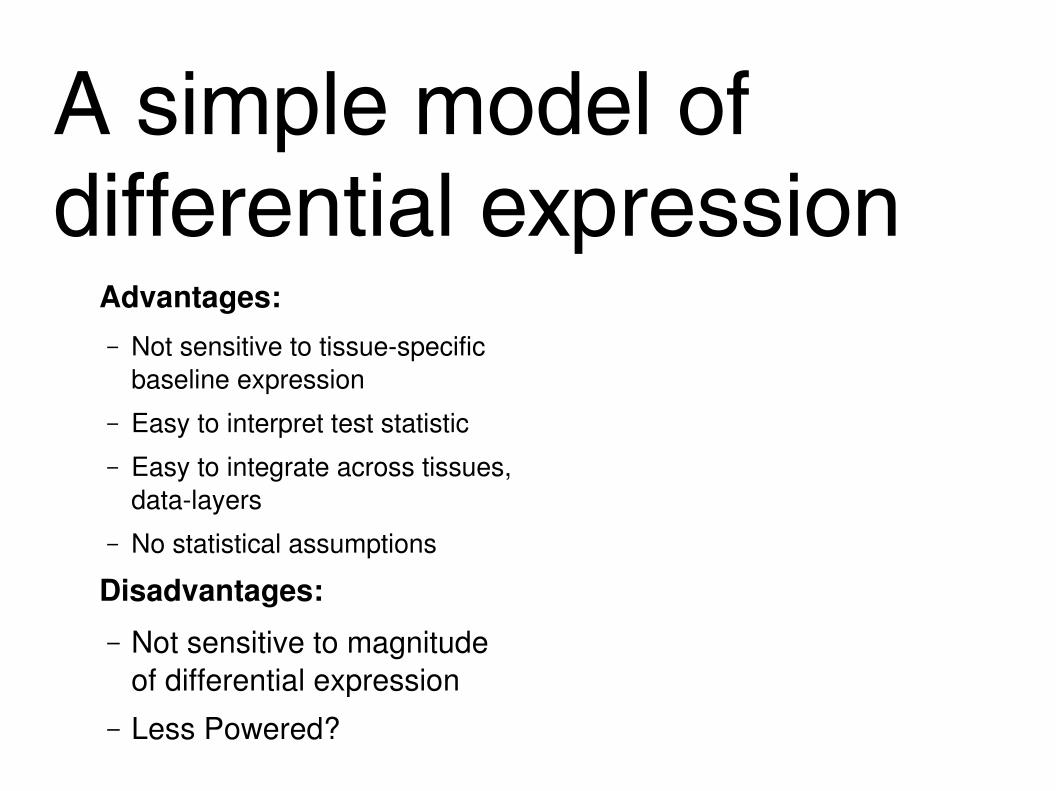
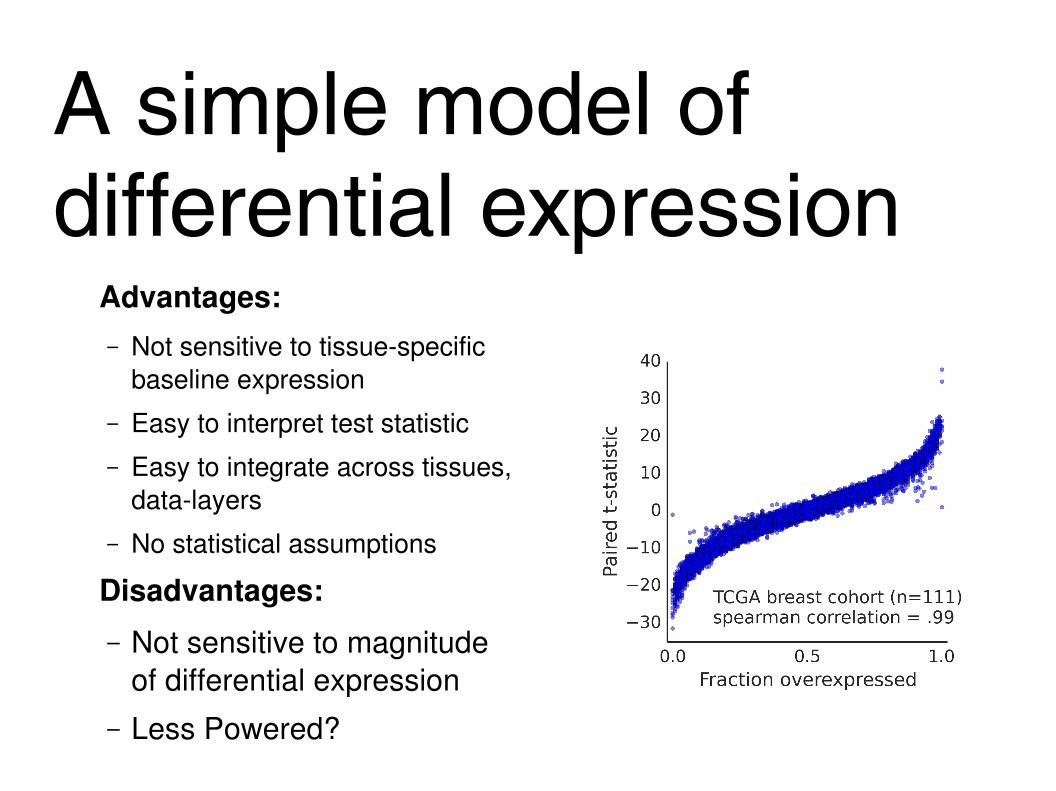
A simple model of differential expression
Advantages: – Not sensitive to tissuespecific
baseline expression– Easy to interpret test statistic– Easy to integrate across tissues,
datalayers– No statistical assumptions
Disadvantages:
– Not sensitive to magnitude of differential expression
– Less Powered?
What differentiates cancers?
What do all cancers have in common?

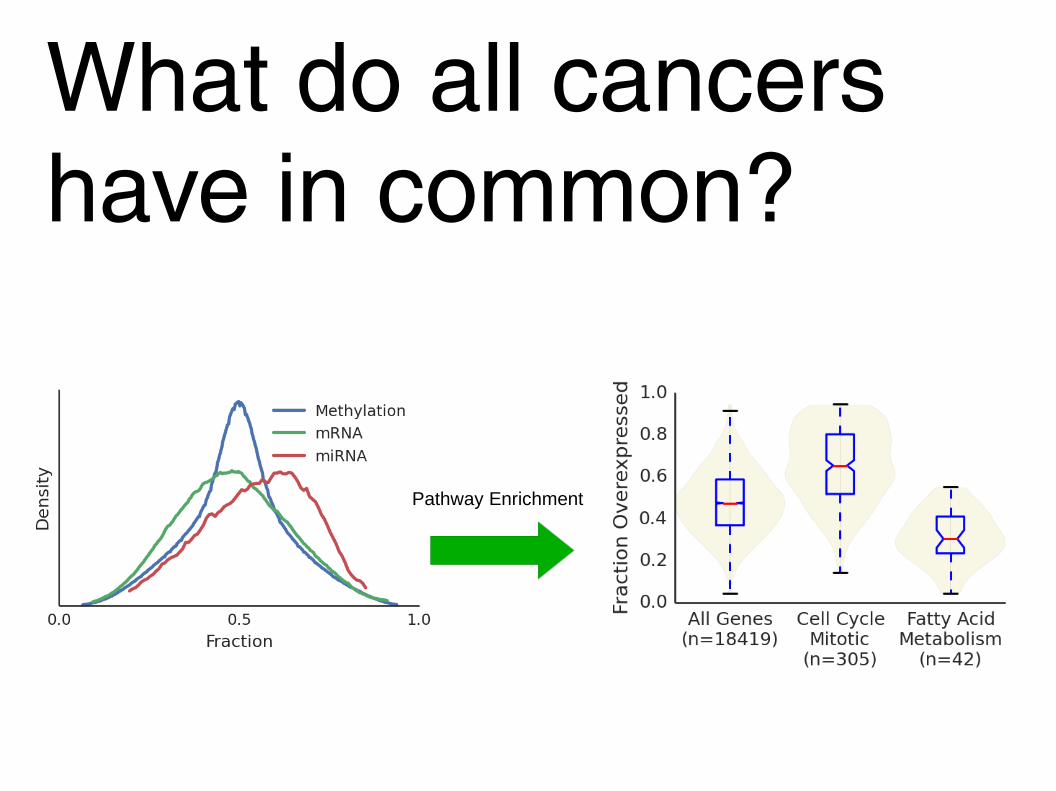
What do all cancers have in common?
● Methylation: 704 matched patients● mRNA: 650 matched patients● miRNA: 628 matched patients

What do all cancers have in common?ADH1B is up-regulated in 4% of tumors

What do all cancers have in common?
Mir-21 is up-regulated in 93% of tumors
What do all cancers have in common?
Pathway Enrichment
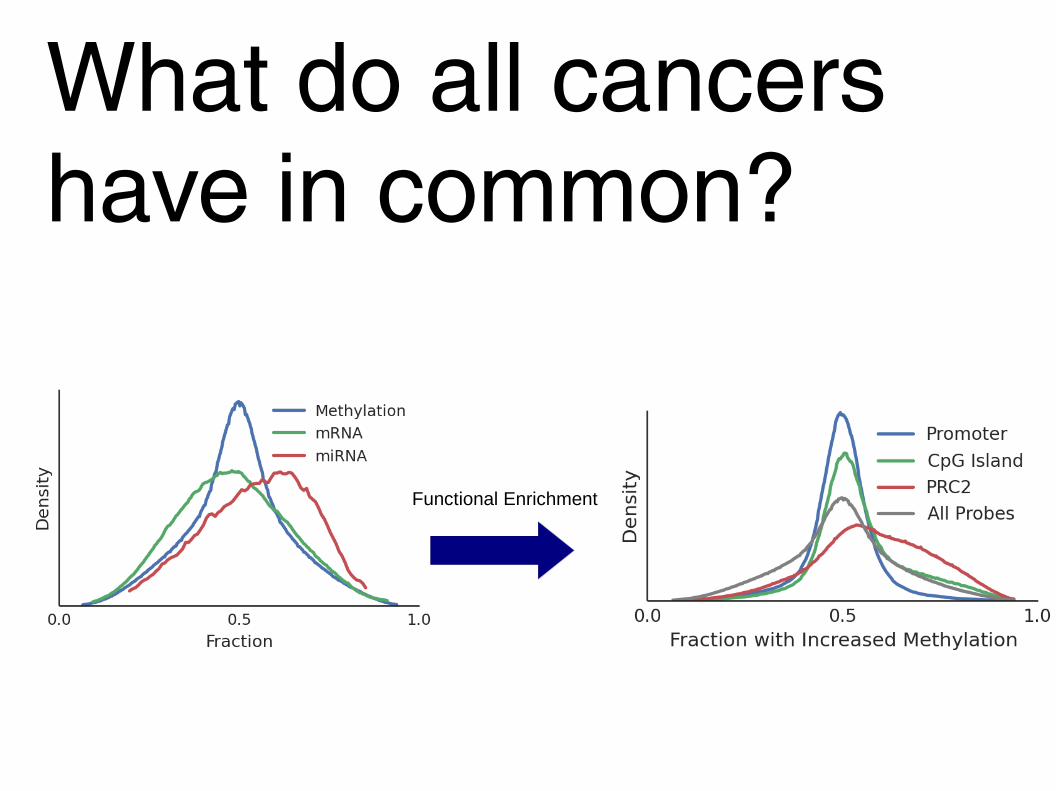
What do all cancers have in common?
Functional Enrichment
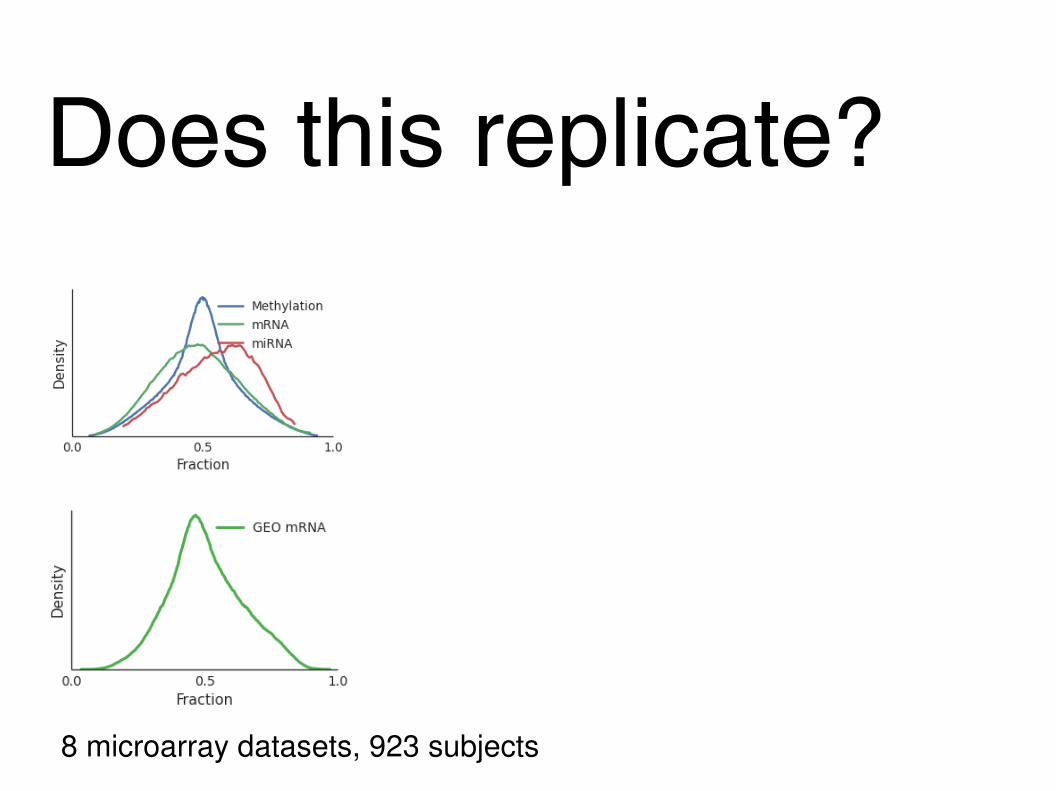
Does this replicate?
8 microarray datasets, 923 subjects

Does this replicate?
8 microarray datasets, 923 subjects
What differentiates cancers?
What do all cancers have in common?

Hypothesis: Genes turned on in the tumors will have levels associated with tumor growth and proliferation.

Correlation of profiles with tumor signature
Patient TCGA-BH-A0BZ
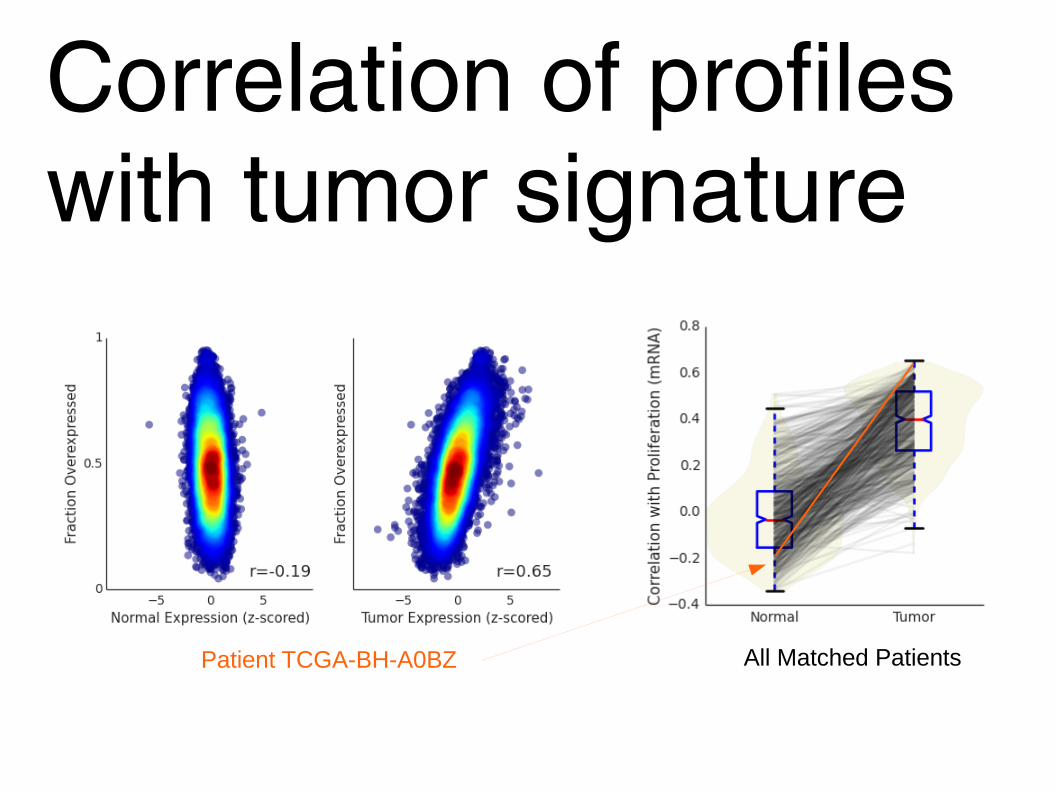
Correlation of profiles with tumor signature
Patient TCGA-BH-A0BZ All Matched Patients
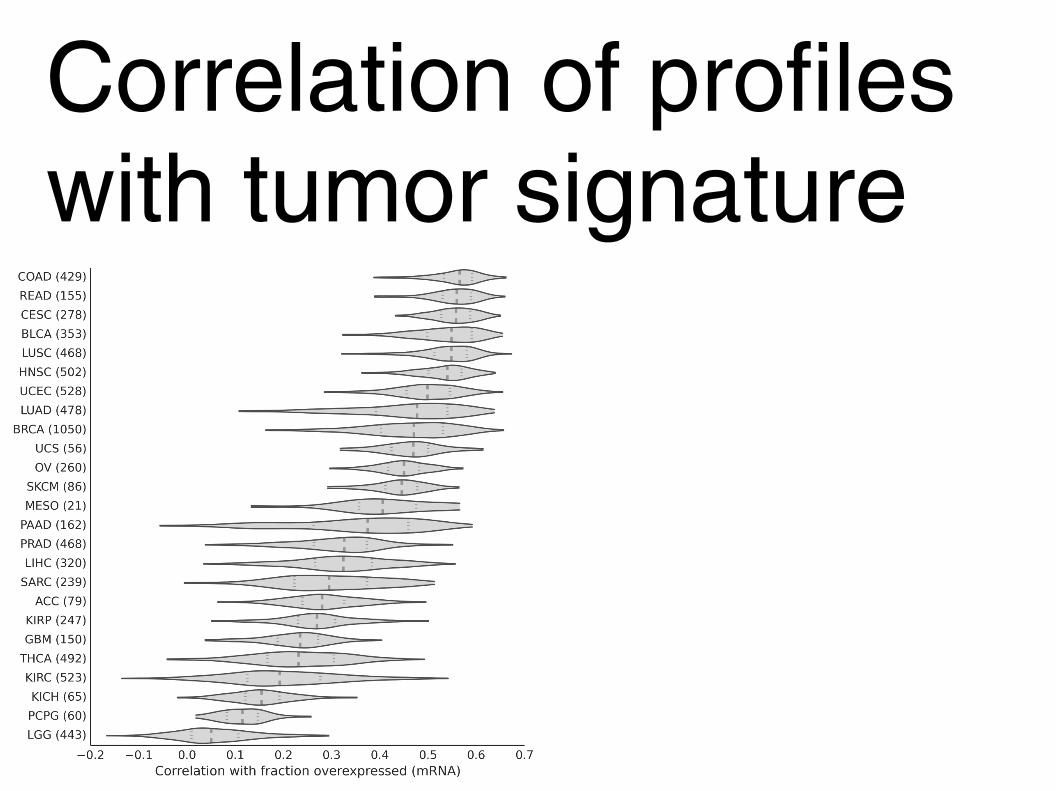
Correlation of profiles with tumor signature
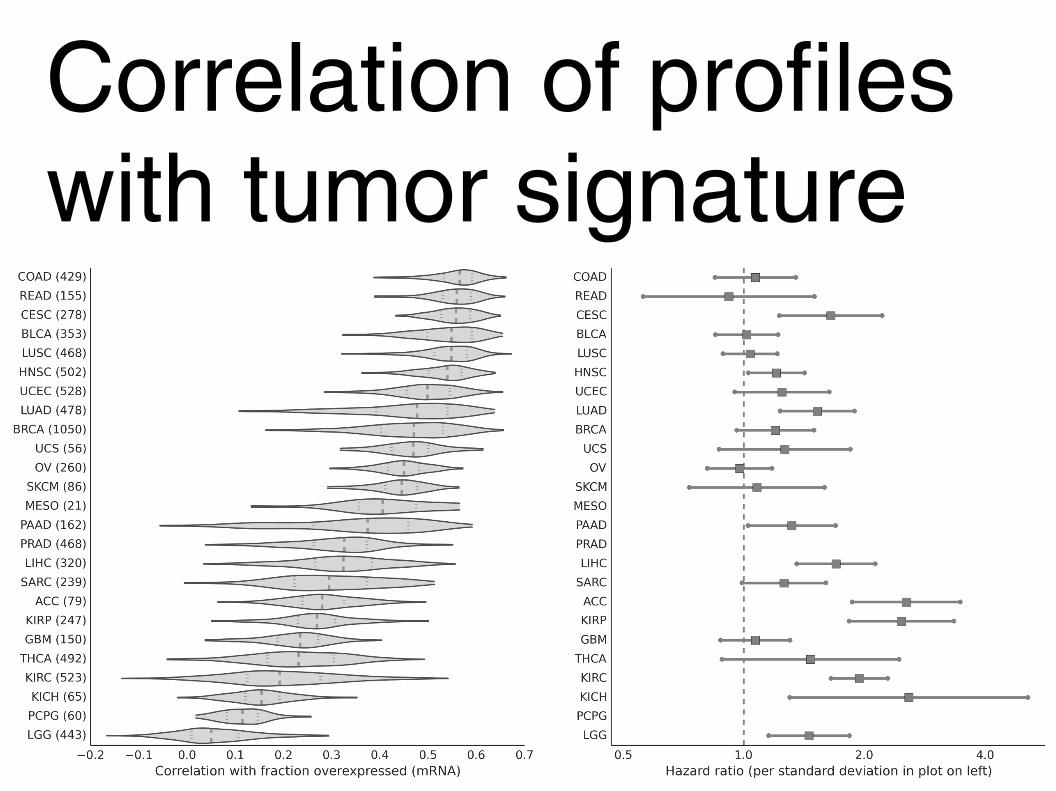
Correlation of profiles with tumor signature

Correlation of profiles with tumor signature

What differentiates cancers?
What do all cancers have in common?
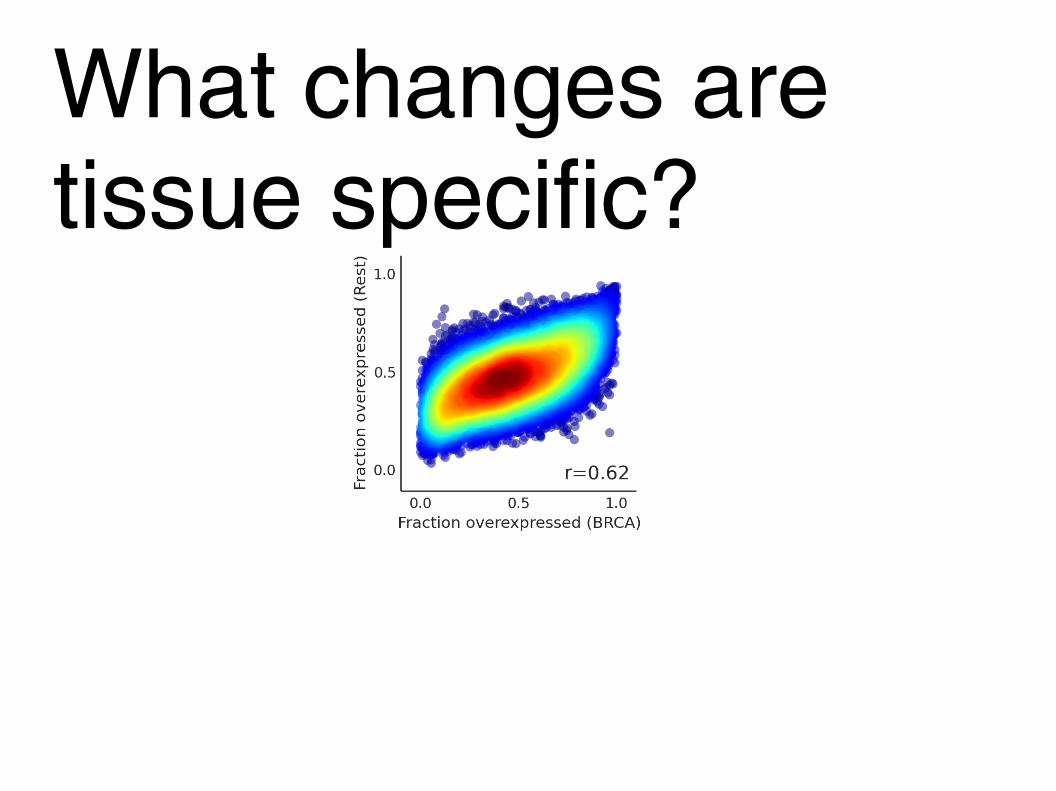
What changes are tissue specific?
Germline MutationsSomatic Mutations
MET is up-regulated in 8% of breast cancers and 75% of other tumors.

What changes are tissue specific?
Germline MutationsSomatic Mutations
MET is up-regulated in 8% of breast cancers and 75% of other tumors.

What changes are tissue specific?
Germline MutationsSomatic Mutations
MET is up-regulated in 8% of breast cancers and 75% of other tumors.
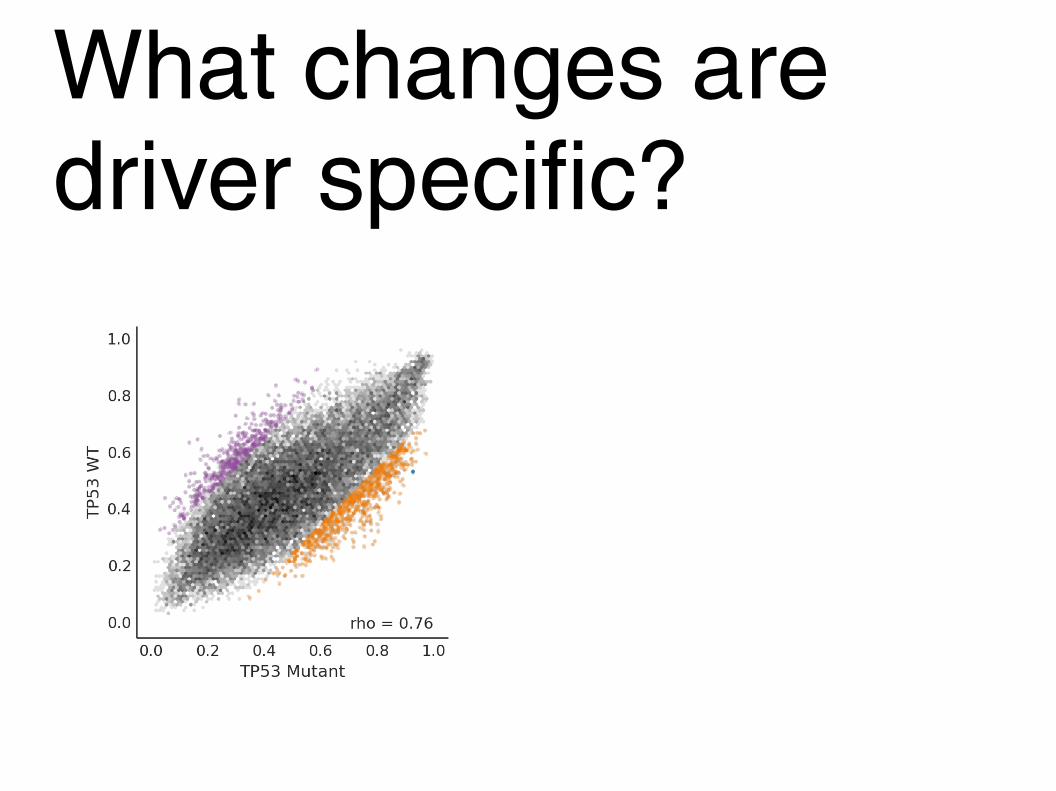
What changes are driver specific?

What changes are driver specific?

● We describe a simple analysis method for studying the tumor phenotype
● We define a list of differentially expressed genes, miRNA and methylation sites in a pancancer context
● We use these features to stratify patient outcomes and define tissue and driver specific changes in cancer
Summary

Thanks Ideker Lab


