Phthalic Anhydride
Production and Market
Overview
ITA Conference Prague, 2017
1
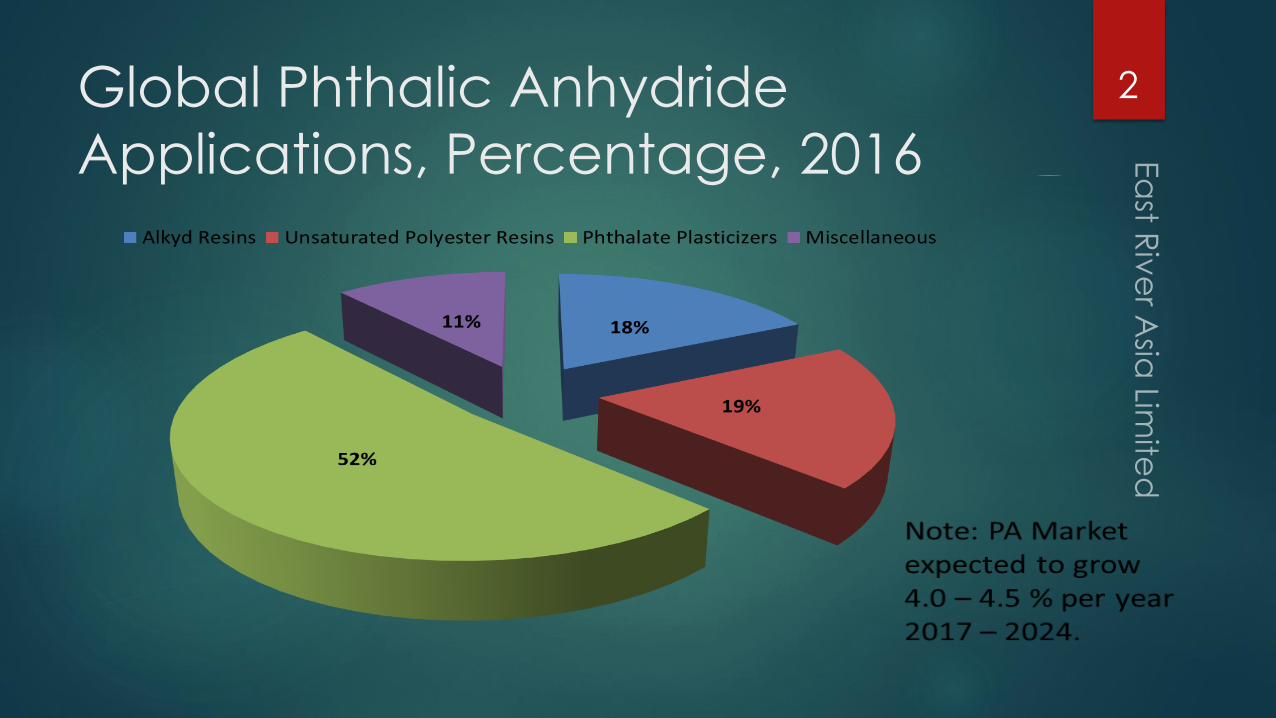
Global Phthalic Anhydride
Applications, Percentage, 2016
2
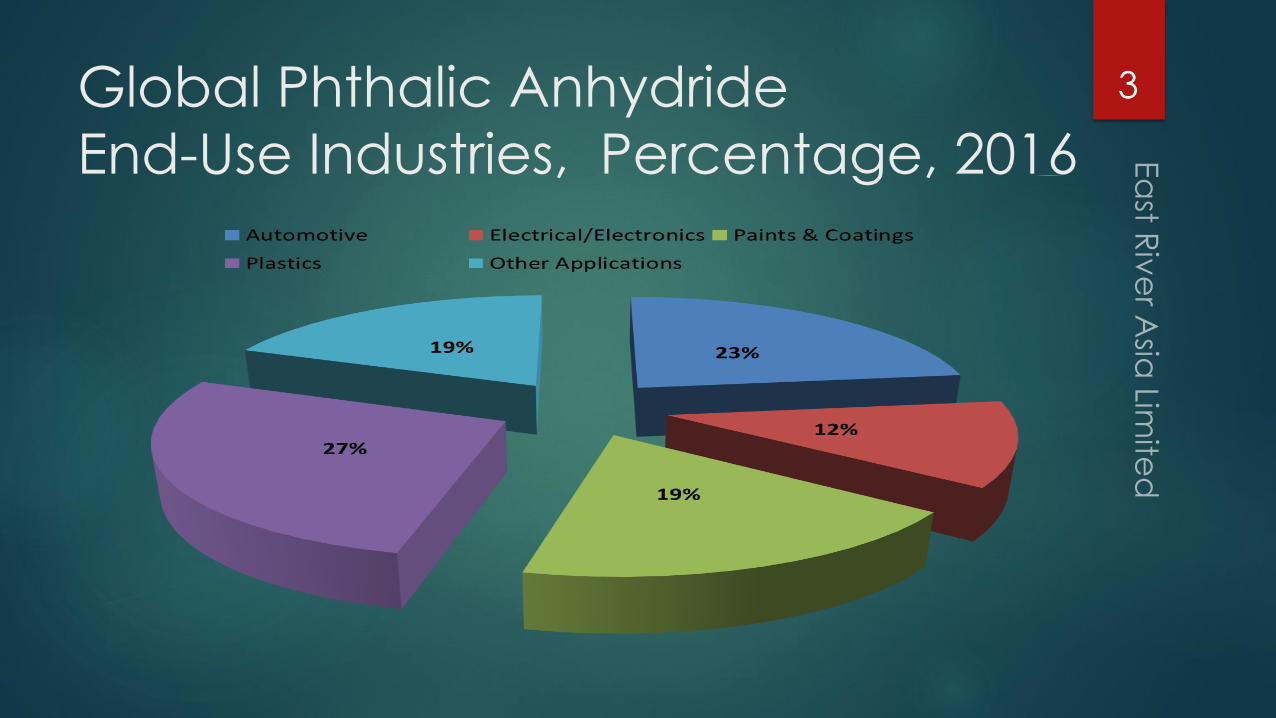
Global Phthalic Anhydride
End-Use Industries, Percentage, 2016
3
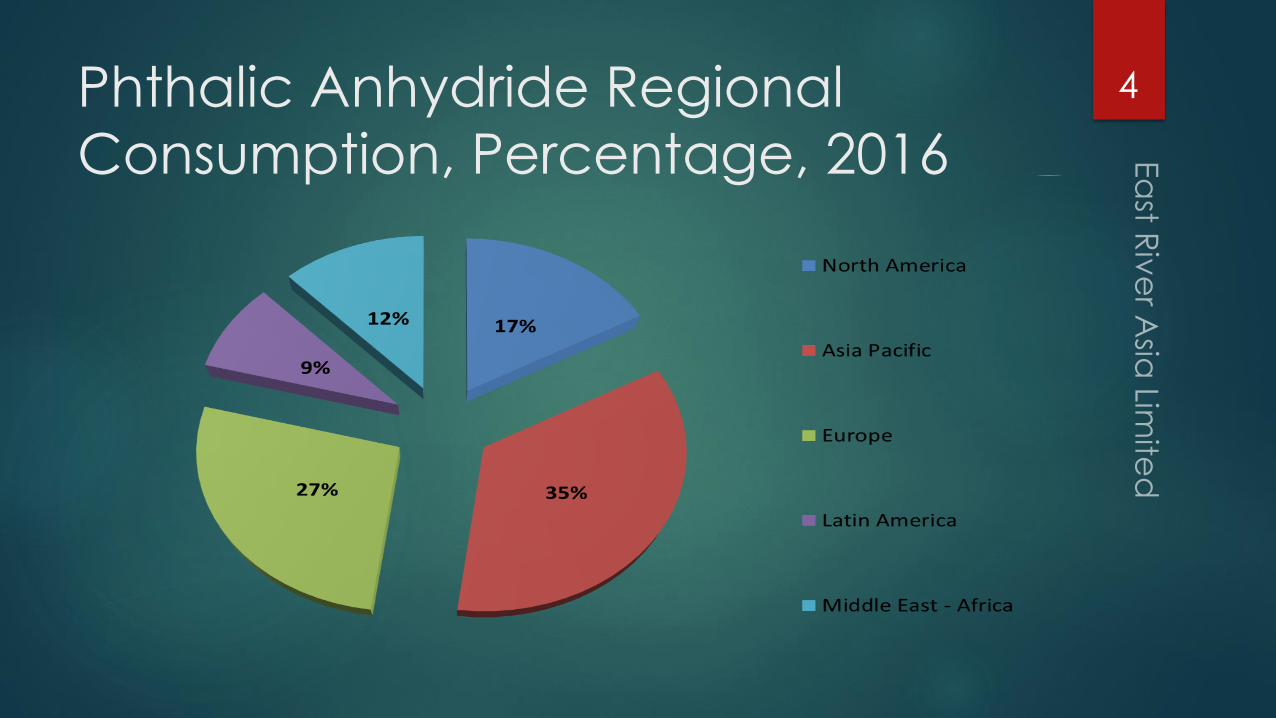
Phthalic Anhydride Regional
Consumption, Percentage, 2016
4
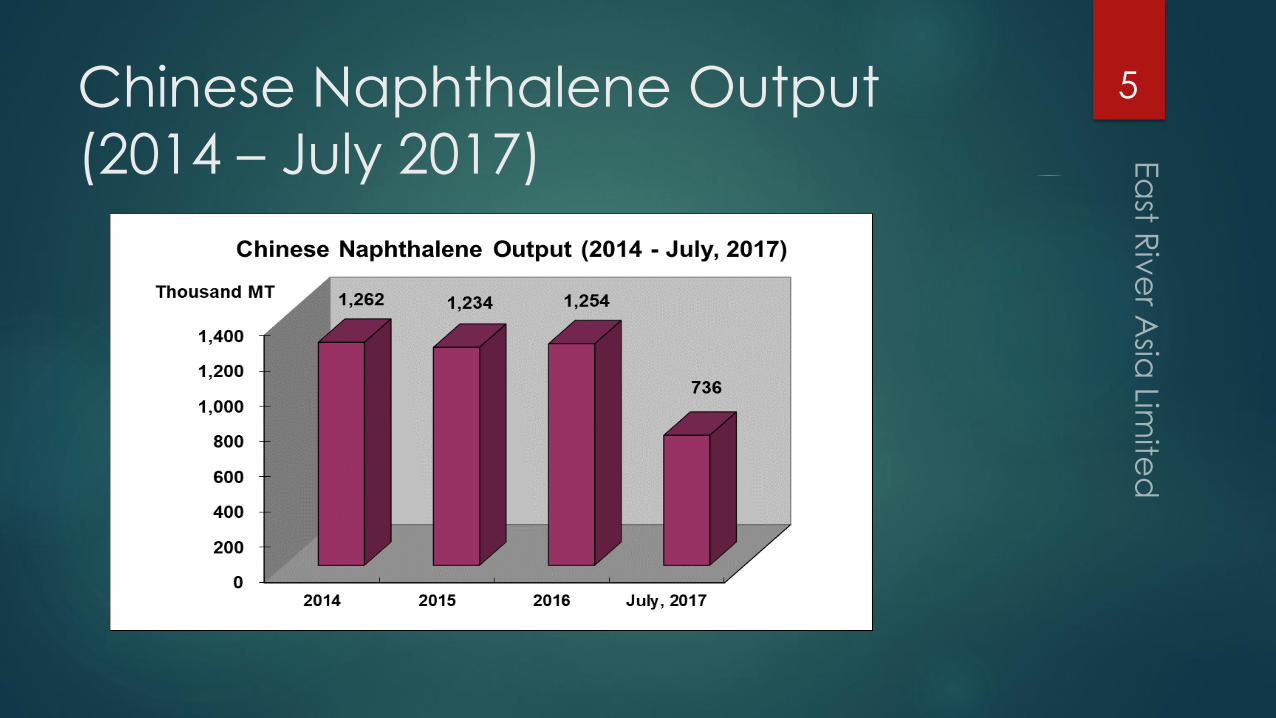
Chinese Naphthalene Output
(2014 – July 2017)
5
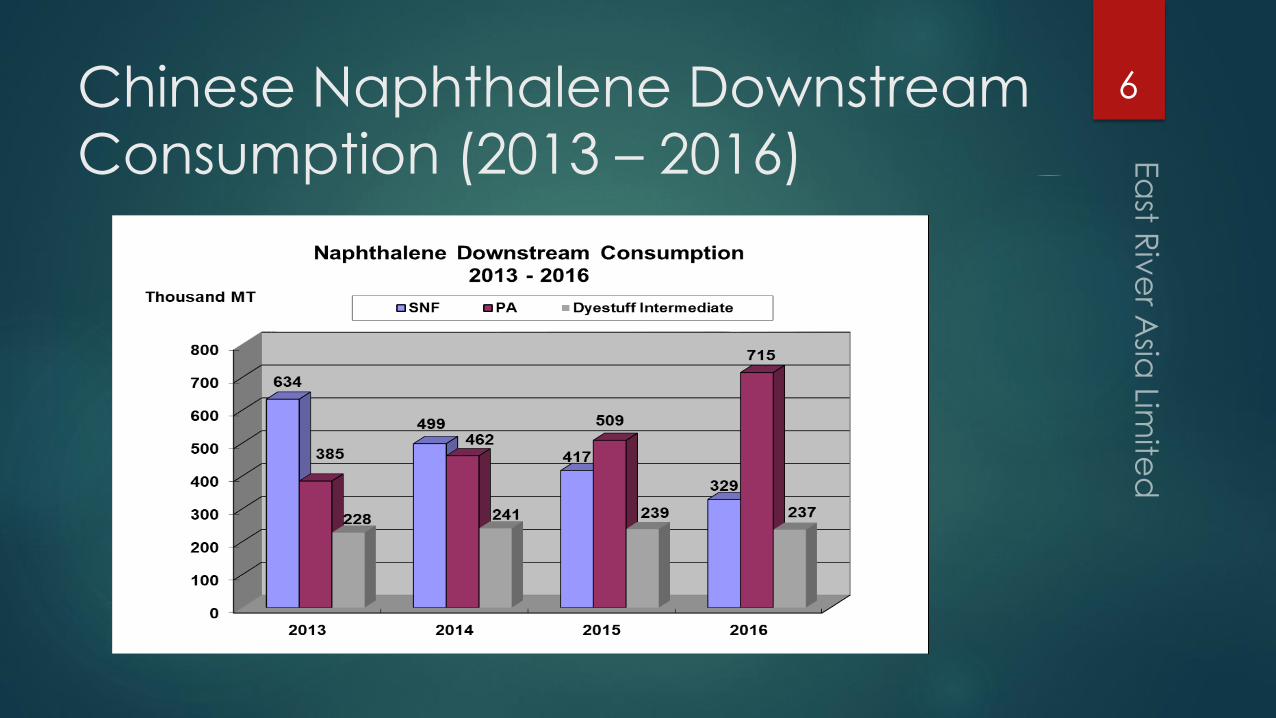
Chinese Naphthalene Downstream
Consumption (2013 – 2016)
6
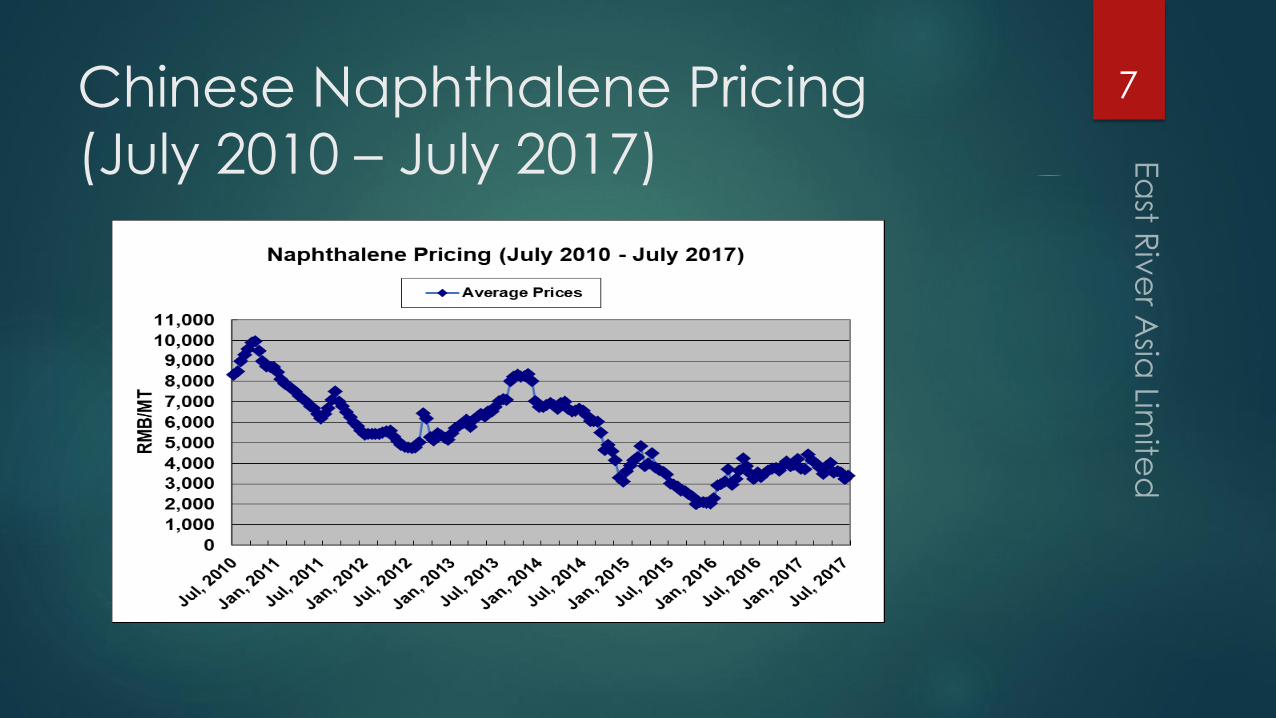
Chinese Naphthalene Pricing
(July 2010 – July 2017)
7
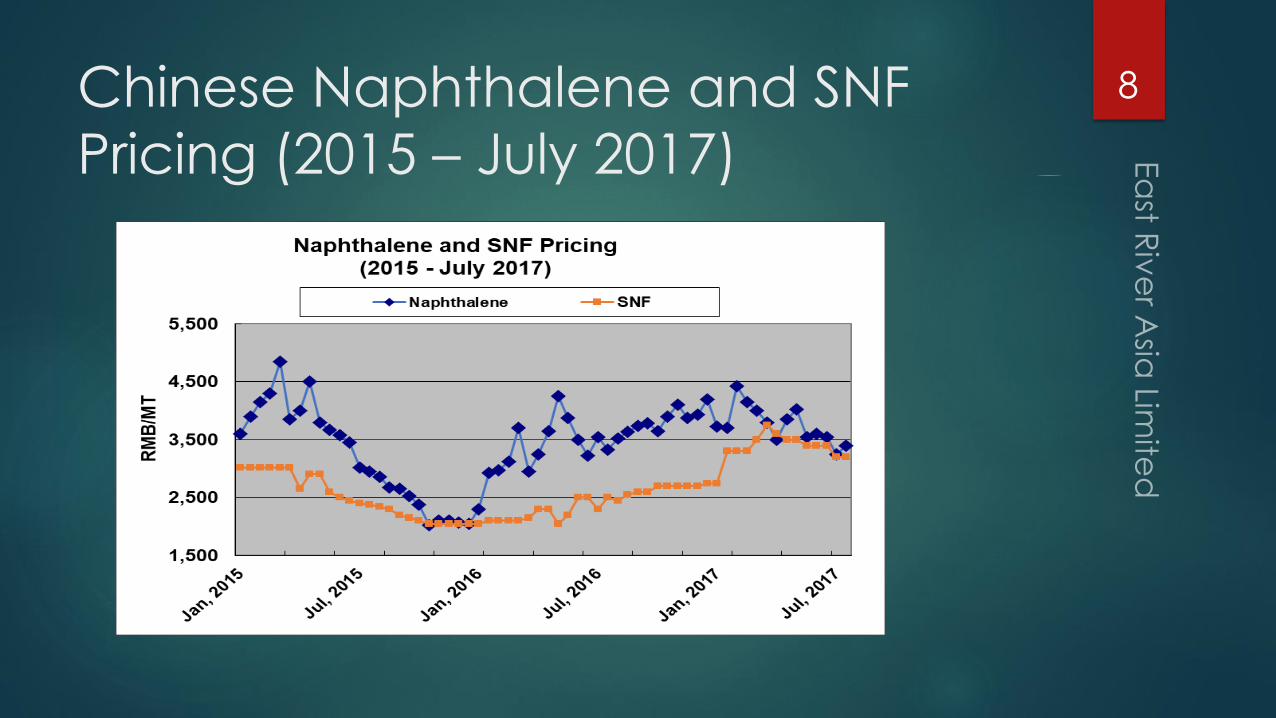
Chinese Naphthalene and SNF
Pricing (2015 – July 2017)
8
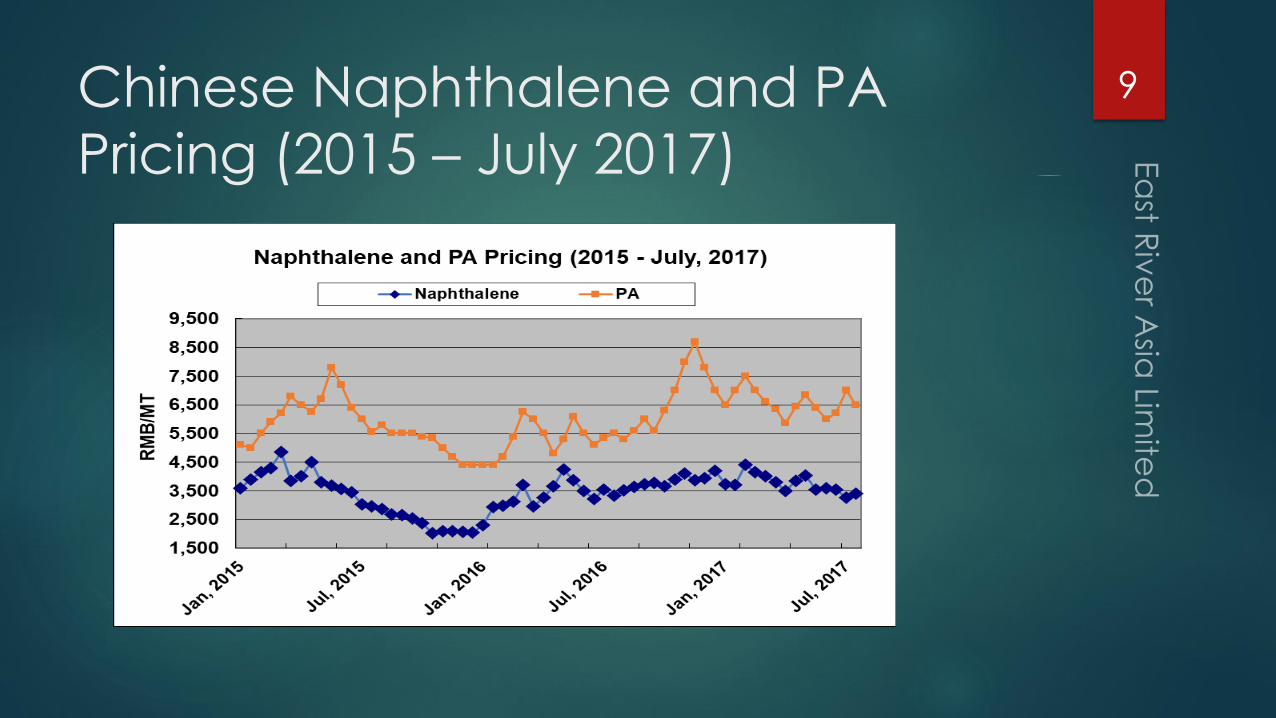
Chinese Naphthalene and PA
Pricing (2015 – July 2017)
9
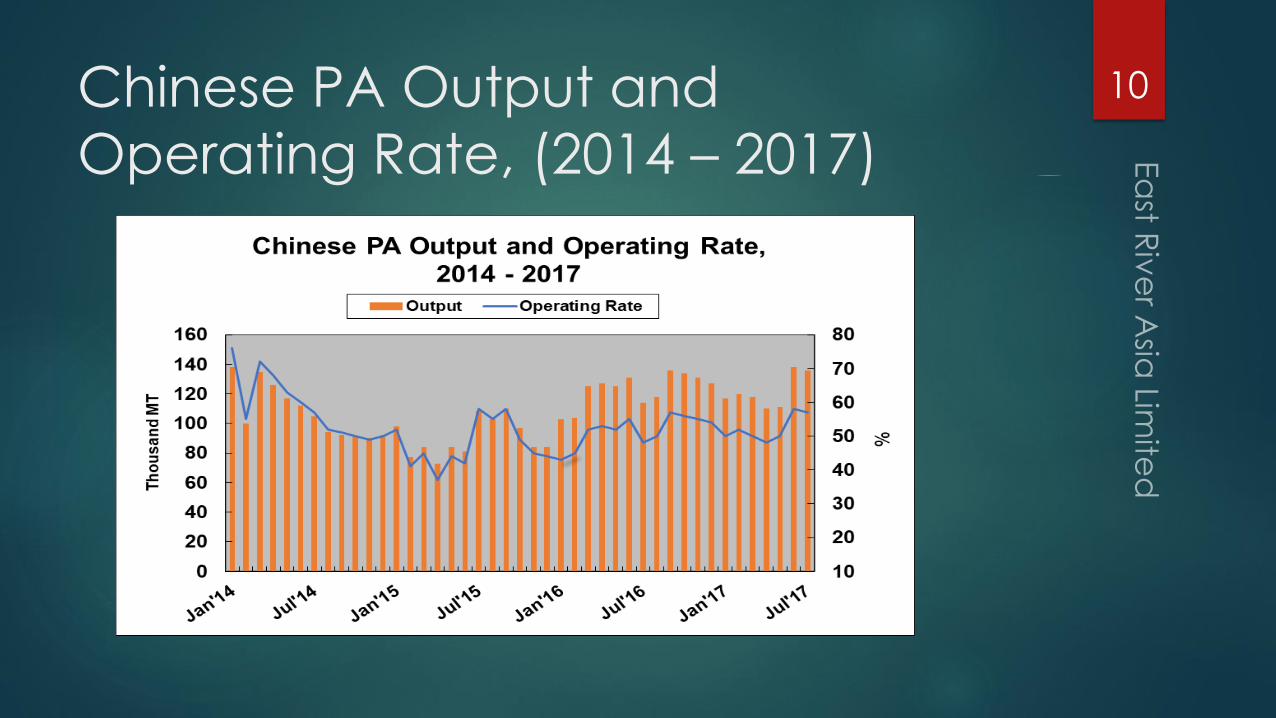
Chinese PA Output and
Operating Rate, (2014 – 2017)
10
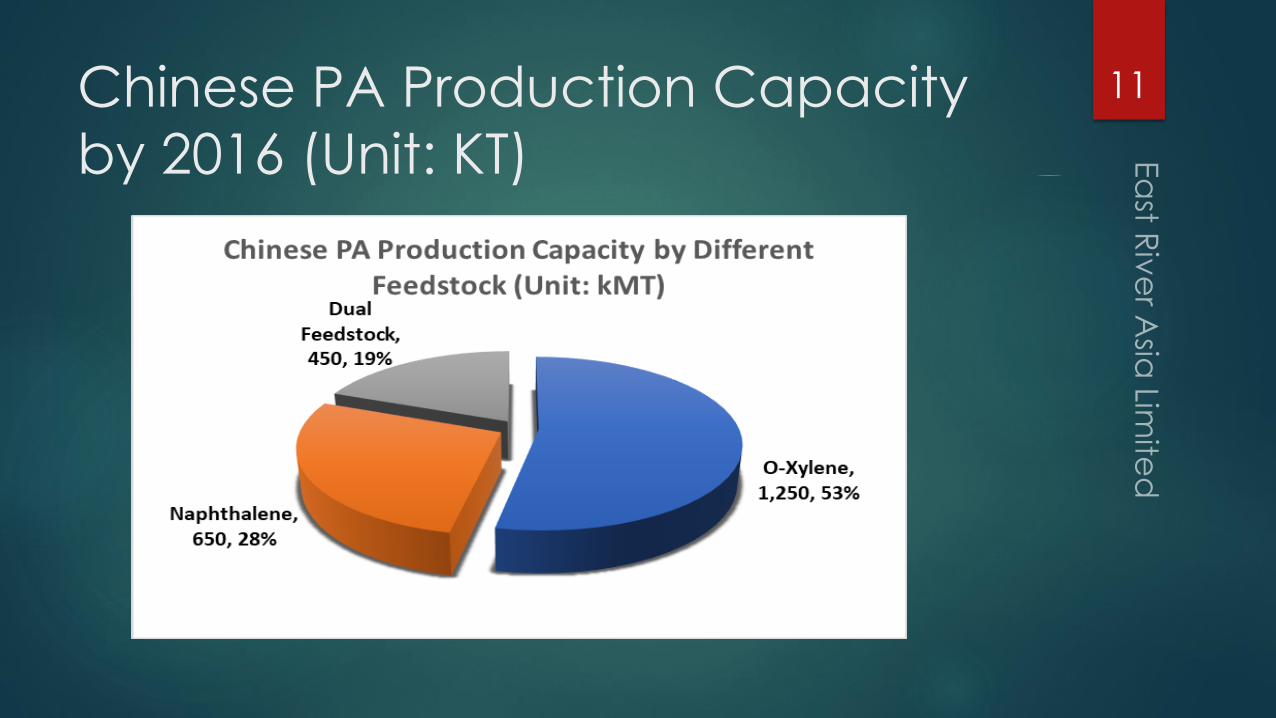
Chinese PA Production Capacity
by 2016 (Unit: KT)
11

Naphthalene-based PA
New Capacity
Region Manufacturers Name Capacity Note
Liaoning Panjin Ruide Chemical 100 By end of 2017
Hebei Tangshan Risun Chemical 40 By middle of 2018
Hebei Tangshan Baotei Chemical 40 Modified from Maleic Anhydride Production
Hebei Handan Xinbao Coal Chemical 40 By beginning of 2018
Shanxi Shanxi Sanwei Haoxin 40 Modified from Maleic Anhydride Production
Shandong Shandong Hongxin Chemical 40 Modified from Maleic Anhydride Production
Shandong Weifang Yuanli Chemical 40 Waiting for Operating
Henan Henan Qirui biotechnology 40 By end of 2017
Zhejiang Yixing Sanmu Group 20 Modified from Ortho Xylene Processing
Anhui Tongling Chemical Group 20 Modified from Ortho Xylene Processing
Total 420
12
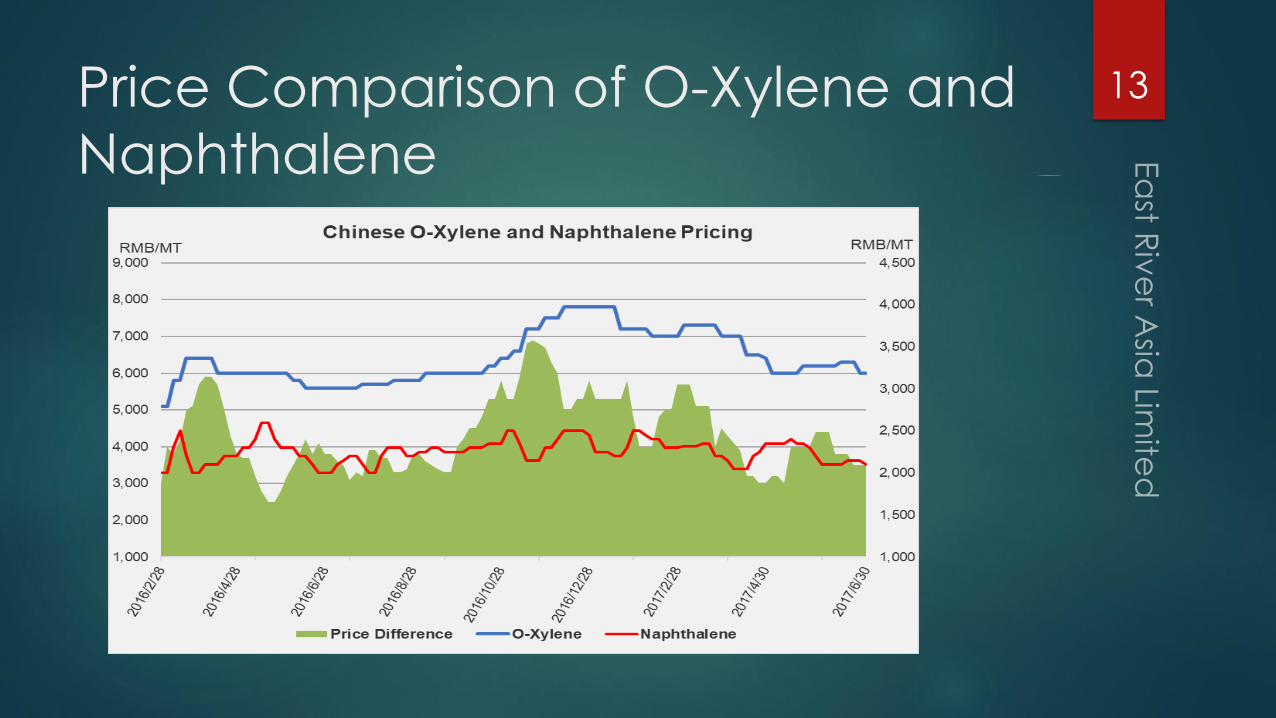
Price Comparison of O-Xylene and
Naphthalene
13
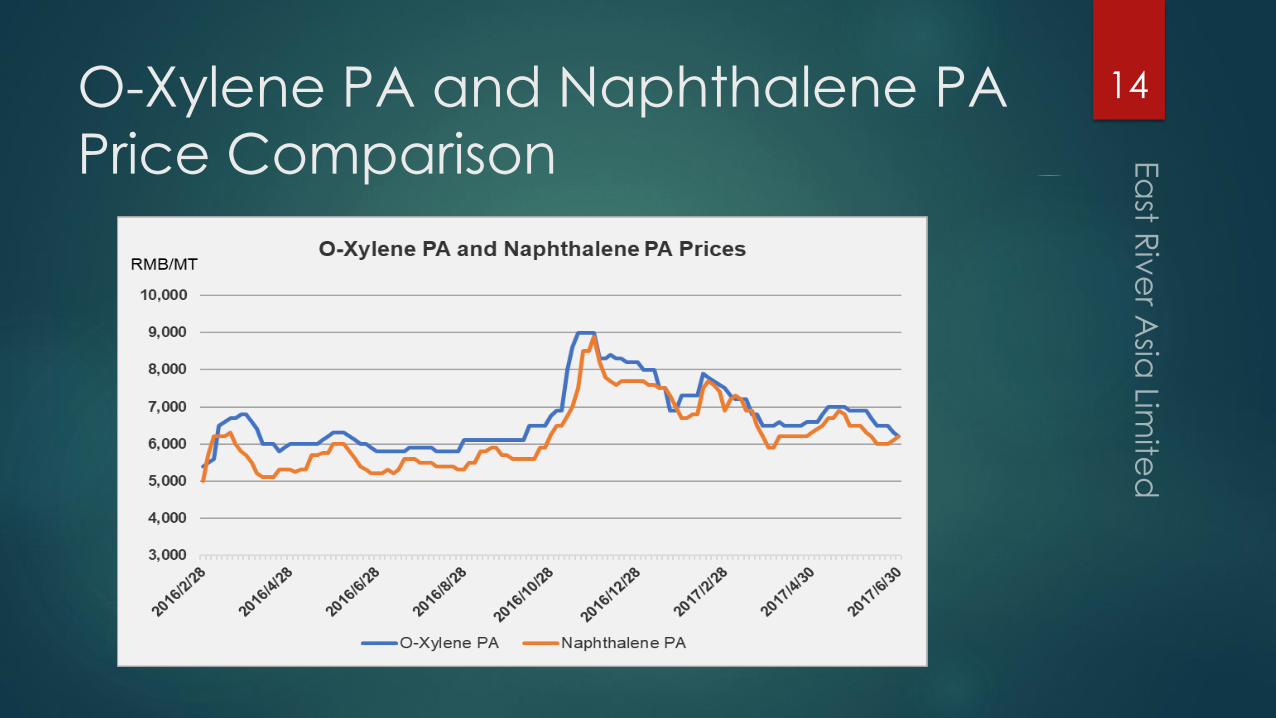
O-Xylene PA and Naphthalene PA
Price Comparison
14

Chinese PA Customs Data
(2011 – 2017)
15

Chinese PA Export (2011 – 2017) 16
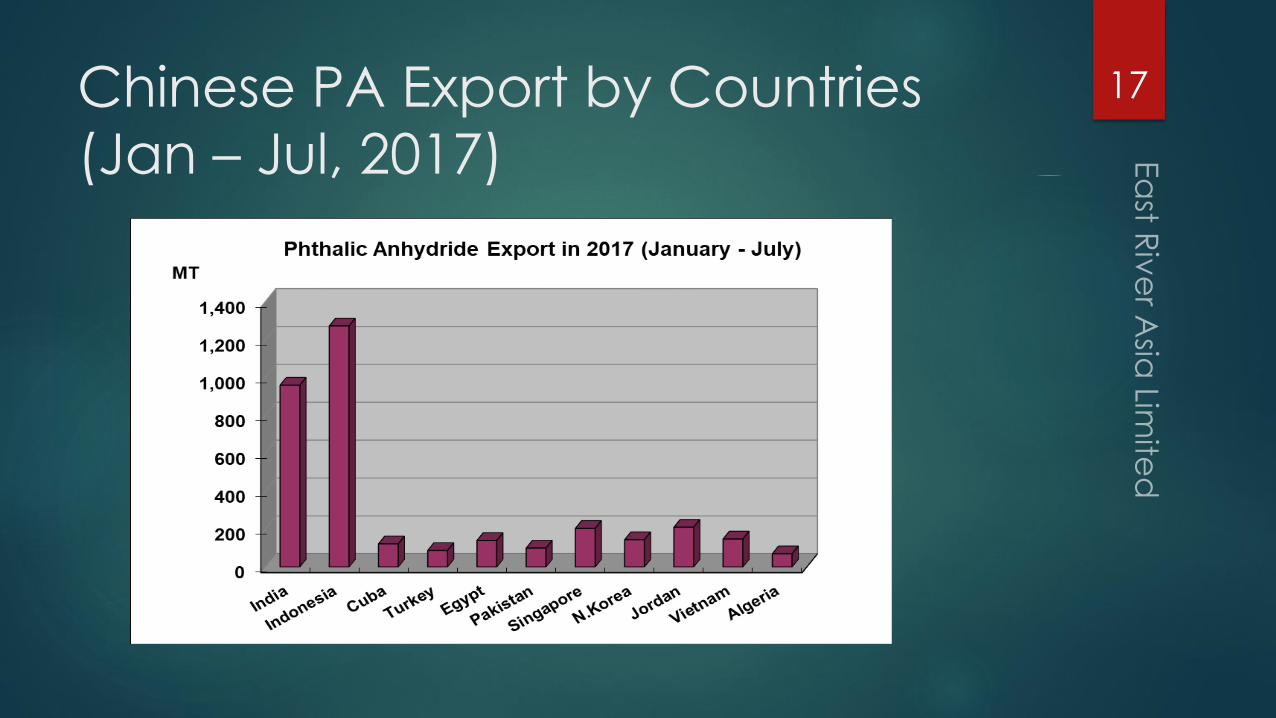
Chinese PA Export by Countries
(Jan – Jul, 2017)
17
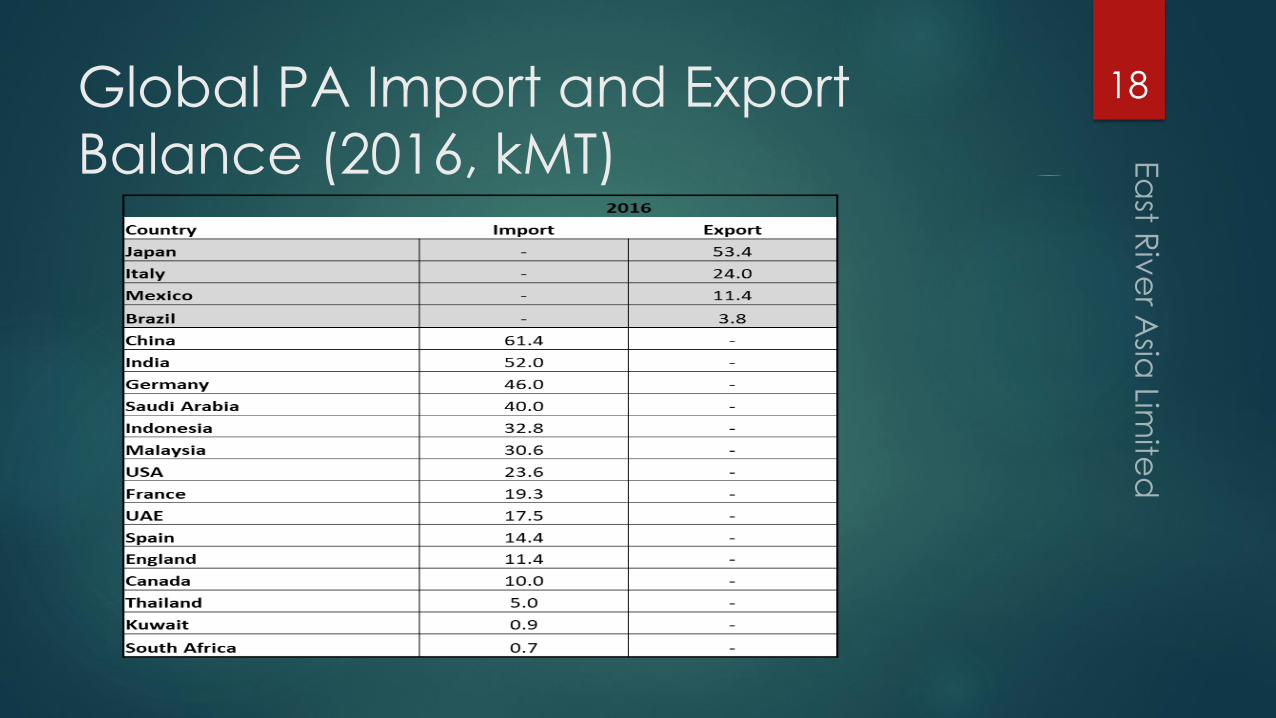
Global PA Import and Export
Balance (2016, kMT)
18
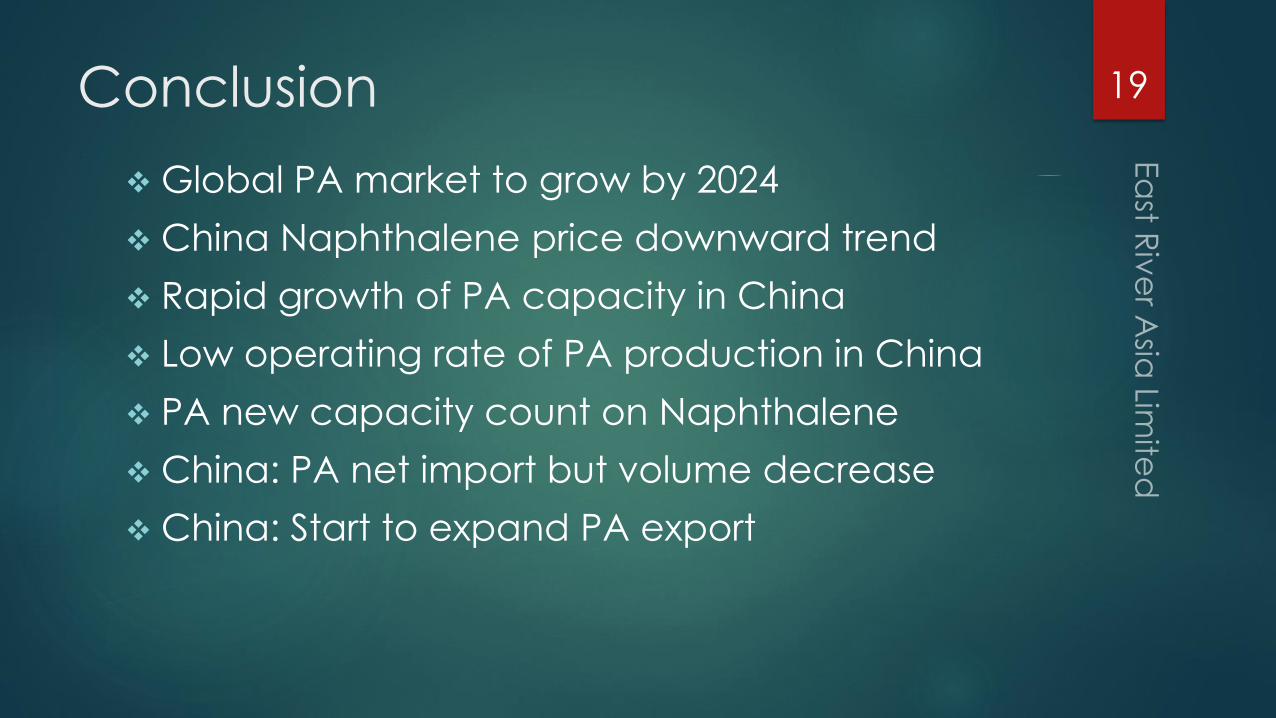
Conclusion
❖ Global PA market to grow by 2024
❖ China Naphthalene price downward trend
❖ Rapid growth of PA capacity in China
❖ Low operating rate of PA production in China
❖ PA new capacity count on Naphthalene
❖ China: PA net import but volume decrease
❖ China: Start to expand PA export
19

20

Thank you for your attention!
21


