Dawn Wright and Emily LarkinDavey Jones Locker Lab
Department of Geosciences
Oregon State University, USA
GIS Benthic Terrain Workshop
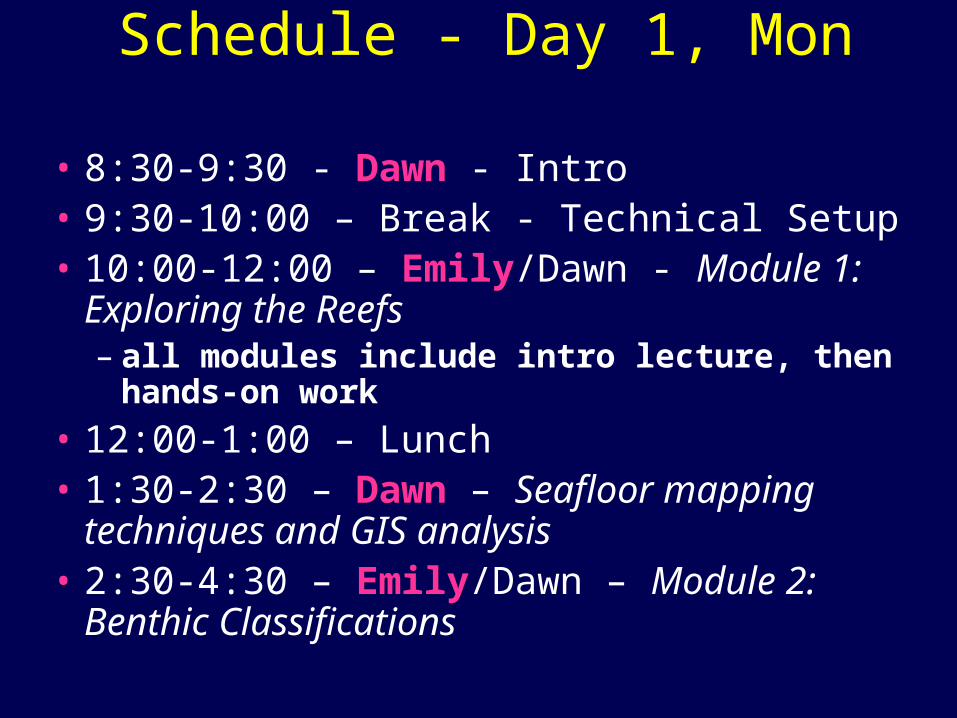
Schedule - Day 1, Mon
• 8:30-9:30 - Dawn - Intro • 9:30-10:00 – Break - Technical Setup• 10:00-12:00 – Emily/Dawn - Module 1:
Exploring the Reefs– all modules include intro lecture, then
hands-on work
• 12:00-1:00 – Lunch• 1:30-2:30 – Dawn – Seafloor mapping
techniques and GIS analysis• 2:30-4:30 – Emily/Dawn – Module 2:
Benthic Classifications
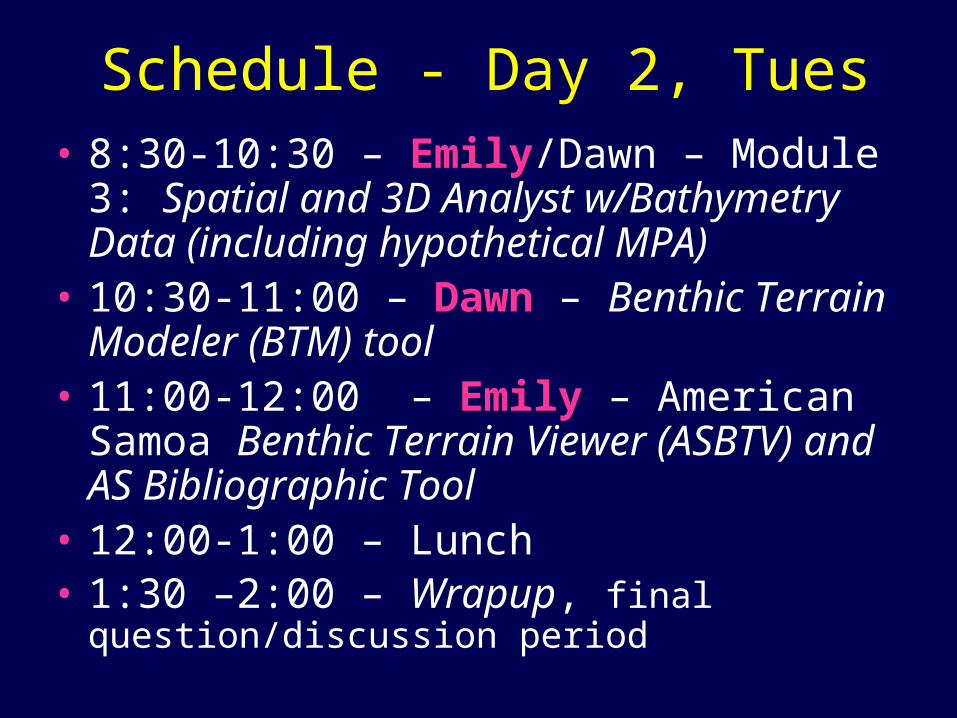
Schedule - Day 2, Tues• 8:30-10:30 – Emily/Dawn – Module 3:
Spatial and 3D Analyst w/Bathymetry Data (including hypothetical MPA)
• 10:30-11:00 – Dawn – Benthic Terrain Modeler (BTM) tool
• 11:00-12:00 – Emily – American Samoa Benthic Terrain Viewer (ASBTV) and AS Bibliographic Tool
• 12:00-1:00 – Lunch• 1:30 –2:00 – Wrapup, final question/discussion
period
Tuesday, 2:30
• American Samoa GIS User Group Meeting
• DOC Conference Room, Pago Pago
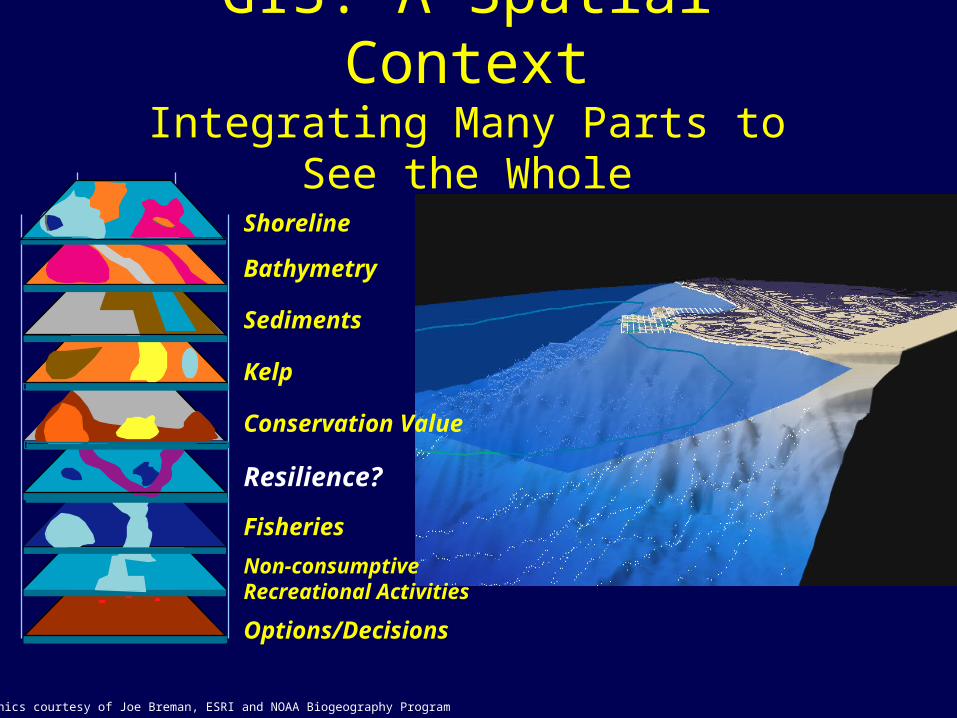
Graphics courtesy of Joe Breman, ESRI and NOAA Biogeography Program
Fisheries
Conservation Value
Kelp
Resilience?
Sediments
Bathymetry
Shoreline
Options/Decisions
Non-consumptiveRecreational Activities
GIS: A Spatial ContextIntegrating Many Parts to See the
Whole
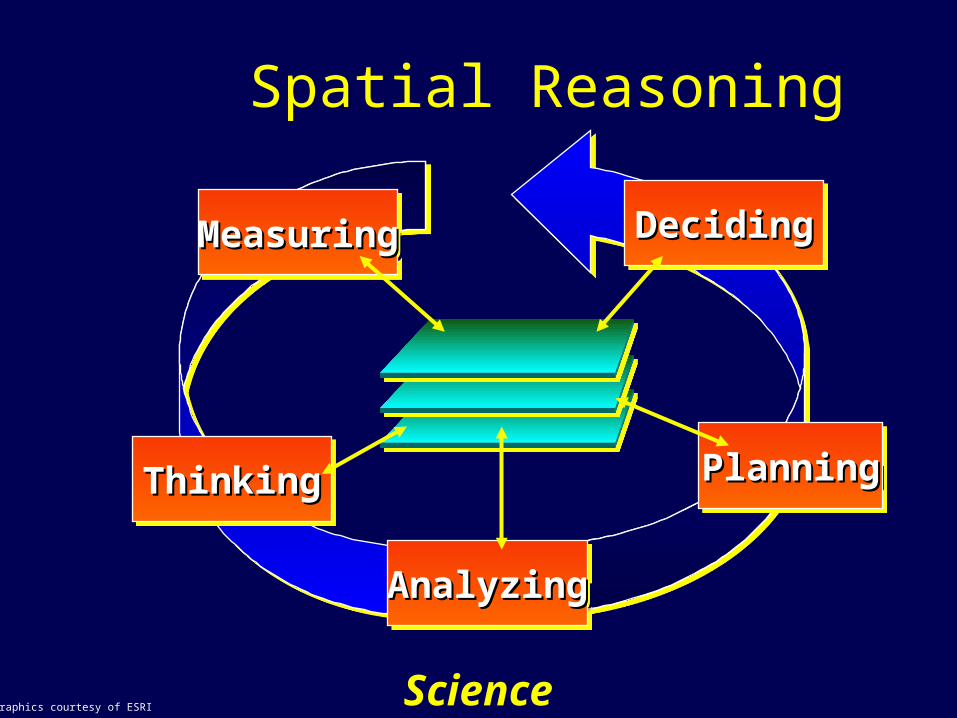
Spatial Reasoning
PlanningPlanningPlanningPlanning
AnalyzingAnalyzingAnalyzingAnalyzing
ThinkingThinkingThinkingThinking
MeasuringMeasuringMeasuringMeasuring DecidingDecidingDecidingDeciding
ScienceGraphics courtesy of ESRI
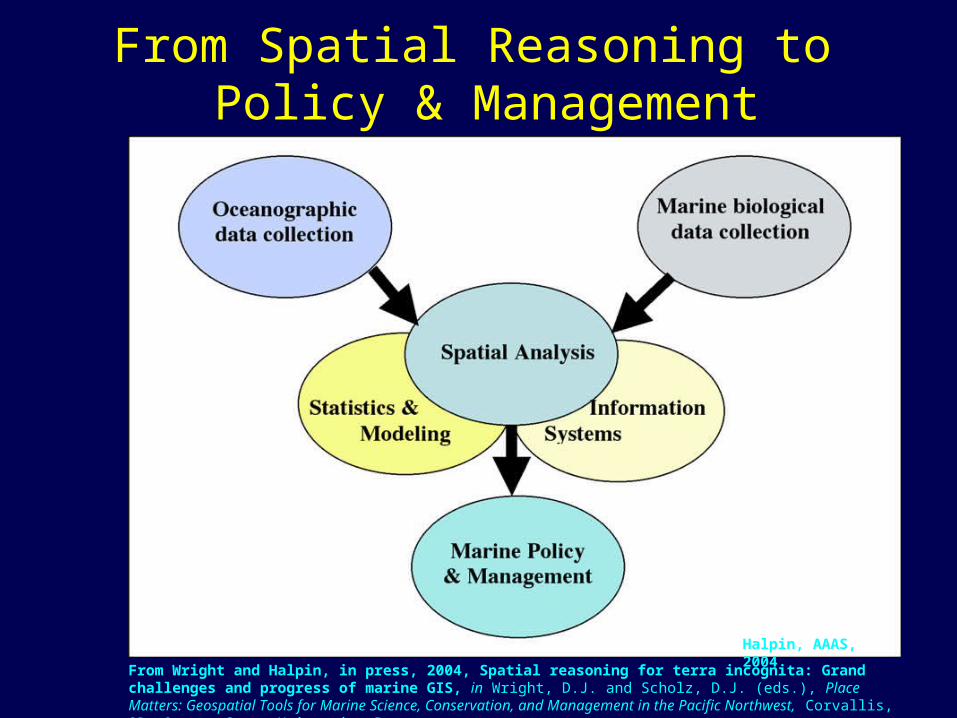
From Spatial Reasoning to Policy & Management
From Wright and Halpin, in press, 2004, Spatial reasoning for terra incognita: Grand challenges and progress of marine GIS, in Wright, D.J. and Scholz, D.J. (eds.), Place Matters: Geospatial Tools for Marine Science, Conservation, and Management in the Pacific Northwest, Corvallis, OR: Oregon State University Press.
Halpin, AAAS, 2004
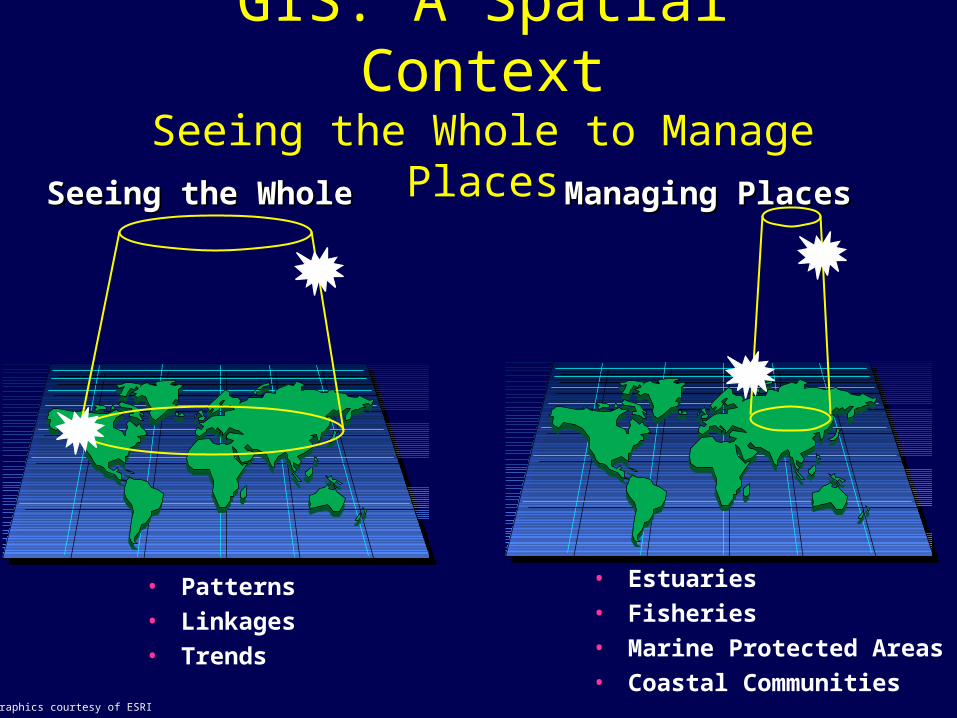
GIS: A Spatial ContextSeeing the Whole to Manage
PlacesSeeing the WholeSeeing the Whole Managing PlacesManaging Places
• Estuaries
• Fisheries
• Marine Protected Areas
• Coastal Communities
• Patterns
• Linkages
• Trends
Graphics courtesy of ESRI
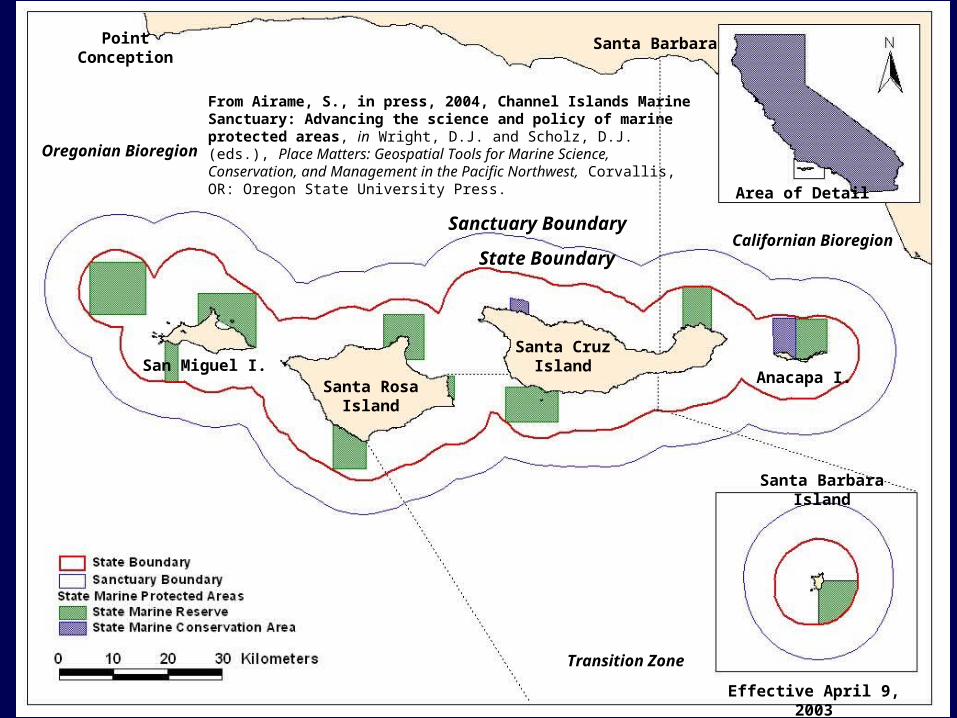
Santa RosaIsland
Santa CruzIsland
Anacapa I.
State Boundary
Sanctuary Boundary
Oregonian Bioregion
Transition Zone
Californian Bioregion
Santa Barbara Island
PointConception
Santa Barbara
Area of Detail
Effective April 9, 2003
San Miguel I.
From Airame, S., in press, 2004, Channel Islands Marine Sanctuary: Advancing the science and policy of marine protected areas, in Wright, D.J. and Scholz, D.J. (eds.), Place Matters: Geospatial Tools for Marine Science, Conservation, and Management in the Pacific Northwest, Corvallis, OR: Oregon State University Press.
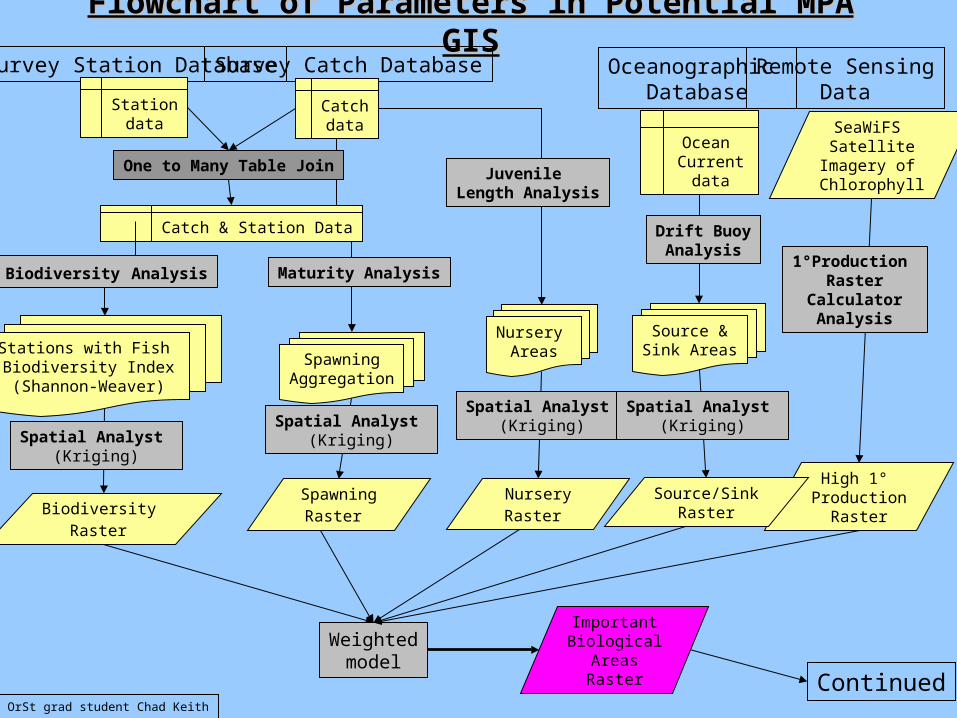
Flowchart of Parameters in Potential MPA Flowchart of Parameters in Potential MPA GISGIS
Survey Station Database Survey Catch Database
Weightedmodel
Stationdata
Catchdata
Spatial Analyst (Kriging)
Stations with Fish Biodiversity Index(Shannon-Weaver)
Maturity Analysis
Juvenile Length Analysis
One to Many Table Join
Continued
SeaWiFS Satellite
Imagery of Chlorophyll
High 1° Production
Raster
1°Production Raster Calculator
Analysis
Remote SensingData
Catch & Station Data
Biodiversity Analysis
Biodiversity Raster
SpawningAggregation
Spatial Analyst (Kriging)
SpawningRaster
Nursery Areas
NurseryRaster
Spatial Analyst (Kriging)
Ocean Current
data
Oceanographic Database
Drift BuoyAnalysis
Source &Sink Areas
Source/SinkRaster
ImportantBiological
AreasRaster
Spatial Analyst (Kriging)
By OrSt grad student Chad Keith
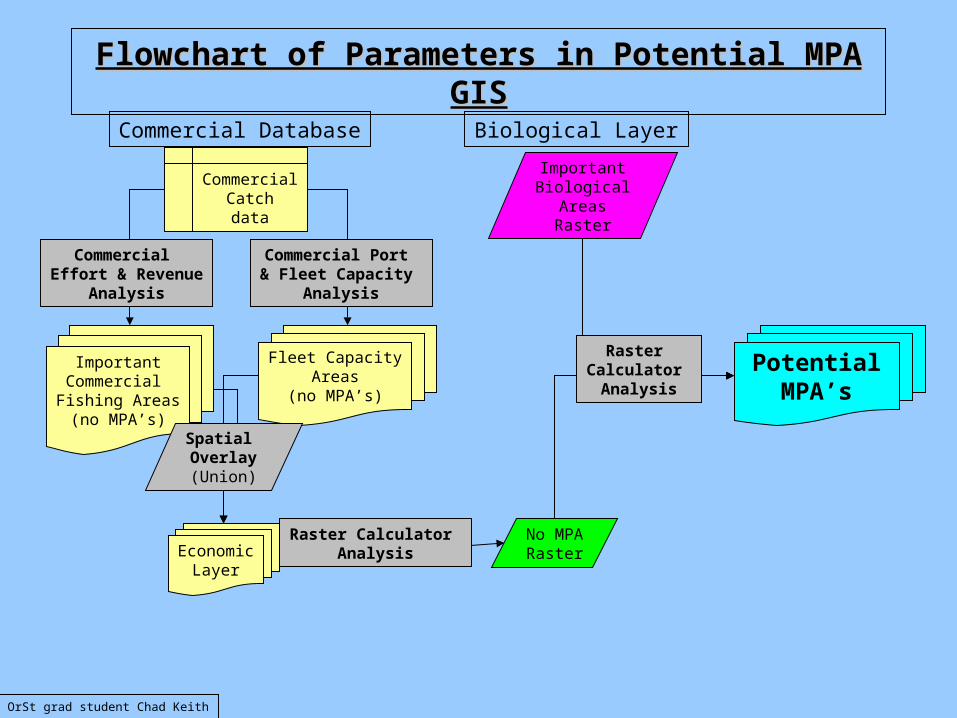
Flowchart of Parameters in Potential MPA Flowchart of Parameters in Potential MPA GISGIS
PotentialMPA’s
CommercialCatchdata
Commercial Database
Commercial Effort & Revenue
Analysis
Commercial Port & Fleet Capacity
Analysis
Biological Layer
ImportantBiological
AreasRaster
Fleet CapacityAreas
(no MPA’s)
ImportantCommercial Fishing Areas(no MPA’s)
EconomicLayer
Spatial Overlay(Union)
No MPARaster
Raster Calculator Analysis
Raster Calculator
Analysis
By OrSt grad student Chad Keith
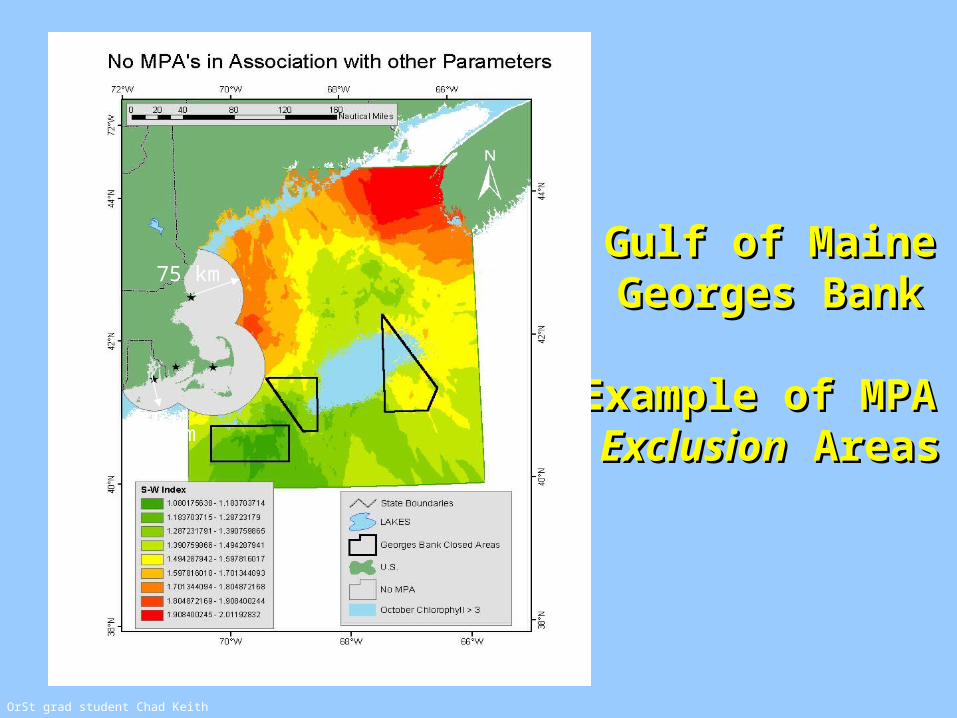
Gulf of MaineGulf of MaineGeorges BankGeorges Bank
Example of MPA Example of MPA ExclusionExclusion Areas Areas
75 km
50 km
By OrSt grad student Chad Keith
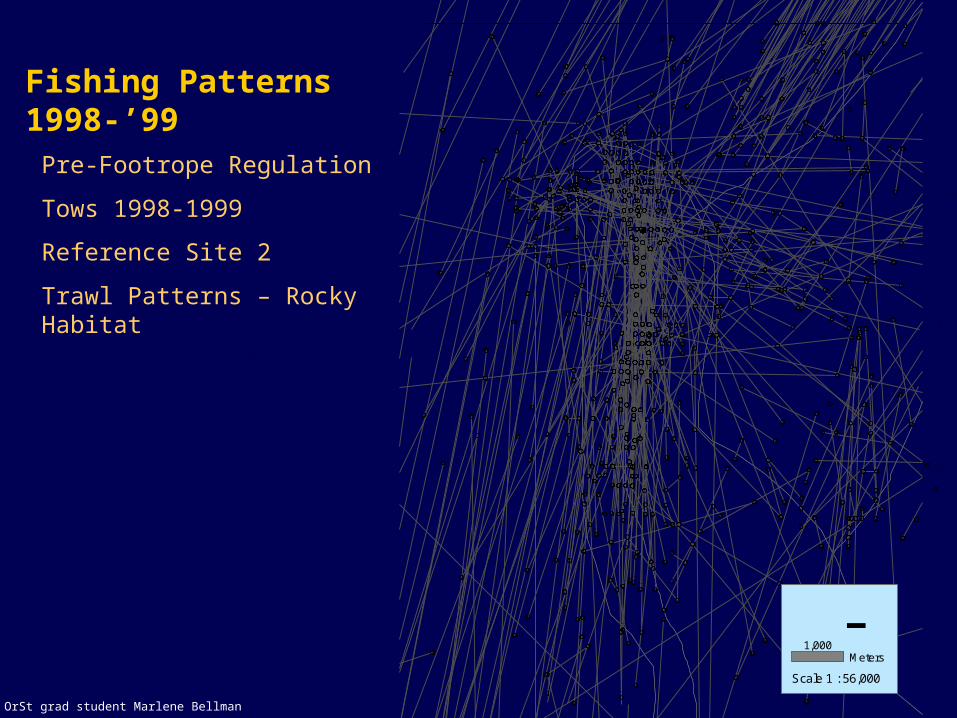
Pre-Footrope Regulation
Tows 1998-1999
Reference Site 2
Trawl Patterns – Rocky Habitat
-Scale 1 : 56,000
1,000Meters
By OrSt grad student Marlene Bellman
Fishing Patterns1998-’99
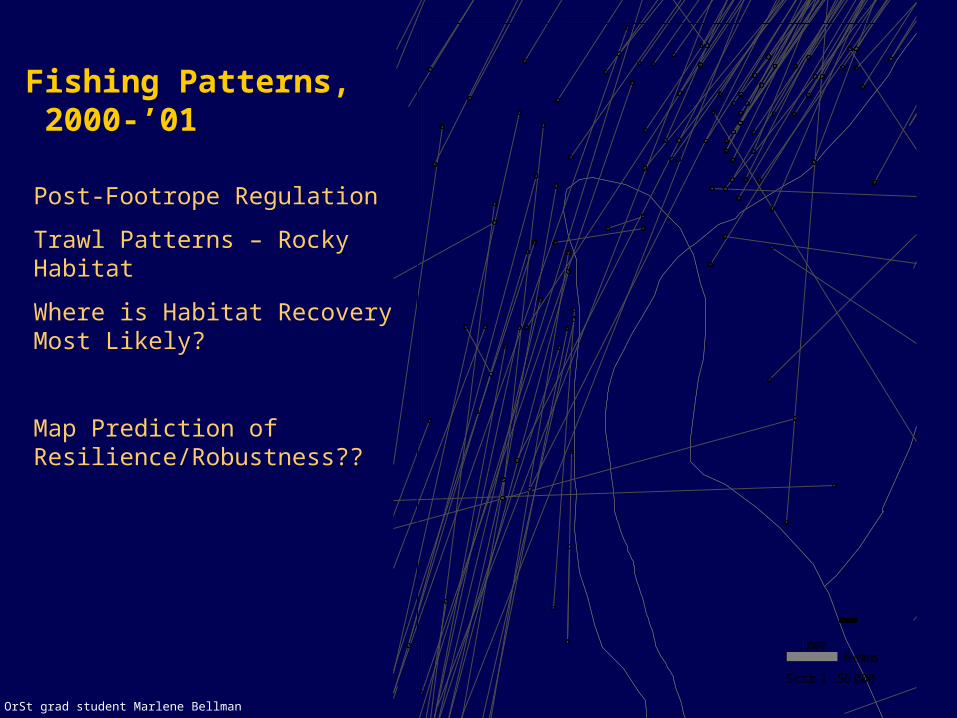
-Scale 1 : 56,000
1,000Meters
Post-Footrope Regulation
Trawl Patterns – Rocky Habitat
Where is Habitat Recovery Most Likely?
Map Prediction of Resilience/Robustness??
By OrSt grad student Marlene Bellman
Fishing Patterns, 2000-’01
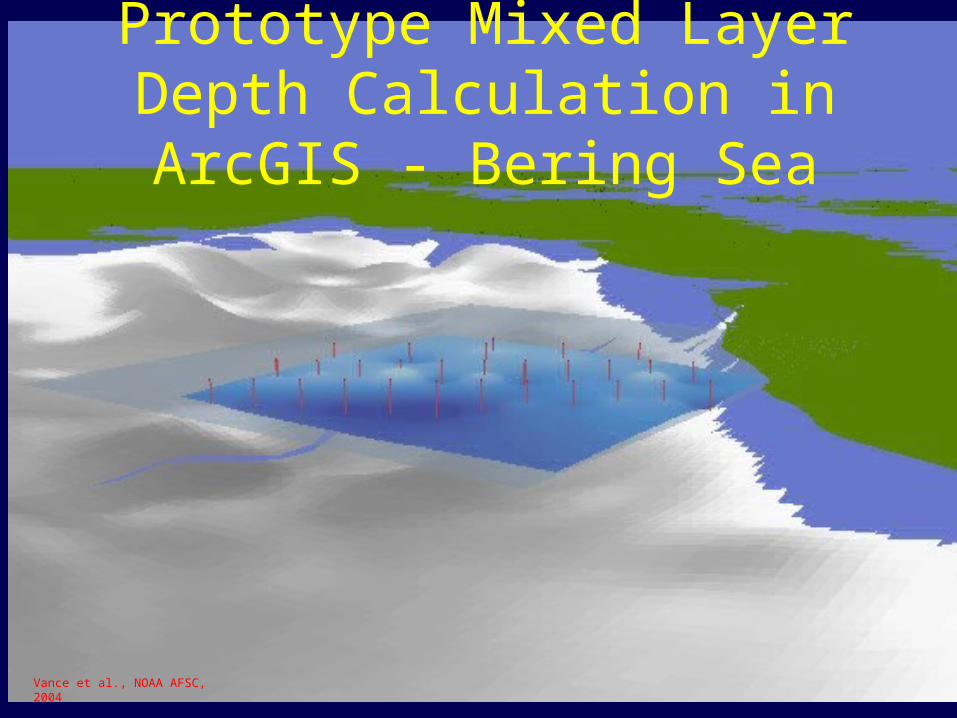
Prototype Mixed Layer Depth Calculation in ArcGIS
- Bering Sea
Vance et al., NOAA AFSC, 2004
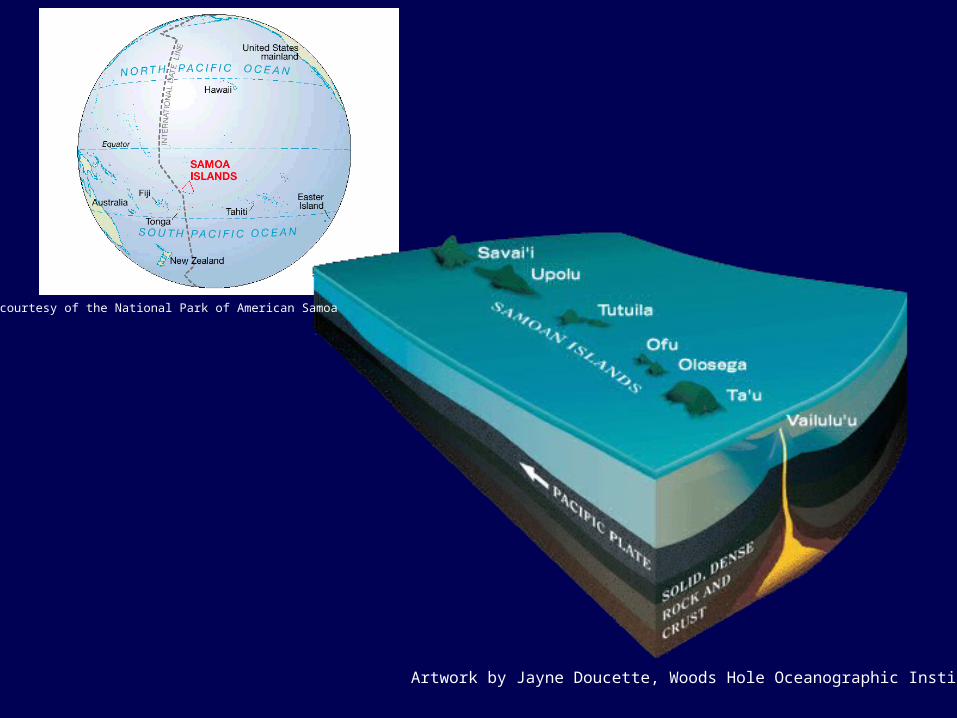
Artwork by Jayne Doucette, Woods Hole Oceanographic Institution
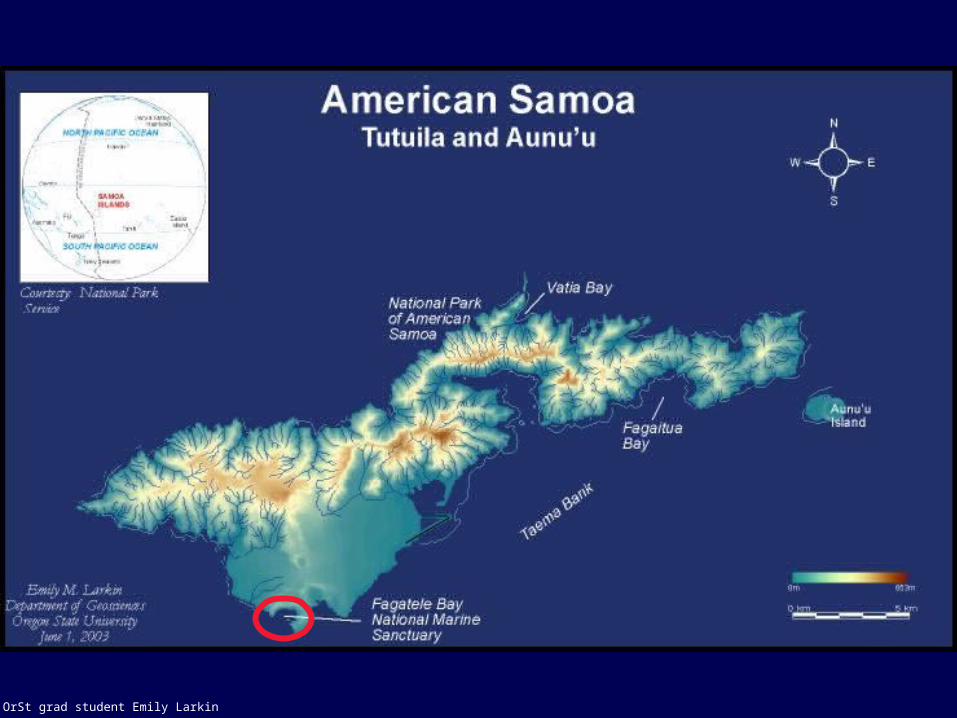
Map courtesy of the National Park of American Samoa
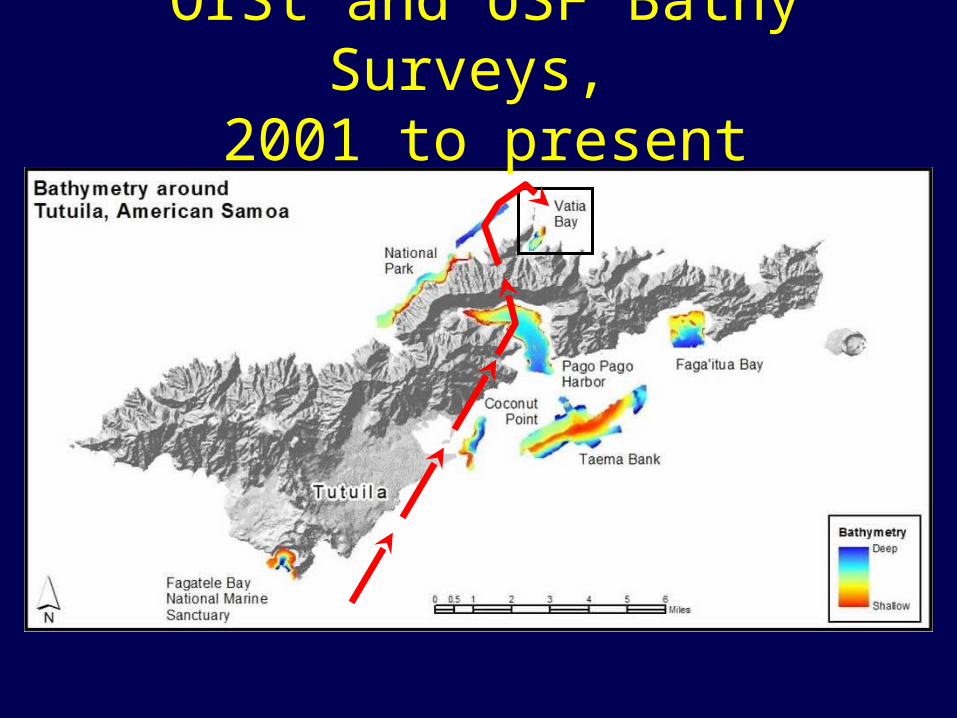
OrSt and USF Bathy Surveys,
2001 to present
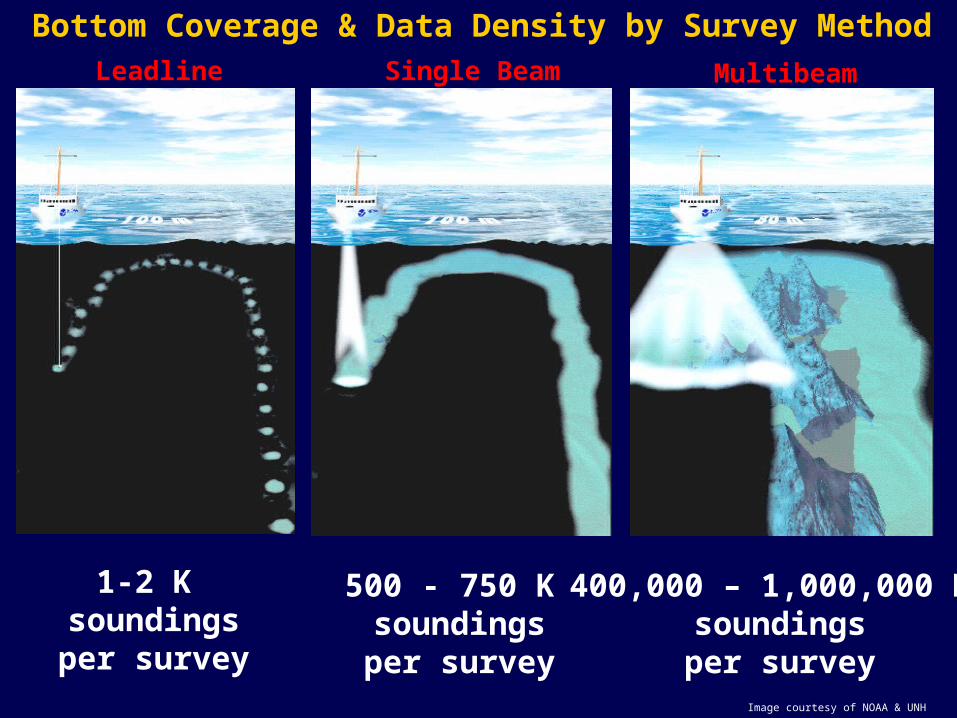
Single Beam Multibeam
1-2 K soundingsper survey
500 - 750 K soundingsper survey
400,000 – 1,000,000 K soundingsper survey
Image courtesy of NOAA & UNH
Bottom Coverage & Data Density by Survey MethodLeadline
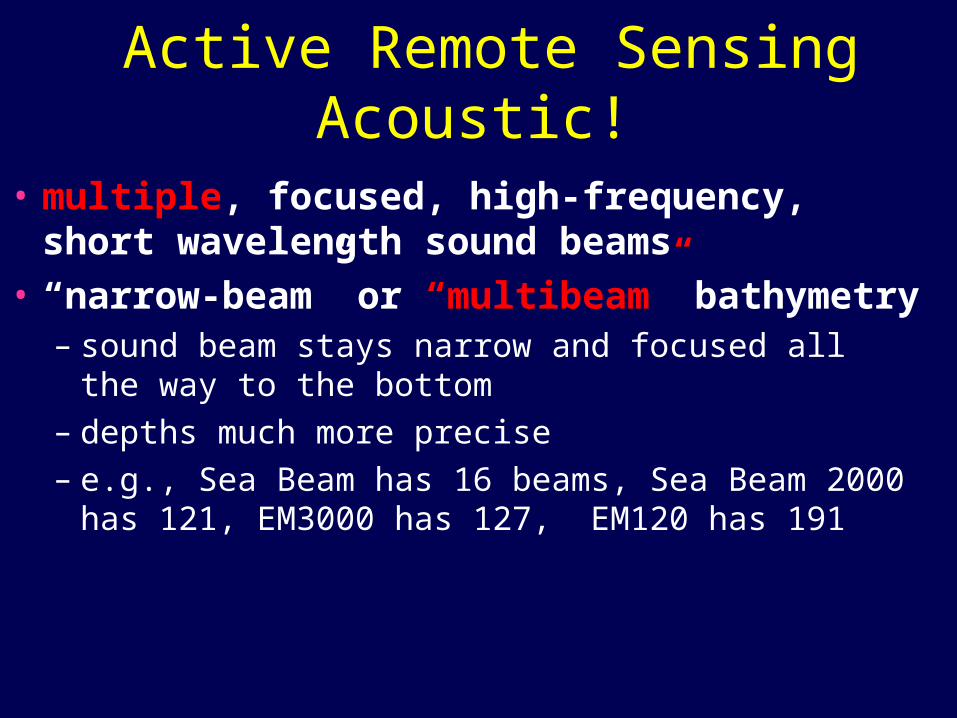
Active Remote SensingAcoustic!
• multiple, focused, high-frequency, short wavelength sound beams
• “narrow-beam” or “multibeam” bathymetry– sound beam stays narrow and focused all the way
to the bottom
– depths much more precise
– e.g., Sea Beam has 16 beams, Sea Beam 2000 has 121, EM3000 has 127, EM120 has 191
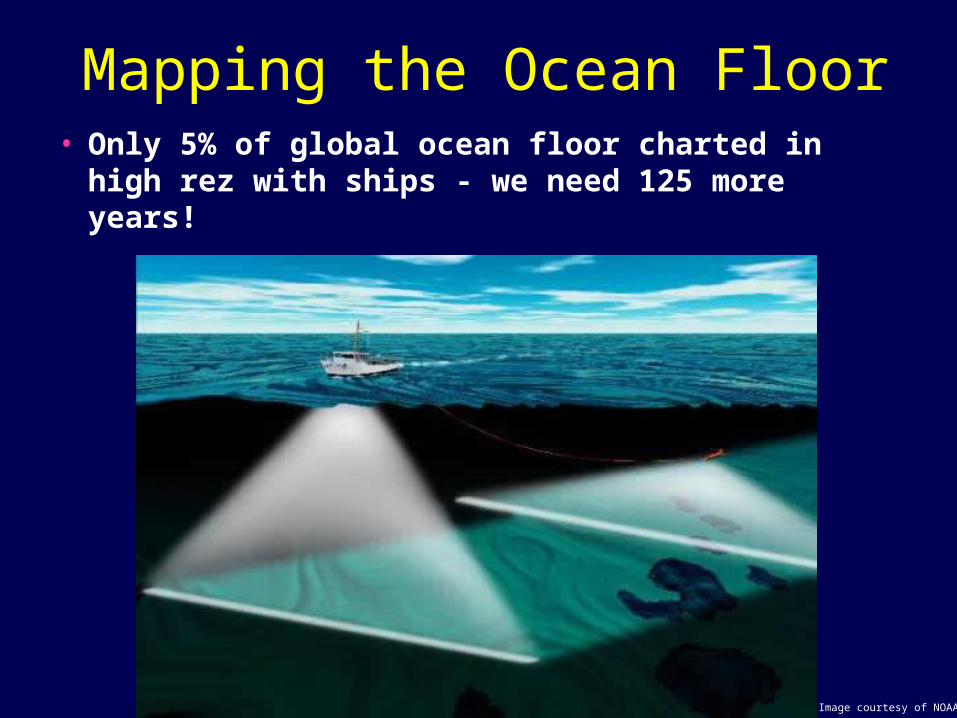
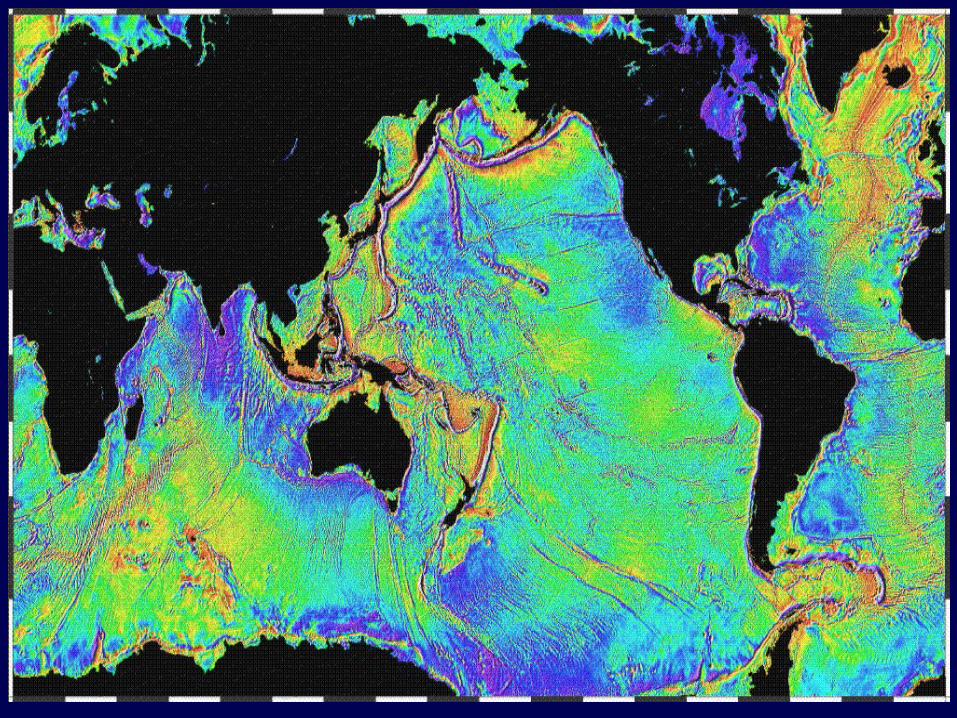
Mapping the Ocean Floor• Only 5% of global ocean floor charted in high
rez with ships - we need 125 more years!
Image courtesy of NOAA
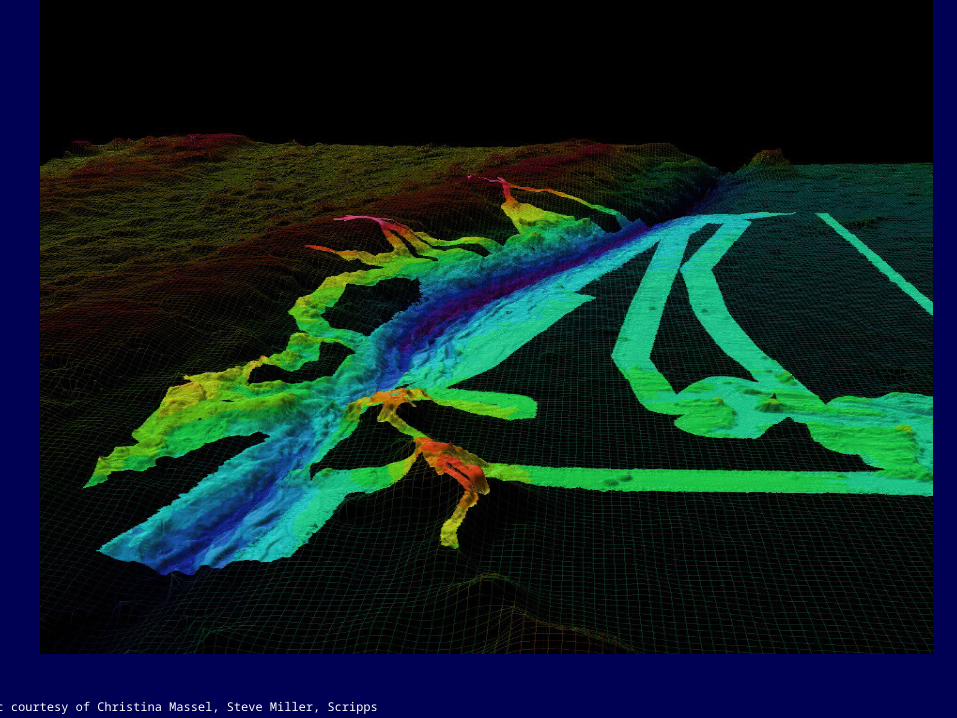
Ocean Thematic Layers
Graphic courtesy of Christina Massel, Steve Miller, Scripps
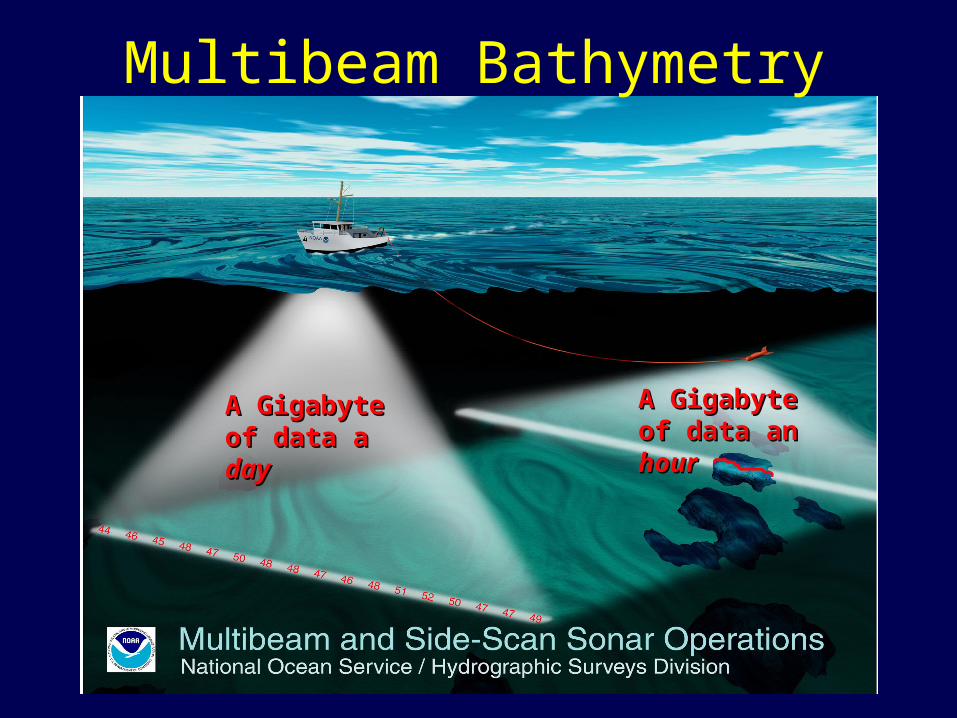
A Gigabyte of A Gigabyte of data a data a dayday
A Gigabyte of A Gigabyte of data an data an hourhour
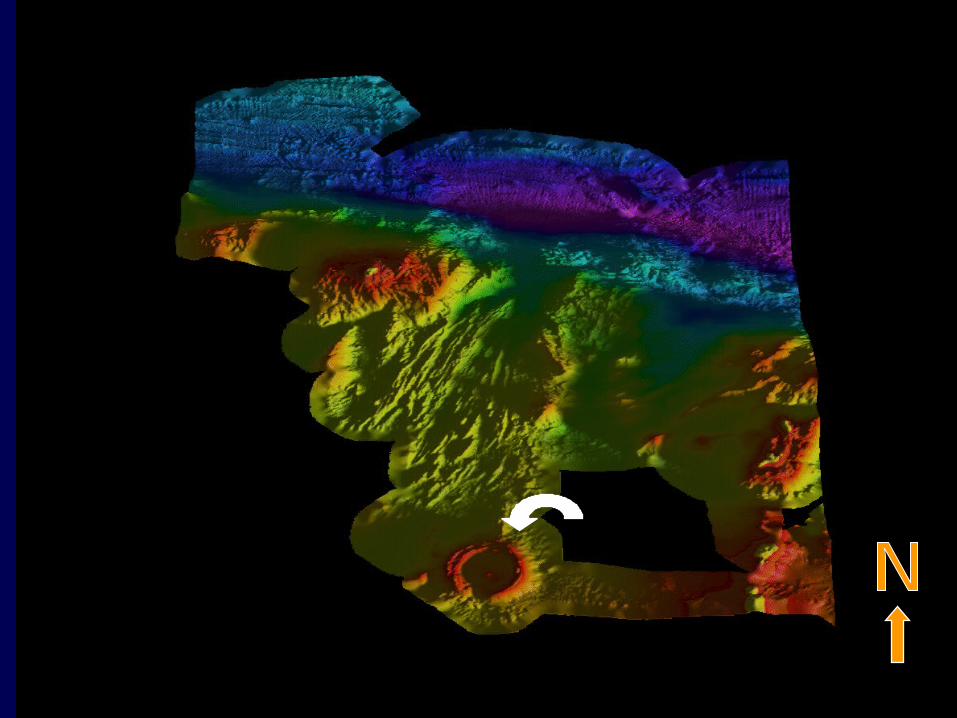
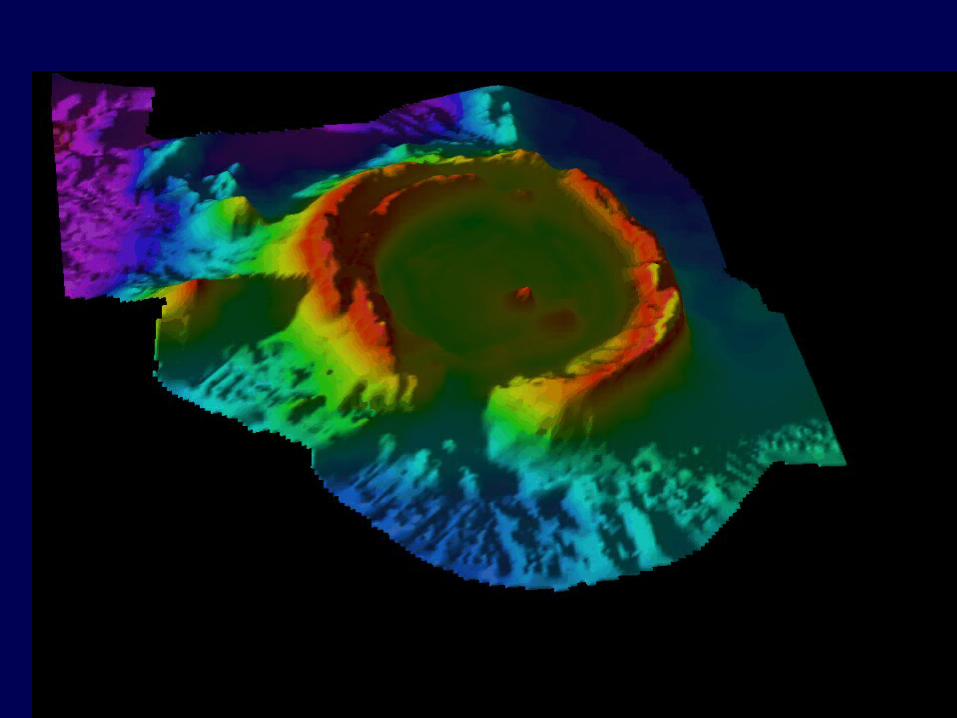
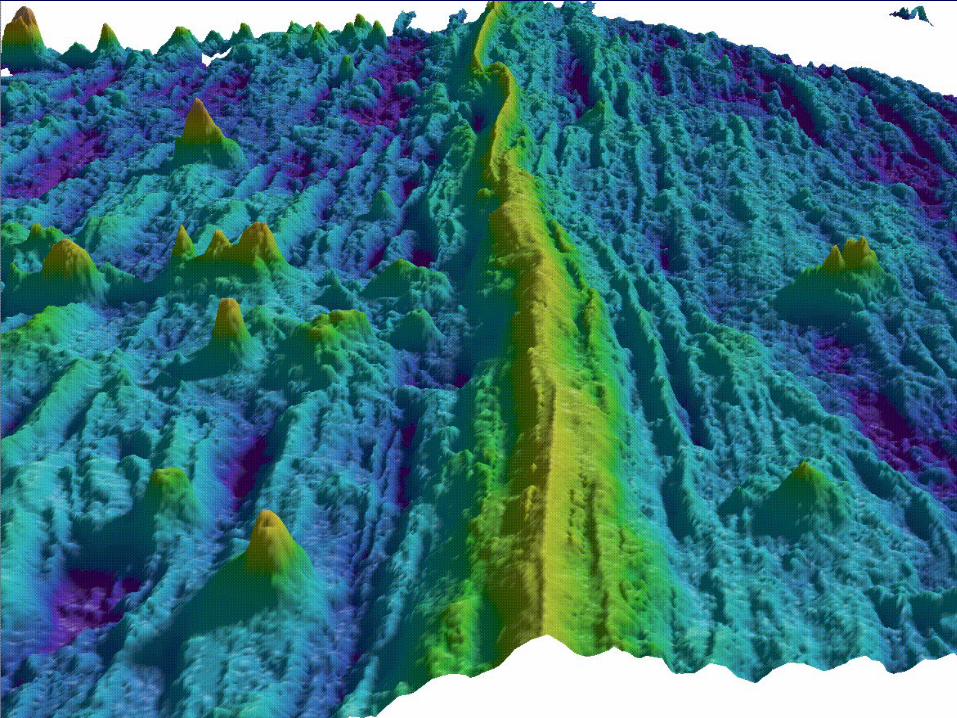
Multibeam Bathymetry
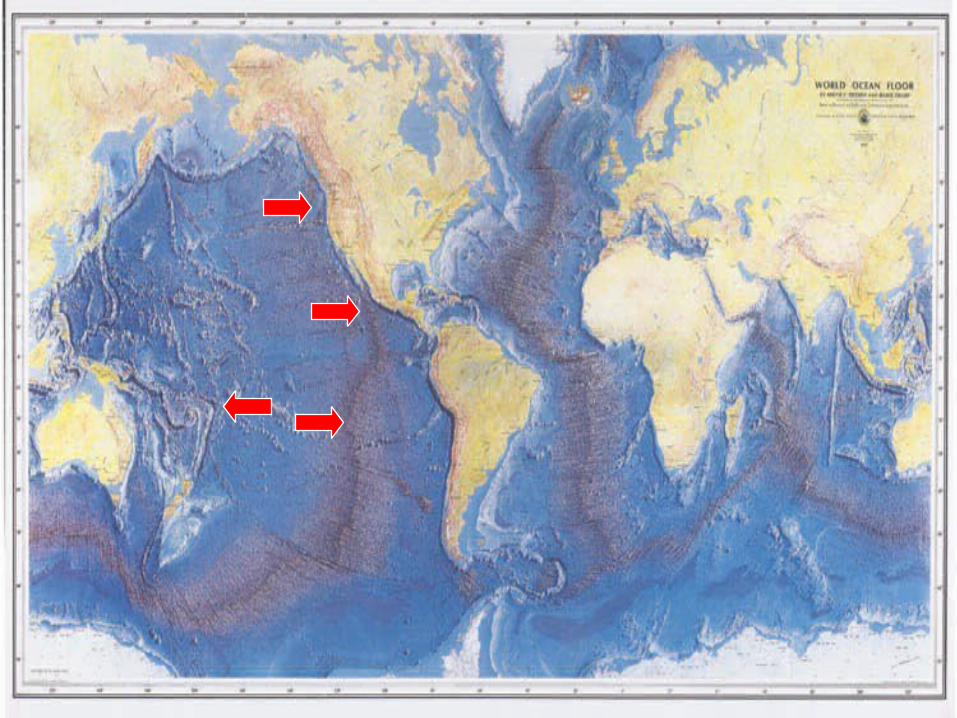
The World Ocean Floor
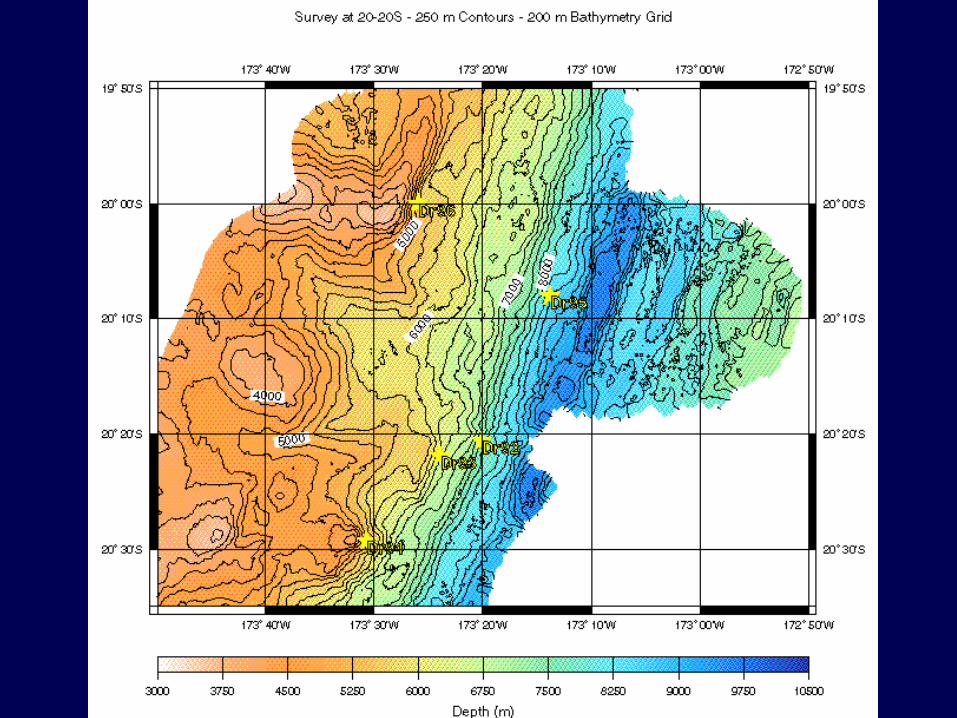
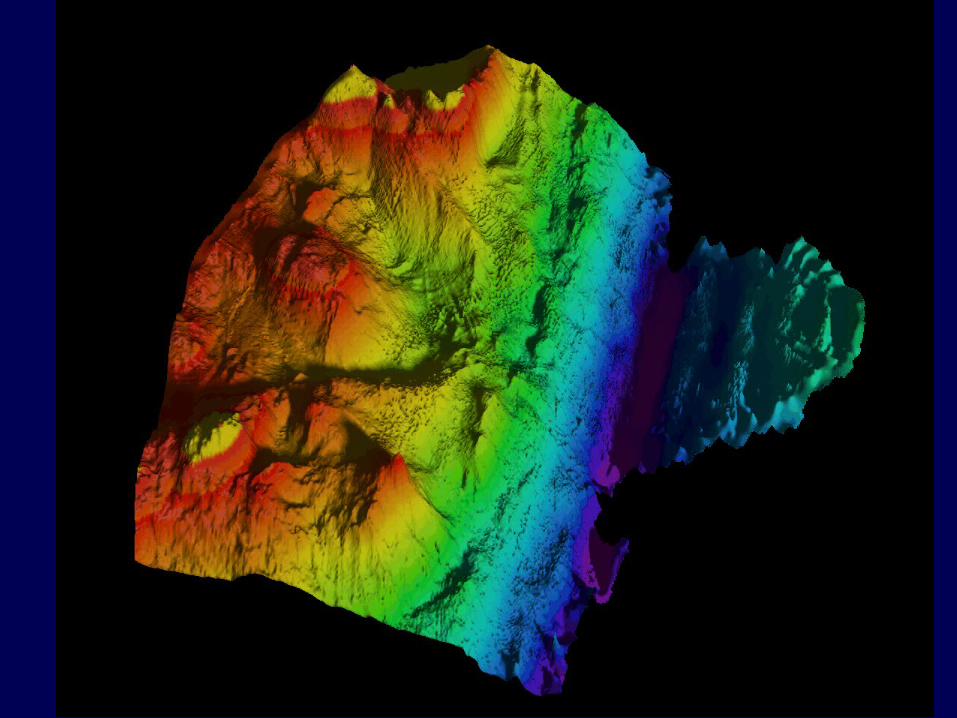
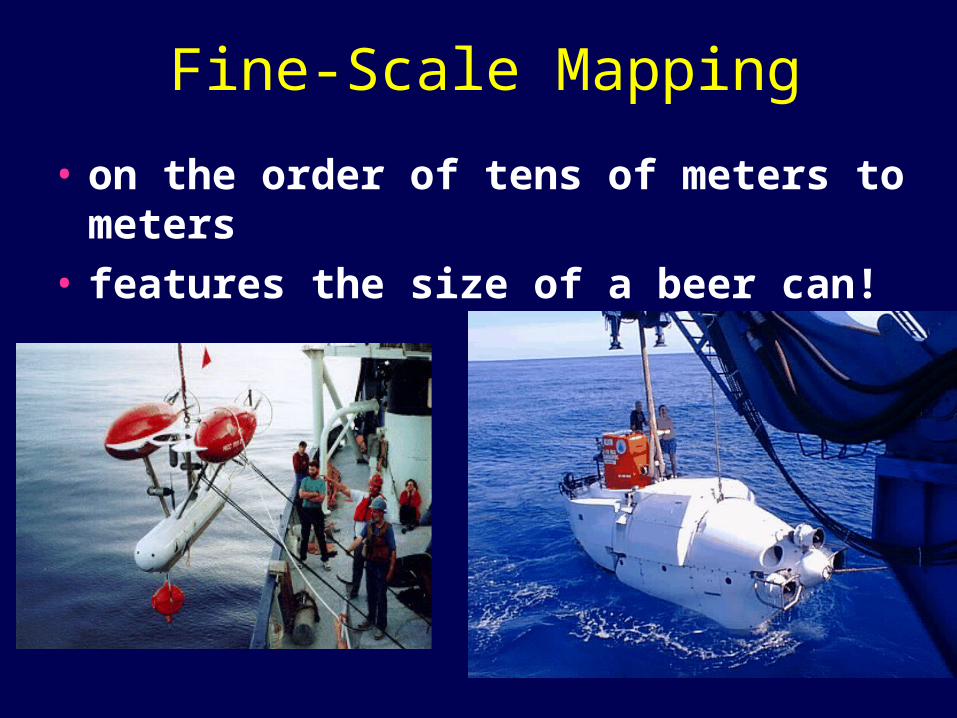
Fine-Scale Mapping
• on the order of tens of meters to meters• features the size of a beer can!
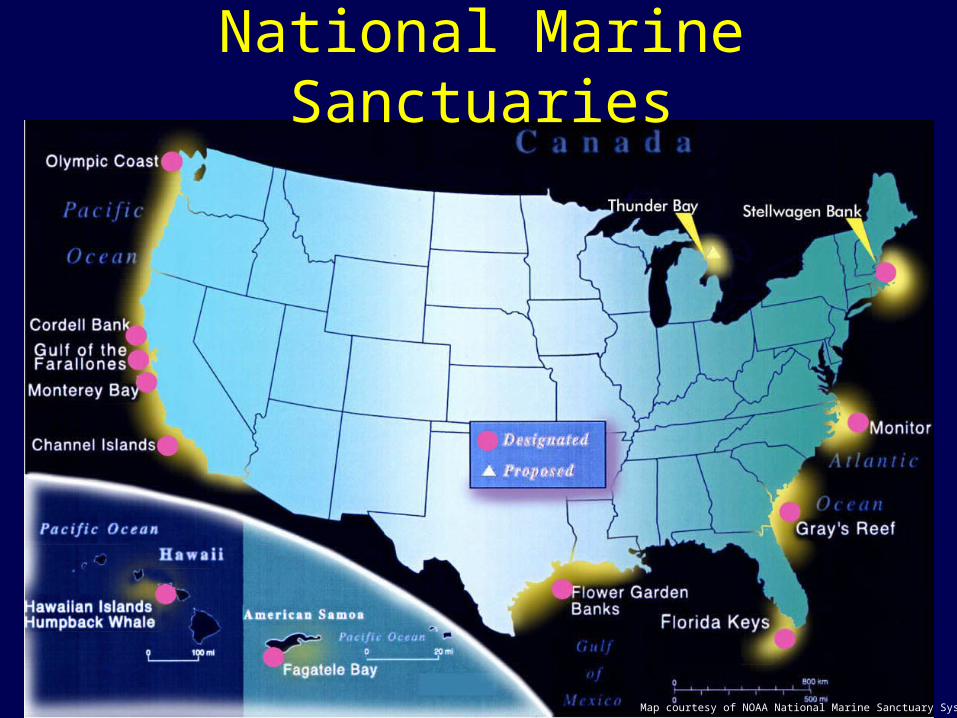
National Marine Sanctuaries
Map courtesy of NOAA National Marine Sanctuary System
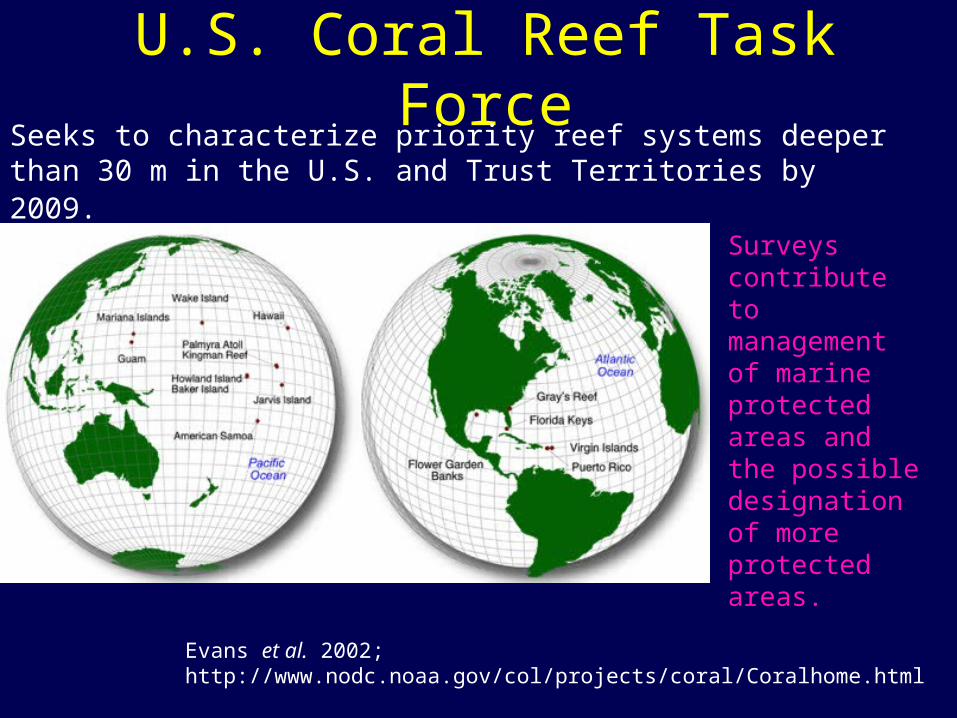
U.S. Coral Reef Task ForceSeeks to characterize priority reef systems deeper than 30 m in the U.S. and Trust Territories by 2009.
Surveys contribute to management of marine protected areas and the possible designation of more protected areas.
Evans et al. 2002; http://www.nodc.noaa.gov/col/projects/coral/Coralhome.html
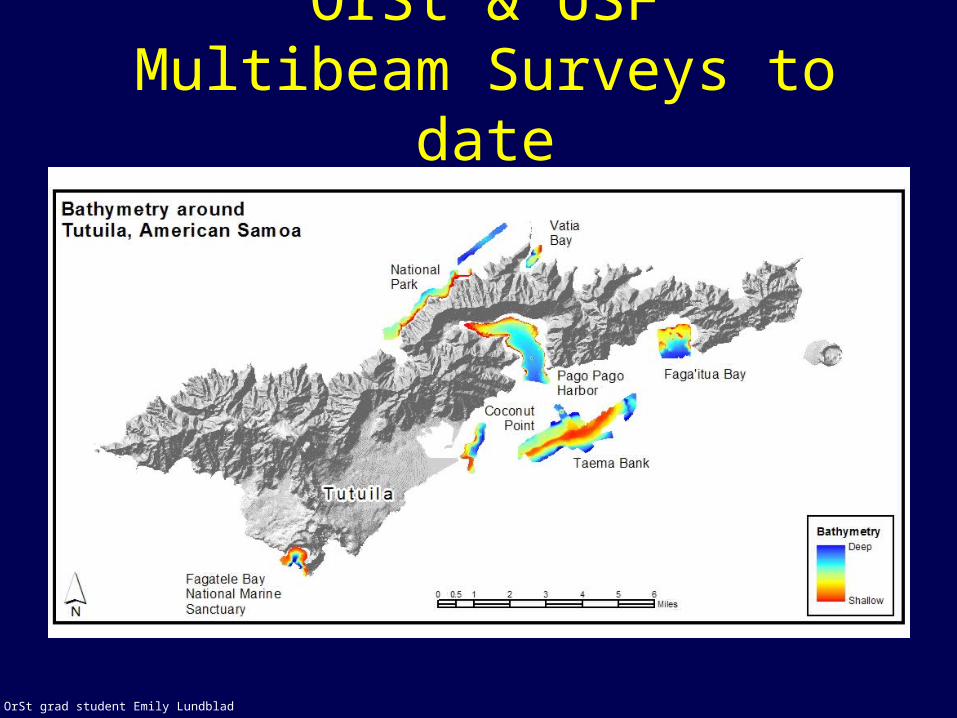
OrSt & USFMultibeam Surveys to date
By OrSt grad student Emily Lundblad
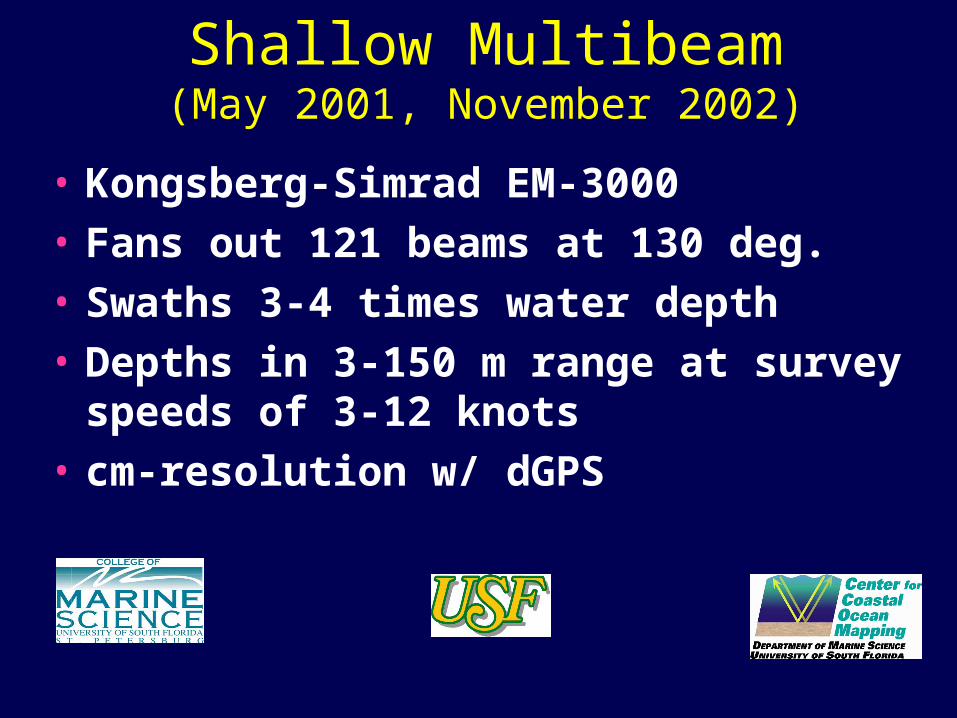
Shallow Multibeam(May 2001, November 2002)
• Kongsberg-Simrad EM-3000• Fans out 121 beams at 130 deg.• Swaths 3-4 times water depth• Depths in 3-150 m range at survey
speeds of 3-12 knots• cm-resolution w/ dGPS
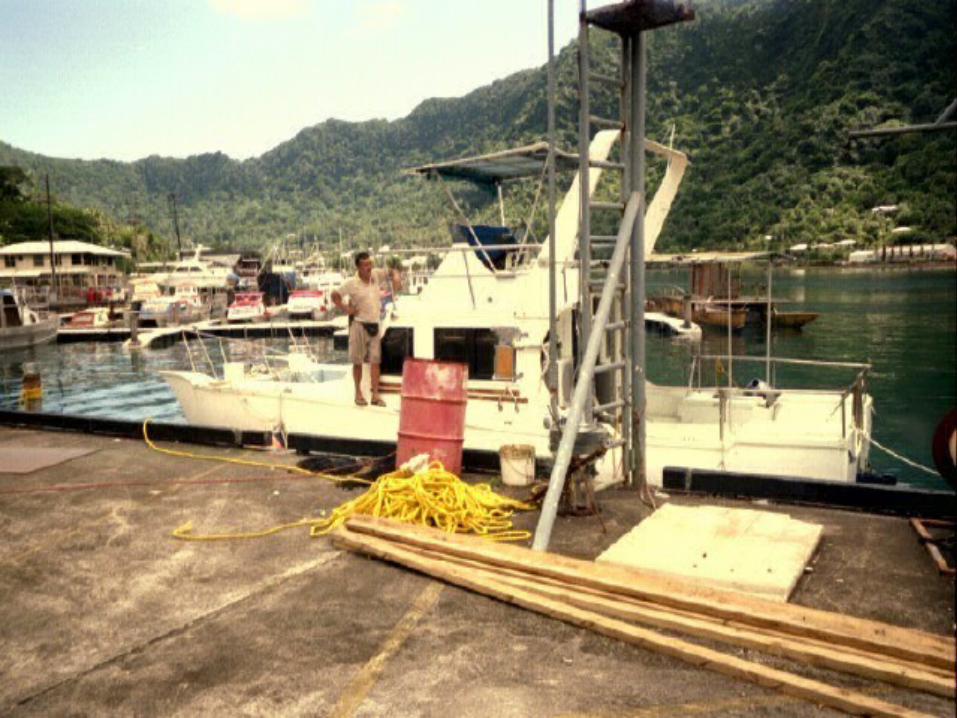
Preparations
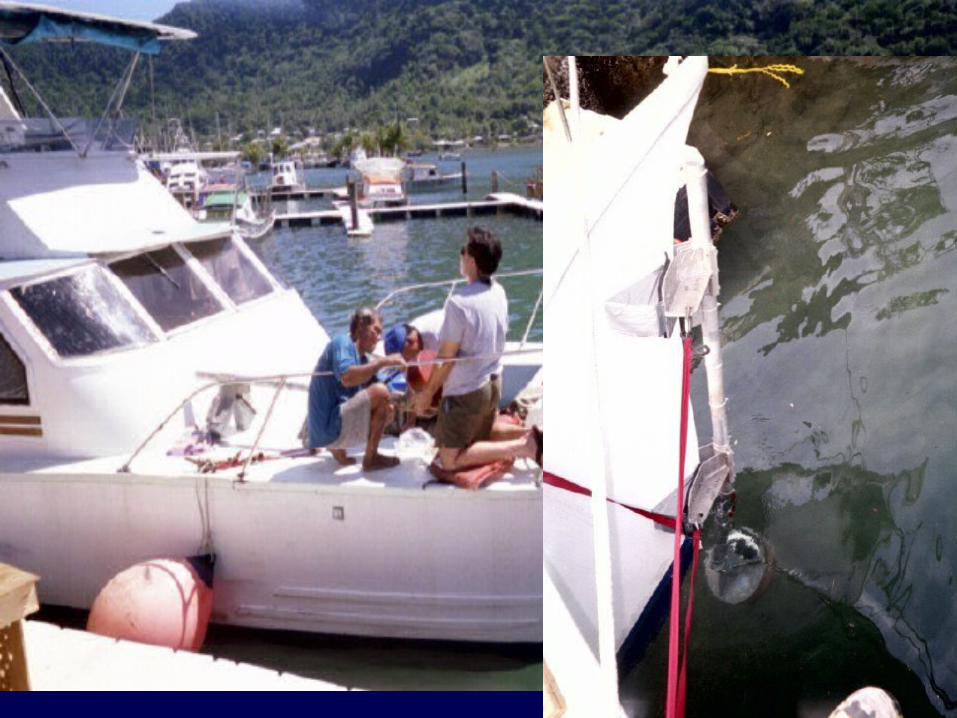
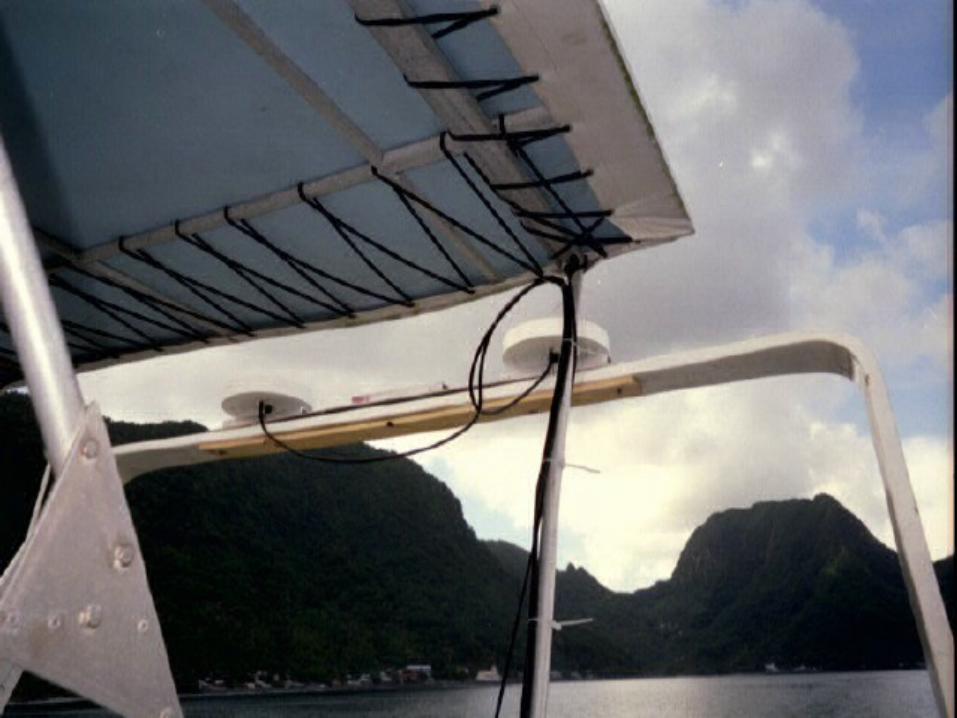
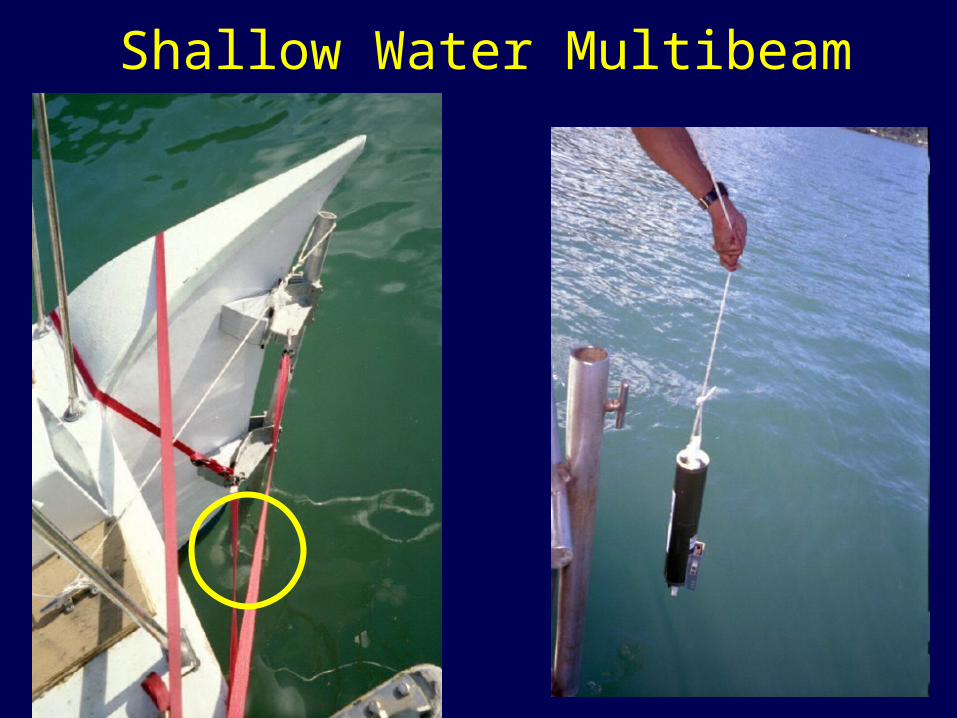
Shallow Water Multibeam
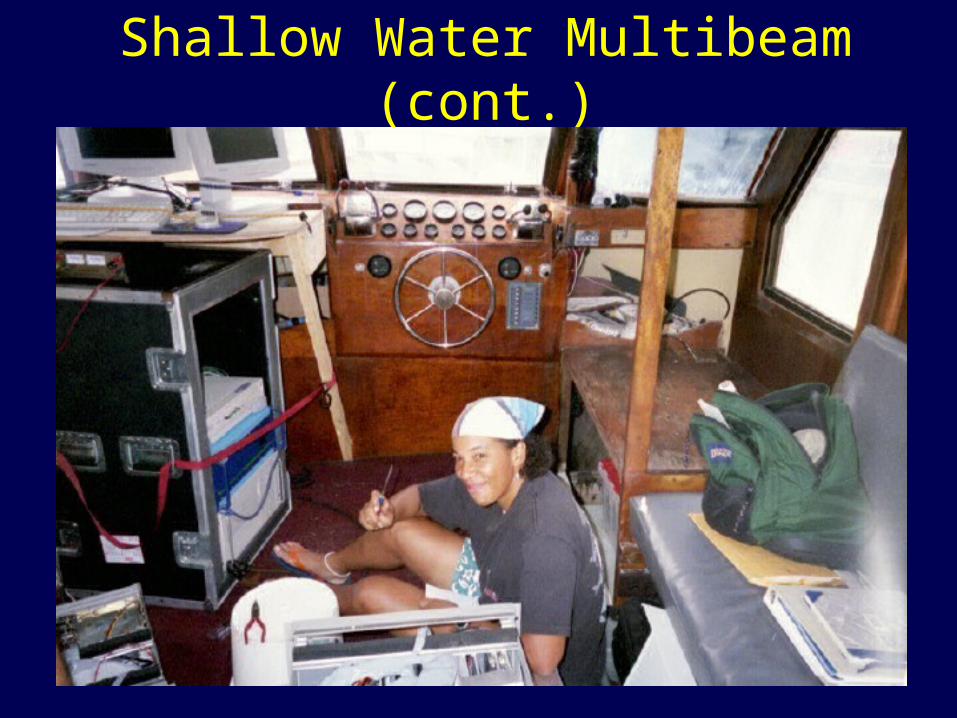
Shallow Water Multibeam (cont.)
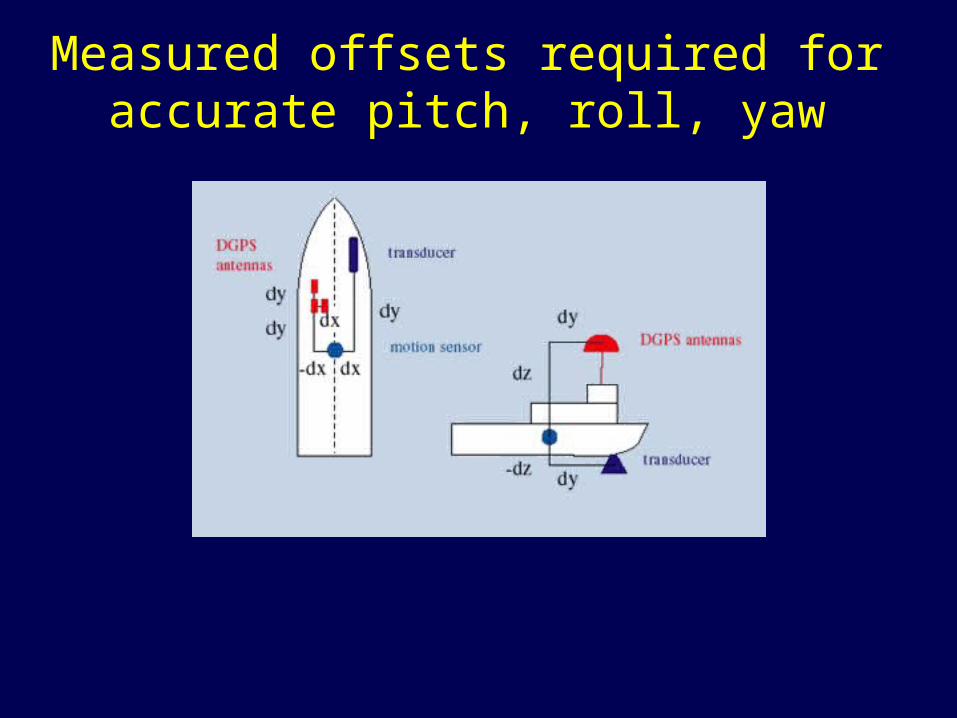
Measured offsets required for accurate pitch, roll, yaw
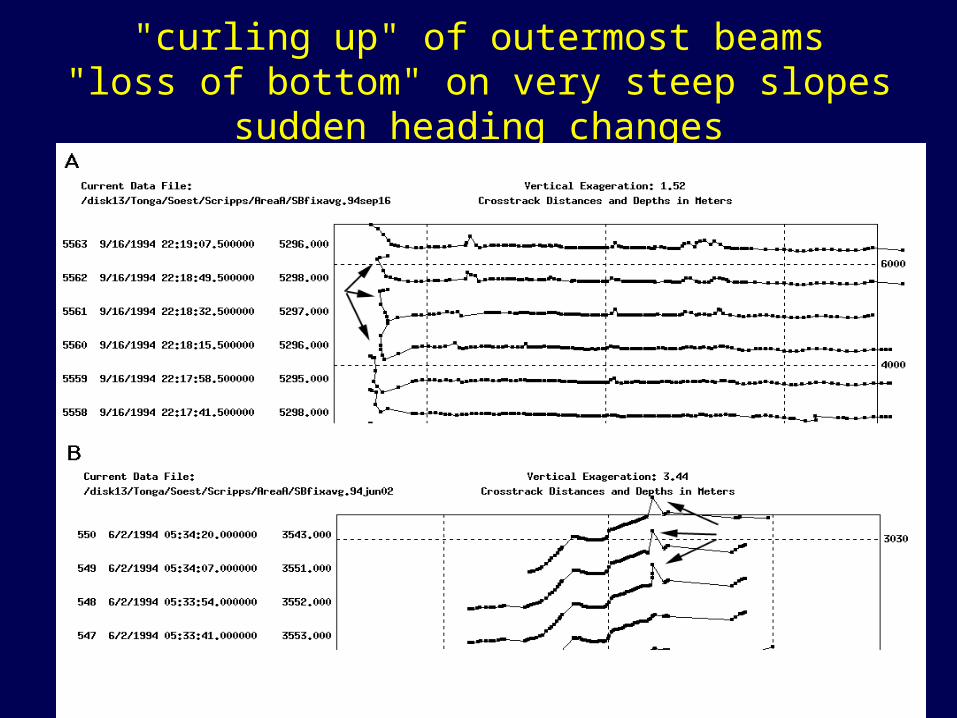
"curling up" of outermost beams"loss of bottom" on very steep slopes
sudden heading changes
By OrSt grad student Emily Larkin
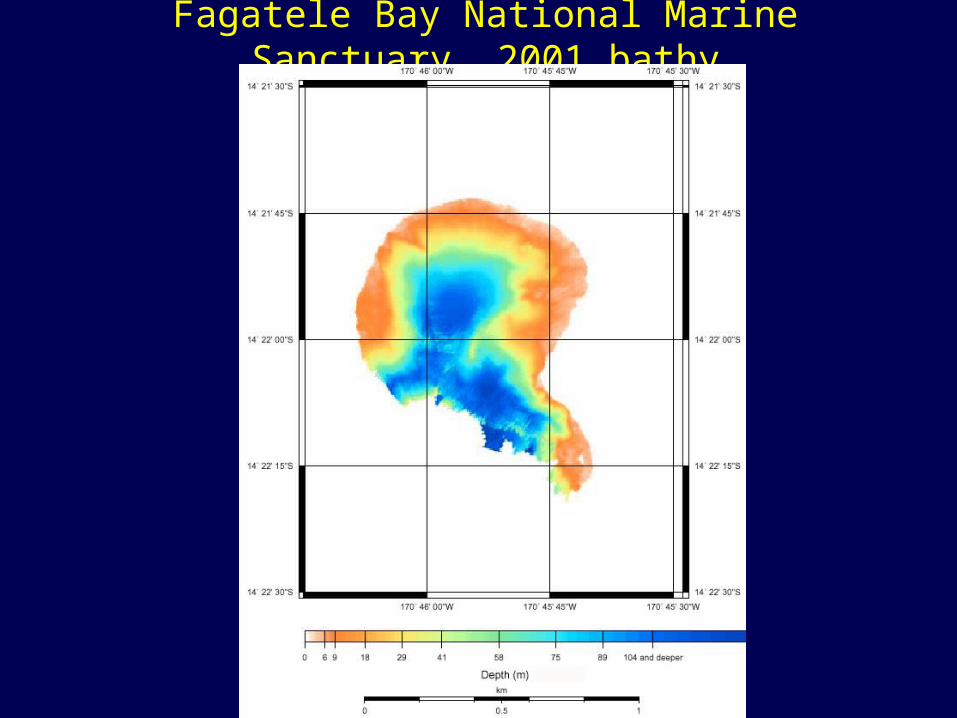
Fagatele Bay National Marine Sanctuary, 2001 bathy
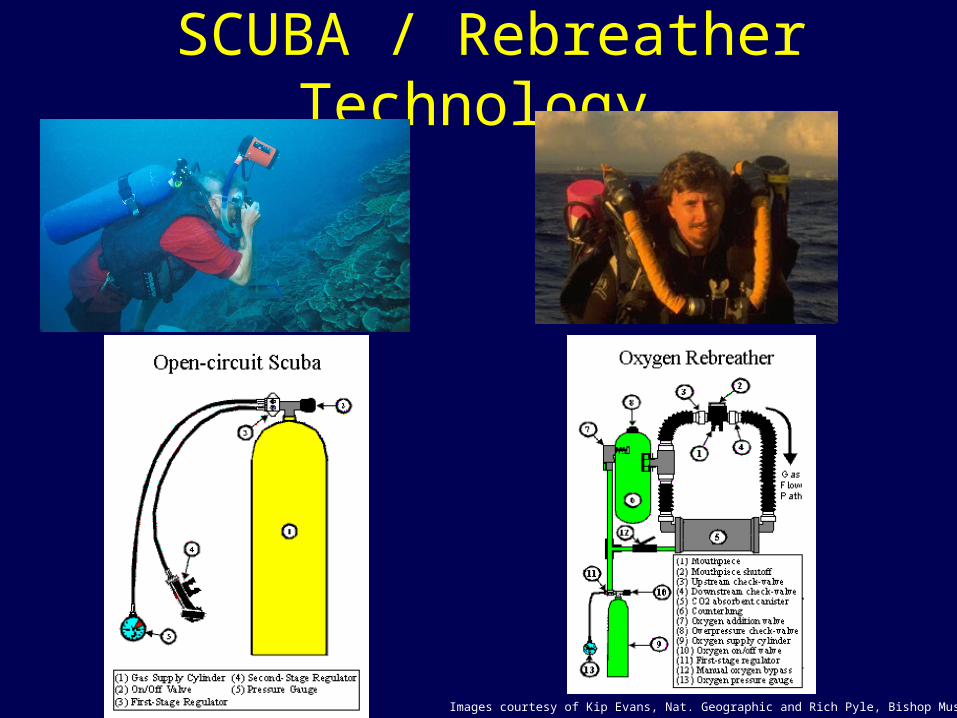
SCUBA / Rebreather Technology
Images courtesy of Kip Evans, Nat. Geographic and Rich Pyle, Bishop Museum
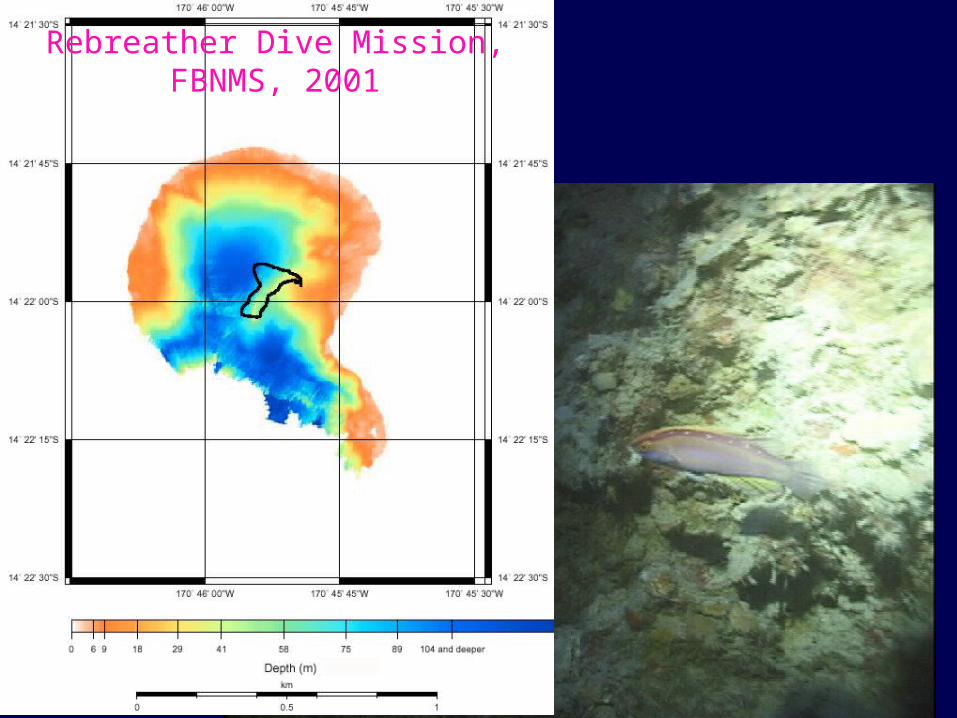
Rebreather Dive Mission, FBNMS, 2001
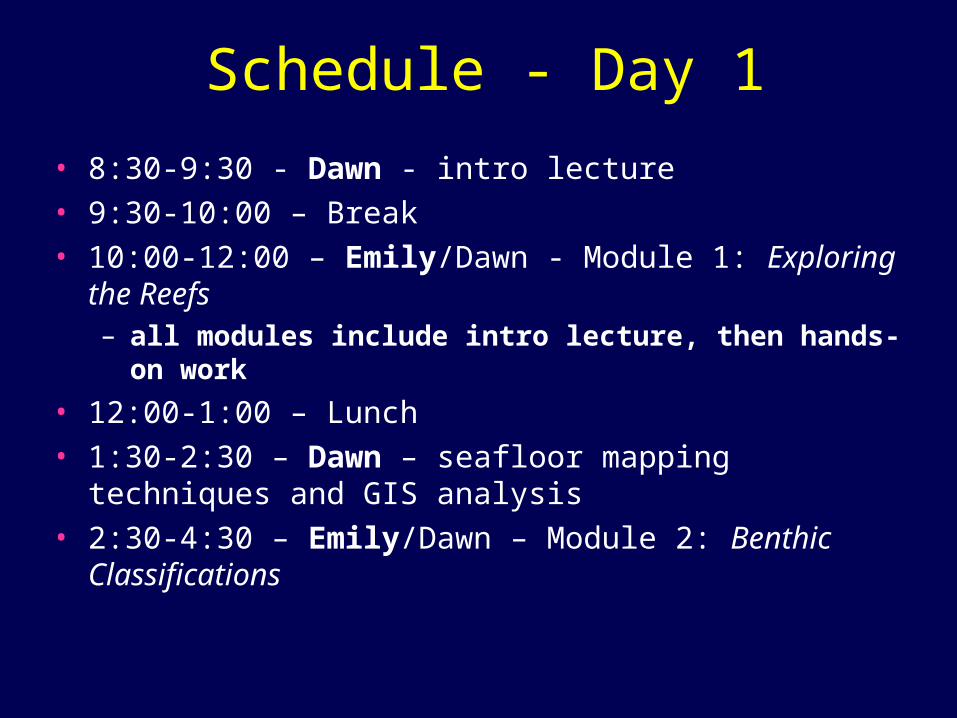
Schedule - Day 1
• 8:30-9:30 - Dawn - intro lecture
• 9:30-10:00 – Break
• 10:00-12:00 – Emily/Dawn - Module 1: Exploring the Reefs– all modules include intro lecture, then hands-on work
• 12:00-1:00 – Lunch
• 1:30-2:30 – Dawn – seafloor mapping techniques and GIS analysis
• 2:30-4:30 – Emily/Dawn – Module 2: Benthic Classifications
Fa’afetai!
Image courtesy of FBNMS
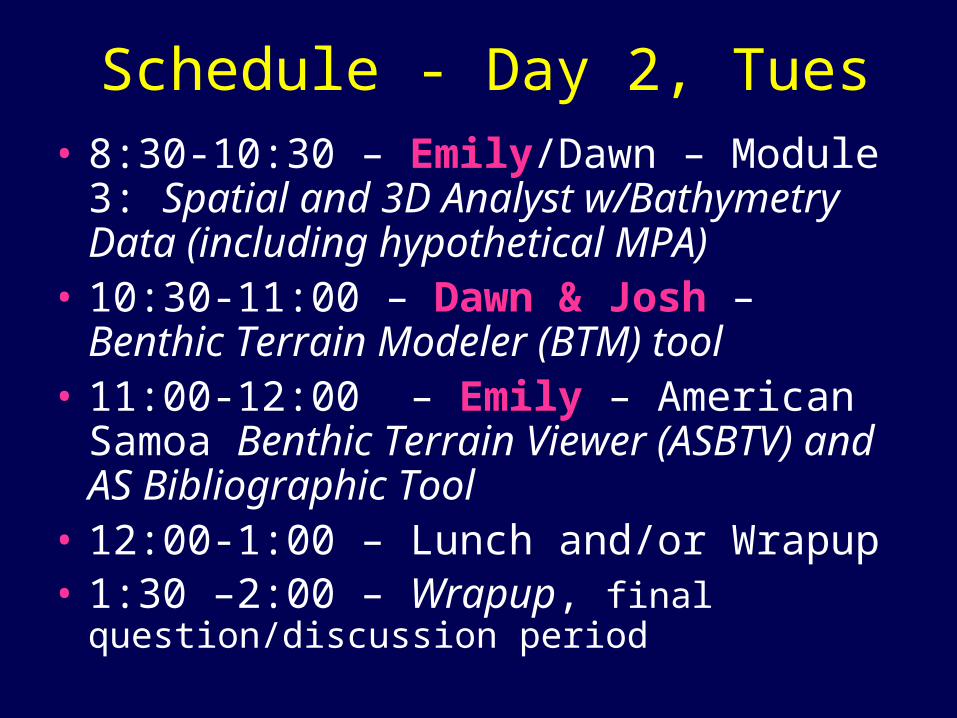
Schedule - Day 2, Tues• 8:30-10:30 – Emily/Dawn – Module 3:
Spatial and 3D Analyst w/Bathymetry Data (including hypothetical MPA)
• 10:30-11:00 – Dawn & Josh – Benthic Terrain Modeler (BTM) tool
• 11:00-12:00 – Emily – American Samoa Benthic Terrain Viewer (ASBTV) and AS Bibliographic Tool
• 12:00-1:00 – Lunch and/or Wrapup• 1:30 –2:00 – Wrapup, final question/discussion
period


