
Structural adjustment of the government budget balance
E(S)CB approach and experience
Richard Morris
Presentation for Norwegian Ministry of Finance’sAdvisory Panel on Macroeconomic Models and Methods
12 September 2011
Outline
1. A quick primer on structural balances
2. The ESCB method of cyclical adjustment
3. Some brief remarks on “temporary measures / effects”
4. The ESCB “Disaggregated Framework” for analysing structural developments in public finances
5. Concluding remarks
1. A quick primer on structural balances
Why compute a structural balance?
• We want fiscal policy to help stabilise the economy (especially automatic stabilisers)
• But without endangering the sustainability of the public finances
Basic questions underlying structural adjustment
• Where does the economy stand in relation to its equilibrium?
• How does government revenue and spending respond to the economiccycle?
1. A quick primer on structural balances
Most institutions use an “aggregate” approach
• E.g. OECD, European Commission, IMF
• Cyclical component = (Output Gap) x (Overall Budget Sensitivity)
• Output gap: Various approaches: Statistical Filtering, Production Function, Surveys (e.g. capacity utilisation)
• Sensitivity: Typical composition of output (growth) and budget elasticities
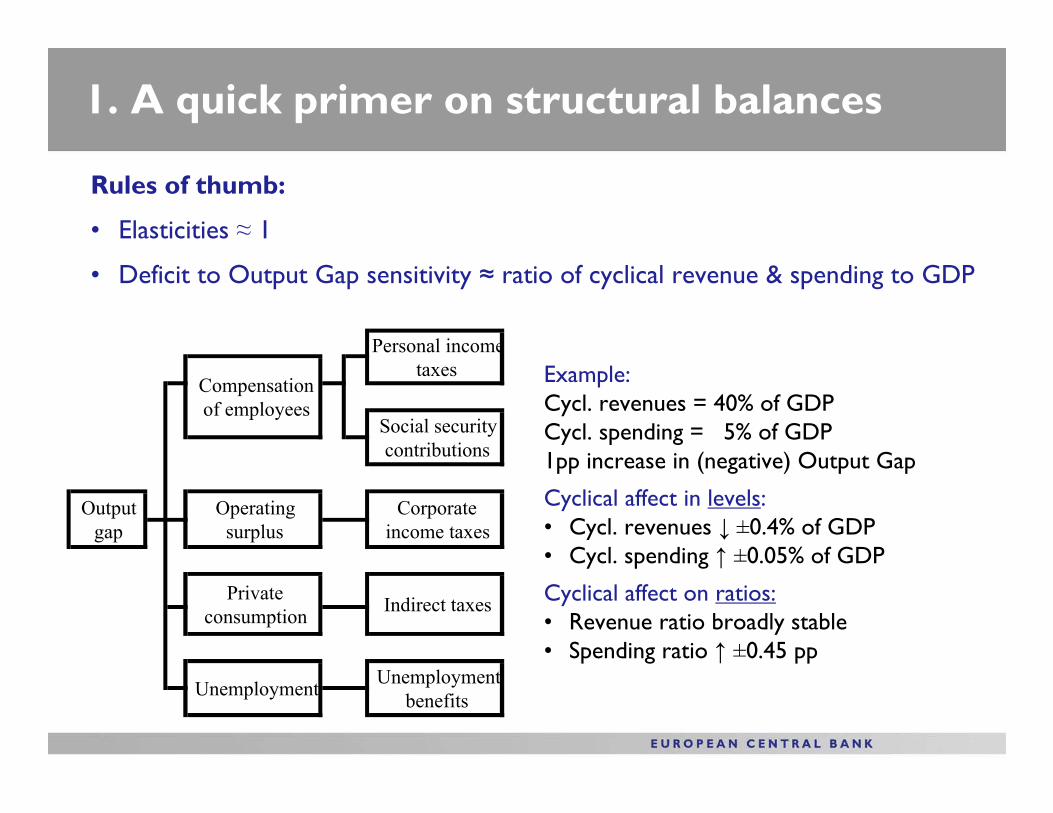
1. A quick primer on structural balances
Unemployment Unemploymentbenefits
Compensationof employees
Output gap
Operatingsurplus
Corporate income taxes
Private consumption Indirect taxes
Personal incometaxes
Social securitycontributions
Example: Cycl. revenues = 40% of GDP Cycl. spending = 5% of GDP 1pp increase in (negative) Output Gap
Cyclical affect in levels:• Cycl. revenues ↓ ±0.4% of GDP• Cycl. spending ↑ ±0.05% of GDP
Cyclical affect on ratios:• Revenue ratio broadly stable• Spending ratio ↑ ±0.45 pp
Rules of thumb:
• Elasticities ≈ 1
• Deficit to Output Gap sensitivity ≈ ratio of cyclical revenue & spending to GDP
1. A quick primer on structural balances
The “Official” EU method
• Potential Output (Gap) measured by production function
• Budget sensitivity (updated periodically by OECD)
• Certain “temporary and one-off measures / effects” may also be netted out to arrive at the “structural” balance
• Basis for Stability and Growth Pact:
• Medium-term objective: budgets should be close-to-balance or in surplus in structural terms
• Fiscal adjustment path also generally set in structural terms (automatic stabilisers operate around a consolidation path)
2. The ESCB method of cyclical adjustment
Background
• Interested to know fiscal stance
• Concern that cyclical revenue and spending do not just depend on the output gap; the composition of economic activity also matters
• No “single” / “official” / “agreed” method for measuring the output gap in the ESCB
• Based on method initially developed by Bank of Italy
• See ECB Working Paper No 77
2. The ESCB method of cyclical adjustment
The approach in a nutshell
• Allocate each cyclical revenue and expenditure component to the national accounts aggregate (part of the macro forecast) which most closely resembles the actual tax/spending base
• Derive relevant elasticities based on tax code or econometric estimation
• Compute gaps for national accounts aggregates w.r.t. trend (for past and extended projection) using Hodrick-Prescott filter
• Cyclical component for each individual revenue/spending item is:
(Revenue/spending item) x (elasticity) x (% deviation of macro base from trend)
• Cyclical components added up and subtracted from net lending to arrive at cyclically adjusted balance
2. The ESCB method of cyclical adjustment
A working example applied to Spain
• Own estimates. Not official ECB estimates!
• Focus on past not projection
Estimation approach / assumptions
Direct taxes paid by households:
• (Approx) share of PIT paid by government employees (not-cyclical)
• (Approx) share of PIT paid on private sector wage income (linked to private sector employment (elast = 1) and average compensation of private sector employees (elast = 1.5)
• (Approx) share of PIT paid on mixed income & capital income (linked to gross operating surplus & mixed income)
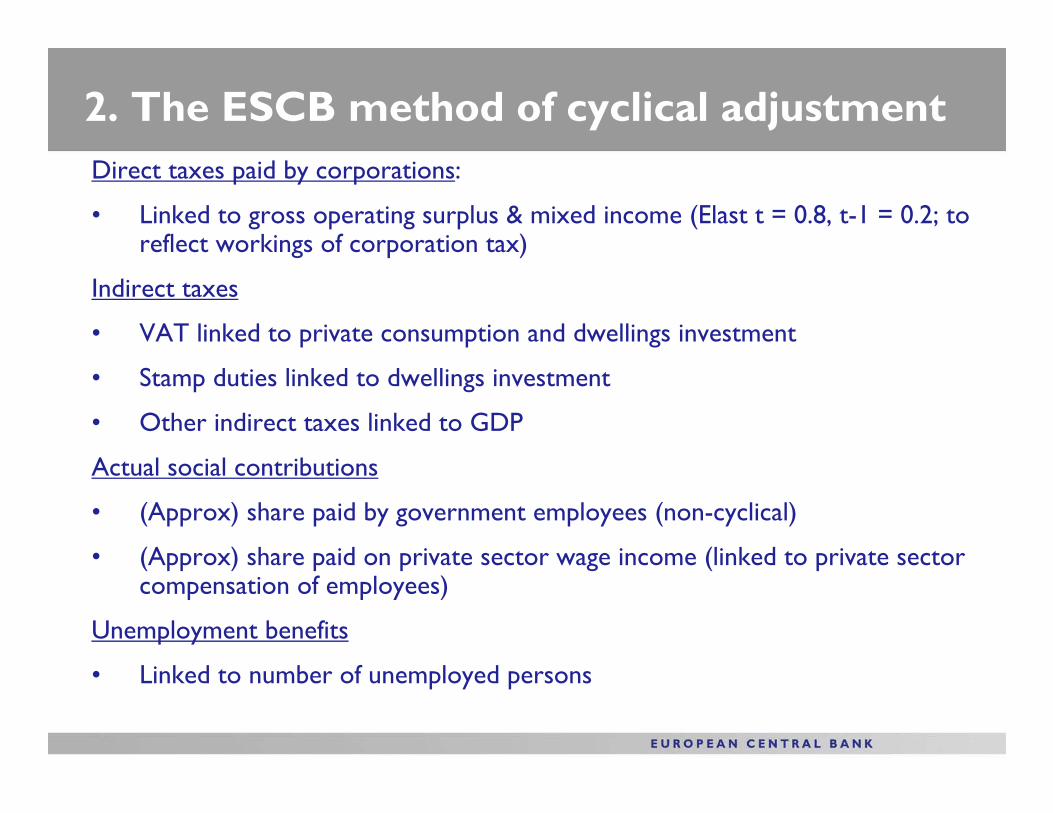
2. The ESCB method of cyclical adjustmentDirect taxes paid by corporations:
• Linked to gross operating surplus & mixed income (Elast t = 0.8, t-1 = 0.2; to reflect workings of corporation tax)
Indirect taxes
• VAT linked to private consumption and dwellings investment
• Stamp duties linked to dwellings investment
• Other indirect taxes linked to GDP
Actual social contributions
• (Approx) share paid by government employees (non-cyclical)
• (Approx) share paid on private sector wage income (linked to private sector compensation of employees)
Unemployment benefits
• Linked to number of unemployed persons
2. The ESCB method of cyclical adjustment
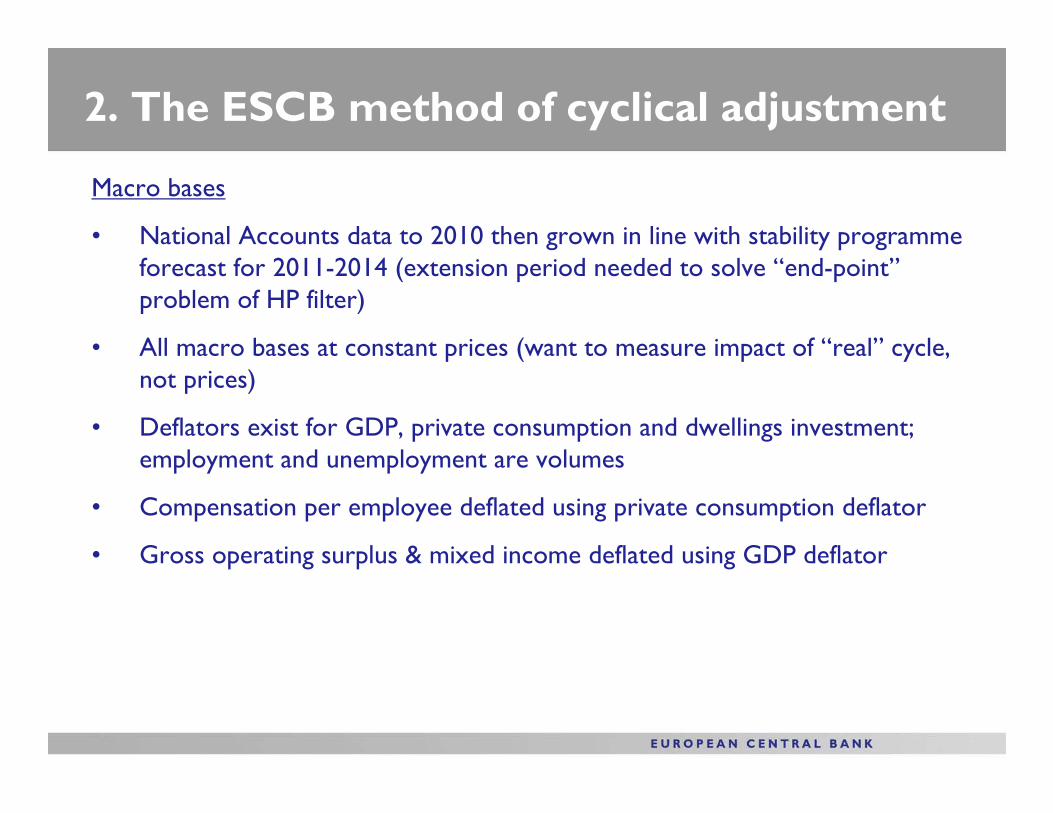
Macro bases
• National Accounts data to 2010 then grown in line with stability programme forecast for 2011-2014 (extension period needed to solve “end-point” problem of HP filter)
• All macro bases at constant prices (want to measure impact of “real” cycle, not prices)
• Deflators exist for GDP, private consumption and dwellings investment; employment and unemployment are volumes
• Compensation per employee deflated using private consumption deflator
• Gross operating surplus & mixed income deflated using GDP deflator
2. The ESCB method of cyclical adjustment
Also compute cyclical component using aggregate approach
• Overall cyclical sensitivity set at 0.43
• Comparison of disaggregated and aggregate measure allows us to gauge “composition effect”
2. The ESCB method of cyclical adjustment
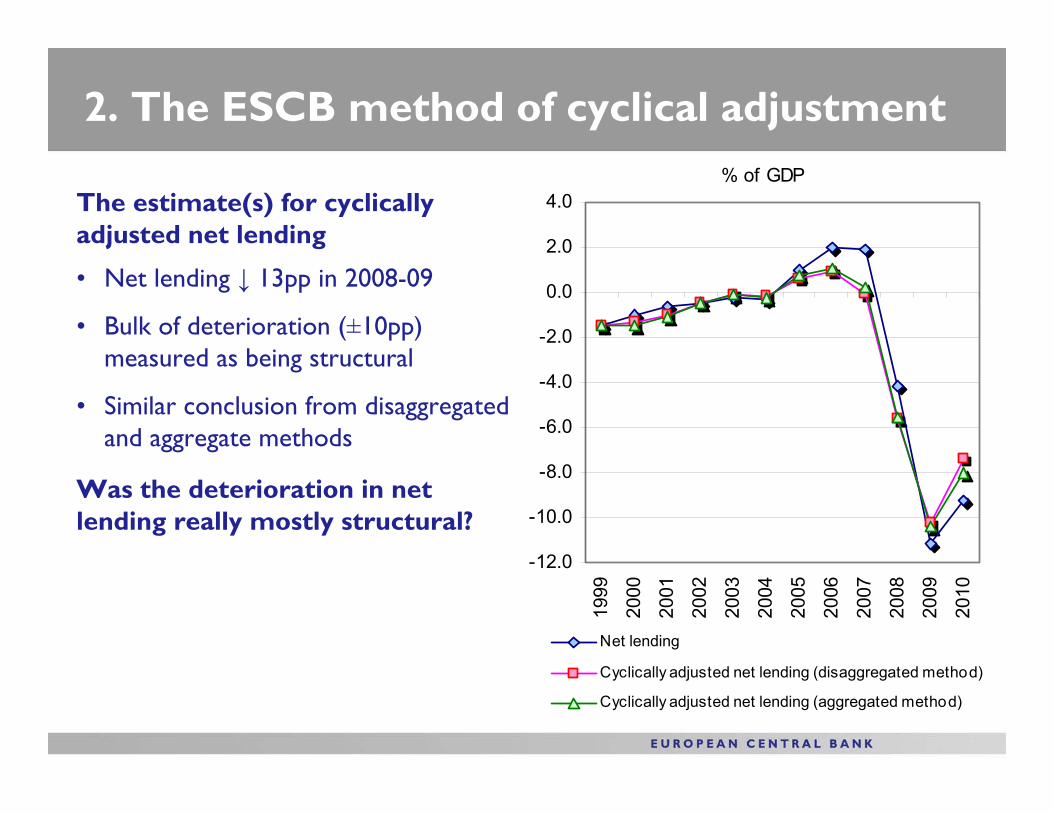
• Net lending ↓ 13pp in 2008-09
• Bulk of deterioration (±10pp) measured as being structural
• Similar conclusion from disaggregated and aggregate methods
% of GDP
-12.0
-10.0
-8.0
-6.0
-4.0
-2.0
0.0
2.0
4.0
1999
2000
2001
2002
2003
2004
2005
2006
2007
2008
2009
2010
Net lending
Cyclically adjusted net lending (disaggregated method)
Cyclically adjusted net lending (aggregated method)
The estimate(s) for cyclically adjusted net lending
Was the deterioration in net lending really mostly structural?
2. The ESCB method of cyclical adjustment
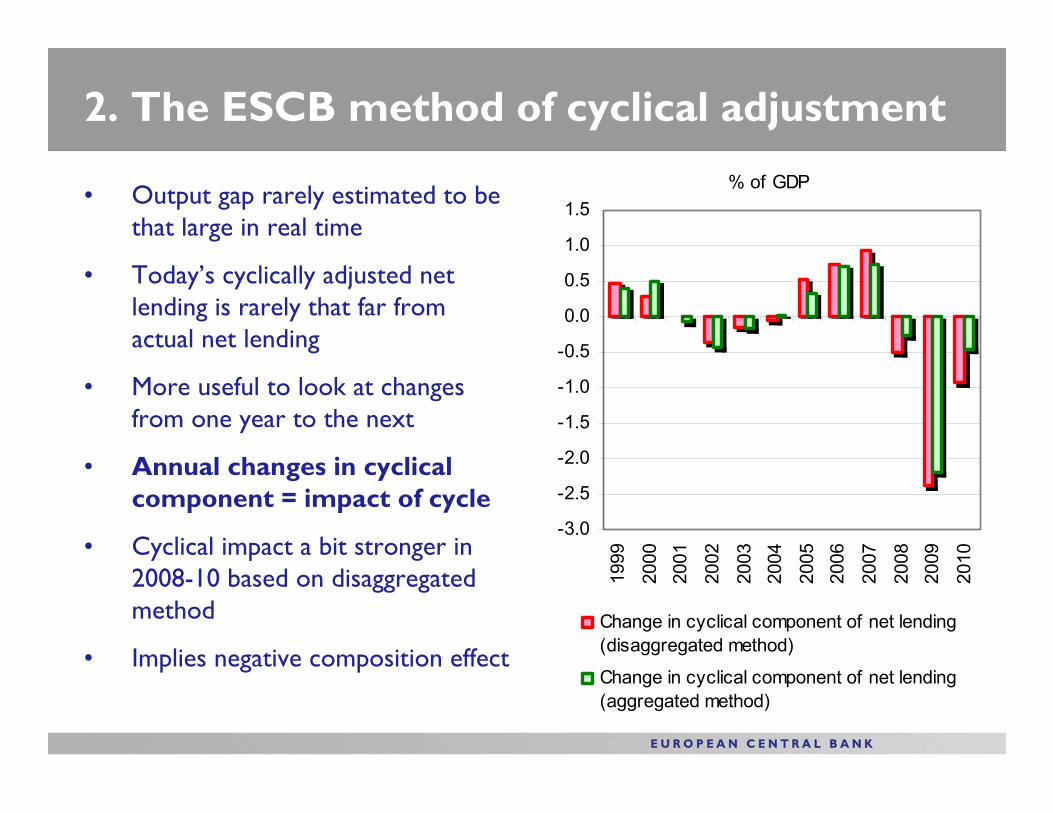
• Output gap rarely estimated to be that large in real time
• Today’s cyclically adjusted net lending is rarely that far from actual net lending
• More useful to look at changes from one year to the next
• Annual changes in cyclical component = impact of cycle
• Cyclical impact a bit stronger in 2008-10 based on disaggregated method
• Implies negative composition effect
% of GDP
-3.0
-2.5
-2.0
-1.5
-1.0
-0.5
0.0
0.5
1.0
1.5
1999
2000
2001
2002
2003
2004
2005
2006
2007
2008
2009
2010
Change in cyclical component of net lending(disaggregated method)
Change in cyclical component of net lending(aggregated method)
2. The ESCB method of cyclical adjustment
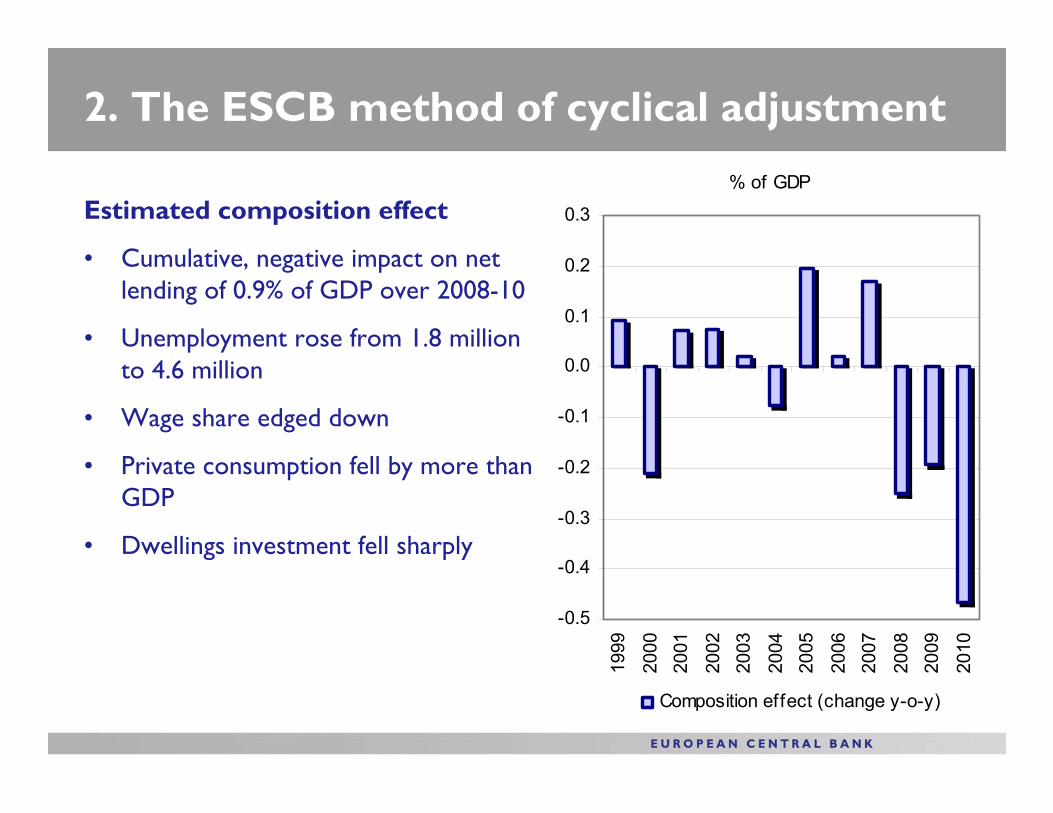
Estimated composition effect
• Cumulative, negative impact on net lending of 0.9% of GDP over 2008-10
• Unemployment rose from 1.8 million to 4.6 million
• Wage share edged down
• Private consumption fell by more than GDP
• Dwellings investment fell sharply
% of GDP
-0.5
-0.4
-0.3
-0.2
-0.1
0.0
0.1
0.2
0.3
1999
2000
2001
2002
2003
2004
2005
2006
2007
2008
2009
2010
Composition effect (change y-o-y)
2. The ESCB method of cyclical adjustment
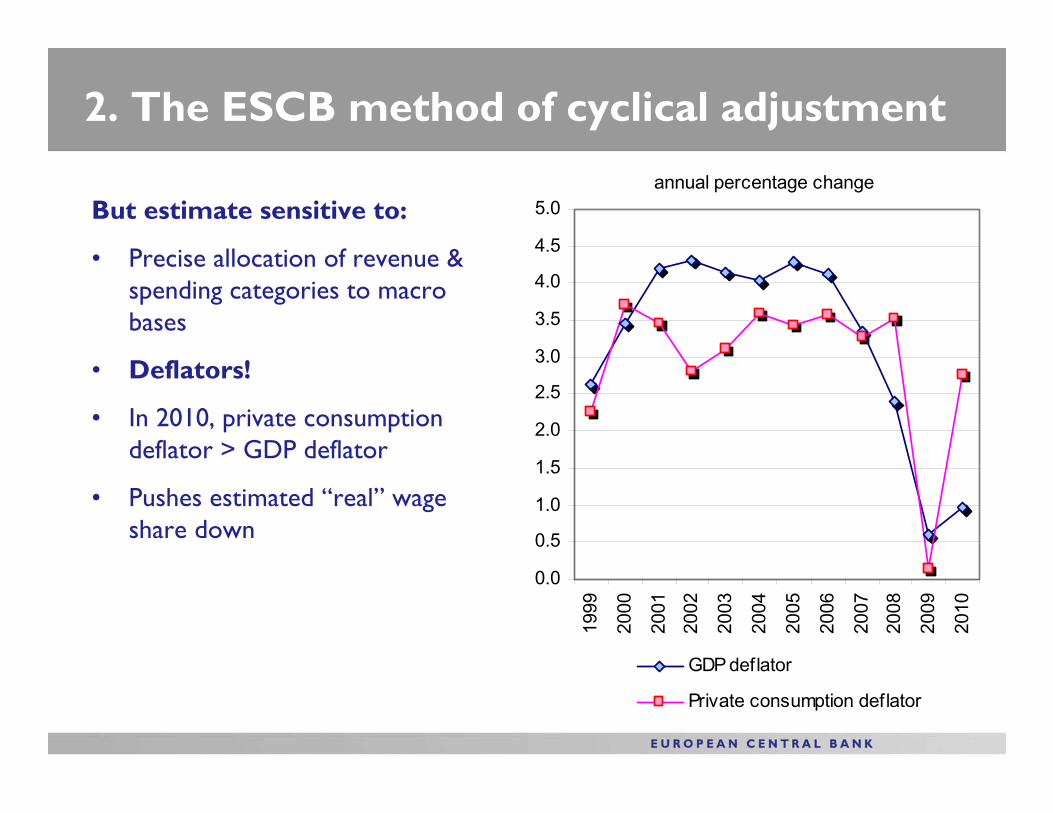
But estimate sensitive to:
• Precise allocation of revenue & spending categories to macro bases
• Deflators!
• In 2010, private consumption deflator > GDP deflator
• Pushes estimated “real” wage share down
annual percentage change
0.0
0.5
1.0
1.5
2.0
2.5
3.0
3.5
4.0
4.5
5.0
1999
2000
2001
2002
2003
2004
2005
2006
2007
2008
2009
2010
GDP deflator
Private consumption deflator
3. (Very briefly) temporary measures / effects
• Some effects on the budget are obviously temporary in nature and do not really represent structural changes
• E.g. sales of UMTS licences (huge, easily measurable impact on euro area net lending in 2000)
• Seems like common sense to net such things out. But where do you draw the line?
• Sales of non-financial assets (land/buildings) may be rare or common
• From a certain point of view, much spending is temporary (e.g. building a particular hospital or school)
• Difficult to pursue a harmonised approach across countries
4. The ESCB “disaggregated framework”
An attempt to analyse changes in the structural balance
First developed by German Bundesbank
See ECB Working Paper No 579
Conceptually, under neutral fiscal policy
• Revenue-to-GDP ratio should be broadly stable
• Structural revenue-to-trend GDP ratio also broadly constant (adjustments to numerator and denominator go in same direction)
• Expenditure-to-GDP fluctuates with cycle (mainly due to denominator effect)
• Structural (primary) expenditure-to-trend GDP ratio should remain broadly constant (structural primary spending should grow in line with trend GDP)
4. The ESCB “disaggregated framework”
• Changes in (structural) revenue-to-GDP ratio can be broken down into estimated effects of:
• Fiscal drag
• (Trend) decoupling of (trend of) macro tax base from (trend of) GDP
• Changes to tax legislation
• Residual
• Structural (primary) expenditure to trend-GDP ratio
• Measure of “spending stance”, but bear in mind…
• (Revisions to) trend GDP
• Deflators!
4. The ESCB “disaggregated framework”
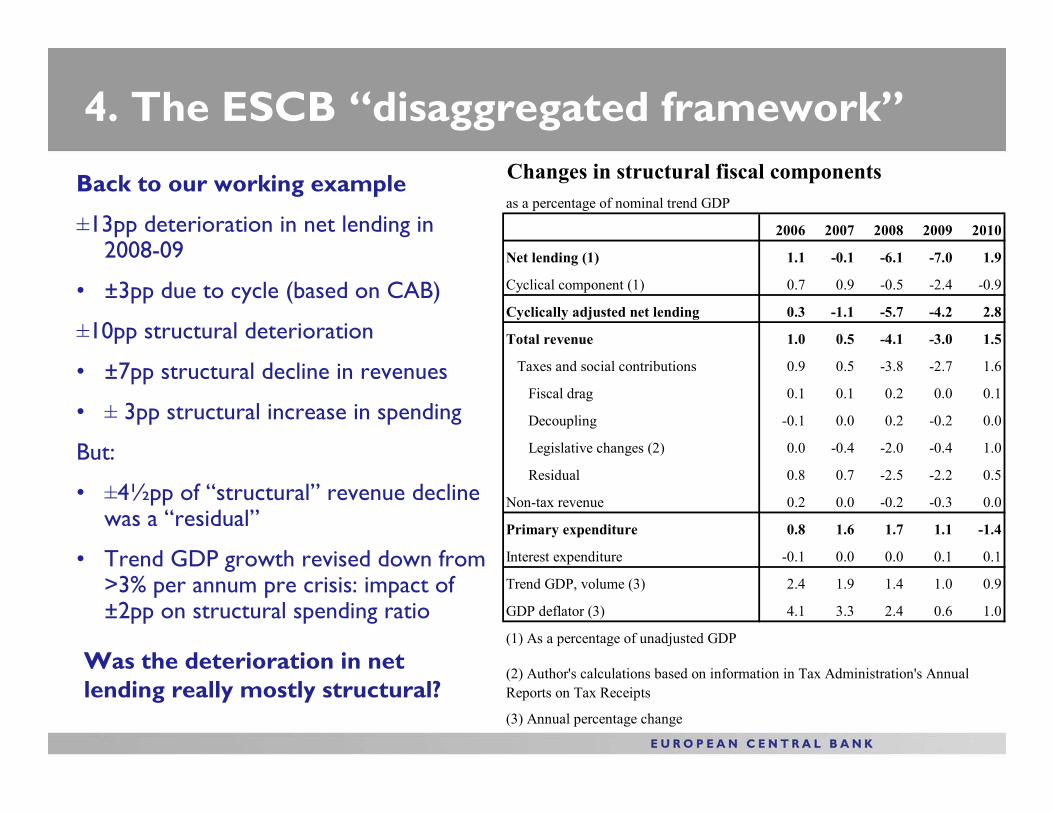
Back to our working example
±13pp deterioration in net lending in 2008-09
• ±3pp due to cycle (based on CAB)
±10pp structural deterioration
• ±7pp structural decline in revenues
• ± 3pp structural increase in spending
But:
• ±4½pp of “structural” revenue decline was a “residual”
• Trend GDP growth revised down from >3% per annum pre crisis: impact of±2pp on structural spending ratio
Was the deterioration in net lending really mostly structural?
2006 2007 2008 2009 2010
Net lending (1) 1.1 -0.1 -6.1 -7.0 1.9
Cyclical component (1) 0.7 0.9 -0.5 -2.4 -0.9
Cyclically adjusted net lending 0.3 -1.1 -5.7 -4.2 2.8
Total revenue 1.0 0.5 -4.1 -3.0 1.5
Taxes and social contributions 0.9 0.5 -3.8 -2.7 1.6
Fiscal drag 0.1 0.1 0.2 0.0 0.1
Decoupling -0.1 0.0 0.2 -0.2 0.0
Legislative changes (2) 0.0 -0.4 -2.0 -0.4 1.0
Residual 0.8 0.7 -2.5 -2.2 0.5
Non-tax revenue 0.2 0.0 -0.2 -0.3 0.0
Primary expenditure 0.8 1.6 1.7 1.1 -1.4
Interest expenditure -0.1 0.0 0.0 0.1 0.1
Trend GDP, volume (3) 2.4 1.9 1.4 1.0 0.9
GDP deflator (3) 4.1 3.3 2.4 0.6 1.0
(1) As a percentage of unadjusted GDP
(3) Annual percentage change
(2) Author's calculations based on information in Tax Administration's Annual Reports on Tax Receipts
Changes in structural fiscal components as a percentage of nominal trend GDP
4. The ESCB “disaggregated framework”
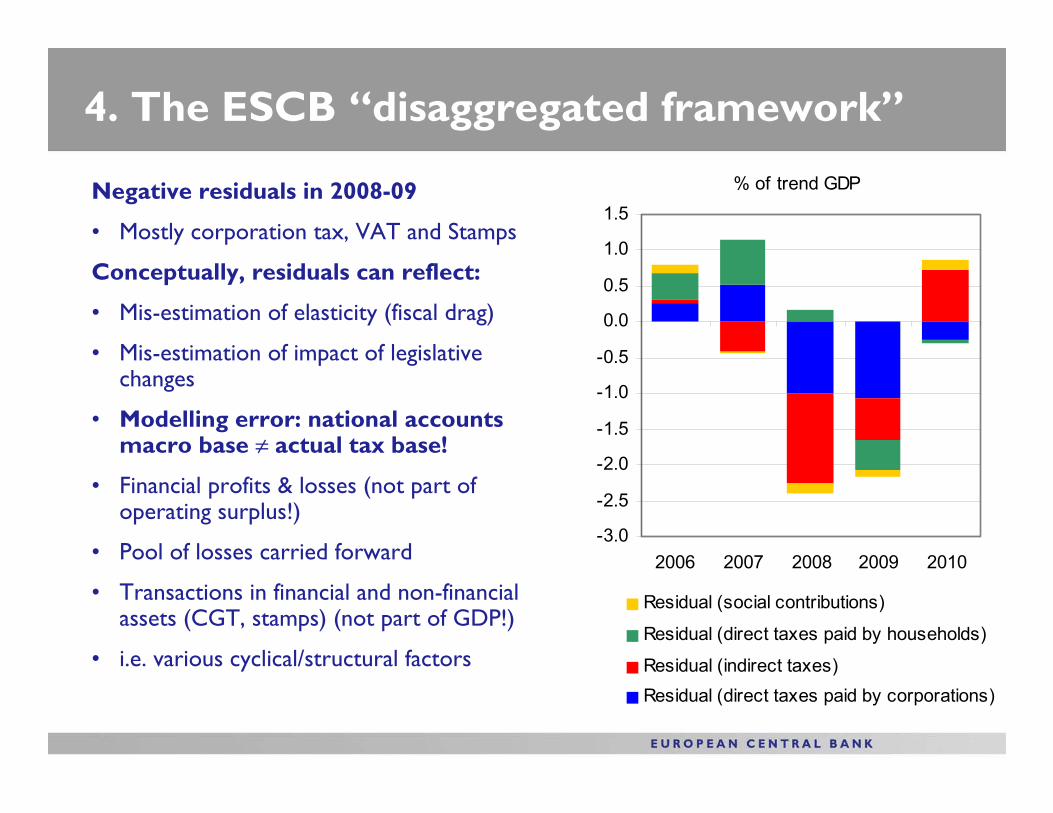
% of trend GDP
-3.0
-2.5
-2.0
-1.5
-1.0
-0.5
0.0
0.5
1.0
1.5
2006 2007 2008 2009 2010
Residual (social contributions)
Residual (direct taxes paid by households)
Residual (indirect taxes)Residual (direct taxes paid by corporations)
Negative residuals in 2008-09
• Mostly corporation tax, VAT and Stamps
Conceptually, residuals can reflect:
• Mis-estimation of elasticity (fiscal drag)
• Mis-estimation of impact of legislative changes
• Modelling error: national accounts macro base ≠ actual tax base!
• Financial profits & losses (not part of operating surplus!)
• Pool of losses carried forward
• Transactions in financial and non-financial assets (CGT, stamps) (not part of GDP!)
• i.e. various cyclical/structural factors
4. The ESCB “disaggregated framework”
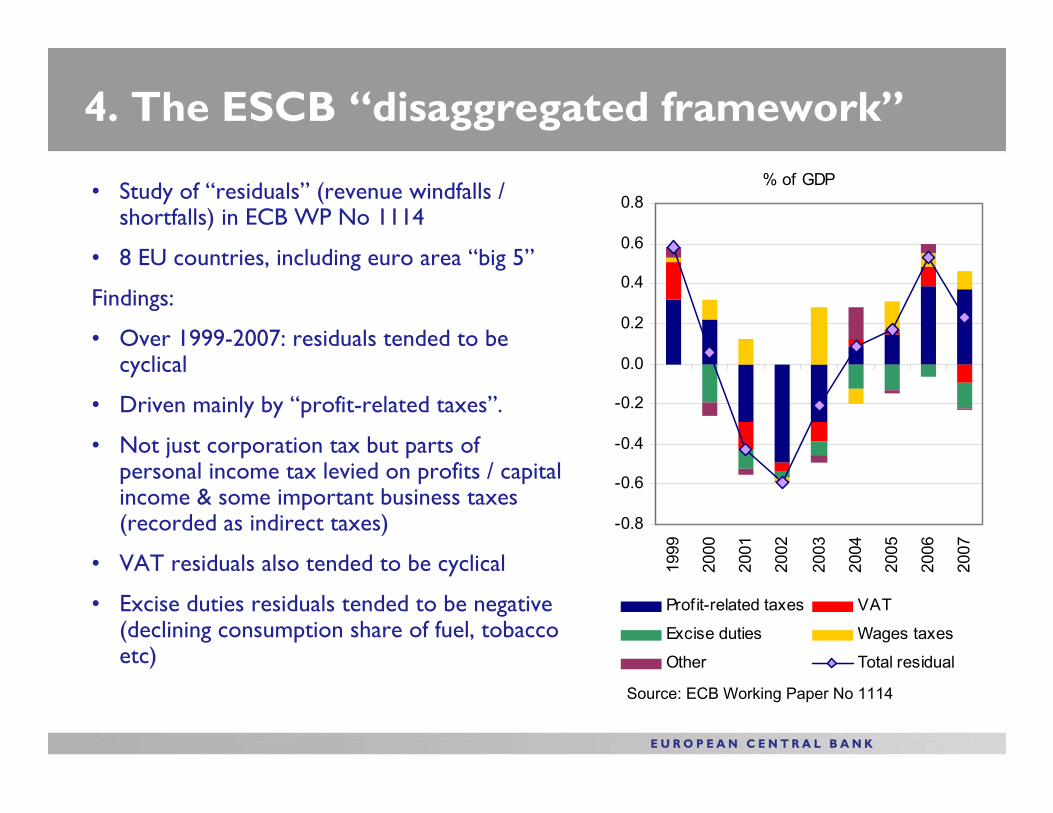
• Study of “residuals” (revenue windfalls / shortfalls) in ECB WP No 1114
• 8 EU countries, including euro area “big 5”
Findings:
• Over 1999-2007: residuals tended to be cyclical
• Driven mainly by “profit-related taxes”.
• Not just corporation tax but parts of personal income tax levied on profits / capital income & some important business taxes (recorded as indirect taxes)
• VAT residuals also tended to be cyclical
• Excise duties residuals tended to be negative (declining consumption share of fuel, tobacco etc)
% of GDP
-0.8
-0.6
-0.4
-0.2
0.0
0.2
0.4
0.6
0.8
1999
2000
2001
2002
2003
2004
2005
2006
2007
Prof it-related taxes VAT
Excise duties Wages taxes
Other Total residual
Source: ECB Working Paper No 1114
4. The ESCB “disaggregated framework”
annual percentage change
0.0
0.5
1.0
1.5
2.0
2.5
3.0
3.5
4.0
4.5
1999
2000
2001
2002
2003
2004
2005
2006
2007
2008
2009
2010
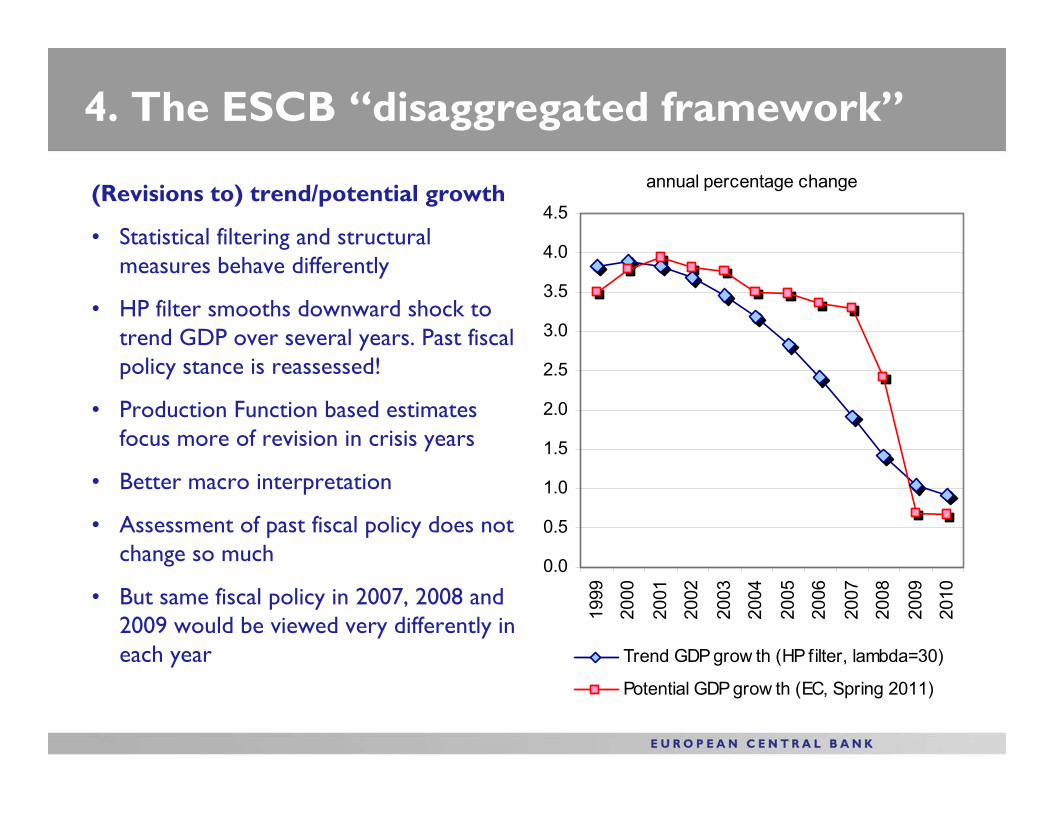
Trend GDP grow th (HP filter, lambda=30)
Potential GDP grow th (EC, Spring 2011)
(Revisions to) trend/potential growth
• Statistical filtering and structural measures behave differently
• HP filter smooths downward shock to trend GDP over several years. Past fiscal policy stance is reassessed!
• Production Function based estimates focus more of revision in crisis years
• Better macro interpretation
• Assessment of past fiscal policy does not change so much
• But same fiscal policy in 2007, 2008 and 2009 would be viewed very differently in each year
Concluding remarks
• Estimating the structural balance gives rise to many measurement problems (some well-known, some less well known)
• There is no perfect method. Different methods give different results and pose different measurement problems
Can / should CAB measurement be significantly improved?
• Measuring the output gap in real time will always be difficult (we do not have a crystal ball!)
• Would we want to go beyond adjusting for “real cycles”?
• If so, how would we forecast asset prices, number of transactions? How would we derive their equilibrium level?
• Some things (e.g. workings of corporation tax) are so complicated they will always create “residuals”
• Measurement issues are huge / insurmountable. Pretending to overcome them would be misleading
Concluding remarks
• Δ in cyclically adjusted (primary) balance ≠ discretionary fiscal policy
• Many non-discretionary factors are clearly structural (e.g. trend decline in share of consumption dedicated to fuel, tobacco, alcohol)
• For others, it may be difficult to know if they are structural or cyclical until long after the event
• What is “inside” and what is “outside” the cyclical component is less important than understanding the method and explaining the estimate
• Computing the structural balance is a first step. The analysis which follows is equally, if not more important!
Thank you for your attention!


