electrosense+: crowdsourcing radio spectrum decoding using
TRANSCRIPT

Electrosense+:Crowdsourcing Radio Spectrum Decoding using IoT Receivers
Roberto Calvo-Palominoa, Hector Cordobesa, Markus Engelc, Markus Fuchsc, Pratiksha Jaind,Marc Liechtid, Sreeraj Rajendranb, Matthias Schaferc, Bertold Van den Berghb, Sofie Pollinb,
Domenico Giustinianoa, Vincent Lenderse
aIMDEA Networks Institute, Madrid, SpainbDepartment ESAT, KU Leuven, Belgium
cSeRo Systems, GermanydTrivo Systems, Bern, Switzerland
earmasuisse, Thun, Switzerland
Abstract
Web spectrum monitoring systems based on crowdsourcing have recently gained popularity.These systems are however limited to applications of interest for governamental organizationsor telecom providers, and only provide aggregated information about spectrum statistics. Theresult is that there is a lack of interest for layman users to participate, which limits its widespreaddeployment. We present Electrosense+ which addresses this challenge and creates a general-purpose and open platform for spectrum monitoring using low-cost, embedded, and software-defined spectrum IoT sensors. Electrosense+ allows users to remotely decode specific parts ofthe radio spectrum. It builds on the centralized architecture of its predecessor, Electrosense, forcontrolling and monitoring the spectrum IoT sensors, but implements a real-time and peer-to-peercommunication system for scalable spectrum data decoding. We propose different mechanismsto incentivize the participation of users for deploying new sensors and keep them operational inthe Electrosense network. As a reward for the user, we propose an incentive accounting systembased on virtual tokens to encourage the participants to host IoT sensors. We present the newElectrosense+ system architecture and evaluate its performance at decoding various wireless sig-nals, including FM radio, AM radio, ADS-B, AIS, LTE, and ACARS.
Keywords: Radio Spectrum, Signal Decoding, Crowdsourcing
1. Introduction
The idea of web-based distributed radio applications has recently gained interest such as Web-SDR1, LiveATC2 and ElectroSense [1], motivated by the diversity in space of the spectrum andthe wide range of services benefiting from it. Multiple crowdsourcing initiatives have been pro-posed using various spectrum sensors ranging from low-end hardware [2–6] to expensive spec-trum analysers [7, 8]. These initiatives monitor the electro-magnetic spectrum in a distributedway and provide applications that target specific communities.
1http://www.websdr.org/2https://www.liveatc.net/
Elsevier Computer Networks- Final author copy May 11, 2020

Some of the major initiatives for analyzing the entire wireless electromagnetic spectrum areElectrosense [1], Microsoft Spectrum Observatory [9], Google TV White Space [10], IBM Hori-zon [11] and SpecNet [3]. Other initiatives focus instead on more specific monitoring appli-cations over a limited frequency range, such as remote radio monitoring stations in OpenWe-bRX [12], KiwiSDR [13] and WebSDR, live air traffic control (ATC) broadcasts from air trafficcontrol towers in LiveATC or aircraft monitoring systems such as OpenSky [14]. Airspy [15]provides a sensor client-server architecture to operate SDRs remotely, but it relies on the compu-tational power of the client-side to decode the signals, and high network bandwidth to send I/Qdata stream to the client.
All the above initiatives have severe drawbacks, such as limited use cases (e.g., focus onlyon FM radio decoding or spectrum analysis), lack of interest for layman users to host a sensor(dynamic spectrum access and anomaly detection do not attract the large audience), require ex-pensive SDRs or dedicated hardware (such as the Microsoft Observatory), poor scalability andcomplicated process to run measurement campaigns or access the data (sensors are busy), or highnetwork requirements for sending I/Q data to the client.
Our vision is that people are the primary operators of spectrum sensors. We aim at empow-ering people implementing a global spectrum monitoring system which let them connect to anyspectrum sensor in the network and decode any publicly decodable radio spectrum part, suchas broadcast and control messages, in real time through the Internet. In our system, spectrumanalysis, or applications such as dynamic spectrum access and anomaly detection become sec-ondary tasks, being active only if the sensor is not used by people. The overarching goal is tosupport low-cost and software-defined IoT (Internet-of-Things) [16] spectrum sensing devicesand to provide incentives for people to participate and host those sensors at their homes or orga-nizations, enhancing the mission of building a crowdsourcing spectrum monitoring system.
Our contributions are:
• We propose a novel radio spectrum decoding architecture where the primary operators arethe users. The architecture provides a transparent system to decoding the spectrum on theembedded sensors, and makes use of real-time peer-to-peer communication to send theinformation already decoded to the users.
• We implement the decoding process on the spectrum sensors in an efficient way alleviat-ing the processing load in the client, reducing the network bandwidth used, and adding asecurity-privacy layer since no raw data (I/Q) is sent to the users.
• We introduce an incentive for sensors’ owners to be part of the radio crowdsourcing commu-nity based on tokens. We propose a user rewarding system which also regulates the sensorusage rights in a fair manner for all users.
• We evaluate the architecture proposed in real scenarios with 6 different decoders: FM/AMradio, ADS-B, AIS, LTE, and ACARS. We compare our solution proposed in this work withthe existing related projects.
• We release Electrosense+ website publicly. Sensing module executed on the IoT sensor andthe API3 are released as open source to facilitate the integration of future decoders4.
3https://electrosense.org/api-spec4https://github.com/electrosense/es-sensor
2

2. Design Goals
Past web-based spectrum monitoring initiatives are either application-specific [12, 17] or donot scale well for remote signal decoding [1]. Scalability is challenged by the large data vol-umes needed for wideband spectrum monitoring, much higher than needed by typical IoT ap-plications. But, even with a larger bottleneck, we experienced that motivating users to deploysensors and keep their sensors operational is the main hurdle for the wide-spread deploymentof crowdsourced spectrum monitoring. The main reason is that the most interesting services forstakeholders that need to monitor the spectrum, such as governmental organizations and telecomproviders, are orthogonal to the interests of the vast majority of users.
In this work, we propose a novel radio monitoring architecture that addresses the main limita-tions of previous systems:General purpose decoding. The system architecture allows to decode any public decodablewireless technologies that is within range of the deployed sensors. As the spectrum is used bymany different wireless technologies and new technologies are emerging constantly, we supportthe integration of open source spectrum decoders developed by the community. The systemarchitecture thus defines open interfaces and APIs to allow easy integration of various decodertypes.Peer-to-peer architecture. As the system is expected to support a large number of concurrentusers and spectrum data is very large in nature, a centralized approach is unfeasible as it wouldcause a data deluge to the backend or large latency from the sensor to the consumer. In order tosupport real-time applications and scale well, Electrosense+ supports peer-to-peer communica-tion between the spectrum sensors and the users.Sensor owners incentive. Since in crowdsourcing initiatives, people are expected to acquire andrun a spectrum sensor node on their own, good incentives are needed to foster participation. Thisincludes rewards for hosting a spectrum sensor but also to provide valuable spectrum servicesthat they will get in return. In Electrosense+, spectrum services are provided to the users in theform of spectrum apps and sensor owners receive tokens for the time their sensors are online andused by the community.Security & privacy. Spectrum data can contain private information and there should be lim-itations on some specific frequencies about the information type that users can listen to. Forexample, the system should not allow users to listen to private voice or other text conversations.It can instead decode broadcast and control messages. To this end, Electrosense+ does not trans-mit raw I/Q data to the users but only aggregated spectrum data and filtered decoded data. Thatway, Electrosense+ keeps full control over the data that users will receive by enforcing strictintegration policies on which decoders are allowed to run on the sensors and data is filtered.
3. Architecture
The Electrosense+ architecture is depicted in Figure 1. The main system components are thesensor, the client, and the backend. While these components were all present in the originalElectrosense design, the novelty is to enable direct peer-to-peer connections between the sensorand clients in order to provide direct decoding services (apps) for users, and to account for theusage patterns in order to reward sensor operators. In this section, we focus on the new requiredarchitectural components for these enhancements while we refer to [1] for a description of theoriginal Electrosense design. Electrosense+ is fully backward compatible with previous versionsof the system.
3

USER/CLIENT
BROWSER
DBCONTROLLER
BACKEND APPS
OPEN APISENSOR
SIGNALING
SERVERSTUN
LDAP
COLLECTOR
BACKEND
Control/Datachannel
Audiochannel(SRTP)
Connectioninit (1)
Connection init request (2)Campaign
configurationsensor availability
PSD data
Decoding campaign (3)
Figure 1: Full overview Electrosense+ architecture
3.1. Signaling and Controlling
The sensors are managed by the Electrosense+ backend over secure messaging via theMQTT [18] protocol. The client-sensor connection is handled over the WebRTC protocol suite.WebRTC [19] is used in well-known applications such as Google Hangouts and Facebook Mes-senger providing real-time communication (RTC) capabilities integrated in web browsers withoutusing dedicate plugins for this task. At an initial communication state, client and sensor need toexchange meta-data to coordinate the communication using the signaling server. The SessionTraversal Utilities for NAT (STUN) server allows to find the public IP address of the client andsensor in order to provide a direct connection between them, even if they are located behindfirewalls or Network Address Translators (NAT).
When a client wants to connect to a sensor, it signals a request through the signaling server andestablishes a direct connection to the sensor (without passing through the Electrosense+ back-end). Then, two different channels are created: control/data channel and Audio channel (asFigure 1 shows). The control/data channel is a bi-directional channel used to send the spectruminformation and data decoded from the sensor to the client, and to command the sensing parame-ters from the client to the sensor (frequency, gain, etc.). The Audio channel is exclusively used tostream audio in real time from the sensor to the client using Secure Real Time Protocol (SRTP).This peer-to-peer communication minimizes the network delays between the client and sensor,providing a fast and scalable access the data from the sensor node.
When there are no users that are connected to a particular sensor, the sensor is instructed by thecontroller to sweep the spectrum or launch a specific campaign. As soon as a client connects to asensor the peer-to-peer communication is established. Then, the client gets access to the sensingparameters (frequency, gain, etc.). Clients can remotely tune to any radio frequency and thusinfluence which decoder is activated in the sensor, e.g., if the RTL-SDR is tuned to the FM radio
4
AntennaRF
Front-endEmbedded
board
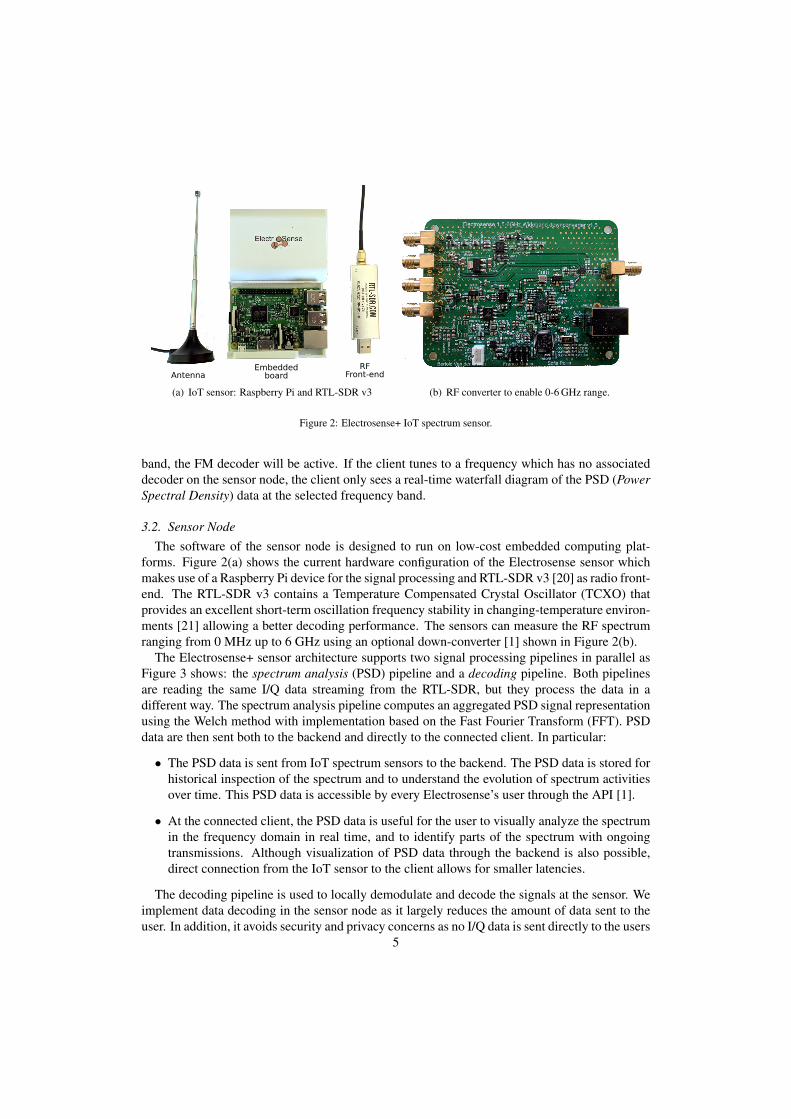
(a) IoT sensor: Raspberry Pi and RTL-SDR v3 (b) RF converter to enable 0-6 GHz range.
Figure 2: Electrosense+ IoT spectrum sensor.
band, the FM decoder will be active. If the client tunes to a frequency which has no associateddecoder on the sensor node, the client only sees a real-time waterfall diagram of the PSD (PowerSpectral Density) data at the selected frequency band.
3.2. Sensor NodeThe software of the sensor node is designed to run on low-cost embedded computing plat-
forms. Figure 2(a) shows the current hardware configuration of the Electrosense sensor whichmakes use of a Raspberry Pi device for the signal processing and RTL-SDR v3 [20] as radio front-end. The RTL-SDR v3 contains a Temperature Compensated Crystal Oscillator (TCXO) thatprovides an excellent short-term oscillation frequency stability in changing-temperature environ-ments [21] allowing a better decoding performance. The sensors can measure the RF spectrumranging from 0 MHz up to 6 GHz using an optional down-converter [1] shown in Figure 2(b).
The Electrosense+ sensor architecture supports two signal processing pipelines in parallel asFigure 3 shows: the spectrum analysis (PSD) pipeline and a decoding pipeline. Both pipelinesare reading the same I/Q data streaming from the RTL-SDR, but they process the data in adifferent way. The spectrum analysis pipeline computes an aggregated PSD signal representationusing the Welch method with implementation based on the Fast Fourier Transform (FFT). PSDdata are then sent both to the backend and directly to the connected client. In particular:
• The PSD data is sent from IoT spectrum sensors to the backend. The PSD data is stored forhistorical inspection of the spectrum and to understand the evolution of spectrum activitiesover time. This PSD data is accessible by every Electrosense’s user through the API [1].
• At the connected client, the PSD data is useful for the user to visually analyze the spectrumin the frequency domain in real time, and to identify parts of the spectrum with ongoingtransmissions. Although visualization of PSD data through the backend is also possible,direct connection from the IoT sensor to the client allows for smaller latencies.
The decoding pipeline is used to locally demodulate and decode the signals at the sensor. Weimplement data decoding in the sensor node as it largely reduces the amount of data sent to theuser. In addition, it avoids security and privacy concerns as no I/Q data is sent directly to the users
5

RTL-SDR
BROWSERSENSOR
Driver
USER/CLIENT
PSD Pipeline
Resampler
Decoder
(To collector)
Decoding Pipeline
PSD data
I/Q
I/Q
Decoded dataData
channel
Controlchannel
Audiochannel
I/Q Pipeline
Figure 3: User-Sensor communication diagram.
which would allow them to decode any wireless signals, even those that may contain sensitivepersonal data. The sensor has multiple decoders to decode different parts of the spectrum. Sofar, we have integrated existing open source decoders including FM radio, AM radio, ADS-B /ACARS (air traffic signals), AIS (ships tracking), and LTE cell broadcasting. In the future, weplan to integrate many more technologies such as e.g., DAB, DVB-T, GSM cell broadcasting,LORA, Sigfox, etc. Given the limited resources of the embedded computing sensor platform,only one decoder is active on each sensor at the same time.
We have defined standard input and output interfaces to facilitate the integration of existing andfuture decoders that may be provided by the open source community. The input interface (usedbetween the sensing software and the decoder) is an UDP socket over which the decoder canread the sampling parameters and I/Q data in chunks. For the output interfaces (used betweenthe decoder and web-browser), we differentiate between a message and a streaming interfacedepending on the type of data that is decoded. Text data is sent as a JSON object over an UDPsocket. For audio and video, the data is streamed over an UDP socket in a raw format.
Since the sampling rate that the decoders expect may be different from the configured RTL-SDR sampling rate, a re-sampler is implemented in front of the decoder to provide the samplingrate that the decoder requires. The re-sampler is also useful to decimate the I/Q data for per-formance reasons as some decoders consume too much CPU processing power on the limitedhardware of the sensors when the sampling rate is too large.
3.3. Reward Model
Incentives for motivating people have been studied [22–24] in crowdsourcing systems focusingin the bootstrap stage of the project, where a significant scale of deployment is needed to reach acorrect system operation where sensor owners can get benefits.
We propose a virtual accounting system based on virtual tokens, that provides two main fea-tures in our system. First, it helps to regulate the access to the sensors and distribute the rights
6

Table 1: Rewarding system notation
Notation DescriptionK Token of the network.Ppsd Tokens paid for sensing time in PSD campaignPdec Tokens paid for sensing time in DEC campaignRs,psd Reward obtaining by executing PSD campaignRs,dec Reward obtaining by executing DEC campaignDs Sensor density in a regionT Total live time of the networkts absolute time when a sensor is deployed (∈ [1, T ])to total operational time of a sensor (∈ [0, T ])Eo Earnings of sensor ownerCn Cost of the networkEn Earnings of the networkBn Benefits of the network
among users in a fairly manner. And second, it is used as an incentive for people to host sensorssince they will be rewarded for deploying and hosting sensors.
The sensor provides two operational modes: PSD and decoding. If no users are consumingdata from the decoding pipeline, the sensor will operate in PSD mode. A user spends tokensconsuming data from the decoding pipeline of a specific sensor. Then, those tokens will be usedto first, reward the sensor owner and second, sustain the network.
Rewarding model for sensor owners. Our rewarding model issues tokens to users whichoperate Electrosense+ sensors. The model rewards people hosting sensors depending on threedifferent factors.
• Sensor density: The less density of sensors in a region, the greater the owner’s earning. Inthis way the model incentives people to deploy sensors in areas not currently covered.
• Deployment time: The model rewards sensors deployed at the beginning of the project, tomotivate people join the initiative at early stage to make the network grow quickly.
• Operational time: The longer the sensor is operating in any pipeline, the higher the earningsfor the sensor owner.
More formally, the user earnings in a given time t is computed as follows (see Table 1 forbetter understanding):
Eo = Rs,psd +Rs,dec (1)
Rs,i = Pi ·1
log(Ds)︸ ︷︷ ︸sensor density
· T
ts︸︷︷︸deployment time
· 1
1 + e−to︸ ︷︷ ︸operational time
, (2)
7

where i ∈ {psd, dec}.
Eo = Rs,psd + F ·Rs,dec, (3)
where F ∈ {0, 1}.
Therefore the cost (C), earnings (E) and benefits (B) of the network (n) are:
Cn =
∞∑s=1
(Rs,psd + F ·Rs,dec) (4)
En =
∞∑s=1
(1− F ) ·Rs,dec (5)
Bn = En − Cn; (6)
In other words, the tokens paid by an user for using the decoding pipeline are split (usingfactor F) between the owner of the sensor and the network. Therefore the profitability of thenetwork depends on 1) how much the decoding pipeline is used and 2) the factor F.
To avoid abuse, Electrosense+ backend checks regularly the sensor quality, using the fre-quency of connections of other users to the sensor as metric. The latter is most likely a goodindicator that the sensor is deployed at a good location with a good antenna. This approach couldalso be combined with more sophisticated algorithms in the backend based on signal learningcapabilities [25] and anomaly detection [26].
3.4. Security and PrivacyWhile the Electrosense+ architecture allows in principle to decode any type of wireless signals
that fall in the frequency range of our sensors, we enforce a strict policy on the allowed decodersin the sensors in order to prevent from disclosing personal information to Electrosense users.The decoders and their operational frequencies are set by Electrosense+ to make sure that anydecoded data provided by sensors does not violate any private information. Although the user canpropose, implement and even run new decoders on the sensor side, the backend architecture andthe web interface will not allow untrusted decoders avoiding privacy leaks. Furthermore, ded-icated GUI interfaces are implemented in the Electrosense+ network only for trusted decoders.Figure 1 shows how the signaling server is the responsible of initiating the connection betweenthe browser (client) and the sensor, as long as the credentials and selected decoder are correct.Therefore, users are not allowed to integrate and deploy new decoders in the Electrosense+ net-work by themselves.
By allowing users to listen to the content of such communication would violate the privacyof people using those devices. Our policy is thus to integrate only decoders for broadcast com-munication systems and for public control signalling messages. For example, in this work, wehave implemented decoders for FM/AM radio, ADS-B and AIS (broadcasting systems). Thesedecoders are integrated in the decoding pipeline on the sensor (see decoder block in Figure 3)where they read IQ samples as input and send the decoded data to the user through the data chan-nel. The implementation of every decoder depends on the signal to be decoded. For communica-tion systems such as LTE or ACARS, we only decode the signalling and management messageswhich are sent broadcast over the channel. As these messages are meant to be received by allreceivers in the neighborhood, they do not pose a threat to the privacy of the users. Electrosensenetwork does not accept or integrate decoders that aim to decode unicast communication.
8

Table 2: Decoders, operational frequencies/bandwidths and open source projects.
Decoder Frequencies Bandwidth Project
AM radio 153 kHz - 30 MHz 60 kHz SciPy.org
FM Radio 88-108 MHz 240 kHz SciPy.org
acars 129-136 MHz 2.4 MHz acarsdec
AIS 161-162 MHz 1.6 MHz rtl-ais
ADS-B 1090 MHz 2.0 MHz dump1090
LTE-Cell 700 - 3500 MHz 1.92 MHz LTE-Cell
3.5. Spectrum ApplicationsSpectrum services are provided to the users by means of spectrum apps that give valuable
information. The Electrosense+ architecture is scalable and versatile enough to empower all usecases. The most widespread use of the wireless spectrum is however to broadcast information,and a primary set of spectrum apps focuses on the decoding of such broadcast information. Asthis broadcast information is intended for the general public, and not encrypted, hence there areno privacy concerns.
A first generation of Electrosense+ spectrum apps focuses on the decoding of broadcast sig-nals that are of interest to a broad audience, such as AM and FM signals, but also ADS-B, AISor ACARS messages and LTE cells (see Table 2). These applications make use of the lower fre-quency bands, making it easier to achieve good coverage with a limited number of Electrosense+sensors. As the system scales to higher deployment densities, also higher frequency signals canbe added. We note that the frequencies for AM signals are not covered by a standard RTL-SDR dongle, but with the Electrosense expansion board [1] also lower (and higher) frequenciesranging from DC to 6 GHz can be covered.
4. User Interface
The user interface plays an important role in this work to empower people to use Electrosense+for decoding radio signals of the electromagnetic spectrum. Using standard technologies thatexecute in web browsers allows us to reach a great number of users which do not have any signalprocessing knowledge. Figure 4(a) shows the interface when the user has selected the FM radiodecoder and tunes the receiver at 105 MHz. The user can visually inspect the spectrum in thatband by checking the PSD data. Although the decoder focuses in a narrow band for decoding theFM radio channel (180 kHz), we show the spectrum information of a wider band (2.4 MHz) fora better understanding of the spectrum by the user. The user can distinguish where transmissionsare going on by checking the power in different frequencies. The user can click on the interestedchannel and he/she will start listening the current FM radio station. This audio streaming is sentusing the direct audio channel between the sensor and the client. The user also can set differentsensing parameters as the DC gain or the volume used by the decoder, or even the power scaleto identify better the spectrum and transmissions. In order to help users to identify where the
9

PSD Plot
Decoders
Pow
er
Sca
le
Automatic channel identification
(a) FM Radio.
PSD Plot
Pow
er
Sca
le
(b) ADS-B aircraft messages.
Figure 4: User interface for visualizing the spectrum and decoding.
transmissions are, an automatic channel identification algorithm runs in the browser for detectingthe transmissions using the PSD data, and identifies where FM radio channels are located. A redrectangle is shown in the web interface for every FM radio channel detected (see Figure 4(a))which makes it easier for the user to select another FM radio channel.
Figure 4(b) shows the interface when the user configures the sensor to decode ADS-B mes-sages (aircraft continuously broadcast their position and other control information). Using thedata channel, the sensor sends the PSD data to the client and also sends the information decodedon the sensor. In this case, the ADS-B decoder decodes the messages that aircraft send withinformation about their location. All this information is collected by the sensor and shown to theuser in a map in the web interface.
5. Evaluation
In this section, we evaluate the performance of Electrosense+ as a real-time system for de-coding the spectrum remotely, the rewarding model and the scalability of the system. The Elec-trosense+ sensors are based on the RaspberryPi-3B+ and the RTL-SDR radio receiver [20]. TheRaspberryPi-3B+ has a Cortex-A53 processor and 1 GB of RAM, representing a typical low-costIoT device.
5.1. CPU Load and ThroughputThe software executed on the RaspberryPi-3B+ is split in three main components: (1) sensing,
which is responsible to execute the different pipelines to provide PSD data to the client and IQdata to the decoders; (2) WebRTC, which manages the communication between the sensor andthe client; and (3) signal decoders. Table 3 shows the CPU load for the three software componentsand for every implemented decoder. The minimum CPU load of the sensing component (11%)occurs when only the PSD data is computed. When one of the decoder is enabled, the sensingprocess also needs to execute the resampler process, increasing the CPU load (14-24%). The load
10

Table 3: CPU Load on the Electrosense+ sensor and throughput for every decoder.
DecoderCPU (%)sensing
CPU (%)Web-RTC
CPU (%)decoder
CPU (%)Total
Throughput(kb/s)
PSD 11 0.1 - 11.1 120-140
FM radio 24 6.5 24.6 55.1 40-50
AM radio 22 6.2 10 38.2 40-50
ADS-B 14 0.2 4 18.2 190-200
AIS 20 0.1 6.2 26.3 50-60
acars 23 0.1 8.1 31.2 90-100
LTECell 21 0.2 48 69.2 10
depends on the bandwidth and sampling rate that is expected by the decoder (see Table 2). TheWebRTC CPU load is very low (0.1-0.2%) since the only task is to manage the communication ofthe data/audio channel. For the case that FM/AM decoders are enabled, the WebRTC componentalso needs to resample the audio stream to make the audio compatible with the expected audioinput of the browsers. This increases the CPU load up to 6% for this component. The CPU loadfor every decoder and the total CPU is shown in Table 3. The decoders who use the CPU the mostare FM radio and LTECell, but still the RaspberryPi has enough resources to properly processand deliver the decoded data in real time. While the FM/AM radio decoders have a constantCPU usage, other decoders such as LTECell only consume CPU resources for a specific amountof time (≈ 10 sec.) to compute the information that is delivered to the client.
The network bandwidth is also shown in Table 3. The data throughput for AM/FM decoderstogether with PSD is less than 200 kb/s, which is reasonable for most of the broadband internetconnections nowadays. Other existing solutions like Airspy [15] (based on rtl tcp) make a moreintensive use of the network reaching 300-1000 kb/s for the same AM/FM decoding purpose.The maximum network throughput is used by the ADS-B decoder which together with the PSDdata reaches 350 kb/s, still a data rate affordable for most home Internet users.
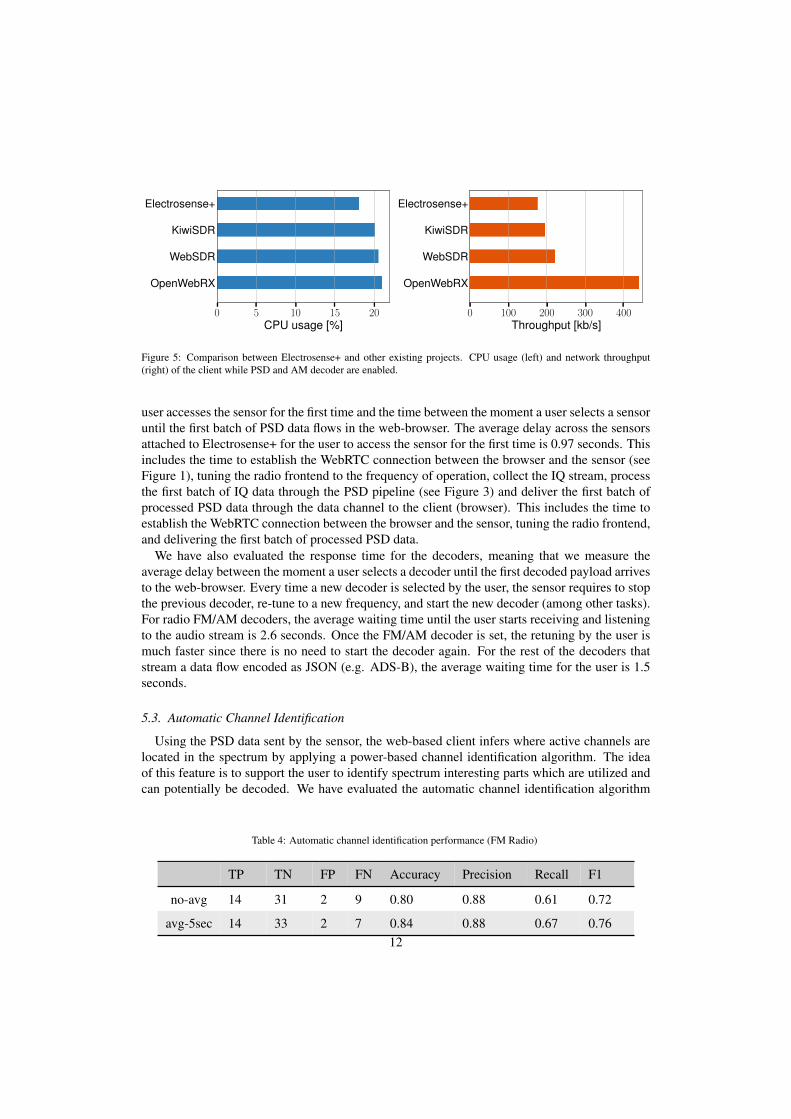
5.1.1. Comparison with existing solutionsWe perform a comparison between Electrosense+ and other existing projects in terms of CPU
and network bandwidth used in the user side. All tested solutions allow to decode spectrumremotely and show information already processed in the web-browser. We have selected AMdecoder to perform this comparison since is the common one along all the solutions tested. Weuse Mozilla Firefox web-browser to perform this test. Figure 5 shows the comparison betweenElectrosense+ and KiwiSDR, WebSDR and OpenWebRX. Electrosense+ performs slightly betterthan other solutions in both metrics CPU usage and network throughput.
5.2. Real Time Response
Since the new Electrosense+ architecture is built to provide a user experience close to real timefor decoding signals, it is important to measure the time delays for the main tasks that can beperformed by the user in the user interface (UI). We want to measure the response time when the
11
0 5 10 15 20CPU usage [%]
Electrosense+
KiwiSDR
WebSDR
OpenWebRX
0 100 200 300 400Throughput [kb/s]
Electrosense+
KiwiSDR
WebSDR
OpenWebRX
Figure 5: Comparison between Electrosense+ and other existing projects. CPU usage (left) and network throughput(right) of the client while PSD and AM decoder are enabled.
user accesses the sensor for the first time and the time between the moment a user selects a sensoruntil the first batch of PSD data flows in the web-browser. The average delay across the sensorsattached to Electrosense+ for the user to access the sensor for the first time is 0.97 seconds. Thisincludes the time to establish the WebRTC connection between the browser and the sensor (seeFigure 1), tuning the radio frontend to the frequency of operation, collect the IQ stream, processthe first batch of IQ data through the PSD pipeline (see Figure 3) and deliver the first batch ofprocessed PSD data through the data channel to the client (browser). This includes the time toestablish the WebRTC connection between the browser and the sensor, tuning the radio frontend,and delivering the first batch of processed PSD data.
We have also evaluated the response time for the decoders, meaning that we measure theaverage delay between the moment a user selects a decoder until the first decoded payload arrivesto the web-browser. Every time a new decoder is selected by the user, the sensor requires to stopthe previous decoder, re-tune to a new frequency, and start the new decoder (among other tasks).For radio FM/AM decoders, the average waiting time until the user starts receiving and listeningto the audio stream is 2.6 seconds. Once the FM/AM decoder is set, the retuning by the user ismuch faster since there is no need to start the decoder again. For the rest of the decoders thatstream a data flow encoded as JSON (e.g. ADS-B), the average waiting time for the user is 1.5seconds.
5.3. Automatic Channel Identification
Using the PSD data sent by the sensor, the web-based client infers where active channels arelocated in the spectrum by applying a power-based channel identification algorithm. The ideaof this feature is to support the user to identify spectrum interesting parts which are utilized andcan potentially be decoded. We have evaluated the automatic channel identification algorithm
Table 4: Automatic channel identification performance (FM Radio)
TP TN FP FN Accuracy Precision Recall F1
no-avg 14 31 2 9 0.80 0.88 0.61 0.72
avg-5sec 14 33 2 7 0.84 0.88 0.67 0.7612

performance over FM radio bands. As Table 4 shows, using a 5 seconds averaging window overthe PSD stream data, our model is 84% accurate with a precision of 0.88 (low false positive rate).Applying an averaging window over the PSD data has two positive effects: 1) reducing the noiseand thus improving the algorithm performance, and 2) requiring less computation power on theclient side.
5.4. Rewarding model
We perform an evaluation of the rewarding model detailed in Section 3.3. We have also addedan illustrative example for a better understanding. Figure 6 (top) shows the owner earnings, de-pending on the activated pipeline, with respect to the density of sensors, time the sensor wasdeployed and operational time. The earnings are normalized with respect to the maximum num-ber of tokens available at any time. In the study, the network establishes the maximum operatingtime for the decoding pipeline in each sensor to 80% of the total operational time.
Network earnings, costs and benefits. The network must be self sustainable making surethat generates enough benefits in order to deal with the network cost. Figure 6 (bottom) showsthe network earnings (users spending tokens to access the decoding pipeline), network costs(sensor owners receiving tokens by keeping their sensors operative), and network benefits. TheElectrosense+ network has a profit margin applying this reward model as long as the decod-ing pipeline is enabled 23% of the time in average. This value can be tuned by increasing ordecreasing the benefits of the network.
Illustrative example. Let us assume that the network was created 500 days ago, thereforeT = 500. The rewarding model is evaluated every week taking in to account the sensor density,
101 102
density [sensors / km2]
0
0.2
0.4
0.6
0.8
1
use
r earn
ings
[toke
ns] decoding
psd
100 101 102
deployment time [iterations]
0
0.2
0.4
0.6
0.8
1
use
r earn
ings
[toke
ns] decoding
psd
100 101 102
operational time [iterations]
0
0.2
0.4
0.6
0.8
1
use
r earn
ings
[toke
ns] decoding
psd
10 20 30 40 50 60 70 80decoding campaign usage [%]
0
0.2
0.4
0.6
0.8
1
toke
ns
Network costNetwork earningsNetwork benefits
Figure 6: Rewarding system for sensor owners (top) and network costs, earnings and benefits (bottom). Earnings arenormalized to the maximum of tokens available.
13

deployment time and operational time. For the sake of simplicity, the network is composed byonly 2 sensors located in different cities. Both sensors were deployed at ts = 1 (when thenetwork started). For sensor1 the operational time of the PSD pipeline is 7 days, and 1 dayfor the decoding pipeline. For sensor2 the operational time of the PSD pipeline is 7 days, butin this case it has 3 operational days in the decoding pipeline. The earning of the network isobtained by charging tokens (K) for decoding pipeline consuming. Every week, the rewardingsystem is evaluated to compute earnings of both network and users. In our example, during theprevious week 4 days of decoding operation were observed among all sensors of the network.Assuming that Pdec = 5K, Ppsd = 1K, F = 0.4. In common, the two sensors have beenoperating in decoding for 4 days, and in PSD for 10 days. The network have charged 4days ∗Pdec ∗ (1 + F ) = 28 K to other users for using decoding pipeline. The earnings of the networkare F ∗ 28 K = 11.2 K, therefore we have 16.8 K to paid the sensor owners rewards for thisweek. The operational time of decoding is paid 5 times higher that the operational time of psd,therefore Pdec = 16.8 ∗ (5/6) = 14 K, Ppsd = 16.8 ∗ (1/6) = 2.8 K. The difference betweenthe two sensors of this toy example is the operational time on the decoding pipeline. Thereforethe system will reward with more tokens to sensor2 due to the higher operational time in thedecoding pipeline. Sensor1 will be rewarded by 1.4 tokens (PSD) and 3.78 tokens (decoding),while sensor2 will be rewarded by 1.4 tokens (PSD) and 8.82 tokens (decoding).
5.5. ScalabilityElectrosense+ architecture takes advantage of peer-to-peer communication between the sensor
and the user. The system scalability depends on the traffic load of the signaling server (see Fig-ure 1) which handles the control messages (connection request, keep alive, etc). These messagesrepresent less than 2 kb/s per sensor, meaning that one instance of the signaling server with a 50Mb/s symmetric network can manage more than 25K sensors at once.
From the sensor point of view, the current version of Electrosense+ supports one single userconnected to the sensor at the same time to avoid the saturation of the network connection of thesensor owner. To avoid abuse for one single user we have implemented the reward model thatlimits somehow the time that a single user can be connected to a sensor. In addition, multipleuser connections asking for different decoders are not allow since Electrosense+ sensors haveonly one radio front-end.
6. Conclusion
We have presented Electrosense+, a system that allows users to remotely decode specific partsof the radio spectrum using IoT sensors. Electrosense+ is built on top of its centralized-approachpredecessor [1], and provides a new peer-to-peer communication among clients and sensors toexchange information and make the system scalable. We have proposed a reward model toprovide incentives to people to deploy and keep sensors running while making the network de-ployment sustainable over time. The system architecture allows to decode any broadcast wirelesssignal that is within range of the sensors. We have integrated several publicly available decodersthat are not intrusive to the privacy of the wireless users. The decoders operate on the sensor-sideand we have optimized their computational performance to run in embedded and IoT devices.We manage to keep the average CPU load of the IoT sensors below 40% in most of the cases,even when the PSD and decoding pipeline are executed on the sensor at the same time. Thecommunication channel is also implemented in an efficient way, which allows to keep the net-work bandwidth low between the sensor and the client: for streaming a single audio channel to
14

the user the bandwidth needed is 50 kb/s, while for sending data (e.g. generated by the ADS-Bdecoder) the bandwidth used can go up to 200 kb/s. In both cases the network bandwidth is low,allowing the users to connect to the system using conventional home Internet connections andWiFi hotspots. We have implemented a friendly web-interface (platform independent) to easilyinteract with the sensors. Electrosense+ provides the opportunity to gain better knowledge andunderstanding of the spectrum utilization, by offering remotely signal decoding capabilities anddirect incentives for sensor owners to deploy spectrum sensors and keep them running.
Acknowledgments
This research work by IMDEA Networks Institute was sponsored in part by armasuisse un-der the Cyber and Information-Research-Program, the NATO Science for Peace and SecurityProgramme under grant G5461, and Madrid Regional Government through TAPIR-CM projectS2018/TCS-4496.
References
[1] S. Rajendran, R. Calvo-Palomino, M. Fuchs, B. V. den Bergh, H. Cordobes, D. Giustiniano, S. Pollin, V. Lenders,Electrosense: Open and big spectrum data, IEEE Communications Magazine 56 (2018) 210–217.
[2] A. Chakraborty, M. S. Rahman, H. Gupta, S. R. Das, Specsense: Crowdsensing for efficient querying of spectrumoccupancy, in: IEEE INFOCOM 2017-IEEE Conference on Computer Communications, IEEE, pp. 1–9.
[3] A. Iyer, K. K. Chintalapudi, V. Navda, R. Ramjee, V. Padmanabhan, C. Murthy, SpecNet: Spectrum Sensing SansFrontieres, in: 8th USENIX Symposium on Networked Systems Design and Implementation (NSDI), USENIX,2011.
[4] N. Kleber, A. Termos, G. Martinez, J. Merritt, B. Hochwald, J. Chisum, A. Striegel, J. N. Laneman, Radiohound: Apervasive sensing platform for sub-6 ghz dynamic spectrum monitoring, in: Dynamic Spectrum Access Networks(DySPAN), 2017 IEEE International Symposium on, IEEE, pp. 1–2.
[5] A. Nika, Z. Li, Y. Y. Zhu, Y. Y. Zhu, B. Y. Zhao, X. Zhou, H. Zheng, Empirical Validation of Commodity SpectrumMonitoring, in: Proceedings of 14th ACM Conference on Embedded Networked Sensor Systems (SenSys 2016).ACM, ACM SenSys ’16, pp. 96–108.
[6] G. Baruffa, M. Femminella, M. Pergolesi, G. Reali, Comparison of mongodb and cassandra databases for sup-porting open-source platforms tailored to spectrum monitoring as-a-service, IEEE Transactions on Network andService Management (2019).
[7] M. Zheleva, R. Chandra, A. Chowdhery, A. Kapoor, P. Garnett, TxMiner: Identifying transmitters in real-worldspectrum measurements, in: IEEE DySPAN, pp. 94–105.
[8] Microsoft spectrum observatory, http://observatory.microsoftspectrum.com/, 2019.[9] A. Chowdhery, R. Chandra, P. Garnett, P. Mitchell, Characterizing spectrum goodness for dynamic spectrum
access, in: 2012 50th Annual Allerton Conference on Communication, Control, and Computing (Allerton), IEEE,pp. 1360–1367.
[10] Google spectrum database, https://www.google.com/get/spectrumdatabase/, 2019.[11] Ibm blue horizon, https://bluehorizon.network/documentation/sdr-radio-spectrum-analysis, 2019.[12] Openwebrx, https://sdr.hu/openwebrx, 2019.[13] Kiwisdr: Wide-band sdr + gps cape for the beaglebone black, http://kiwisdr.com/, 2019.[14] M. Schafer, M. Strohmeier, V. Lenders, I. Martinovic, M. Wilhelm, Bringing up opensky: A large-scale ads-b
sensor network for research, in: Proceedings of the 13th international symposium on Information processing insensor networks, IEEE Press, pp. 83–94.
[15] Airspy, https://airspy.com/, 2019.[16] M. Hung, Leading the iot, gartner insights on how to lead in a connected world, Gartner Research (2017) 1–29.[17] Websdr, http://www.websdr.org/, 2019.[18] U. Hunkeler, H. L. Truong, A. Stanford-Clark, Mqtt-s: A publish/subscribe protocol for wireless sensor networks,
in: Communication Systems Software and Middleware and Workshops, 2008., pp. 791–798.[19] B. Sredojev, D. Samardzija, D. Posarac, Webrtc technology overview and signaling solution design and implemen-
tation, in: 2015 38th International Convention on Information and Communication Technology, Electronics andMicroelectronics (MIPRO), IEEE, pp. 1006–1009.
15
[20] Rtl-sdr-v3 datasheet, https://www.rtl-sdr.com/wp-content/uploads/2018/02/RTL-SDR-Blog-V3-Datasheet.pdf,2019.
[21] R. Calvo-Palomino, F. Ricciato, D. Giustiniano, V. Lenders, LTESS-track: A Precise and Fast Frequency OffsetEstimation for Low-cost SDR Platforms, in: Proceedings of the 11th Workshop on Wireless Network Testbeds,Experimental Evaluation and CHaracterization, WiNTECH ’17, ACM, 2017, pp. 51–58.
[22] J. R. Douceur, T. Moscibroda, Lottery trees: motivational deployment of networked systems, in: ACM SIGCOMMComputer Communication Review, volume 37, ACM, pp. 121–132.
[23] Y. Lv, T. Moscibroda, Fair and resilient incentive tree mechanisms, Distributed Computing 29 (2016) 1–16.[24] N. D. Lane, S. B. Eisenman, M. Musolesi, E. Miluzzo, A. T. Campbell, Urban sensing systems: opportunistic or
participatory?, in: Proceedings of the 9th workshop on Mobile computing systems and applications, ACM, pp.11–16.
[25] S. Rajendran, W. Meert, D. Giustiniano, V. Lenders, S. Pollin, Deep learning models for wireless signal classifica-tion with distributed low-cost spectrum sensors, IEEE Transactions on Cognitive Communications and Networking4 (2018) 433–445.
[26] S. Rajendran, W. Meert, V. Lenders, S. Pollin, Saife: Unsupervised wireless spectrum anomaly detection with in-terpretable features, in: 2018 IEEE International Symposium on Dynamic Spectrum Access Networks (DySPAN),IEEE, pp. 1–9.
16