equilibrium and stability of relax a.sanpei, r.ikezoe, t. onchi, k.oki, t.yamashita, y.konishi,...
TRANSCRIPT

Equilibrium and Stability of RELAX
A.Sanpei, R.Ikezoe, T. Onchi, K.Oki, T.Yamashita, Y.Konishi, M.Nakamura,M.Sugihara, A.Higashi, H.Motoi, H. Himura, N.Nishino1), R.Paccagnella2) , A.Ejiri3), T.Akiyama4), K.Nagasaki5), J.K.Anderson6), D.J. Den Hartog6), H.Koguchi7)
Kyoto Institute of technology, Kyoto, Japan1)Hiroshima University, Higashi-hiroshima, Japan
2)Consorzio RFX, Padova, Italy3)University of Tokyo, Kashiwa, Japan
4) National Institute for Fusion Science, Toki, Japan5)Kyoto Univerisyt, Uji, Japan
6)University of Wisconsin, Madison, USA7) National Institute for Advanced Industrial Science and Technology (AIST), Tsukuba, Japan
S.MasamuneKyoto Institute of Technology, Kyoto 606-8585, Japan

REversed field pinch of Low-Aspect-ratio eXperiment
• R/a = A = 2(51 cm/25 cm)
• Optimization in progress
Kyoto Institute of Technology

Lower A means lower n for dominant m = 1 modes
-0.1
0
0.1
0.2
0.3
0.4
0 0.2 0.4 0.6 0.8 1
A = 2A = 3
q
r/a
1/4
1/51/6
...
more space in the core region

Goal of RELAX experiment
• Experimental study on advantages of low-A RFP configuration
- Improved confinement with QSH for achieving
high beta - Experimental identification of bootstrap current (targer parameters:
Te~300eV, ne~4×10¹⁹m-3 at Ipp~100kA)

Outline
- Descharge regimes in Θ-F space in RELAX
Extremely deep reversal regime
Shallow reversal regime
- Helical State
Helical hot core
- Magnetic boundary control -- status

RFP plasmas in RELAX
Low-aspect-ratio RFP plasmas:
Ip < 100 kA , ne = 1018 ~ 2 x 10¹⁹ m-3 ,
Te < 100 eV , τD ~ 2 ms
MHD properties have been studied in discharges during flat-topped phase for 0.5ms with 40kA < Ip < 100kA

F and Θ keep some relation over wide range of parameters
BFM
Medium to high aspect ratio RFP PPCD & IHTM
In shallow reversal region, Periodic QSH or Helical Ohmic RFP state tends to be realized
In deep reversal, high-Θ region, Amplitudes of resonant modes are suppressed significantly SXR emission increases, indicating improved plasma performance
B
t
p )(
B
aB
t
t )(
B
aBF
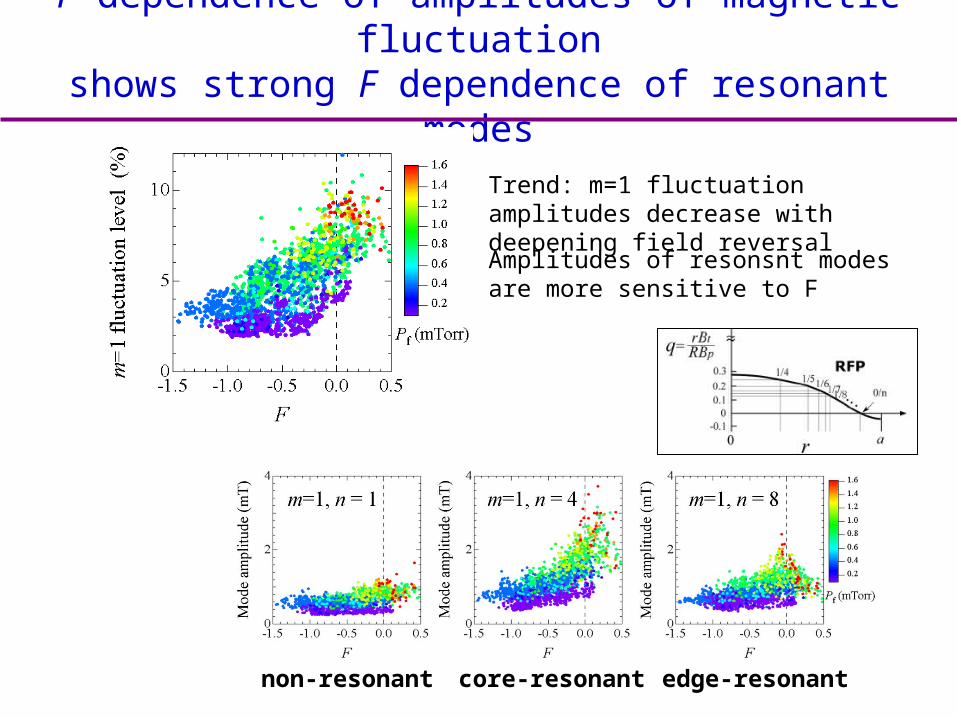
F dependence of amplitudes of magnetic fluctuationshows strong F dependence of resonant modes
non-resonant core-resonant edge-resonant
Trend: m=1 fluctuation amplitudes decrease with deepening field reversal
Amplitudes of resonsnt modes are more sensitive to F

Extremely deep reversal discharge
Extremely deep reversal, high-Θ region is accessible without sawtooth crash or discrete dynamo event.
MHD Stability in extremely deep reversal regime may be revisited in toroidal geometry.
Rapid rotation of the resonant MHD modes may be related with the low edge magnetic fluctuation amplitudes.

q profiles and toroidal mode spectrum of m=1 modes
q profiles from equilibrium reconsytuction code RELAXFit
• Shallow reversal region:
Dominant modes are core resonant m=1/n=4,5,6.
Toroidal mode spectrum can be accounted for by q profile.
• Deep reversal region:
Amplitudes of m=1 modes are reduced to ~1/4.
Spectrum becomes broader
• Increased magnetic shear may contribute to the lower fluctuation amplitudes in deep reversal case.
• No evidence of externally resonant mode?
( -0.1 < F < 0 ) ( -0.8 < F < -0.6 )

Dependence of Soft-X ray emission intensity on F
• SXR emission tends to increase by deepeneng the field reversal
– two distinctive regions, shallow-F and deep-F
– density and temperature measurements are required for estimate of plasma performance
SXR emission: a measure of plasma performance

Characteristic phenomena in shallow-reversal region- Helical structure observed with high-speed camera -
m =
1 a
mpl
itude
(a.
u.)
Toroidal mode numbern = 4
NOTE: Recent observation shows toroidal rotation of the simple helix
Visible light image

Characteristic phenomena in shallow-reversal region- SXR images suggest helical hot core in QSH -
トロイダルモードスペクトル
< during m/n=1/4 QSH >
<during multi-helicity state >
Experimantal result
filament
Experimental result
SXR pin-hole camera
5-μs exposure

Detailed comparison with simulated images indicates helical hot core
Experimental image
< m=1/n=4mode dominant case >
A model contours of SXR emissivity for a large island (a=3, w=15cm)
Simulated image(=3, w=15cm, rn=4=14cm)
Vertical intensity profileHorizontal intensity profiles

15
Characteristic phenomena in shallow-reversal region SXR emission is centrally peaked, with slight change in time
AXUVarray
Quasi-periodic change in SXR profile-with frequency of ~10kHz-change in peak may indicate rotation of helical structure in SXR emission?
☆multi-chord SXR emission measurement with AXUV (Al 2mmt filter)
Time evolution of SXR emission profile
Change in gradientChange in peak
p: impact parameter

Magnetic field profile in shallow-reversal regions is characterized by Helical Ohmic Equilibrium state
• Symbols: measured profiles with radial array of magnetic probes.
• Solid lines: Ohmic helical equilibrium solution (Paccagnella (2000)), details are in the next slide.
• Shafranov shift Δ/a ~ 0.2.
• The helical structure rotates at a frequency of ~10 kHz.
Axisymmetric components m=1 helical components

Helical Ohmic Equilibrium Solution - Helical Equilibrium and Ohm’s Law -
d
d
d
d)(
2,
),(d
d)(
d
d11
22
222222
2222
2
h
p
B
gg
Br
rkm
mkg
rkm
rf
rkmp
gg
curfr
frf
Bj
d
d
d
dˆ
,d
d)(
~)(
22
20
p
B
g
B
g
pgBBE z
Bj
Grad-Shafranov equation with helical symmetry
Ohm’s law with helical symmetry ( )jBuE
Contours of helical flux functionTheta=1.78, F=-0.06, beta=0.1
(courtesy of R.Paccagnella)

Feedback control of magnetic boundary at the gap with saddle coils
Poloidal gap with four saddle coils (in red)
Block diagram for control system
Current driver using IGBT
Four saddle coils→control of m=1 component
saddle coil

RFP performance is improved using the feedback control at the gap
Reduction of gap flux (field errors) results in improved discharge
→longer discharge duration
0
0.5 1.0 1.5 2.0 t (ms)
w/o control with control threshold
Covering the vacuum vessel with 4×16 (or 32) saddle coils
Use of digital feedback controller for flexibility
horizontal field
vertical field
for further improvements

RWM is problematic for longer pulse operation in RELAX
=> Ip starts decreasing
Br (m=1/n=2) measured on the outer surface of the vacuum vessel
%5.11)(/)(~ aBaB pr
3-D nonlinear MHD simulation predicts RWM in RELAX (Paccagnella, 2008)
Initial growth of m=1/n=-4 resonant mode, followed by growth of the non-resonant m=1/n=2 external kink mode with growth time of resistive wall time constant

Magnetic boundary control plan in RELAX
-32 (or 16) toroidally, 4 poloidally separated saddle coils for feedback control of RWM
-Construction of the power supplies in progress
-Introduction of digital feedback controllers under discussion

Summary
• RFP plasmas with MHD properties characteristic to low-A configuration have been attained in RELAX.
• Two characteristic regimes for possible improved performance have been found.
• Rotating helical structure have been observed.• Possible Helical Ohmic Equilibrium state with hot core
has been demonstrated.• Feedback control of magnetic boundaries are in
progress for further improvement of plasma performance.

backup slides

Characteristic phenomena in shallow-reversal region- Possibility of rotating Helical Ohmic Equilibrium state -
A large-scale magnetic field profile change
Quasi-periodic oscillation between reversed and non-reversed states
Similar large-scale oscillatory behavior in Br and B
B (m
T)
Ip (k
A)

Characteristic phenomena in deep-reversal region Phase locking are influenced by field reversal
• In shallow reversal discharges, locked mode tends to occur frequently
360
270
180
90
0
(
deg
ree)
1.61.51.41.31.21.11.00.9
Time (ms)
0.80.60.40.20.0 _
m=
1/n=
4-7
360
270
180
90
0
(
deg
ree)
1.61.51.41.31.21.11.00.9
Time (ms)
0.80.60.40.20.0 _
m=
1/n=
4-7
( -0.1 < F < 0.1 , Pf = 1.6 mTorr )
( -0.8 < F < -0.6 , Pf = 0.1 mTorr )
In deep reversal discharges, locked mode tends to be unlocked, probaly due to the increased distances between the wall and resonant surfaces
Phase locking also tends to be unlocked, due to the lower mode amplitude?
Phas
e di
sper
sion
<= Resonant surfaces are closer to the wall

Digital feedback controller using BlackFin board
・ clock frequency: 500MHz・ SDRAM 64MB・ 8 programmable timers・ 12bit 1MHz digitizer・ digital signal processor applicable → feedback control schemeProf. B. Nelson (U. Washington),
Profs. Y.Kikuchi, M.Nagata (U. Hyogo)Courtesy of
Digital controller developed for ICC experiments

27
Characteristic phenomena in shallow-reversal region SXR emission is centrally peaked, with slight change in time
AXUVarray
Quasi-periodic change in SXR profile-with frequency of ~10kHz-change in peak may indicate rotation of helical structure in SXR emission?
☆multi-chord SXR emission measurement with AXUV (Al 2mmt filter)
Time evolution of SXR emission profile
Change in gradientChange in peak
p: impact parameter