extraction of tissue optical properties from optical
TRANSCRIPT
LUND UNIVERSITY
PO Box 117221 00 Lund+46 46-222 00 00
Extraction of tissue optical properties from optical coherence tomography images fordiagnostic purposes
Thrane, L; Frosz, MH; Levitz, D; Jorgensen, TM; Andersen, CB; Hansen, PR; Valanciunaite,J; Swartling, Johannes; Andersson-Engels, Stefan; Tycho, A; Yura, HT; Andersen, PEPublished in:Saratov Fall Meeting 2004: Optical Technologies in Biophysics and Medicine VI
DOI:10.1117/12.634767
2005
Link to publication
Citation for published version (APA):Thrane, L., Frosz, MH., Levitz, D., Jorgensen, TM., Andersen, CB., Hansen, PR., Valanciunaite, J., Swartling, J.,Andersson-Engels, S., Tycho, A., Yura, HT., & Andersen, PE. (2005). Extraction of tissue optical properties fromoptical coherence tomography images for diagnostic purposes. In VV. Tuchin (Ed.), Saratov Fall Meeting 2004:Optical Technologies in Biophysics and Medicine VI (Vol. 5771, pp. 139-150). SPIE.https://doi.org/10.1117/12.634767Total number of authors:12
General rightsUnless other specific re-use rights are stated the following general rights apply:Copyright and moral rights for the publications made accessible in the public portal are retained by the authorsand/or other copyright owners and it is a condition of accessing publications that users recognise and abide by thelegal requirements associated with these rights. • Users may download and print one copy of any publication from the public portal for the purpose of private studyor research. • You may not further distribute the material or use it for any profit-making activity or commercial gain • You may freely distribute the URL identifying the publication in the public portal
Read more about Creative commons licenses: https://creativecommons.org/licenses/Take down policyIf you believe that this document breaches copyright please contact us providing details, and we will removeaccess to the work immediately and investigate your claim.
Download date: 14. Mar. 2022
Extraction of tissue optical properties from optical coherencetomography images for diagnostic purposes
Lars Thranea, Michael H. Frosz, David Levitza,c, Thomas M. Jørgensena, Claus B. Andersen, PeterR. Hansene, Jurga Valanciunaitec, Johannes Swartlingc, Stefan AnderssonEngelsC, Andreas Tycho,
Harold T. and Peter E. Andersen*,a
aOptiCS and Plasma Research Department, Risø National Laboratory, P.O. Box 49, DK-4000Roskilde, Denmark
bCOM Technical University of Denmark, DTU- Building 345V, DK-2800 Kgs. Lyngby, DenmarkcDepaent of Physics, Lund Institute of Technology, P.O. Box 1 1 8, SE-221 00 Lund, Sweden
ofPathology, Rigshospitalet, Frederik V's vej 1 1, DK-2100 København 0, DenmarkeDepa.ffient ofCardiology, Amtssygehuset i Gentofte, Niels Andersensvej, DK-2900 Hellerup,
DenmarkOCT Innovation ApS., P.O. Box 49, DK-4000, Roskilde, Denmark
and Photonics Laboratory, The Aerospace Corporation, P.O. Box 92957, Los Angeles,CA 90009 USA
ABSTRACTThe concept of optical coherence tomography (OCT) for high-resolution imaging of tissues in vivo is introduced.Analytical and numerical models for describing and understanding the light propagation in samples imaged by OCTsystems are presented. An analytical model for calculating the OCT signal based on the extended Huygens-Fresnelprinciple and valid both for single and multiple scattering regimes is outlined. From this model, an algorithm forextracting tissue optical properties for multi-layered tissues is derived. The algorithm is first verified for various opticalproperties and geometries using solid phantoms and numerical simulations. The applicability of the algorithm forextraction of tissue optical properties is then demonstrated for vascular tissue samples ex vivo. With the use of data fromnumerical phantoms, the validity of the OCT extraction algorithm for a two-layer geometry is further supported. It isconcluded that by using optical properties extracted from OCT images of human tissues, the clinical utility of OCTimaging can be substantially increased.
Keywords: optical coherence tomography, tissue optical properties, scattering
1. INTRODUCTIONOptical coherence tomography (OCT) is a non-invasive technique that provides micron-scale imaging of OCT isdriven by low-coherence interferometry, an interferometric method whereby an interference signal can only arise whenthe optical path length difference between the two arms of a Michelson interferometer is within the coherence length ofthe source. Thus in OCT the axial resolution is proportional to the temporal coherence length of the source, and with abroadband source it is possible to obtain a resolution as high as 0.5jm in tissue.2 As a fiber-based technology, OCT canbe readily integrated into many catheter-based endoscopic applications.3
However, one major problem preventing OCT from being more readily integrated into the diagnosticarmamentarium is the lack ofmethods for objective interpretation oftissue morphology in OCT images. OCT signals aremainly influenced by the optical properties of the examined sample, that is, the scattering coefficient p, and anisotropyfactor g4. They are macroscopic physical properties unique to the tissue, which play a vital role in the modeling of OCTsignals. By properly modeling an OCT signal as a function of depth so that multiple scattering events are included, andfitting the depth profile of coherent backscattered light in an OCT image (also called depth-scan or A-scan) to suchmodel, it is possible to extract out p and g, which in turn enable new diagnostic methods. The principal aim ofthis paperis to present this novel new method by which optical properties data can be extracted from OCT images.
Our objectives in this study were as follows: Firstly, to demonstrate that the curve-fitting algorithm used wascapable of accurately determining the optical properties of turbid media. This evaluation part of the study was conducted
Invited Paper
Saratov Fall Meeting 2004: Optical Technologies in Biophysics and Medicine VI,edited by Valery V. Tuchin, Proc. of SPIE Vol. 5771 (SPIE, Bellingham, WA, 2005)1605-7422/05/$15 · doi: 10.1117/12.634767
139
Downloaded from SPIE Digital Library on 04 Jul 2011 to 130.235.188.41. Terms of Use: http://spiedl.org/terms

on a set of tissue phantoms using integrating sphere measurements to determine optical scattering properties.5 Secondly,the OCT extraction method was applied on normal and atherosclerotic human aortic samples in order to demonstrate thatthe technique may provide a basis for distinguishing between different tissues by their optical properties.5 Thirdly, themodeling geometry is extended to include a second layer and verified the ability of the algorithm to extract the opticalproperties ofboth layers using a numerical phantom.6
2. OCT SYSTEM ANDTHEORETICAL MODELINGThroughout this study, OCT data curves were fit to an analytical OCT model. These curves were either generatedexperimentally, i.e., by OCT imaging (single-layer studies), or by numerical simulation, i.e., using Monte Carlosimulations (two-layer study). The principal equations governing the OCT signal for both cases were the same,9 and arepresented in Section 2. 1 . However, because of the differences in the nature of data collected between the two systems,different preprocessing steps were needed before curve fitting was carried out. In Section 2.2 details regarding the OCTimaging and the extraction algorithm used to process OCT images are provided,5 while in Section 2.3 we explain howdata generated using our numerical OCT model were processed.6'7
2.1 Analytical OCT modelA model based on the extended Huygens-Fresnel principle8 that analyzes the heterodyne OCT signal as a function ofdepth has been developed by Thrane et al.9 (denoted EHF model). This model takes into account multiple scatteringeffects, and thus the depth profile of the OCT signal is a function of jtandg as well as other parameters. This model isbased on ABCD matrix formalism'0 and is therefore general and capable of handling different sample arm geometries,i.e., dynamic vs. fixed focusing. Furthermore, it may easily be applied to a multiple-layered geometry of scatteringmedia, such as is frequently the case with tissue.
The analytical expressions for the OCT signal of the two layers are obtained from the general expression given byEq. (22) of Ref. 9
.2 .2 [ 4exp(—p5z)[1—exp(—pz)] 2 W(1 (z))=(z
)[exP(—2Pz)+ 1+w/w +[i—exp(—pz)] .—- , (1)
where (.2 ) and (.2) the mean square heterodyne signal current in the presence and absence of scattering,
respectively, and z is the probing depth. Note that the OCT signal is the root mean square (rms) heterodyne signal current
J(2 ) . The quantities WH and W are the lie intensity radii at the probing depth in the absence and presence of
scattering, respectively, defined as
WH2 WO2[A_J [J2(2)
2 2( B"2 (B2 ( 2Bw =w A——i +1—i +1 I (3)0j t\kwO) Lkp0(z))
with w0 being the lie intensity radius of the reference and input sample beams in the lens plane/mixing plane, and A andB are the ray-matrix elements. p0(z) is the lateral coherence length in the mixing plane of the sample field that has beenreflected/backscattered at the probing depth z. A derivation ofpo(z)9" shows that
fT ,i (nB"p0(z) = I— —I — I ' (4)
v/Jsz 2r9mis z )where r,ns represents the root-mean-square scattering angle, defined as the half-width at e' maximum of a Gaussiancurve fit to the main frontal lobe ofthe scattering phase function'2. Strictly speaking, the anisotropy parameter extracted,geff is the effective anisotropy factor given by the cosine of 9,,,, found in Eq. 4.
Eqs. (1-4) are the underlying equations on which are fitting algorithm is based on. Note that in the OCT systemused in this phantom and tissue study, light was focused at the surface of the sample and thus A 1 and B =f+ (z / n).However, in the Monte Carlo model is based on a system employing dynamic focusing, i.e., B =f. Consequently, in this
140 Proc. of SPIE Vol. 5771
Downloaded from SPIE Digital Library on 04 Jul 2011 to 130.235.188.41. Terms of Use: http://spiedl.org/terms
case (.2) a constant proportional to the effective backscattering cross section of the sample, and
2 2 ( 2'WH/WS tl+[2w0/po (z)] , accordingto Ref. 9.
2.2 OCT imaging and image processingThis section describes the system used to acquire OCT data (Subsection 2.2.1), and the steps taken to get from a two-dimensional matrix of intensity values to a set of optical property values that best described the OCT signal over thespecified region ofinterest (Subsection 2.2.2).
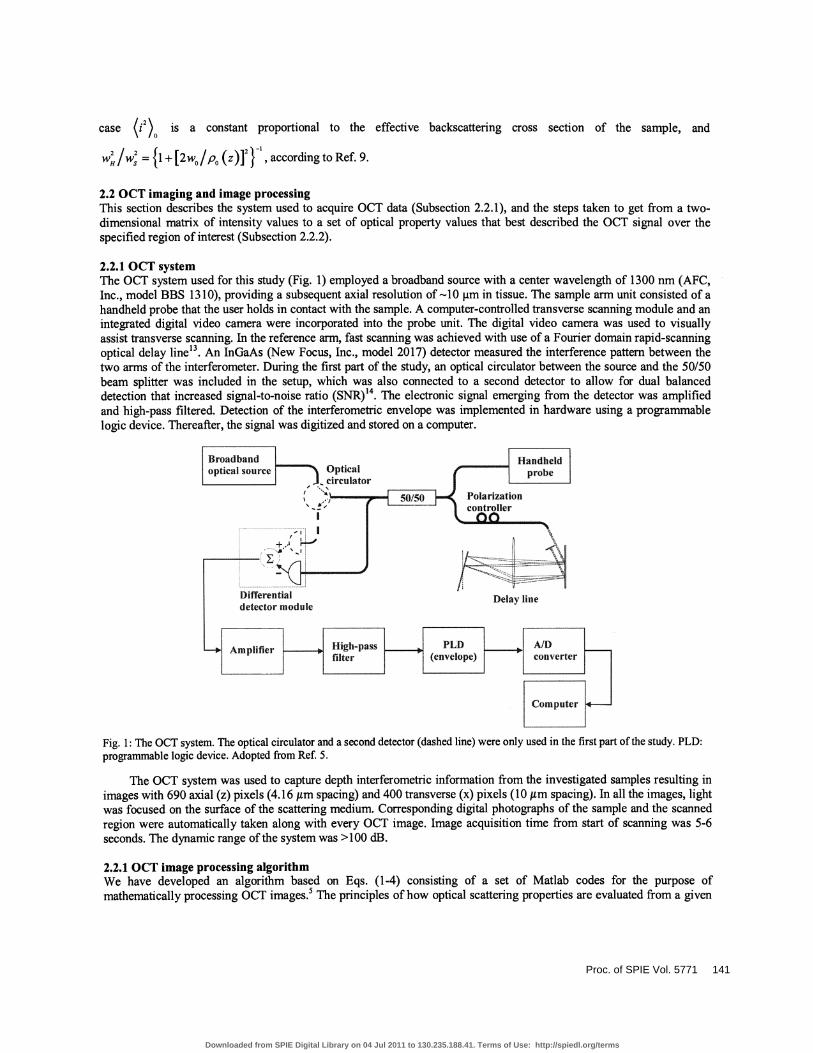
2.2.1 OCT systemThe OCT system used for this study (Fig. 1) employed a broadband source with a center wavelength of 1300 nm (AFC,Inc., model BBS 13 1 0), providing a subsequent axial resolution of 1O tm in tissue. The sample arm unit consisted of ahandheld probe that the user holds in contact with the sample. A computer-controlled transverse scanning module and anintegrated digital video camera were incorporated into the probe unit. The digital video camera was used to visuallyassist transverse scanning. In the reference arm, fast scanning was achieved with use of a Fourier domain rapid-scanningoptical delay line13. An InGaAs (New Focus, Inc., model 2017) detector measured the interference pattern between thetwo arms of the interferometer. During the first part of the study, an optical circulator between the source and the 50/50beam splitter was included in the setup, which was also connected to a second detector to allow for dual balanceddetection that increased signal-to-noise ratio (SNR)'4. The electronic signal emerging from the detector was amplifiedand high-pass filtered. Detection of the interferometric envelope was implemented in hardware using a programmablelogic device. Thereafter, the signal was digitized and stored on a computer.
The OCT system was used to capture depth interferometric information from the investigated samples resulting inimages with 690 axial (z) pixels (4.16 jim spacing) and 400 transverse (x) pixels (10 m spacing). In all the images, lightwas focused on the surface of the scattering medium. Corresponding digital photographs of the sample and the scannedregion were automatically taken along with every OCT image. Image acquisition time from start of scanning was 5-6seconds. The dynamic range of the system was >100 dB.
2.2.1 OCT image processing algorithmWe have developed an algorithm based on Eqs. (1-4) consisting of a set of Matlab codes for the purpose ofmathematically processing OCT images.5 The principles of how optical scattering properties are evaluated from a given
Optical) circulator
Diflerentialdetector module
Delay line
Fig. 1: The OCT system. The optical circulator and a second detector (dashed line) were only used in the first part of the study. PLD:programmable logic device. Adopted from Ref. 5.
Proc. of SPIE Vol. 5771 141
Downloaded from SPIE Digital Library on 04 Jul 2011 to 130.235.188.41. Terms of Use: http://spiedl.org/terms
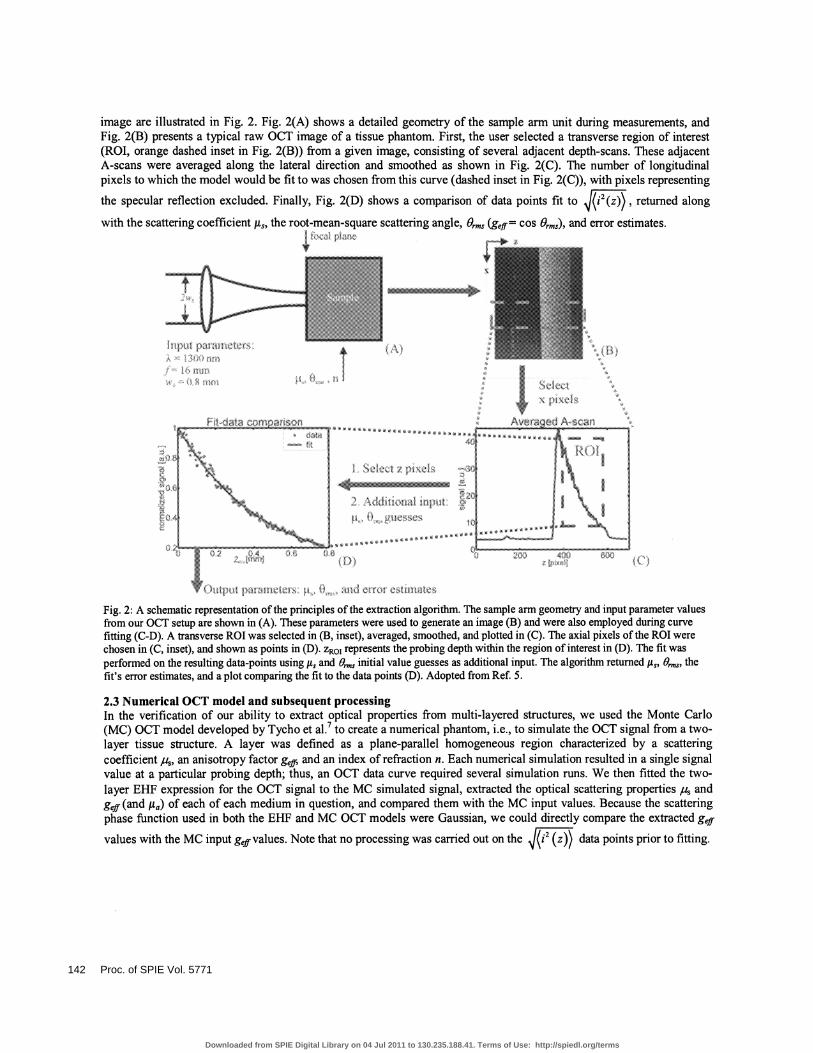
image are illustrated in Fig. 2. Fig. 2(A) shows a detailed geometry of the sample arm unit during measurements, andFig. 2(B) presents a typical raw OCT image of a tissue phantom. First, the user selected a transverse region of interest(ROl, orange dashed inset in Fig. 2(B)) from a given image, consisting of severa' adjacent depth-scans. These adjacentA-scans were averaged along the lateral direction and smoothed as shown in Fig. 2(C). The number of longitudinalpixels to which the model would be fit to was chosen from this curve (dashed inset in Fig. 2(C)), with pixels representing
the specular reflection excluded. Finally, Fig. 2(D) shows a comparison of data points fit to (i2(z)) ,returned along
with the scattering coefficient , the root-mean-square scattering angle, 9,ms (geff cos Orms), and error estimates.
•..:.:.:.:..:.::::.::. 4
Fig. 2: A schematic representation ofthe principles ofthe extraction algorithm. The sample arm geometry and input parameter valuesfrom our OCT setup are shown in (A). These parameters were used to generate an image (B) and were also employed during curvefitting (C-D). A transverse ROT was selected in (B, inset), averaged, smoothed, and plotted in (C). The axial pixels ofthe ROT werechosen in (C, inset), and shown as points in (D). ZROI represents the probing depth within the region ofinterest in (D). The fit was
performed on the resulting data-points using j. and 9,,,, initial value guesses as additional input. The algorithm returned jig, O, thefit's error estimates, and a plot comparing the fit to the data points (D). Adopted from Ref. 5.
2.3 Numerical OCT model and subsequent processingIn the verification of our ability to extract optical properties from multi-layered structures, we used the Monte Carlo(MC) OCT model developed by Tycho et al.7 to create a numerical phantom, i.e., to simulate the OCT signal from a two-layer tissue structure. A layer was defined as a plane-parallel homogeneous region characterized by a scatteringcoefficient 1u,, an anisotropy factor geff, &id an index ofrefraction n. Each numerical simulation resulted in a single signalvalue at a particular probing depth; thus, an OCT data curve required several simulation runs. We then fitted the two-layer EHF expression for the OCT signal to the MC simulated signal, extracted the optical scattering properties and
geff (&id ILa) ofeach of each medium in question, and compared them with the MC input values. Because the scatteringphase function used in both the EHF and MC OCT models were Gaussian, we could directly compare the extracted geff
values with the MC input geffvalues. Note that no processing was carried out on the j(i2 (z)) data points prior to fitting.
hqu :Le. .
:L
.: J,I Seie;t .;
. M . andc'rur
142 Proc. of SPIE Vol. 5771
Downloaded from SPIE Digital Library on 04 Jul 2011 to 130.235.188.41. Terms of Use: http://spiedl.org/terms
100
0
101Ca)()
a) -10
•00a)a)I
Fig. 3: The heterodyne efficiency factor as a function of0 for a fixed probing depth (0.5 mm) in a homogeneous sample obtained byusing the MC OCT model, and with data from experiments presented elsewhere9. The typical standard deviation for the measurements(0) was The dotted curve represents the predicted single-scattering OCT model'5 (.% = 814 nm, g = 0.929 (9 = 0.38 rad), n =1 .33,f= 16 mm, w0 = 0.125 mm). Adopted from Ref. 6.
The applied MC OCT model7 is an extension ofthe well-known MCML computer code,'6 which allows simulationof multi-layered media. As shown in Fig. 3, there was excellent agreement between results obtained for the heterodyneefficiency factor7 as a function of for a fixed probing depth by using the MC OCT model and data from experimentspresented elsewhere9, indicating that the MC model was a valid model ofthe data generated by OCT. Thus, the MC OCTmodel used in this work represents a valid numerical OCT phantom and a powerful investigational tool in the analysis ofOCT data.
3. SINGLE-LAYER PHANTOM STUDYIn order to establish the reliability of our new algorithm for extracting optical properties of highly scattering media,experiments on tissue phantoms with well-controlled optical properties were carried out. Specifically, this verificationinvolved several phantoms with different scattering properties measured with a well-established method for obtainingoptical properties from such samples, i.e., the integrating sphere method and inverse adding-doubling (lAD)'7. Toadequately compare the extracted geff values, the scattering phase function of 1300 nm light in those phantoms wascalculated using basic principles from Mie theory.4
3.1 PhantomsFor these experiments, we used six phantoms from a previous iflve5tigation'8 with three distinct values of p and twodistinct values of absorption coefficient /La, respectively. The phantoms consisted of epoxy resin (n=l.55) with well-defined quantities of scattering material and absorbing pigment added for scattering and absorption purposes,respectively. Titanium IV Oxide (TiO2, n=2.55) powder, with a particle size of 1 .tm (Sigma-Aldrich) was used as ascattering material and photocopy machine toner served as the absorbing pigment. In all phantoms used, it was ensuredthat absorption effects were negligible compared to those from scattering. Mounting the phantoms in a slab geometrywas achieved by sandwiching 1 ml of each phantom between two microscope slides before the epoxy hardened yielding1 .0 mm thick samples with a cross section measuring 3 x 3 218
3.2 Integrating sphere measurementsOur measurements of the diffuse reflectance and transmittance were performed using an integrating sphere (Labspheremodel RT-060-SF) with the broadband source (AFC) operating at a center wavelength of 1300 nm also used for OCTimaging. Light was guided to the sphere using a single-mode optical fiber and collected by an JR detector supplied by thesphere manufacturer. The beam arriving at the transmission port was 2.3 mm in diameter, with a port diameter of 25.4mm. A chopper rotating at 730 Hz modulated the beam, and was synchronized with a lock-in amplifier on the detectorside to increase SNR. Both diffuse reflectance and diffuse transmittance measurements were done three times each withsample orientation randomized. Our integrating sphere data was processed in version 1 of the inverse adding-doubling(TAD) code'7 using four fluxes per iteration.
Scattering coefficient [mm1J
Proc. of SPIE Vol. 5771 143
Downloaded from SPIE Digital Library on 04 Jul 2011 to 130.235.188.41. Terms of Use: http://spiedl.org/terms

3,0
2,5
2,0
- 1,0
0,5
0,0Cl Dl El C3 D3 E3
Pa0024mm1Phantom ID
Fig. 4: A comparison of I.Ls values (mean standard deviation) obtained from measurements on tissue phantoms with OCT extractions(green) and the integrating sphere (IS, red). Note the stepwise increase in j.t observed in two separate sets of 3 phantoms purposelyprepared to exhibit such an increase. Details about phantom nomenclature can be found in Ref. 18. Adopted from Ref. 5.
3.3 Fitting routineEach phantom was imaged twice, with the light focused on the phantom surface in all cases. The OCT data wasevaluated in the following manner: In every image there were five ROIs with fifteen curve fitting attempts per ROl.Curve fitting attempts in a single ROl only differed by the combinations of jt and 9 guesses used. A random numbergenerator determined the transverse boundary pixels for each ROl. The fitted length was chosen to be 0.77 mm (186pixels), the maximum that could be used in all the images accounting for phantoms imaged at a small angle. Phantoms
whose optical depth (i.e., j.t, x scattering layer thickness) did not exceed 1.3 as determined with the integrating sphereand thus did not definitively enter the multiple-scattering regime were excluded.
3.4 Results and DiscussionA graphical comparison of jt obtained from OCT extractions and from the lAD code is shown in Fig. 4. Error barsrepresenting the standard deviation on the measurements are not readily visible on the sphere data since the standarddeviation did not exceed 0.25% of the mean. A Mie calculation using the code from Bohren & Huffman forhomogeneously shaped spherical particles4 was performed to obtain a theoretical g = 0.885. A comparison of geffderived from OCT extractions to the theoretical result is shown in Fig. 5.
As shown in Figs. 4 and 5, the extraction algorithm generated consistent and reliable results for the tissue phantomsinvestigated. Every value of geff extracted overlapped with the 0.885 obtained from the Mie calculation within the errorbars (Fig. 5). Moreover, a step-wise increase in p was clearly observed with two different phantom sets (3 phantoms/set)using both techniques. While the error bars in three of six phantoms overlapped with the value returned from the lADalgorithm, the difference in the remaining three did not exceed 13% of the lAD returned value. One can notice, however,that the OCT-technique seems to slightly overestimate the scattering coefficient for these particular samples.
In examining the potential sources of error in the OCT extractions, the following should be considered: Theintegrating sphere measures optical properties of scattering media on a macroscopic scale as an average throughout thesample, while optical property extractions from an OCT image involves averaging over a much smaller region. Thus,inevitable phantom inhomogeneities on a jim scale could have affected our results. Also, lAD does not take wavelengthas one of its inputs'7, or in other words, is designed for monochromatic light where samples exhibit uniform opticalproperties. The source used in this experiment had a 3 dB bandwidth of 60 nm, which could have an influence on theexperiments and thus the returned lAD data. Furthermore, phantom albedos ('-.-O.97) were slightly outside therecommended range of 0.4-0.95 for achieving the highest accuracy with the TAD algorithm'9, and this too could haveslightly offset the lAD data points.
144 Proc. of SPIE Vol. 5771
Downloaded from SPIE Digital Library on 04 Jul 2011 to 130.235.188.41. Terms of Use: http://spiedl.org/terms
Considering the fine overall agreement between extracted values using our new algorithm and the lAD algorithm,we conclude that our new algorithm is capable of extracting optical properties with sufficient reliability.
1E1 j 1 }
I0,7
U)
a)E 0,6
0,5D • OCT, IJa=O.024 mm'
0,4 , OCT, Pa29 mm1— Mie Calculation
u, I I I I I'
ci Dl El C3 D3 E3
Phantom ID
Fig. 5: Acomparison ofgejçvalue (mean standarddeviations) from OCT extractions (points) and the Mie calculation (line). Overlapin results is observed for every phantom. Details regarding phantom nomenclature can be found in Ref. 18. Adopted from Ref. 5.
4. SINGLE-LAYER EX VIVO STUDYRecently, OCT has shown promise for imaging of coronary atherosclerotic plaques.20'2' At present, however, visualdifferentiation between the general histopathological types of plaques, i.e., fibrous, fibrocalcific, and lipid-rich lesions, inOCT images is inherently qualitative and subjective. Several features of atherosclerotic plaque histopathology, i.e.,reorganization and disruption of intimal collagen fibers, are expected to produce marked changes in the tissue opticalscattering properties (t and geff). Thus, to exemplify how our OCT algorithm may provide quantitative informationabout complex tissue pathology, we performed a preliminary ex vivo investigation in I uman atherosclerotic lesions.
I
Fig. 6: Correlation ofraw OCT images (A, C, E, and G) and histopathology (B, D, F, and H). Normal intima labeled 'I' in (A-B).Lipid-rich lesion (C-D), with a lipid pool marked 'LP'. Fibrous plaque (E-F), with fibrous area marked 'F'. Fibrocalcific lesion (G-H),with the calcifications denoted 'C' . Rupture artifacts caused by the decalcifying process are clearly seen in (H). The arrows representthe intima in (A-F) and the fitting region in (G-H), respectively. Bars=500 j.m. Adopted from Ref. 5.
4.1 Curve fitting and imagingFourteen (4 normal, 4 lipid-rich, 3 fibrous, and 3 fibrocalcific) aortic segments were obtained within four hours ofautopsy and imaged with OCT in phosphate buffered saline. During OCT imaging, the OCT probe was in contact with aglass cuvette inside of which the biopsies were mounted. Regions corresponding to those imaged by OCT were markedand located on digital photos. The samples were routinely paraffin-embedded and sliced at the regions defined by the
Proc. of SPIE Vol. 5771 145
Downloaded from SPIE Digital Library on 04 Jul 2011 to 130.235.188.41. Terms of Use: http://spiedl.org/terms

digital photographs. Sections were stained (hematoxylin and eosin or combined elastin and van Gieson Hansen staining)and corresponding areas of the intima were identified in OCT images and histological sections, respectively, using Table1 in Ref. 20 as a guide. The OCT images were laterally divided into ROTs spanning approximately 20-30 A-scans or 200-300 j.m. Altogether, the images were subdivided into 151 ROIs, including 41 normal, 40 lipid-rich, 34 fibrous, and 36fibrocalcific ROIs, with each ROl being systematically selected for the criterion of the ROl spanning an area withuniform scattering properties. To facilitate interpretation, the extracted data were grouped into intervals based on therespective values of j and g. For , the intervals spanned 5 mnf' for values from 0 to 40 mmd, and 10 mm1 forvalues over 40 mm1. Since human soft tissue is generally very forward scattering, geffrange intervals of 0.05 werechosen for geffvalues near 1, but the interval range was larger for the limited number ofgeffvalues below 0.8.
(A)
40'
35
30 : Ii
iL
80
C)C-)C
C.)C.)
010
: : ::.'f....
.. :: L ç.: HC1——
0 5 5 10 10 15 15-20 20-25 25-30 30 35 35-40 40 50 50-60 >60
I-is [mm1]
;.' '...' ..:
:. LDd nch——
(B)
j L ii0.85-0.9 0.8-0.85 0.7-0.8 0.6-0.7 0.4-0.6 <0.4
geff [dimensionless]
Fig. 7: Distributions ofjz5 (A) and g(B) fornormal arteries and lipid-rich, fibrous, and fibrocalcific atherosclerotic plaques,respectively. In (A), ii for normal samples (striped) were centered between 1 5 and 40 mni' , butwere centered at lower values forlipid-rich (green) and fibrocalcific (blue) plaques, and were randomly distributed for fibrous plaques (red). In (B), geffvalues weregenerally higher in normal intimas than in atherosclerotic lesions. Adopted from Ref. 5.
146 Proc. of SPIE Vol. 5771
Downloaded from SPIE Digital Library on 04 Jul 2011 to 130.235.188.41. Terms of Use: http://spiedl.org/terms
4.2 Initial resultsOCT images were correlated with the corresponding histological sections using Table 1 in Ref. 20 as a guide andrepresentative samples are shown in Fig. 6. Qualitatively, images obtained by OCT and microscopy demonstrated similargross histopathological features that allowed for reasonable differentiation between normal vessels and lipid-rich,fibrous, and fibrocalcific plaques, respectively. The distribution of and g for ROIs of normal arteries and the threeoverall atherosclerotic lesion types is shown in Fig. 7. Our preliminary data suggested that very similar optical propertieswere observed in images of normal samples (diagonal lines) but not in those representing atherosclerotic lesions. Innormal arteries, almost 90% of geff values were concentrated between 0.95 and 1, whereas more than 50% ofatherosclerotic lesion ROIs were below 0.95. Approximately 95% of the normal arterial samples had jtbetween 1 5 and39 mni', while was below 15 mm' in about 60% of lipid-rich and fibrocalcific plaques. Furthermore, fibrous lesionsdemonstrated very considerable variations in
To our knowledge, the above preliminary data represent the first quantitative analysis of the optical scatteringproperties, i.e., the scattering coefficient and the anisotropy factor, of the normal and diseased human aortic intima invitro at 1300 nm. The study indicates that the presented algorithm may provide a basis for extension of the OCTtechnique beyond qualitative image assessment towards tissue characterization based on physical principles. Techniquesfor detection of unstable atherosclerotic lesions have generated enormous interest in the field of vascular biology, and thefuture clinical utility of such methods is dependent on minimizing subjective and operator-dependent bias in theacquisition and interpretation of data22. We therefore suggest that the current OCT algorithm is an important step in thisdirection and that further studies are warranted to define the validity of the described method for characterization ofatherosclerotic lesions.
5. VERIFICATION OF TWO-LAYER MODELFrequently, tissue (i.e., human blood vessels) is arranged in a multiple-layer geometry. Hence, to be clinically practicalour OCT extraction algorithm needs to demonstrate its capability to extract optical properties from such geometry. In thissection we show in a "proof of principle" numerical experiment that we were able to extract the optical properties p, andgefffrom a two-layer sample geometry. To do so, we first expanded Eqs. (1-4) of our model9 to include a second layer forthe sample arm geometry of interest (i.e., dynamic focusing), and hereby serve as an analytical EHF expression used forcurve-fitting . We then present results from a numerical MC OCT experiment and the optical properties that wereextracted using the analytical EHF model.
5.1 Extended modelIn a multiple-layer geometry, the primary governing equation for the OCT signal remains Eq. (1). For the first layer,characterized by the optical parameters i51, 9r,nsi, and n1, and z in Eq. (1) were replaced by and z1, respectively,where z1 is the probing depth in the first layer. Under dynamic focusing conditions, the lateral coherence length p0(z) forthis first layer6' was then given by
f—i--- A [nflp01 (z ) = I —I —i--- ' (5)
V iii 7r9m&si L Z1 J
where , is the center wavelength of the source in vacuum, andfis the focal length of the sample arm focusing lens. For
the second layer, characterized by p52, 9rms2, and n2, z and j.z in Eq. (1) were replaced by z2 and +
respectively, where 4 is the thickness of the first layer, and z2 is the probing depth in the second layer. Furthermore,following the procedure outlined in Appendix A of Ref. 9, p0(z) for the second layer (with dynamic focusing) wasderived6 _____________________________________
I {n2i + n1 [2 + n2 f — —( \_�AI n1 n2 6p02 z2 — r nA (E + 3\1z2 + 3z ) 91p1 + nz92p2
5.2 Results and DiscussionWithout loss of generality, the refractive indices of the sample and the surroundings were matched and approached unity.The system parameters in this case were A = 800 nm, w0 = 0.4 mm, andf= 8.0 mm. The first layer was 0.3 mm thick (4!)with 4u, = 5.0 mm' and g1 = 0.99. The second layer was 0.9 mm thick with fls2 = 10.0 mm and g2 = 0.92. The MC
Proc. of SPIE Vol. 5771 147
Downloaded from SPIE Digital Library on 04 Jul 2011 to 130.235.188.41. Terms of Use: http://spiedl.org/terms
simulation of the mean square heterodyne signal current is shown as squares in Fig. 8. Because the MC data was
normalized to unity at z1= 0 mm in the present case, (2) was kept constant and equal to unity for the first layer, but
served as a fitting parameter for the second layer. The fit of the two-layer EHF OCT model to the MC simulation isshown as a solid line in Fig. 8, and the extracted optical scattering parameters andg of the two layers are shown inTable 1 together with the input parameters of the MC simulation. For completeness, results for other cases with differentscattering coefficients but all other parameters unchanged, were included in Table 1 . The absolute relativedifferences between the extracted mean values and the values used in the MC simulation followed a kind of structuredpattern with increasing values of and the "true" values were not contained within the estimated standard deviations.This observation is a clear indication of a bias between the EHF model and the MC simulations. On the other hand, thesmall relative differences demonstrated the capability of the EHF OCT model to extract optical scattering parametersfrom multi-layered tissue, i.e., in vivo human blood vessels. In general, the index of refraction of each layer may also beextracted, but such analysis was outside the scope of the current paper.
I IU MCmuIation
— EHFfitfirst layer0 £ A — EHF fit second layer
,' -1
A Afteruse ofTrue-reflectbn algorithm
A A LW A A LA A
First layer Second layer
_'o 0.2 014 06 0.8 1 1.2 1.4Depth [mm]
Fig. 8: MC simulation ofthe OCT signal for a two-layer sample with u2 = 10.0 mni' (squares). EHF fit to the first and second layers(solid line). MC simulation ofthe OCT signal according to the true-reflection algorithm (triangles). Adopted from Ref. 6.
Notice that p and geffcould only be separated when the optical depth was sufficiently large for multiple scatteringto occur. In general, when the optical depth was small, only single scattering occurred and therefore only could beextracted. For very large optical depths, i.e., totally diffused light, the EHF model predicted the OCT signal to bedetermined by the reduced scattering coefficient and, and geffcould therefore not be separated using this model alone.
In addition to providing quantitative information about the tissue, the extracted optical properties may also be usedfor attenuation compensation in OCT images, i.e., to remove attenuation caused by scattering and improve differentiationbetween tissue types.23 Such an attenuation correction technique (also called "true-reflection OCT algorithm"23) can beeasily implemented with use ofthe fitted coefficients from both layers and Eq. (1). The MC simulation ofthe OCT signalafter correction for the attenuation caused by scattering is shown as triangles in Fig. 8. The distinct signal levels obtainedfor the two different layers after using the true-reflection algorithm strongly indicate that better differentiation ofdifferent tissue types may be obtained in OCT images of real tissue by using the true-reflection algorithm. This too isexpected to result in an improved diagnosis.
148 Proc. of SPIE Vol. 5771
Downloaded from SPIE Digital Library on 04 Jul 2011 to 130.235.188.41. Terms of Use: http://spiedl.org/terms

Table 1. Input parameters of the MC simulation and the extracted parameters obtained by using the EHF model, respectively, with therelative difference expressed in % . Leave-one-out cross-validation24 with respect to the MC data points was used to estimate thestandard deviations. Adopted from Ref. 6.
Layer MC input[mm']
Extracted[mm']
Re diff.[%]
MC input geff-
Extracted g-
Rd. diff.[%]
1 5.000 4.98 0.05 -0.4 0.9900 0.974 0.007 -1.62 4.000 4.4± 0.1 10 0.9200 0.940±0.003 2.22 6.000 6.3 0.1 5.0 0.9200 0.893 0.003 -2.92 8.000 8.2 0.1 2.5 0.9200 0.874 0.005 -5.02 10.00 9.9 0.2 -1.0 0.9200 0.864 0.006 -6.1
6. CONCLUSIONSIn conclusion, we have developed and validated a novel method to perform extraction of optical scattering parameters,i.e., the scattering coefficient ps and effective anisotropy parameter geff, in OCT images. In the single-layer phantomstudy, we showed that OCT was capable of accurately determining the optical scattering properties of highly scatteringmedia, and we obtained results that were in agreement with a well-established experimental method. Using thistechnique, we conducted for the first time to our knowledge a preliminary investigation that quantitatively compared theoptical scattering properties of the human arterial intima exvivo. These preliminary data indicated that differences inscattering properties data exist between normal and atherosclerotic arterial segments and optical scattering data providedby OCT can therefore potentially contribute to atherosclerotic plaque characterization. Finally, with the two-layerphantom study we demonstrated that our two-layered model could accurately describe the OCT signal, extract the opticalproperties, and correct for attenuation losses in a two-layered tissue structure. The current study demonstrated that withuse of the outlined algorithm, the optical scattering properties of single- and multi-layered tissue can be characterizedfrom OCT images. The OCT analysis presented here can open new avenues of OCT research by combining high-resolution tissue imaging with measurements of tissue optical scattering properties. Such analysis may allow forassessment of yet unexplored biophysical properties of tissues and holds considerable promise for future clinical utility.
ACKNOWLEDGEMENTSThe authors would like to thank the staff at the Department of Pathology, Rigshospitalet, Denmark, for providing theaortic biopsies and the histopathological analysis .We also thank Finn Pedersen of Risø National Laboratory for helpingwith the imaging and sample handling. This work was supported by the Danish Technical Research Council, grantnumber 9901433, the BIOP graduate school, the Danish Heart Foundation, and the Lund Institute of Technology ECgrant LSHG-CT-2003-503259.
1 D. Huang, E. A. Swanson, C. P. Lin, J. S. Schuman, W. G. Stinson, W. Chang, M. R. Hee, T. Flotte, K. Gregory, C. A.Puliafito, and J. G. Fujimoto, "Optical coherence tomography," Science 254, 1 178 (1991).
2 B. Povazay, K. Bizheva, A. Unterhuber, B. Hermann, H. Sattmann, A. F. Fercher, W. Drexier, A. Apolonski, W. J.Wadsworth, J. C. Knight, P. S. J. Russel, M. Vetterlein, and E. Scherzer, "Submicrometer axial resolution opticalcoherence tomography," Opt. Left. 27, 1800-1802 (2002).
3 G. J. Tearney, S. A. Boppart, B. E. Bouma, M. E. Brezinski, N. J. Weissman, J. F. Southern, and J. G. Fujimoto, "Scanningsingle-mode fiber optic catheter-endoscope for optical coherence tomography," Opt. Left. 21, 543 (1996).
4 C. F. Bobren and D. R. Huffman, Absorption and scattering oflight by smailparticles (John Wiley & Sons, Inc., New York,NY 1983).
5D. Levitz, L. Thrane, M. H. Frosz, P. E. Andersen, C. B. Andersen, J. Valanciunaite, J. Swartling, S. Andersson-Engels, andP. R. Hansen, "Determination of optical scattering properties of highly-scattering media in optical coherence tomographyimages," Opt. Express 12, 249 (2004).
6 L. Thrane, M. H. Frosz, T. M. Jørgensen, A. Tycho, H. T. Yura, and P. E. Andersen, "Extraction of optical scatteringparameters and attenuation compensation in optical coherence tomography images ofmultilayered tissue structures," Opt.Lett. 29, 1641 (2004).
7A. Tycho, T. M. Jorgensen, H. T. Yura, and P. E. Andersen, "Derivation of a Monte Carlo method for modeling heterodynedetection in optical coherence tomography systems," Appl. Opt. 41, 6676 (2002).
8 R. F. Lutomirski and H. T. Yura, "Propagation ofa finite optical beam in an inhomogeneous medium," Appl. Opt. 10, 1652-1658 (1971).
Proc. of SPIE Vol. 5771 149
Downloaded from SPIE Digital Library on 04 Jul 2011 to 130.235.188.41. Terms of Use: http://spiedl.org/terms

(i'L61) UT '9fl °°S SZ f 'SUO3pOJd susjo iuwssss pu ooioq UOiEpijA-SSOJ3,, 'UO J'\J
•(zooz) 9: '619t' HIdS 00d 'U!2tm! DO uOi3pJ-flJj,, 'JnA L H Put 'USJOpUy [ d 'UOSU31øf i\ j 'UJIHj '1 •(iooz)
91E-coE '68 •S'>J •OJIJ 'onbid oqopsoj tq°'q" o su-iq oqjo u&uit jotuijj,, 'isn,j A pU z •(zooz) c9!-Ot'9I '901 UO!jfl3Ji3
'qdvouio1 3UJ3jO3 jtoido cq sisoijosoioq urnnnqjo 'ioi.uoj ç pu 'uiodj i a '2ui H U 'AO)jISUs 'uw •I •D 'J1OpujIj3 H •){ 'Uf •{ •I 'Z31y •j II 'JSflOH •1 •S 'WflOH H 'r2Jqsnq H
•(zooz) 6091'09 '6E I°!PD HOD '"V I JIfl3StAU! T' uosuEdwoo :qdiowo2 ouioqoo jgoido 2rnsn suoid ut snbEjd 3tIOJ3SOJ3E £UUOJOO jo uotztjflSiA,, 1 0 pU 'Z201V J H 'JOSflOH 1 S 'A02U13m0d
•a 'jiopuqo H •)[ 'AO)fqS!qs 'ioq •H •:( 'UflOS j { 'Id M S 'Id f S '&1 II U E fl 'Uf ){ (L661) 91 1-011 '1 •2d0 •f 'mu j9Øj suiopiEjd joudojo piowdojAop
042 Ui psn sjuou &nqiosq pu &iuouiosjo siodoid joiickj,, 'Nd V S pui 'UOSOd S I 'UOS1O)J Q a 61 (Eooz) OZ9irZI9t' 'Zt' idO iddy 's3ido1d jgoido t3ipoi.uoiqjo uowuauioop .ioj swosAs
30u1fl331J01-3snJJ!p PAIOSO1 Xjpuodui3 pu A1jggds jo uosudmo3,, 'sp&i-uossipuy s p 'uu s r 1 juJ3qxopui/pt/oJJos/npioOjtUo//:aflq 6661 0JWJ0S &ujqno-uippy OSJAU 'jqJd v s LI
(c661) T El 'LI' •pwO1H SIUJ2OJd spoq1V1 12ndmo3 'snss! P°°'I'W" U! iodsui qjjo &Iqopow oIJgD uoj — 1F1DN,, '2uq2 b '1 pU 'snbotç •i •s '&1M II '191
(66J) zo9 'Z 2d0 iddy 'Lui.uoojjoi oouoJoqoo-A&oI Aq snssi poiooiqjo sqidoid joidojo 'iuuo j j pui 'pnu y 'uu'qos vi 1 çj
(6661)
9St1-t'8N 't'Z 1231 ido ouoiqoo joi2do .ioj su2isp Jomo1JJ3pJ! tmdO,, 'wzi v r pu suuo-a vi v (L661) EISTITSI 'ZZ 2201 idO 1OTUOO
osqd psq-&i!2i i qu &uuuios App-dnoi2 pu -sqd poods-q!,, 0 1 pU 'rnimo 'Auioj j (oooz) ZTI 'Z9 T A)J
sqj 'rnpw uuos-ojd12jnm wopui in oouatoqoo jotdo OSJ3ASUEIJO uo1doJd,, 'J3U1tE>J 9 JAI pU &Iq3 (000z) f7L17Z17917Z 'Li V W 0s idO f 'uIrnp31u wopuJ UI UU3U3S flU pU UOPUJ OSflJJ!p
ioj uouounj uotinqusip oods-sqd J3u2IM oq ioj uoiuljos uuoJ pSOj3,, 'uOSJ3pUy a d pu '3UJUJ 1 1 II (9861 V3 "IIA I1'W 'S)jOOfl 3UOI3 XPSJ3AWfl) SJaSV7 'ugw.8 a v 01
(oooz) f8i 'Li V W °°S 2d0 1 '3jdIouud pUSoJd-suicnH popux oq uo psq suisAs Aqdiuomo ouiqoo jEoido Jo S!SfcjrnJV,, 'UOSJpUV a d pu 'Jn 1 II 'UJ4J 16
150 Proc. of SPIE Vol. 5771
Downloaded from SPIE Digital Library on 04 Jul 2011 to 130.235.188.41. Terms of Use: http://spiedl.org/terms