features of dust devils in the urban area detected by a 3 ... · features of dust devils in the...
TRANSCRIPT

Features of dust devils in the urban area detected by a 3-D scanning Doppler lidar
15th Coherent Laser Radar ConferenceToulouse, June 22-26, 2009
in Bolivia(1Graduate School of Environmental Sci., Hokkaido Univ.; 2National Defense Academy; 3Institute of Low Temperature Sci., Hokkaido Univ.)
Chusei Fujiwara1, Kazuya Yamashita2, Mikio Nakanishi3,Yasushi Fujiyoshi4
OutlineMotivation
- What is dust devil?
- Possible formation mechanism of dust devils.
- Early studies issues
Specification of the Doppler Lidar
Results
- What is main organized airflow structure in urban area?
- Can we detect dust devils in urban area by Doppler lidar?
Summary and a future study
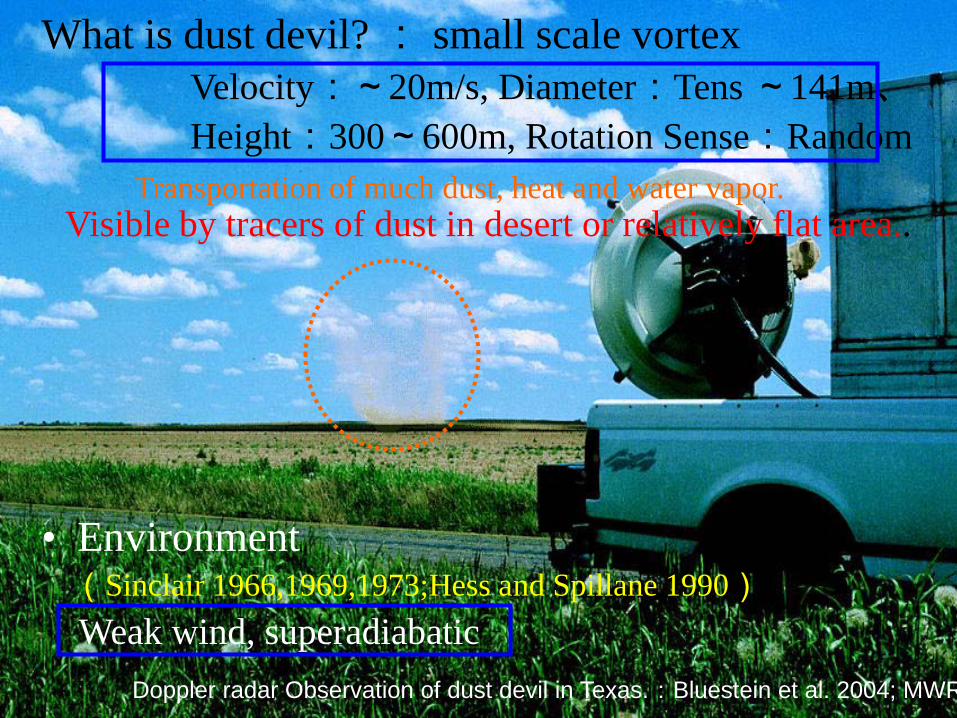
Doppler radar Observation of dust devil in Texas.:Bluestein et al. 2004; MWR
What is dust devil? : small scale vortex Velocity:~20m/s, Diameter:Tens ~141m、Height:300~600m, Rotation Sense:Random
Transportation of much dust, heat and water vapor.
• Environment(Sinclair 1966,1969,1973;Hess and Spillane 1990)Weak wind, superadiabatic
Visible by tracers of dust in desert or relatively flat area..
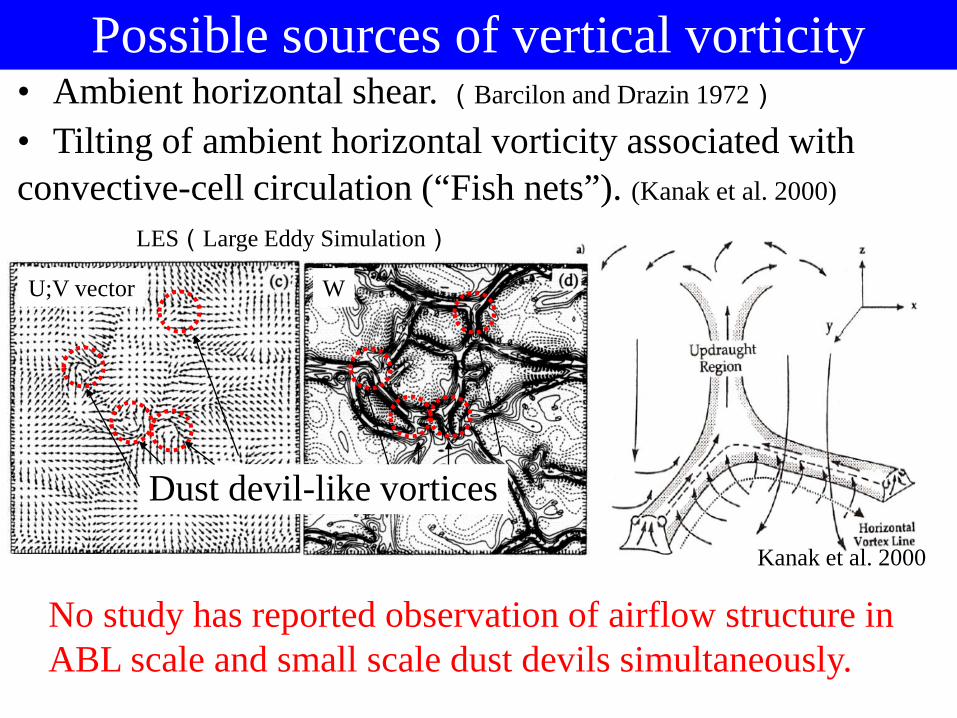
Possible sources of vertical vorticity • Ambient horizontal shear. (Barcilon and Drazin 1972)
• Tilting of ambient horizontal vorticity associated with convective-cell circulation (“Fish nets”). (Kanak et al. 2000)
Kanak et al. 2000
U;V vector W
LES(Large Eddy Simulation)
Dust devil-like vortices
No study has reported observation of airflow structure in ABL scale and small scale dust devils simultaneously.

Invisible dust devil?Aircraft encounters with strong vortices over the boreal forest.
MacPherson and Betts 1997; JGR
East wind component
vertical wind component
BORES (Boreal Ecosystem/Atmosphere Study)

Pourpose1. What is main organized airflow structure in urban area? 2. Can we detect dust devils in urban area by Doppler lidar?- What are the characteristics of dust devils?-What airflow structures generate dust devils?-What environmental conditions favor dust devils?
IshikariBay
Mountainousarea
Urban
HokkaidoUniversity
Toyohirariver
4.4km
2km
Suburb
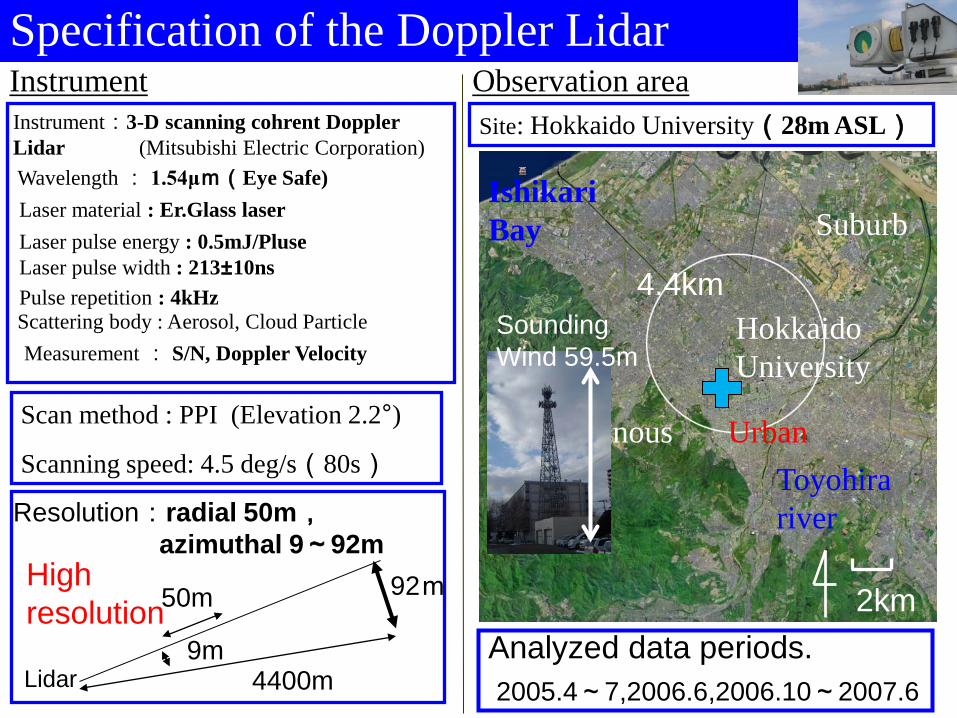
Specification of the Doppler Lidar
Site: Hokkaido University(28m ASL)Observation area
Wavelength : 1.54μm(Eye Safe)
Scattering body : Aerosol, Cloud Particle
Instrument:3-D scanning cohrent Doppler Lidar (Mitsubishi Electric Corporation)
Measurement : S/N, Doppler Velocity
Scan method : PPI (Elevation 2.2°)
Scanning speed: 4.5 deg/s(80s)
Instrument
Resolution:radial 50m,azimuthal 9~92m
High resolution
9m
92m50m
4400mLidar
SoundingWind 59.5m
Analyzed data periods.2005.4~7,2006.6,2006.10~2007.6
Laser material : Er.Glass laserLaser pulse energy : 0.5mJ/Pluse
Pulse repetition : 4kHzLaser pulse width : 213±10ns

(Etling and Brown,1993)
NASDA,NASA
1. What is main organized airflow structure in urban area?
Bluestein et al. 2004 Hardy and Ottersten1969
Yamashita et al. 2005Etling and Brown,1993

Airflow structure in ABL scale.Fish nets by LES (Nakanishi 2000)(Δx=Δy=50m,Δz=25m)
Zi(Boundary layer height)~850m
2006/10/1 11:35 Elevation 2.2°Obs:Doppler velocity
Weak wind(1.5ms-1), large sensible flux
LES:u,v vector; w (Elevation 2.2°)

Airflow structure in ABL scale.Fish nets by LES (Nakanishi 2000)(Δx=Δy=50m,Δz=25m)
The observational pattern is considered to show the existence of “Fish nets”.
2006/10/1 11:35 Elevation 2.2°Obs:Doppler velocity
Weak wind(1.5ms-1), large sensible flux
LES:Doppler velocity
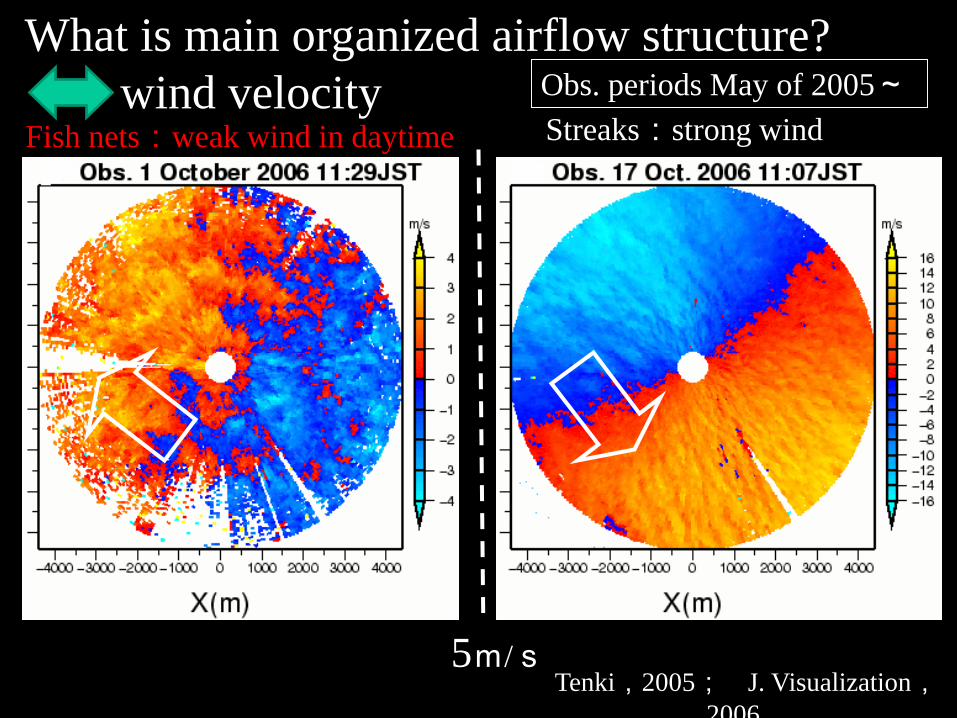
What is main organized airflow structure? wind velocity
Tenki,2005; J. Visualization,2006
Fish nets:weak wind in daytime Streaks:strong wind
5m/s
Obs. periods May of 2005~
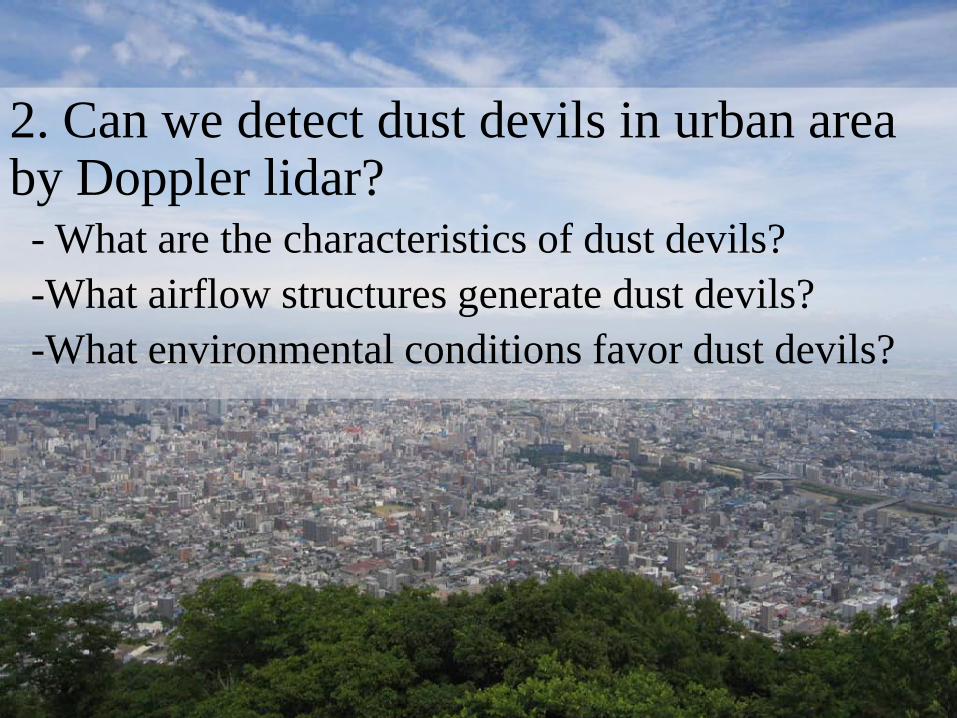
2. Can we detect dust devils in urban area by Doppler lidar?- What are the characteristics of dust devils?-What airflow structures generate dust devils?-What environmental conditions favor dust devils?

Detection of vortex (Suzuki et al. 2006)• To detect large Azimuthal
derivation• To detect maximum andminimum Doppler velocity.
• To fit Rankine vortex.
rvs 20ζ=
ravs
12
20 ⋅=
ζ
)0( ar ≤≤
)( ra <
DVV )(2 m im a x−=δ
Calculation of vorticity(Bluestein et al. 2004)
RemoveNoise.
・raw data
)2( aD =
D=175m,V=6.32ms-1
D is the distance between maximum and minimum velocities.

Detection of dust devil (05/06/24)9:01-9:43
〜80s/one scan
Dust devil
El2.2O
44-198m(AGL)

Detection of vortices (05/06/24)
110m,-0.11s-1
90m,0.15s-1
A: Cyclonic
B: Anticyclonic
Dust devils were observed in “fish nets”
Rotation is random

Characteristics and environment
Time Diameter Max Rotation Vectorial ziVPT Tota
l
Vorticity direction Mean U Lapse rate
(JST) (m) (s-1) +/- (ms-1) (m) (x10-2Km-1)
2005/5/25 09:29-10:11 30-110 0.25 11/3 0.3 1150 2.0 142007/6/22 11:48-12:33 70-120 0.21 6/2 1.0 950 - 82005/7/17 10:58-11:41 30-120 0.26 7/3 1.1 950 - 102007/4/14 12:47-13:22 50-90 0.19 1/3 1.1 1150 - 42005/6/24 09:01-09:43 50-100 0.19 3/1 1.3 900 1.5 42005/4/24 14:04-14:46 50-90 0.15 1/3 2.0 650 - 42005/6/1 09:01-09:43 40-80 0.17 3/3 2.2 750 1.1 6
Weak wind, Large Zi, daytime,Superadiabatic
Similar feature in past studies.(e.g. Sinclair 1969; Hess and Spillane 1990)
Diameter: 30-120m, Maximum vorticity: 0.15-0.26s-1
Rotation direction cyclonic:anticyclonic=2:1
・Vorticity is absolute value, Zi estimated by RHI observation, Wind (59.5m ASL at SJMA),VPT lapse rate by using souding data from 1.5 to 100m, Net Radiation (ILTS observation)
・Only strong vortices (more than |0.1| s-1)

Summary
• In urban area, Sapporo, for the first time, we were able to detect “invisible dust devils” (phantom vortices) by using the Doppler lidar.
• When dust devils appeared, wind was weak, lapse rate was superadiabatic, and the “Fish nets” of wind fields was also detected by the Doppler lidar.
• Summary of dust devils’ characteristics: diameter (30-120m), maximum vorticity (0.15-0.26s-1), ratio of cyclonic to anticyclonic rotation (2:1).

Future study: other sources of vertical vorticityDust devils are seen to occur along Sea-breeze front.This fact suggests that horizontal shear associated with the sea-breeze front would play an important role in their formation.
07/6/9 18:12
S/N(EL2.2°) Doppler velocity(EL2.2°)
We plan to examine cases of airflow structures different from fish net and to discuss source of such vertical vortices.
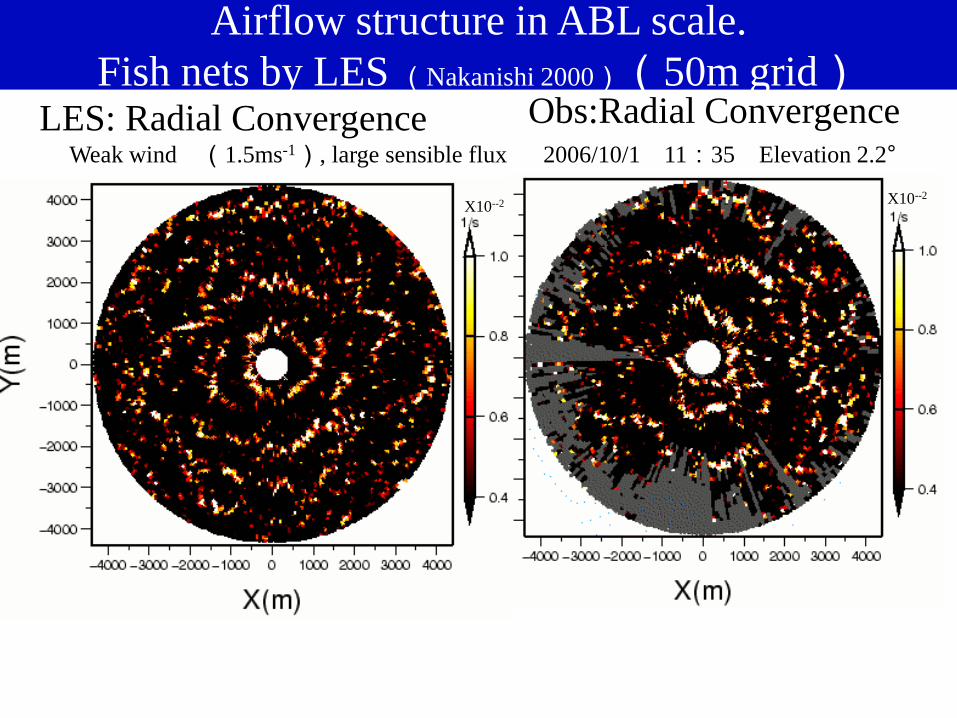
2006/10/1 11:35 Elevation 2.2°Obs:Radial Convergence
Weak wind (1.5ms-1), large sensible fluxLES: Radial Convergence
Airflow structure in ABL scale.Fish nets by LES (Nakanishi 2000)(50m grid)
X10--2 X10--2
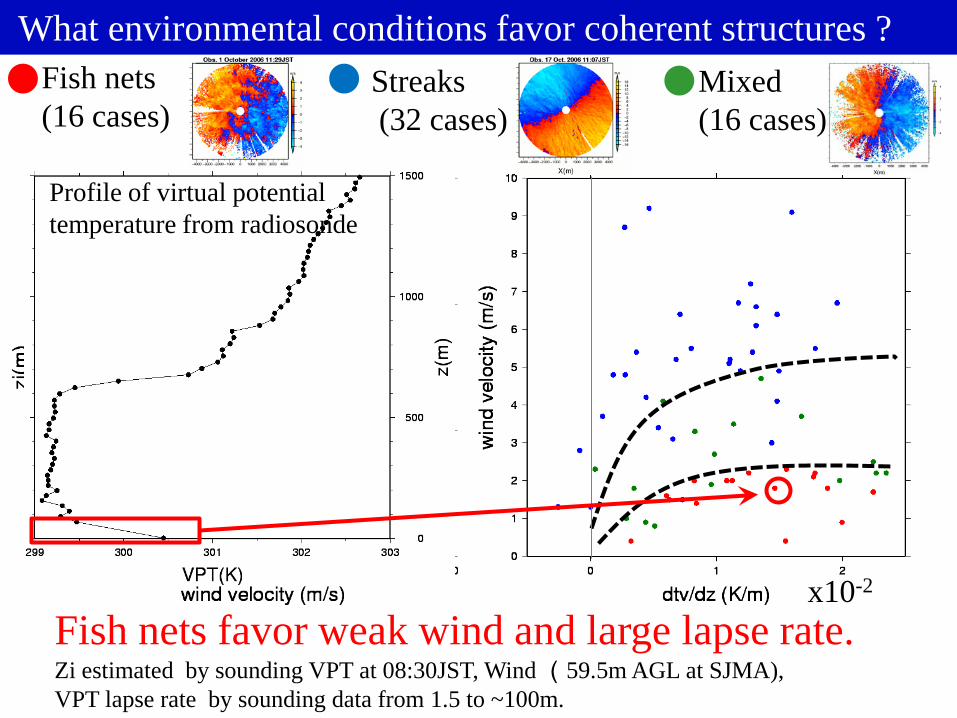
What environmental conditions favor coherent structures ? Fish nets(16 cases)
Streaks(32 cases)
Mixed(16 cases)
Zi estimated by sounding VPT at 08:30JST, Wind (59.5m AGL at SJMA),VPT lapse rate by sounding data from 1.5 to ~100m.
Fish nets favor weak wind and large lapse rate.
Profile of virtual potential temperature from radiosonde
x10-2

Discussion: Occurrence time of dust devilsDeveloped “fish nets” appeared from 9-13JST.Superadiabatic & large zi & weak wind Large -zi/L(Hess and Spillane, 1990 )
1.Morning- “fish nets”, but weak updraft 2.Afternoon- strong wind (streak pattern) caused by convective mixing- “fish nets” are broken upby sea-breeze
Fish nets Streaks Mixed
Dust devils

Environment05/6/24
Superadiabatic, large Zi and weak wind
strongly unstable
MODISJAXA/EORC10:21JST
Fine day
9:51JST Zi=900m
Zi developedZi: height of the maximum negative gradient of S/N
Moderately Superadiabatic
8:30JST Zi=650m
Profile of virtual potential temperature from radiosonde

Zi(Boundary layer height)~700m
2006/10/17 11:07 Elevatio Obs:Doppler velocity
Strong wind(15ms-1), small sensible fluxLES:w (Elevation 2.2°)
Airflow structure in ABL scale.Streaks by LES (Nakanishi 2000)(Δx=Δy=50m,Δz=25m)

Zi(Boundary layer height)~700m
2006/10/17 11:07 Elevatio Obs:Doppler velocity
Strong wind(15ms-1), small sensible fluxLES:Doppler velocity (Elevation 2.2°)
Airflow structure in ABL scale.Streaks by LES (Nakanishi 2000)(Δx=Δy=50m,Δz=25m)
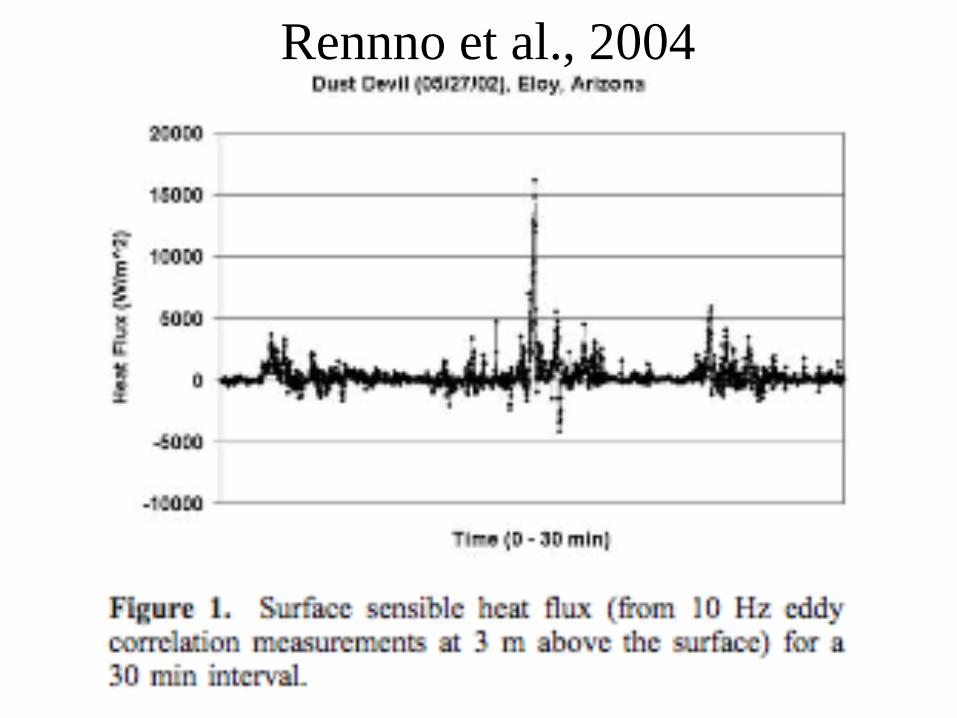
Rennno et al., 2004
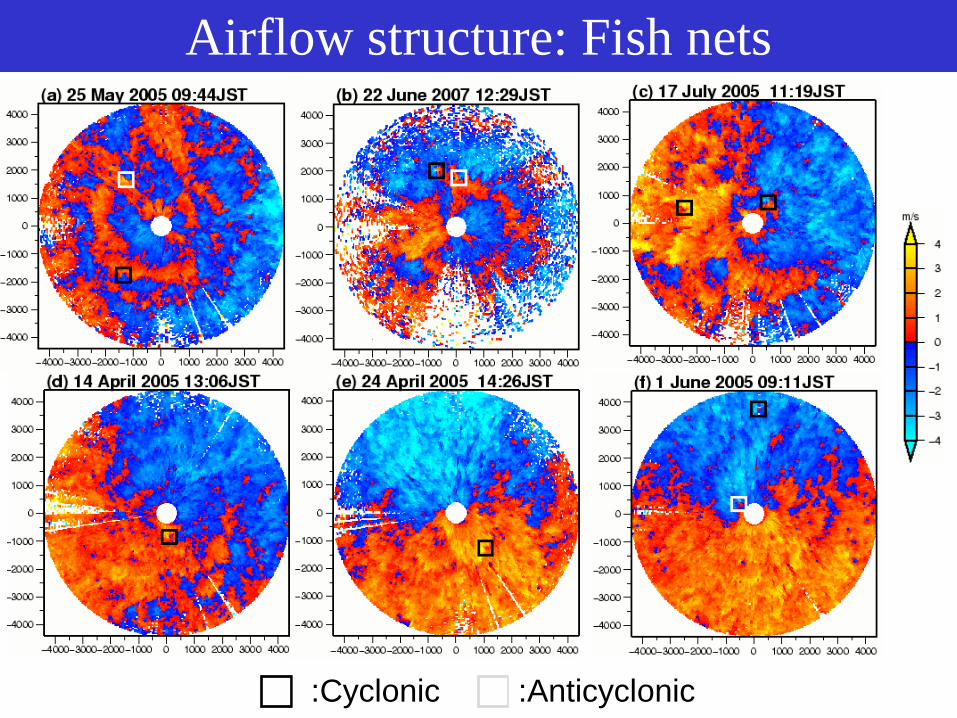
Airflow structure: Fish nets
:Cyclonic :Anticyclonic

Difference between tornado and dust devilMax. wind <142ms-1 <20ms
-1
Diameter 100m~1000m 10-141m
Rotation 85%(anticyclonic) randomWhere/when Cumlusnimbus in daytimeFormation Supercell Fish nets ?
Non supercell Local front?Developing updraft of upper layer Buoyancy near
surface
Boliviaにて

Tilting of ambient horizontal vorticity associated with convective-cell circulation (“Fish nets”). (Kanak et al. 2000)
Fish nets(Boundary layer scale)(No wind, large sensible flux)
U,V vector w
LES(Large Eddy Simulation)
①Horizontal vortex line
②Advection of horizontal vortex
③Formation of vortex pair by tilting of horitiontal vortex
Distribution of horizontal wind
(Kanak et al., 2000)
Vertical vorticesMicroscale
3-D airflow structueUpdraftregionDowndraft
regionDowndraft regionUpdraft region
Cyclonic Anti-cylonic

Vertical structure
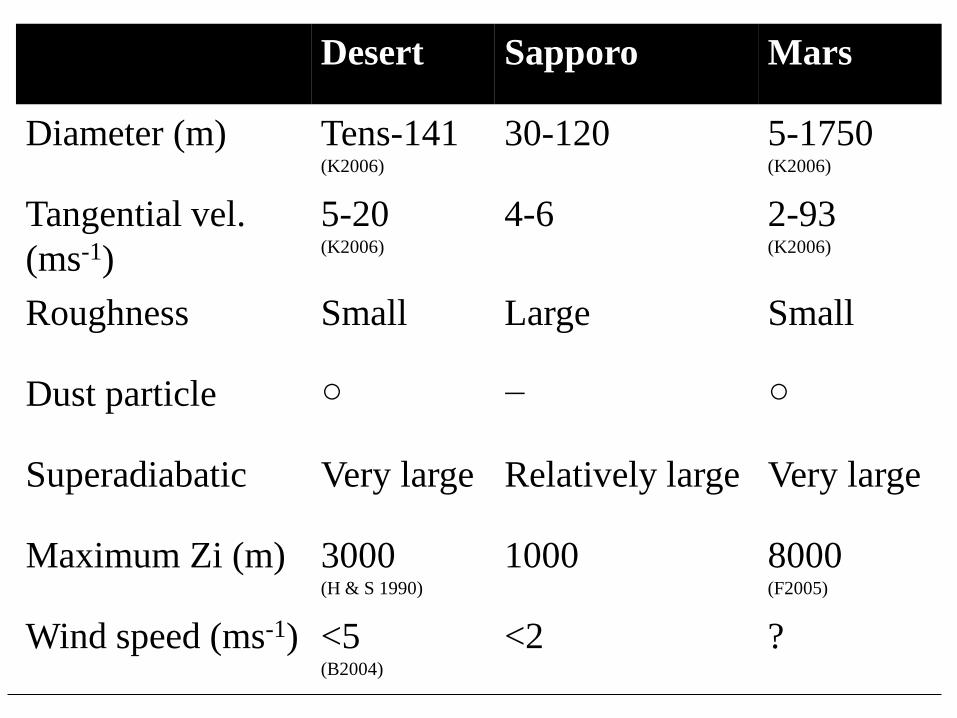
Desert Sapporo Mars
Diameter (m) Tens-141(K2006)
30-120 5-1750(K2006)
Tangential vel. (ms-1)
5-20(K2006)
4-6 2-93(K2006)
Roughness Small Large Small
Dust particle ○ − ○
Superadiabatic Very large Relatively large Very large
Maximum Zi (m) 3000(H & S 1990)
1000 8000(F2005)
Wind speed (ms-1) <5(B2004)
<2 ?
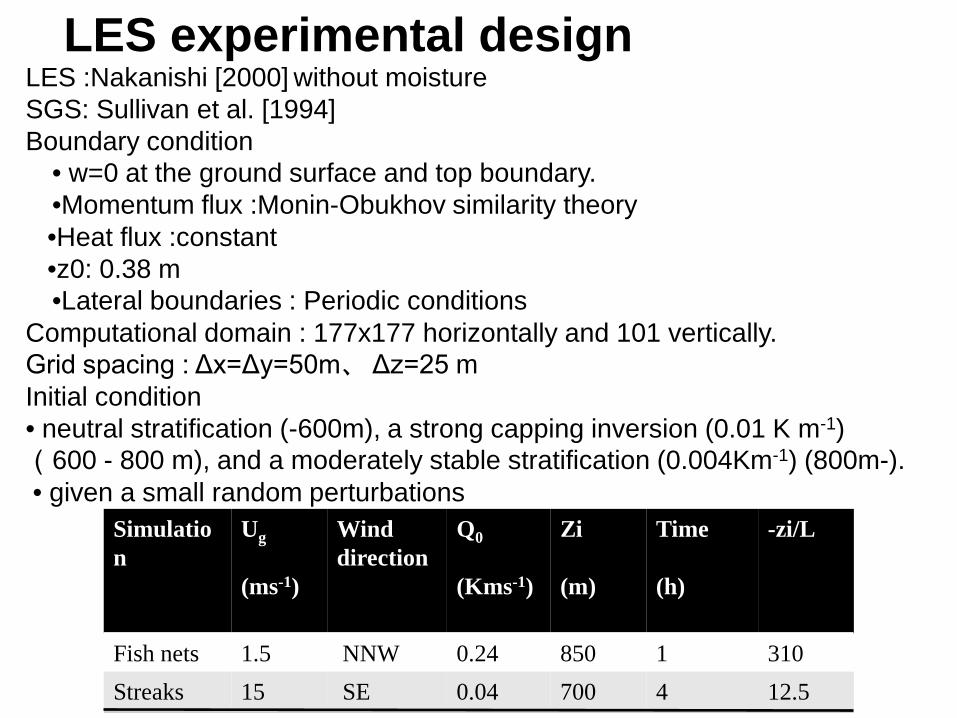
LES experimental designLES :Nakanishi [2000] without moisture SGS: Sullivan et al. [1994]Boundary condition
• w=0 at the ground surface and top boundary. •Momentum flux :Monin-Obukhov similarity theory•Heat flux :constant•z0: 0.38 m •Lateral boundaries : Periodic conditions
Computational domain : 177x177 horizontally and 101 vertically. Grid spacing : Δx=Δy=50m、Δz=25 mInitial condition• neutral stratification (-600m), a strong capping inversion (0.01 K m-1) (600 - 800 m), and a moderately stable stratification (0.004Km-1) (800m-).• given a small random perturbations
Simulation
Ug
(ms-1)
Winddirection
Q0
(Kms-1)
Zi
(m)
Time
(h)
-zi/L
Fish nets 1.5 NNW 0.24 850 1 310Streaks 15 SE 0.04 700 4 12.5