flow charts including process mapping sector enterprise quality – quality and mission assurance...
TRANSCRIPT

HEADER / FOOTER INFORMATION (SUCH AS PRIVATE / CONFIDENTIAL)
Flow Chartsincluding
Process Mapping
Sector Enterprise Quality – Quality and Mission AssuranceNorthrop Grumman CorporationIntegrated Systems
CA/PA-RCA : Basic Tool

2
What is a Process Flow Chart?
1. A Process Flowchart is a graphic representation
of all the major steps of a process.
It can help you:
a. Understand the complete process.
b. Identify the critical stages of a process.
c. Locate problem areas.
d. Show relationships between different steps in
a process.
e. To identify and eliminate Waste

3
Why use a Flow Chart?
Process Flowcharts or Process Mapping helps you understand and improve a process by enabling you to:
• Look for opportunities for improvement (gap between reality and ideal).
• Identify where defects are found (and where they are introduced).
• Identify where measurements need to be put in place.
• See where rework and bottlenecks occur.
• Elimination of Non Value Adding activities (Waste)

4
There are three major form of Process Map. These are:
Macro: High Level Overview; Entire Process; Links with other Processes (the Big Picture)
Micro: Operational Level; Practical Links between Inputs & Outputs; Operational Measurements & Controls
Hyper-Micro: Design Level; Details into Operator Methods; Material or Information (Input) Specification (Accuracy & Precision); System Functionality
Tip !
If in doubt about which Process Map to use, start at the MACRO level.
Flowchart/Process Map levels
5
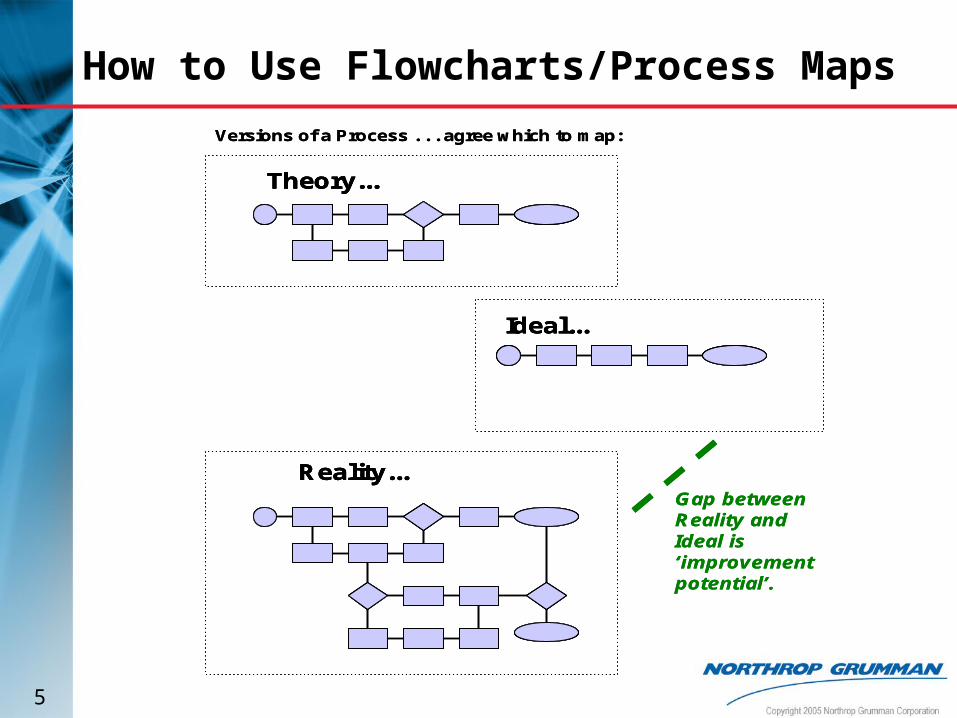
How to Use Flowcharts/Process Maps
Versions of a Process . . . agree which to map:
Theory...
Ideal...
Reality...Gap between Reality and Ideal is ‘improvement potential’.
Versions of a Process . . . agree which to map:
Theory...Theory...
Ideal...Ideal...
Reality...Reality...Gap between Reality and Ideal is ‘improvement potential’.

6
Considerations when Flowcharting/Process Mapping
• Remember S-I-P-O-C (Supplier-Inputs-Process-Outputs- Customer). Start with C, then O, then S, then I, then P
• What level and details are required?
• What is a CTQs and non-CTQ-activity?
• What are the Measurable outputs?
• Know when to stop!
• Space, Time allowances (best time, day of the week to do it is ?)
• Group Dynamics: Leader, Facilitator, Size of Group
• Using Post-It® Notes / Wallpaper
• If available and appropriate, use Electronic versions ( use Aerospace-Industry standards)
7
How do I do it?
As a team, define:
• process boundaries
• where does the process start
• what does the process include/non include
• where does the process end
• customer C.T.Q.’s; level of detail;
• key process inputs (supplier) and outputs
(customer requirements);
• identify and sequence process steps;
• discuss and analyse the process;
• agree next steps and next review.

8
How do I do it? (cont’d)
Create a basic template of the process:
Process NameSuppliers Outputs Customers
Boundaries
Inputs
start end
1. Use sheets of flip-chart paper (or wallpaper), 3” x 3” Post-It® notes, and felt tip pens.
2. Define the process or service to be improved and write the name of the process on a
Post-It® note.
3. Agree on the scope of the process to be mapped, and mark process boundaries with
tape.
4. List suppliers,customers, and inputs/outputs to/from the process.
5. Define start and end process steps.

9
How do I do it? (cont’d)
Brainstorm the steps in the process
Process NameSuppliers Outputs Customers Inputs
start end
Tips:
At this stage
• Do not try to establish order
• Do not discuss process steps

10
How do I do it? (cont’d)
Group into major process areas
Process NameSuppliers Outputs Customers Inputs
start end
Tip: • decide on level of detail• arrange Post-Its ® in sequence (horizontally, vertically)
Tip:Process steps should be Value-added… i.e. answer “yes” to these questions:
• Does the customer care ?• Has something changed ?• Has it been done right first time ?

11
How do I do it? (cont’d)
Critically evaluate the ‘Final’ Process Map:
Process NameSuppliers Outputs Customers Inputs
start
end
• Use map to identify where defects occur, where defects are introduced and where measurements need to be taken.• Put attributes on each step - time, cost, value-added (from customer viewpoint).• Use process map referenced to physical process layout (Spaghetti chart analysis).• In complex maps, consider “Output to Input mismatch”.• Be consistent with decision arrows (“yes” arrows in same direction).• Challenge each process step and consider alternatives.• Ask the WHY, WHAT, WHERE, HOW, WHEN, WHO - type of questions.
