fm-afm study on hydrophilic and hydrophobic metal · pdf filefm-afm study on hydrophilic and...
TRANSCRIPT
FM-AFM study on hydrophilic and hydrophobic metal oxides
T. Hiasa1, K. Kimura
1, H. Onishi
1, R. Kokawa
1,2,3, M. Ohta
2, K. Watanabe
2, M. Yamazaki
2,3,
N. Oyabu3,4
, K. Kobayashi5 and H. Yamada
4
1Department of Chemistry, Kobe University, Rokko-dai, Nada, Kobe, Japan
2Shimadzu Corporation, Kyoto, Japan
3Japan Science and Technology Agency, Kawaguchi, Saitama, Japan
4Department of Electronic Science and Engineering, Kyoto University, Kyoto, Japan
5Innovative Collaboration Center, Kyoto University, Kyoto, Japan
e-mail address: [email protected]
Interfaces of metal oxide and aqueous solution receive increasing interest due to their
important role in nature and in industries. The topography of oxide surfaces immersed in
solutions has been observed since AFM was invented in 1985. Fukuma et al. [1] observed tip-
surface force modulated as a function of tip-surface distance using an advanced FM-AFM.
The modulated force was ascribed to the localy modulated occupation probability of water
molecules. Kimura et al. [2] further determined two-dimensional frequency-shift maps over a
solution-mica interface and compared with a theoretical simulation. In the present study, two-
dimensional frequency-shift maps were observed over solution-Al2O3 and solution-TiO2
interfaces, as an extension of our force-distance curve study over TiO2 [3].
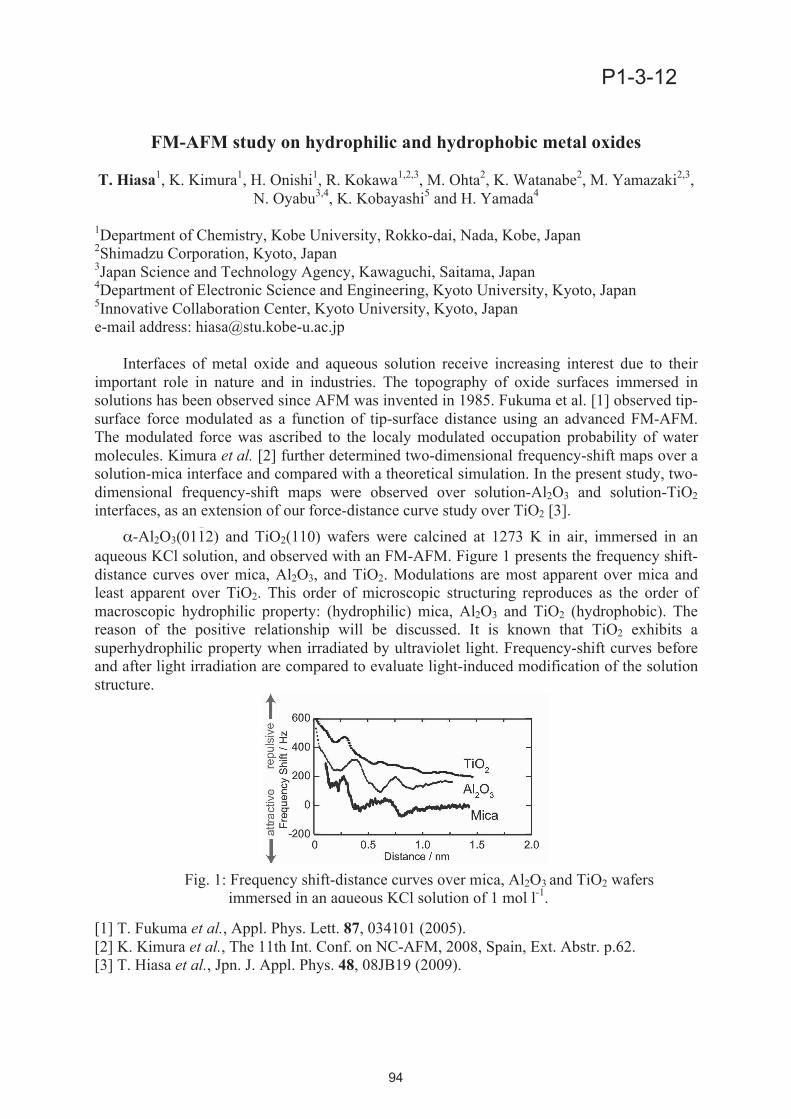
-Al2O3(0112) and TiO2(110) wafers were calcined at 1273 K in air, immersed in an
aqueous KCl solution, and observed with an FM-AFM. Figure 1 presents the frequency shift-
distance curves over mica, Al2O3, and TiO2. Modulations are most apparent over mica and
least apparent over TiO2. This order of microscopic structuring reproduces as the order of
macroscopic hydrophilic property: (hydrophilic) mica, Al2O3 and TiO2 (hydrophobic). The
reason of the positive relationship will be discussed. It is known that TiO2 exhibits a
superhydrophilic property when irradiated by ultraviolet light. Frequency-shift curves before
and after light irradiation are compared to evaluate light-induced modification of the solution
structure.
[1] T. Fukuma et al., Appl. Phys. Lett. 87, 034101 (2005).
[2] K. Kimura et al., The 11th Int. Conf. on NC-AFM, 2008, Spain, Ext. Abstr. p.62.
[3] T. Hiasa et al., Jpn. J. Appl. Phys. 48, 08JB19 (2009).
Fig. 1: Frequency shift-distance curves over mica, Al2O3 and TiO2 wafers
immersed in an aqueous KCl solution of 1 mol l-1
.
94
P1-3-12