forward variable selection improves the power of random
TRANSCRIPT

Forward variable selection improves the power ofrandom forest for high-dimensional microbiomedataTung Dang ( [email protected] )
The University of Tokyo Graduate School of Agricultural and Life Sciences Faculty of Agriculture: TokyoDaigaku Daigakuin Nogaku Seimei Kagaku Kenkyuka Nogakubu https://orcid.org/0000-0002-4974-9632Hirohisa Kishino
University of Tokyo: Tokyo Daigaku
Methodology
Keywords: 16S rRNA gene amplicon data, Shotgun metagenomics data, Random forest, Forward variableselection, Phylogenetic analysis
Posted Date: April 5th, 2021
DOI: https://doi.org/10.21203/rs.3.rs-319022/v1
License: This work is licensed under a Creative Commons Attribution 4.0 International License. Read Full License

1
Forward variable selection improves the power of random forest for high-
dimensional microbiome data
Tung Dang1,* and Hirohisa Kishino1
1Department of Agricultural and Environmental Biology, The University of Tokyo, Tokyo, Japan
*Corresponding author: [email protected]; [email protected]
Full list of author information is available at the end of the article

2
Abstract
Background: Random forest (RF) captures complex feature patterns that differentiate groups of samples and is rapidly being
adopted in microbiome studies. However, a major challenge is the high dimensionality of microbiome datasets. They include
thousands of species or molecular functions of particular biological interest. This high dimensionality significantly reduces
the power of random forest approaches for identifying true differences. The widely used Boruta algorithm iteratively removes
features that are proved by a statistical test to be less relevant than random probes.
Result: We developed a massively parallel forward variable selection algorithm and coupled it with the RF classifier to
maximize the predictive performance. The forward variable selection algorithm adds new variable to a set of selected variables
as far as the prespecified criterion of predictive power is improved. At each step, the parameters of random forest are
optimized. We demonstrated the performance of the proposed approach, which we named RF-FVS, by analyzing two
published datasets from large-scale case-control studies: (i) 16S rRNA gene amplicon data for Clostridioides difficile infection
(CDI) and (ii) shotgun metagenomics data for human colorectal cancer (CRC). The RF-FVS approach further screened the
variables that the Boruta algorithm left and improved the accuracy of the random forest classifier from 81% to 99.01% for
CDI and from 75.14% to 90.17% for CRC.
Conclusion: Valid variable selection is essential for the analysis of high-dimensional microbiota data. By adopting the Boruta
algorithm for pre-screening of the variables, our proposed RF-FVS approach improves the accuracy of random forest
significantly with minimum increase of computational burden. The procedure can be used to identify the functional profiles
that differentiate samples between different conditions.
Keywords: 16S rRNA gene amplicon data, Shotgun metagenomics data, Random forest, Forward variable selection,
Phylogenetic analysis
3
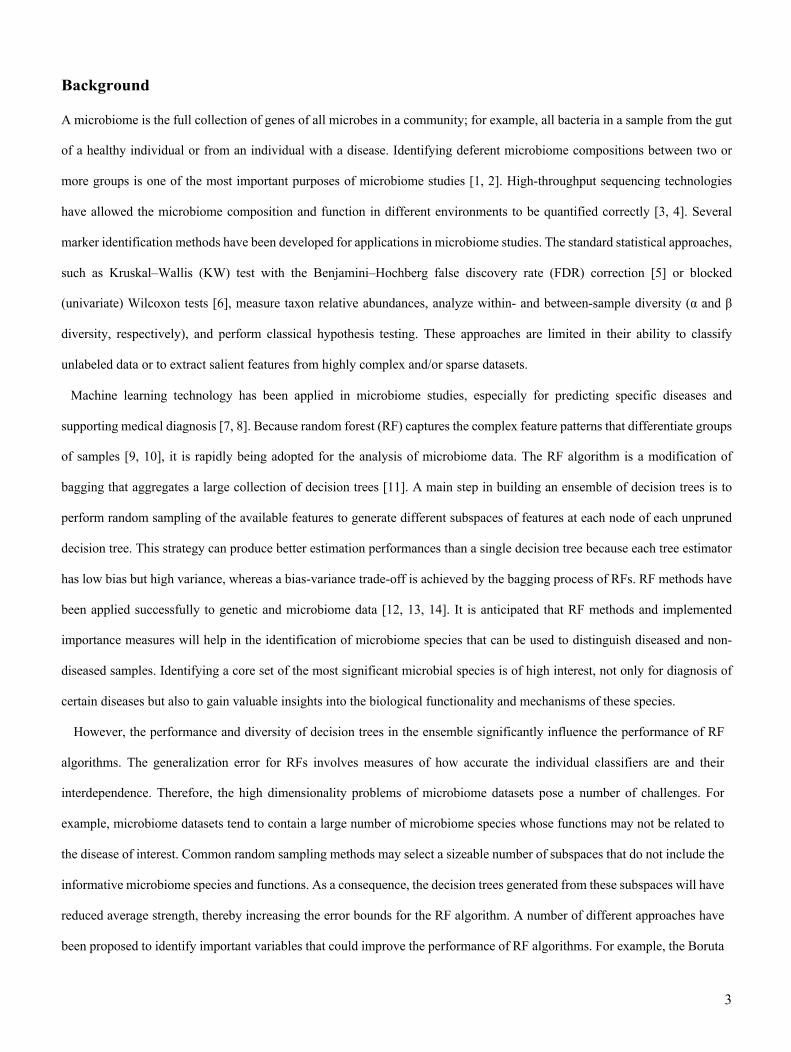
Background
A microbiome is the full collection of genes of all microbes in a community; for example, all bacteria in a sample from the gut
of a healthy individual or from an individual with a disease. Identifying deferent microbiome compositions between two or
more groups is one of the most important purposes of microbiome studies [1, 2]. High-throughput sequencing technologies
have allowed the microbiome composition and function in different environments to be quantified correctly [3, 4]. Several
marker identification methods have been developed for applications in microbiome studies. The standard statistical approaches,
such as Kruskal–Wallis (KW) test with the Benjamini–Hochberg false discovery rate (FDR) correction [5] or blocked
(univariate) Wilcoxon tests [6], measure taxon relative abundances, analyze within- and between-sample diversity (α and β
diversity, respectively), and perform classical hypothesis testing. These approaches are limited in their ability to classify
unlabeled data or to extract salient features from highly complex and/or sparse datasets.
Machine learning technology has been applied in microbiome studies, especially for predicting specific diseases and
supporting medical diagnosis [7, 8]. Because random forest (RF) captures the complex feature patterns that differentiate groups
of samples [9, 10], it is rapidly being adopted for the analysis of microbiome data. The RF algorithm is a modification of
bagging that aggregates a large collection of decision trees [11]. A main step in building an ensemble of decision trees is to
perform random sampling of the available features to generate different subspaces of features at each node of each unpruned
decision tree. This strategy can produce better estimation performances than a single decision tree because each tree estimator
has low bias but high variance, whereas a bias-variance trade-off is achieved by the bagging process of RFs. RF methods have
been applied successfully to genetic and microbiome data [12, 13, 14]. It is anticipated that RF methods and implemented
importance measures will help in the identification of microbiome species that can be used to distinguish diseased and non-
diseased samples. Identifying a core set of the most significant microbial species is of high interest, not only for diagnosis of
certain diseases but also to gain valuable insights into the biological functionality and mechanisms of these species.
However, the performance and diversity of decision trees in the ensemble significantly influence the performance of RF
algorithms. The generalization error for RFs involves measures of how accurate the individual classifiers are and their
interdependence. Therefore, the high dimensionality problems of microbiome datasets pose a number of challenges. For
example, microbiome datasets tend to contain a large number of microbiome species whose functions may not be related to
the disease of interest. Common random sampling methods may select a sizeable number of subspaces that do not include the
informative microbiome species and functions. As a consequence, the decision trees generated from these subspaces will have
reduced average strength, thereby increasing the error bounds for the RF algorithm. A number of different approaches have
been proposed to identify important variables that could improve the performance of RF algorithms. For example, the Boruta

4
algorithm [15] was proposed to identify a set of relevant features using an RF classification algorithm that iteratively removes
the variables using a statistical test. These relevant features are different from the objective of relevant and also non-redundant
feature subsets. Moreover, a standard permutation test [16] was proposed to estimate the distribution of measured importance
values of the RF algorithm for each predictor variable by repeatedly permuting the variable and randomly shuffling the data
values so that the original association between the response and predictor variables was destroyed. A high value of the
permutation importance of the predictor variable indicates high significant association to the response. However, the sizes of
the selected subsets of features are still large in the high-dimensional microbiome database, the power of RF algorithm is not
significantly improved, and it is difficult to interpret the selected features.
Although a number of different algorithms and tools have been developed for microbiome analysis [7], effective approaches
require a lot of possible combinations of variables, which exponentially increases the computational burden as the number of
involved features increases. Even though a small number of machine learning methods, including the RF algorithm, can be
easily parallelized, building prediction models for thousands of microbiome species and functions can be very time
consuming.
In this study, we propose a novel procedure that tackles the challenges described above. The core of our procedure is an RF
classifier coupled with forward variable selection (RF-FVS), which selects a minimal-size core set of microbial species or
functional signatures to maximize the predictive performance of the RF classifier. To reduce the computational cost, we
designed a parallelized algorithm and integrated a prescreen algorithm. To examine the performance of the RF-FVS approach,
we analyzed two empirical datasets from large-scale case control studies. One is a published case-control 16S rRNA gene
amplicon sequencing gut microbiome dataset with 3347 operational taxonomic units (OTUs) for Clostridioides difficile
infection (CDI) [17] from 338 individuals. The dataset included disease meta data and sequencing data for three groups: 89
individuals with CDI (cases), 89 with diarrhea who tested negative for CDI (diarrheal controls), and 155 non-diarrheal
controls. The other is a fecal shotgun metagenomic dataset [18] that included 290 samples from tumor-free controls and 285
samples from individuals with colorectal cancer (CRC). The RF-FVS serves as the basis for the integrated analysis of
microbiome data, detecting significant species in a phylogenetic tree [19] and predicting functional capabilities of microbial
communities based on 16S rRNA datasets [20]. To estimate the dependence of the pipeline on the quality of the microbiome
functional profile data, we analyzed the predicted functional profiles obtained from the 16S rRNA dataset, which were
approximately 85% accurate, and the functional profiles obtained from the shotgun metagenomic dataset. We found that our
RF-FVS performed well even for the predicted functional profile data.
Results
Improved accuracy for relative OTU abundance data from the 16S rRNA gene amplicon dataset
5
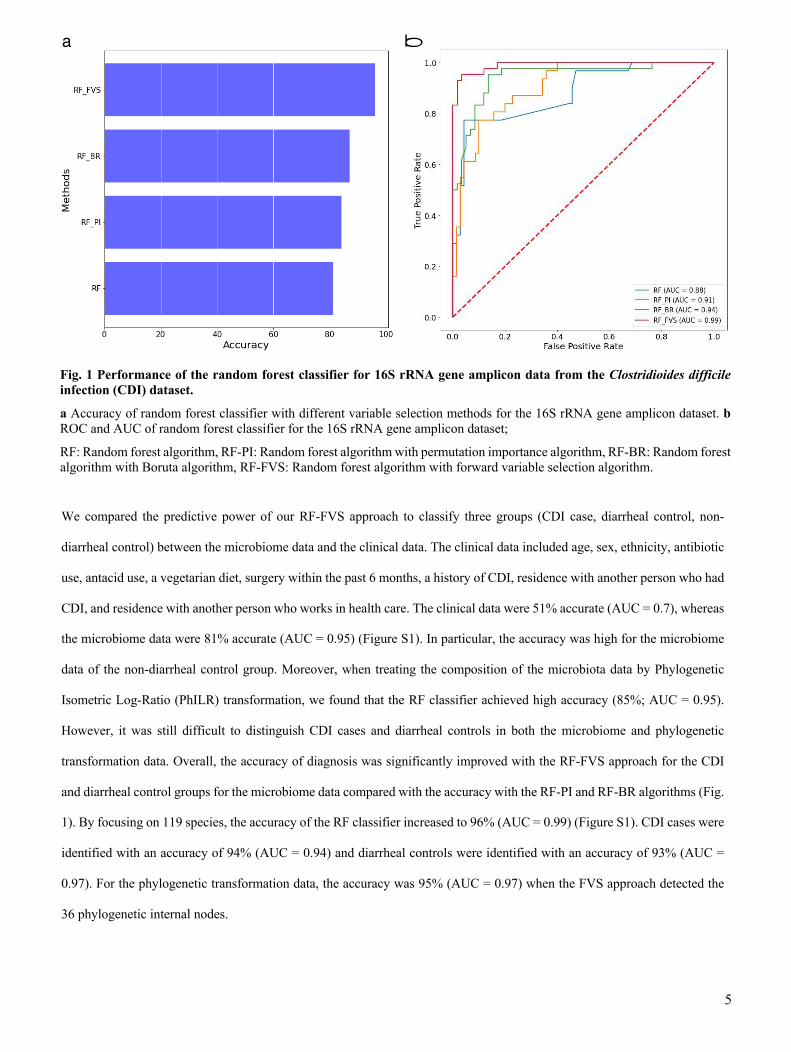
We compared the predictive power of our RF-FVS approach to classify three groups (CDI case, diarrheal control, non-
diarrheal control) between the microbiome data and the clinical data. The clinical data included age, sex, ethnicity, antibiotic
use, antacid use, a vegetarian diet, surgery within the past 6 months, a history of CDI, residence with another person who had
CDI, and residence with another person who works in health care. The clinical data were 51% accurate (AUC = 0.7), whereas
the microbiome data were 81% accurate (AUC = 0.95) (Figure S1). In particular, the accuracy was high for the microbiome
data of the non-diarrheal control group. Moreover, when treating the composition of the microbiota data by Phylogenetic
Isometric Log-Ratio (PhILR) transformation, we found that the RF classifier achieved high accuracy (85%; AUC = 0.95).
However, it was still difficult to distinguish CDI cases and diarrheal controls in both the microbiome and phylogenetic
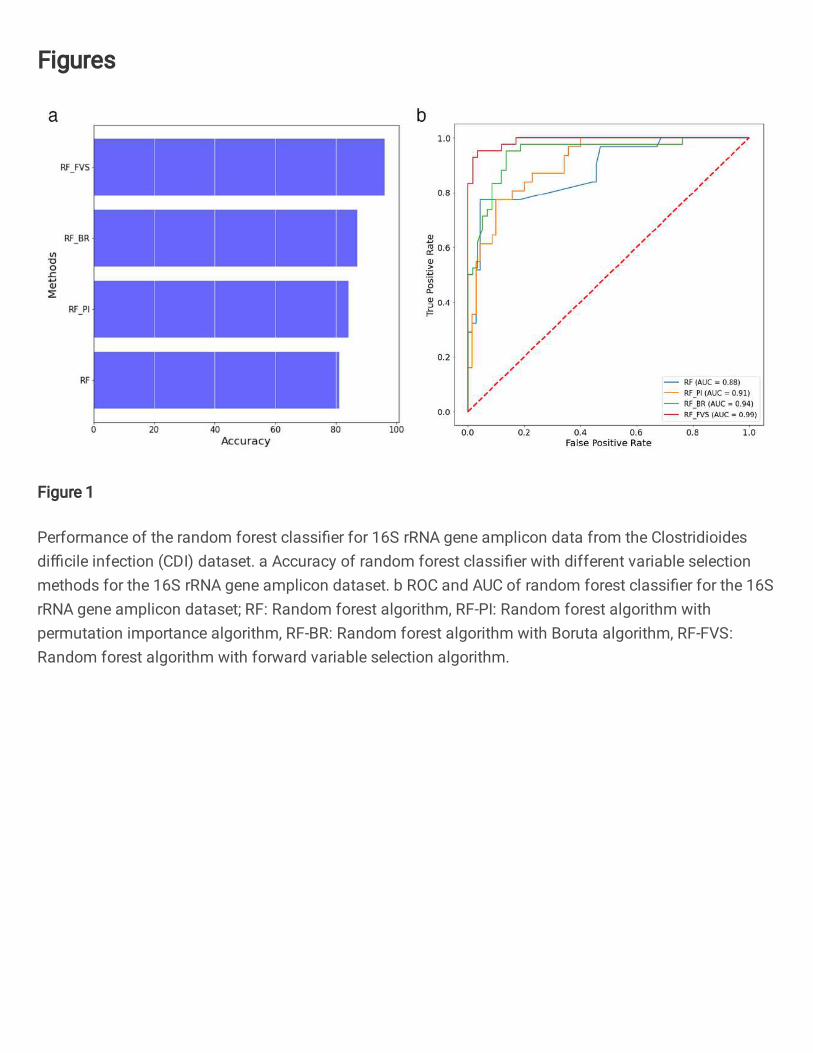
transformation data. Overall, the accuracy of diagnosis was significantly improved with the RF-FVS approach for the CDI
and diarrheal control groups for the microbiome data compared with the accuracy with the RF-PI and RF-BR algorithms (Fig.
1). By focusing on 119 species, the accuracy of the RF classifier increased to 96% (AUC = 0.99) (Figure S1). CDI cases were
identified with an accuracy of 94% (AUC = 0.94) and diarrheal controls were identified with an accuracy of 93% (AUC =
0.97). For the phylogenetic transformation data, the accuracy was 95% (AUC = 0.97) when the FVS approach detected the
36 phylogenetic internal nodes.
a b
Fig. 1 Performance of the random forest classifier for 16S rRNA gene amplicon data from the Clostridioides difficile
infection (CDI) dataset.
a Accuracy of random forest classifier with different variable selection methods for the 16S rRNA gene amplicon dataset. b
ROC and AUC of random forest classifier for the 16S rRNA gene amplicon dataset;
RF: Random forest algorithm, RF-PI: Random forest algorithm with permutation importance algorithm, RF-BR: Random forest
algorithm with Boruta algorithm, RF-FVS: Random forest algorithm with forward variable selection algorithm.
6
Mapping the selected species on the 16S rRNA phylogenetic tree
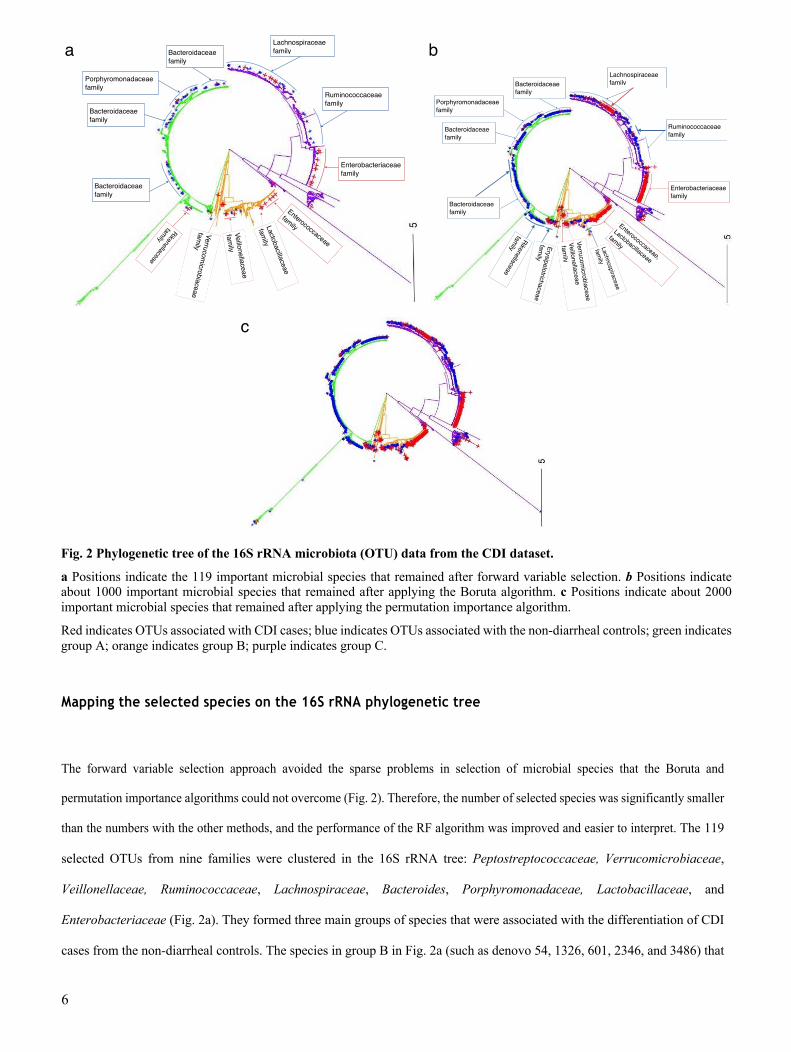
The forward variable selection approach avoided the sparse problems in selection of microbial species that the Boruta and
permutation importance algorithms could not overcome (Fig. 2). Therefore, the number of selected species was significantly smaller
than the numbers with the other methods, and the performance of the RF algorithm was improved and easier to interpret. The 119
selected OTUs from nine families were clustered in the 16S rRNA tree: Peptostreptococcaceae, Verrucomicrobiaceae,
Veillonellaceae, Ruminococcaceae, Lachnospiraceae, Bacteroides, Porphyromonadaceae, Lactobacillaceae, and
Enterobacteriaceae (Fig. 2a). They formed three main groups of species that were associated with the differentiation of CDI
cases from the non-diarrheal controls. The species in group B in Fig. 2a (such as denovo 54, 1326, 601, 2346, and 3486) that
Lachnospiraceae
family
Ruminococcaceae
family
Enterobacteriaceae
family
Bacteroidaceae
family
Bacteroidaceae
family
Bacteroidaceae
family
Porphyromonadaceae
family
Enterococcaceae
familyL
acto
bacilla
ceae
fam
ily
Veillo
nella
ceae
fam
ily
Verru
com
icro
bia
ceae
fam
ily
Rikenellaceae
family
a b
c
Lachnospiraceae
family
Lachnospira
ceae
fam
ily
Ruminococcaceae
family
Bacteroidaceae
family
Bacteroidaceae
family
Bacteroidaceae
family
Porphyromonadaceae
family
Rike
nella
ceae
fam
ily Ery
sip
elo
trichaceae
fam
ily
Enterococcaceae,
Lactobacillaceae
family
Enterobacteriaceae
family
Verru
com
icro
bia
ceae
Veillo
nella
ceae
fam
ily
Fig. 2 Phylogenetic tree of the 16S rRNA microbiota (OTU) data from the CDI dataset.
a Positions indicate the 119 important microbial species that remained after forward variable selection. b Positions indicate about 1000 important microbial species that remained after applying the Boruta algorithm. c Positions indicate about 2000
important microbial species that remained after applying the permutation importance algorithm.
Red indicates OTUs associated with CDI cases; blue indicates OTUs associated with the non-diarrheal controls; green indicates
group A; orange indicates group B; purple indicates group C.
7
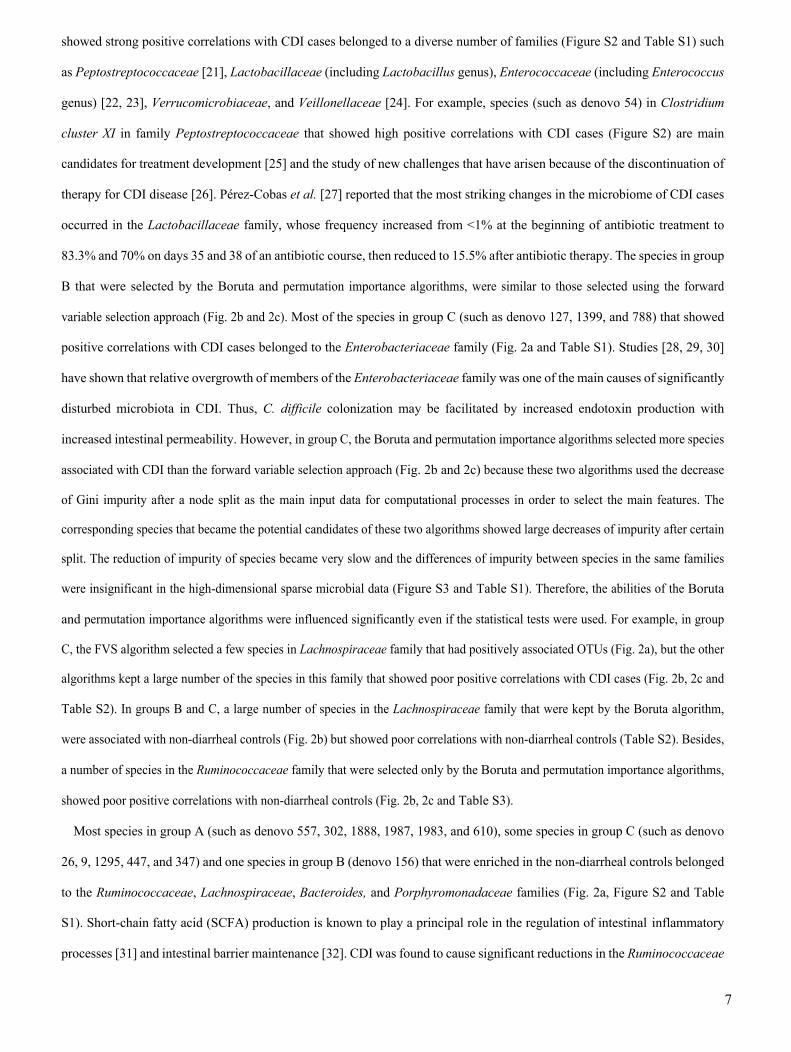
showed strong positive correlations with CDI cases belonged to a diverse number of families (Figure S2 and Table S1) such
as Peptostreptococcaceae [21], Lactobacillaceae (including Lactobacillus genus), Enterococcaceae (including Enterococcus
genus) [22, 23], Verrucomicrobiaceae, and Veillonellaceae [24]. For example, species (such as denovo 54) in Clostridium
cluster XI in family Peptostreptococcaceae that showed high positive correlations with CDI cases (Figure S2) are main
candidates for treatment development [25] and the study of new challenges that have arisen because of the discontinuation of
therapy for CDI disease [26]. Pérez-Cobas et al. [27] reported that the most striking changes in the microbiome of CDI cases
occurred in the Lactobacillaceae family, whose frequency increased from <1% at the beginning of antibiotic treatment to
83.3% and 70% on days 35 and 38 of an antibiotic course, then reduced to 15.5% after antibiotic therapy. The species in group
B that were selected by the Boruta and permutation importance algorithms, were similar to those selected using the forward
variable selection approach (Fig. 2b and 2c). Most of the species in group C (such as denovo 127, 1399, and 788) that showed
positive correlations with CDI cases belonged to the Enterobacteriaceae family (Fig. 2a and Table S1). Studies [28, 29, 30]
have shown that relative overgrowth of members of the Enterobacteriaceae family was one of the main causes of significantly
disturbed microbiota in CDI. Thus, C. difficile colonization may be facilitated by increased endotoxin production with
increased intestinal permeability. However, in group C, the Boruta and permutation importance algorithms selected more species
associated with CDI than the forward variable selection approach (Fig. 2b and 2c) because these two algorithms used the decrease
of Gini impurity after a node split as the main input data for computational processes in order to select the main features. The
corresponding species that became the potential candidates of these two algorithms showed large decreases of impurity after certain
split. The reduction of impurity of species became very slow and the differences of impurity between species in the same families
were insignificant in the high-dimensional sparse microbial data (Figure S3 and Table S1). Therefore, the abilities of the Boruta
and permutation importance algorithms were influenced significantly even if the statistical tests were used. For example, in group
C, the FVS algorithm selected a few species in Lachnospiraceae family that had positively associated OTUs (Fig. 2a), but the other
algorithms kept a large number of the species in this family that showed poor positive correlations with CDI cases (Fig. 2b, 2c and
Table S2). In groups B and C, a large number of species in the Lachnospiraceae family that were kept by the Boruta algorithm,
were associated with non-diarrheal controls (Fig. 2b) but showed poor correlations with non-diarrheal controls (Table S2). Besides,
a number of species in the Ruminococcaceae family that were selected only by the Boruta and permutation importance algorithms,
showed poor positive correlations with non-diarrheal controls (Fig. 2b, 2c and Table S3).
Most species in group A (such as denovo 557, 302, 1888, 1987, 1983, and 610), some species in group C (such as denovo
26, 9, 1295, 447, and 347) and one species in group B (denovo 156) that were enriched in the non-diarrheal controls belonged
to the Ruminococcaceae, Lachnospiraceae, Bacteroides, and Porphyromonadaceae families (Fig. 2a, Figure S2 and Table
S1). Short-chain fatty acid (SCFA) production is known to play a principal role in the regulation of intestinal inflammatory
processes [31] and intestinal barrier maintenance [32]. CDI was found to cause significant reductions in the Ruminococcaceae

8
and/or Lachnospiraceae families that produce butyrate and SCFA [33, 34]. Lachnospiraceae and Ruminococcaceae
sequences were dominant at 45.8% and 17.4% respectively in healthy fecal microbiota, whereas sequences from other families
constituted <3% of all the pyrosequencing reads [34]. However, these proportions decreased significantly in the CDI group
(Lachnospiraceae (11.2%), Ruminococcaceae (3.0%)) [34]. Moreover, the four species in group A (denovo 2019, 1773, 3205,
and 2528) (Fig. 2a and Table S1) showed weak associations with CDI case. However, a significantly larger number of species,
that had positive correlations with CDI, were selected by the Boruta and permutation importance algorithms (Fig. 2b and 2c).
For example, in group A, the number species in the Bacteroidaceae family that were kept only by these algorithms, showed
insignificant positive correlations with non-diarrheal controls (Table S4). Moreover, the Boruta and permutation importance
algorithms selected a huge number of species in the Rikenellaceae and Erysipelotrichaceae families that were ignored by the FVS
approach (Fig. 2); however, they had very poor correlations with CDI case and non-diarrheal controls (Table S5 and S6).
When we applied our RF classifier to the clinical data, we found that antibiotic treatment contributed significantly to an
increase in the accuracy of the prediction models [27, 35].
Improved accuracy for relative OTU abundance data from shotgun metagenomics data
Our RF classifier successfully distinguished the CRC cases and tumor-free controls in both the 16S rRNA gene amplicon data
and the shotgun metagenomics data (Figure S4). The average accuracy for the 16S rRNA gene amplicon data, which included
18,448 OTUs, was 68.18% (AUC = 0.73). For the shotgun metagenomics data, the accuracies of the RF classifier for CRC
cases and tumor-free controls were 70% (AUC = 0.86) and 80% (AUC = 0.86) respectively. The forward variable selection
significantly improved the performance of the RF algorithm as shown in Fig. 3. Specifically, the forward variable selection
detected 75 microbial species (out of 849 species) that were differentially abundant in the CRC microbiome, which increased
the accuracy of the RF classifier to 88% (AUC = 0.92) for the CRC cases and to 95% (AUC = 0.92) for the tumor-free controls
(Figure S4). These findings are consistent with previous reports of significant enrichment of novel species in the fecal
microbiomes of patients with CRC. For example, we detected the three most important species, Parvimonas micra,
Flavonifractor plautii, and Gemella morbillorum, that helped to improve the accuracy of our RF classifier (Figure S5). Yu et
al. [36] and Feng et al. [37] identified Parvimonas micra as a key species that was consistently enriched in the microbiomes

9
of patients with CRC, and we found this species had the most importance among our selected species. Gupta et al. [38] found
that Flavonifractor plautii was associated significantly and enriched in CRC samples of Indian patients. Flavonifractor plautii
was linked with the degradation of beneficial anticarcinogenic flavonoids, and this role was strongly correlated with enzymes
and modules involved in flavonoid degradation in CRC samples of the Indian patents. In our study, Flavonifractor plautii
was significantly associated with CRC samples of cohorts from France, Germany, China, United States, and Austria (Figure
S6). Our analysis showed that the dysbiosis of fecal microbiota was characterized by enrichment of potential pathogens and
the reduction in butyrate-producing members such as Fusobacterium in CRC samples [39, 40]. We also identified other main
species (Figure S5), Gemella morbillorum [41], Prevotella intermedia [42], and Prevotella nigrescens [43], which have been
shown previously to be strongly associated with an increased risk of CRC. In the gut microbiome of the tumor-free controls,
we detected Bifidobacterium adolescentis and, Lactobacillus ruminis, which previously have been associated with healthy
samples and negatively correlated with CRC cases (Figure S5). These species may have a protective role against the
development of non-alcoholic fatty liver disease and obesity [44].
Influential bacterial functions predicted from the 16S rRNA microbiota (OUT) data
The forward variable selection algorithm detected 119 OTUs out of 3347 OTUs. To predict functional profiles from these OTU
a b
Fig. 3 Performance of the random forest classifier for the shotgun metagenomics data of colorectal cancer (CRC) dataset.
a Accuracy of random forest classifier with the different variable selection methods for the shotgun metagenomics dataset; b
ROC and AUC of random forest classifier for the shotgun metagenomics dataset.
RF: Random forest algorithm, RF-PI: Random forest algorithm with permutation importance algorithm, RF-BR: Random forest
algorithm with Boruta algorithm, RF-FVS: Random forest algorithm with forward variable selection algorithm.
10
candidates, we examined 5818 of the 21,620 functional profiles of the KEGG organisms in the Tax4Fun framework. The RF
method gave an average accuracy of 81% (AUC = 0.93) for the 5818 predicted functional profiles. Specifically, the accuracies
for the CDI cases, diarrheal controls, and non-diarrheal controls were 68%, 79%, and 93% (AUCs = 0.88, 0.92, and 0.97)
respectively. To reduce the computational burden, we used the prescreen algorithm at the first step, which reduced the predicted
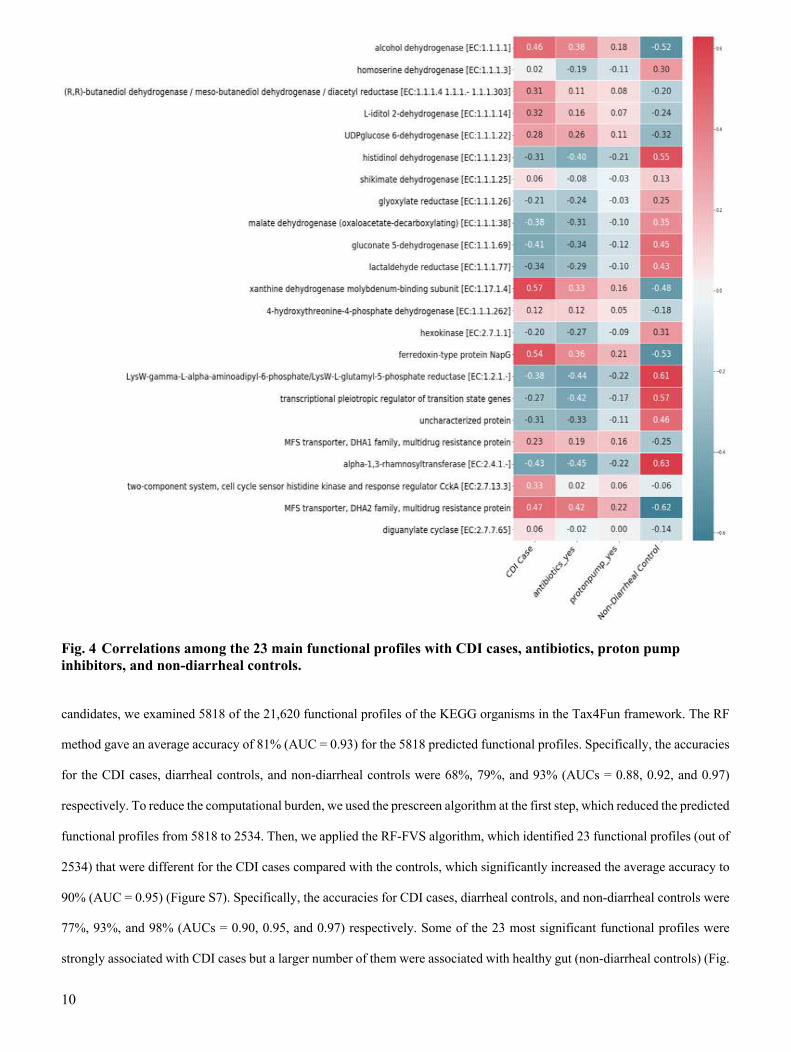
functional profiles from 5818 to 2534. Then, we applied the RF-FVS algorithm, which identified 23 functional profiles (out of
2534) that were different for the CDI cases compared with the controls, which significantly increased the average accuracy to
90% (AUC = 0.95) (Figure S7). Specifically, the accuracies for CDI cases, diarrheal controls, and non-diarrheal controls were
77%, 93%, and 98% (AUCs = 0.90, 0.95, and 0.97) respectively. Some of the 23 most significant functional profiles were
strongly associated with CDI cases but a larger number of them were associated with healthy gut (non-diarrheal controls) (Fig.
Fig. 4 Correlations among the 23 main functional profiles with CDI cases, antibiotics, proton pump
inhibitors, and non-diarrheal controls.
11
4). Our results confirmed that bacteria support human health with functions such as histidinol dehydrogenase, gluconate 5-
dehydrogenase, lactaldehyde reductase, and alpha-1,3-rhamnosyltransferase [45] [46, 47]. However, these functions were
absent in the microbiomes of patients with CDI, mainly because they were treated with antibiotics and proton pump inhibitors,
which killed these bacteria (Fig. 4). Therefore, C. difficile, which is resistant to these treatments, became dominant and
increased the risk of CDI. Conversely, some of the functional profiles were strongly enriched in the CDI cases. They included
alcohol dehydrogenase, L‐iditol 2‐dehydrogenase, and glucose 6-dehydrogenase, which are related to the growth of C. difficile
[48, 49], and xanthine dehydrogenase, which is related to the high-level resistance of C. difficile to antibiotics treatments [50].
Influential bacterial functions predicted using the shotgun metagenomics data
We used the evolutionary genealogy of genes from the Non-supervised Orthologous Groups (eggNOG) orthologous gene
family abundances and KEGG module abundance profiles to detect functional profiles in the shotgun metagenomics data for
CRC. Because the numbers of functions in the KEGG and eggNOG databases were very large (7955 and 31,185 respectively),
we used the prescreen algorithm before applying forward variable selection.
Our RF-FVS algorithm identified 29 out of 7955 functions in the KEGG database that significantly improved the
performance of the RF classifier. Specifically, the accuracy increased from 60% (AUC = 0.79) to 84% (AUC = 0.87) for CRC
cases and from 80% (AUC = 0.79) to 97% (AUC = 0.87) for tumor-free controls (Figure S8). A number of functions such as
HOMODA hydrolase (K10623), carbamoyl-phosphate synthase 1 (K01948), heptose-I-phosphate
ethanolaminephosphotransferase (K19353), tartronate-semialdehyde synthase (K01608), ABC transporters (K11707), and
biofilm formation - Pseudomonas aeruginosa/bacterial secretion system (K11903) had strong positive correlations with CRC
cases (Figure S9). The contributions of some of these functions to the stage progress of CRC have been reported. For example,
carbamoyl-phosphate synthase 1, a metabolic enzyme that utilizes ammonia to produce carbamoyl phosphate, is encoded by
one of four novel driver genes that were identified as hubs for stage-III progression of colorectal cancer [51].
Our RF-FVS algorithm also identified 53 out of 31,185 functions in the eggNOG database that significantly improved the
performance of the RF classifier. Specifically, the accuracy increased from 62% (AUC = 0.78) to 86% (AUC = 0.90) for CRC
cases and from 80% (AUC = 0.78) to 97% (AUC = 0.90) for tumor-free controls (Figure S10). Although a large number of
functions were significantly positively correlated with CRC cases, such as ENOG410Y6BY, ENOG410XYS8,
ENOG411EMB, and ENOG410ZGTS (Figure S11), experimental information about their functions is lacking. These genes
are likely to be good candidates for further studies.
Forward variable selection and the prescreening algorithm reduced the CPU time
Although the RF classifier achieved high accuracy in analyzing the microbiome data, the high dimensionality of the data meant
12
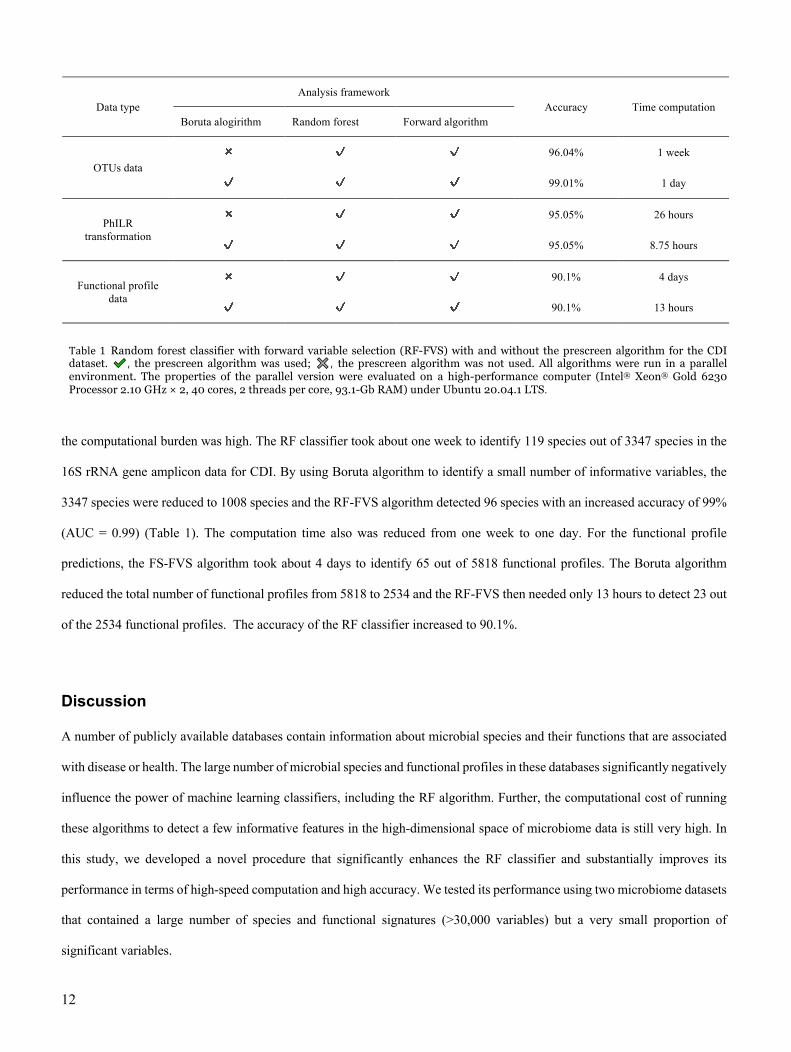
the computational burden was high. The RF classifier took about one week to identify 119 species out of 3347 species in the
16S rRNA gene amplicon data for CDI. By using Boruta algorithm to identify a small number of informative variables, the
3347 species were reduced to 1008 species and the RF-FVS algorithm detected 96 species with an increased accuracy of 99%
(AUC = 0.99) (Table 1). The computation time also was reduced from one week to one day. For the functional profile
predictions, the FS-FVS algorithm took about 4 days to identify 65 out of 5818 functional profiles. The Boruta algorithm
reduced the total number of functional profiles from 5818 to 2534 and the RF-FVS then needed only 13 hours to detect 23 out
of the 2534 functional profiles. The accuracy of the RF classifier increased to 90.1%.
Discussion
A number of publicly available databases contain information about microbial species and their functions that are associated
with disease or health. The large number of microbial species and functional profiles in these databases significantly negatively
influence the power of machine learning classifiers, including the RF algorithm. Further, the computational cost of running
these algorithms to detect a few informative features in the high-dimensional space of microbiome data is still very high. In
this study, we developed a novel procedure that significantly enhances the RF classifier and substantially improves its
performance in terms of high-speed computation and high accuracy. We tested its performance using two microbiome datasets
that contained a large number of species and functional signatures (>30,000 variables) but a very small proportion of
significant variables.
Data type
Analysis framework
Accuracy Time computation
Boruta alogirithm Random forest Forward algorithm
OTUs data
✖ ✔ ✔ 96.04% 1 week
✔ ✔ ✔ 99.01% 1 day
PhILR
transformation
✖ ✔ ✔ 95.05% 26 hours
✔ ✔ ✔ 95.05% 8.75 hours
Functional profile
data
✖ ✔ ✔ 90.1% 4 days
✔ ✔ ✔ 90.1% 13 hours
Table1 Random forest classifier with forward variable selection (RF-FVS) with and without the prescreen algorithm for the CDI dataset. "#, the prescreen algorithm was used; %&, the prescreen algorithm was not used. All algorithms were run in a parallel environment. The properties of the parallel version were evaluated on a high-performance computer (Intel® Xeon® Gold 6230 Processor 2.10 GHz × 2, 40 cores, 2 threads per core, 93.1-Gb RAM) under Ubuntu 20.04.1 LTS.

13
Our RF-FVS approach was useful in several respects. Firstly, the RF-FVS algorithm identified the core set of microbial
species and their functional profiles, which considerably increased the predictive accuracy of the RF classifier. The highest
increase in the predictive accuracy was to 99% for the CDI cases classification. Moreover, because 16S rRNA sequencing
data do not directly provide insights into the functional capabilities of the microbiome community, we integrated the Tax4Fun
tool into our pipeline to predict the functional profiles of microbial communities based on the 16S rRNA datasets. Therefore,
our RF-FVS approach could detect the minimal-size core set and optimal predictive subset of functional profiles of the selected
microbial species and the linkages among them, which will provide insights into the ecological functioning of habitats. Some
unknown species and genes within the dedicated taxa and functional profiles were detected in the group of selected features
that made meaningful contributions to the predictive performance of the RF classifier. These species and genes are likely to
be good candidates for future experimental studies.
Secondly, there are a number of standard approaches that can use 16S rRNA data to infer the metabolic potential of the
corresponding microbial species. For example, if the database is annotated by the Greengenes database, PICRUSt can achieve
good estimations for the functional potential of microbial communities [52]. Tax4Fun is a good option for data annotated by
the SILVA database. In this study, the published databases that we used to checked the performance of the RF-FVS approach
adopted the Ribosomal Database Project (RDP) approach to classify the 16S rRNA gene sequences taxonomically [53].
Tax4Fun achieved significantly better quality of predicted functional profiles than PICRUSt; therefore, Tax4Fun was
integrated as the main option in our pipeline. In the future, we plan to check the performance of the RF-FVS approach for
other databases that provide taxonomy annotations, such as Greengenes, LTP, RDP, and SILVA [54].
Moreover, to overcome the computational burden of high-dimensional data that limits the implementation of existing
machine learning approaches, we developed a parallel computational strategy algorithm for handling large-scale problems in
the forward variable selection algorithm. This parallel strategy helps to equally divide the computational burden of search
processes among processors. Thus, the forward variable selection computation process is completely optimized and
parallelized based on data partitioning. In microbiome datasets of tens of thousands of species and their functional profiles,
selecting only a few hundred of the most significant samples can be a major problem. Our current strategy is focused on
parallelly searching for the features of interest. In the future, the numbers of samples and features in microbiome datasets are
likely to explode at a rapid pace. We anticipate that hybrid-partitioning strategies that partition the data both horizontally (over
samples) and vertically (over features) will become essential to speed up the computational processes [55, 56].
Conclusions
The proposed forward variable selection approach can significantly improve the performance of random forest classifier for
analyzing the high-dimensional microbial databases. By adopting the Boruta algorithm for pre-screening of the variables, our

14
approach improves the accuracy with minimum increase of computational burden. The selected minimal-size core set of
microbial species or functional signatures makes it easier to interpret the cause of sample differentiation.
Methods
Forward variable selection for random forests
The RF approach is an ensemble method that combines a large number of individual binary decision trees. Two main
randomization procedures have been implemented to reduce variance of individual decision trees, deliver diversity amongst
decision trees, and thus improve prediction accuracy. First, randomly selected training samples for each of the individual trees
are applied to construct sufficiently diverse trees. Second, at each node within a tree, a set of randomly chosen candidate
predictor variables is identified for the split.
However, random feature subspace sampling may not be a good strategy to deal with high-dimensional data because a large
proportion of the features may not be informative of the class of an object in the high-dimensional data. If a random sampling
strategy is implemented to select the subset of eligible features at each node, almost all the subsets are likely to contain a
large number of non-informative features. For example, the 16S rRNA gene amplicon data for CDI [17] that we used to
evaluate the performance of our proposed approach contained a total of 3347 microbiome species, but only 96 of the species
were informative. Therefore, if a subset of species, which is usually the square root of the total number of species, is selected
by resampling randomly at any node within the decision tree, the mean number of informative species selected at each node
will be two. Therefore, individual decision trees built using such nodes will have low accuracy and the performance of the
RF algorithm will suffer. In our approach, we used forward variable selection to identify a small number of informative
variables to improve the performance of individual decision trees in an ensemble.
A key idea behind our algorithm was to divide the total number of variables into two groups, a remaining variables group
and a selected variables group. We started with an empty group for the selected variables. At each step, a variable from the
remaining variables group was added to the selected variables group such that the specified criterion was improved (i.e., area
under the receiver operating characteristic [ROC] curve [AUC], a weighted average of the precision and recall [F1 score] or

15
predictive accuracy). Model selection for microbial signature identification also can be performed using our RF-FVS
algorithm. At each forward iteration, given the selected variables, the randomized parameter optimization algorithm for RF
implements a randomized search over parameters, where each setting is sampled from a distribution over possible parameter
values. Thus, the best RF model is specified by these selected variables.
Moreover, a high-speed computational strategy based on multi-processing architecture was developed to parallelize the
forward variable selection algorithm at the single machine level and thus significantly reduce runtimes. Another key idea
behind our algorithm was to create many subsets of variables, so that each subset had one of the variables from the remaining
variables group added to the selected variables group. Because of the high dimensionality problems of microbiome data, the
number of these subsets is usually significantly larger than the number of processors in a single computer system. Our solution
was to create queues so that subsets are assigned randomly and each processor runs the computational processes from its own
privately prepared queue. Fig. 5 shows how all computational burdens for searching important feature relevance are
appropriately decomposed, so that they can be computed in a parallel environment. The RF model with the highest accuracy
Remaining Features Selected Features
… X1 X4X7 … Xk
X2 X3X5 Xz
…
Selected Features
Remaining Features
…
The best model for
selected featuresX1 X4 X5 X7 Xk
X2 X3…
RF*hbest
Xz
Subset 1
X1X4 X7
… XkX2
Subset 2
…
X1 X4 X7
Xk X3
Subset 3
…
X1 X4 X7
Xk X5
Subset N
…
X1 X4X7
Xk Xz
Forward Iteration in parallel environment
Queue 1
Queue h11 Queue h12
Queue M
Queue hM1Queue hM2
…Processor 1
Select the best
model for
queue
R F*h11
h11
Select the best
model for
queue
R F*h12
h12
Processor M
Select the best
model
for queue
R F*hM1
hM1
Select the best
model
for queue
R F*hM2
hM2
Shared memory
Compare performances of RF*
Fig. 5 Massively parallel forward variable selection algorithm for the random forest (RF) classifier. The number of
queues depends on the number of CPU cores available in the computer system.

16
value for each subset of features is selected by a specific processor. Processors in symmetric multiprocessing communicate
with each other through shared memory architecture to decide only the best feature among multiple candidates that should be
added to the selected features. The algorithm stops when there are no additional variables that improve the current optimization
parameters or when the maximum number of components to be included in the group of selected variables is achieved. The
main parameters of the RF classifier that were optimized in our algorithm, were number of trees in the forest, maximum depth
of the tree, minimum number of samples required to split an internal node, minimum number of samples required to be at a
leaf node, and number of features to consider when looking for the best split.
Functional gene enrichment analysis
Functional profiles were predicted from the 16S rRNA gene data for CDI using Tax4Fun. which was developed to analyze
the enrichment of functional genes of microbiomes [20, 57]. The output from the QIIME software application with a SILVA
database extension (SILVA 119) [58] was used to pre-process raw data for Tax4Fun. Tax4Fun transforms the SILVA-based
operational taxonomic units (OTUs) into a taxonomic profile of KEGG organisms that is normalized by the 16S rRNA copy
number (obtained from the NCBI genome annotations) [59]. The result is a table containing relative KEGG ortholog (KO)
abundance levels. The KO profiles obtained from predictions or actually measured from shotgun metagenomic or
metatranscriptomic data can be used for functional diversity profiling based on the KEGG annotation systems (pathways,
modules, or EC categories). Because one KO can be assigned to multiple groups, our approach detects the most important
functional profiles associated with disease or healthy samples.
Phylogenetic transformation of microbiota data for random forest
To avoid spurious statistical analyses because of the relative nature of microbial abundance data in microbiota studies [60],
we used the Phylogenetic Isometric Log-Ratio (PhILR) transformation [19]. The main idea behind the PhILR transformation
is to consider the bacterial phylogenetic tree as a natural and informative sequential binary partition to construct an isometric
log-ratio that converts compositional data into a real Euclidean space. This phylogenetically driven isometric log-ratio
transformation can help to capture the hierarchical pattern of a microbial community structure. Therefore, the RF algorithm
can identify the main internal nodes of a phylogenetic tree that represent phylogenetically-related bacterial groups (clades),
thereby offering the opportunities for biological insights.
Pre-screening algorithm for random forest coupled with forward variable selection
We used the Boruta algorithm [15] as a relevant embedded feature selection algorithm that uses the RF classifier to detect all
strongly and weakly relevant OTUs (or phylogenetic internal nodes, or functional profiles) to reduce the considerable data

17
dimensionality. This improved the classification accuracies and significantly decreased the time computation. The main idea
of this algorithm was to duplicate each OTU, thus creating “shadow” OTUs by randomly permuting the observations of
duplicated OTUs at the first step. Then, the importance of all the OTUs is computed (calculated as Z-scores) and the maximum
Z-score among the shadow bands is identified when the RF classifier is run. The number of times that the importance of an
OTU is higher than the maximum Z-score among the shadow OTUs is counted. An OTU is deemed “important” when the
frequency is significantly higher than the expected value, otherwise the OTU is deemed “unimportant” and removed.
Basically, the Boruta algorithm works with Scikit-learn dependency and acts as an interface medium on the RF classifier,
which uses the importance measure generated by the original algorithm. The Boruta algorithm depends on the implementation
of the Scikit-learn RF classifier, which runs on a single code to identify all the important features in a dataset with respect to
an outcome variable. The global framework of our new approach is shown in Figure S12.
Two empirical datasets
To examine the performance of our RF-FVS approach, we analyzed two empirical datasets from large-scale case control
studies as follows.
Clostridioides difficile infection
We collected a published case-control 16S rRNA gene amplicon sequencing gut microbiome dataset that included disease
meta data and sequencing data with 3347 OTUs for Clostridioides difficile infection (CDI) [17] from 338 individuals; 89 with
CDI (cases), 89 with diarrhea who tested negative for CDI (diarrheal controls), and 155 non-diarrheal controls. To understand
how clinical- and microbiome-based factors are associated with CDI, the gut microbiomes of these individuals were
characterized. A total of 183 diarrheal stool samples from the 94 individuals with CDI, 89 diarrheal control samples, and 155
non-diarrheal control stool samples were analyzed. Taxonomic assignments were generated using a naive Bayesian classifier
trained against a 16S rRNA gene training set provided by the Ribosomal Database Project (RDP) [53]. We also collected a
set of published 16S rRNA gene sequences [61], among which, 120 samples were from individuals with human colorectal
cancer (CRC) and 172 samples were from tumor-free controls. Taxonomic assignments were generated using the Bayesian
classifier as described above.
Human colorectal cancer
We collected a published fecal shotgun metagenomic dataset [18] that included 290 samples from tumor-free controls and
285 samples from individuals with CRC. Taxonomic profiles were generated using the mOTU profiler tool [62] to guarantee
consistency of the biological information. Unlike the 16S rRNA gene amplicon data, one of the most important advantages
of fecal shotgun metagenomic data is that it provides functional abundance profiles, such as those for the eggNOG gene family
18
or KEGG module abundance profiles, that allowed a direct analysis of the functional potential of the gut microbiome to be
conducted.
Declarations
Acknowledgment
We thank Margaret Biswas, PhD, from Edanz Group (https://en-author-services.edanz.com/ac) for editing a draft of this
manuscript.
Authors’ contributions
TD and HK designed the study. TD and HK developed the method and analyzed the data. TD and HK interpreted the data and
wrote the manuscript. The authors read and approved the final manuscript.
Funding
This study was supported by a Grant-in-Aid for Scientific Research (B) 19H04070 from the Japan Society for the Promotion
of Science.
Availability of data and materials
RF-FVS is implemented in Python and is available on github (https://github.com/tungtokyo1108/Random_Forests_for_High-
Dimensional_Data)
Ethics approval and consent to participate
Not applicable.
Consent for publication
Not applicable.
Competing interests
The authors declare that they have no competing interests.

19
Author details
1 Laboratory of Biometry and Bioinformatics, Department of Agricultural and Environmental Biology, Graduate School of
Agriculture and Life Sciences, The University of Tokyo, Tokyo, Japan
Tung Dang et al.
References
[1] Wu, G. D., Chen, J., Hoffmann, C., Bittinger, K., Chen, Y. Y., Keilbaugh, S. A., ... & Sinha,
R, "Linking long-term dietary patterns with gut
microbial enterotypes," Science, vol. 334, no. 6052, pp. 105-108, 2011.
[2] Qin, J., Li, Y., Cai, Z., Li, S., Zhu, J., Zhang, F., ... & Peng, Y, "A metagenome-wide
association study of gut microbiota in type 2
diabetes," Nature, vol. 490, no. 7418, pp. 55-60, 2012.
[3] Arumugam, M., Raes, J., Pelletier, E., Le Paslier, D., Yamada, T., Mende, D. R., ... &
Bertalan, M, "Enterotypes of the human gut
microbiome," Nature, vol. 473, no. 7346, pp.
174-180, 2011.
[4] Turnbaugh, P. J., Ley, R. E., Hamady, M., Fraser-Liggett, C. M., Knight, R., & Gordon,
J. I, "The human microbiome project," Nature,
vol. 449, no. 7164, pp. 804-810, 2007.
[5] Benjamini, Y., & Hochberg, Y, "Controlling
the false discovery rate: a practical and powerful approach to multiple testing,"
Journal of the Royal statistical society: series
B (Methodological), vol. 57, no. 1, pp. 289-
300, 1995.
[6] Hothorn, T., Hornik, K., Van De Wiel, M. A., & Zeileis, A, "A lego system for conditional
inference," The American Statistician, vol. 60,
no. 3, pp. 257-263, 2006.
[7] Knight, R., Vrbanac, A., Taylor, B. C.,
Aksenov, A., Callewaert, C., Debelius, J., ... & Melnik, A. V, "Best practices for analysing
microbiomes," Nature Reviews Microbiology,
vol. 16, no. 7, pp. 410-422, 2018.
[8] Zhou, Y. H., & Gallins, P, "A review and
tutorial of machine learning methods for microbiome host trait prediction," Frontiers in
Genetics, vol. 10, p. 579, 2019.
[9] Breiman, L, "Random forests," Machine
learning, vol. 45, no. 1, pp. 5-32, 2001.
[10] Ho, T. K, "The random subspace method for
constructing decision forests," IEEE transactions on pattern analysis and machine
intelligence, vol. 20, no. 8, pp. 832-844, 1998.
[11] Dietterich, T. G, "An experimental comparison
of three methods for constructing ensembles of
decision trees: Bagging, boosting, and randomization," Machine learning, vol. 40, no.
2, pp. 139-157, 2000.
[12] Bureau, A., Dupuis, J., Falls, K., Lunetta, K.
L., Hayward, B., Keith, T. P., & Van
Eerdewegh, P, "Identifying SNPs predictive of phenotype using random forests," Genetic
Epidemiology: The Official Publication of the
International Genetic Epidemiology Society, vol. 28, no. 2, pp. 171-182, 2005.
[13] Díaz-Uriarte, R., & De Andres, S. A, "Gene selection and classification of microarray data
using random forest," BMC bioinformatics,
vol. 7, no. 1, p. 3, 2006.
[14] Knights, D., Costello, E. K., & Knight, R,
"Supervised classification of human microbiota," FEMS microbiology reviews, vol.
35, no. 2, pp. 343-359, 2011.
[15] Kursa, M. B., & Rudnicki, W. R, "Feature
selection with the Boruta package," J Stat
Softw, pp. 1-13..
[16] Altmann, A., Toloşi, L., Sander, O., &
Lengauer, T, "Permutation importance: a corrected feature importance measure,"
Bioinformatics, vol. 26, no. 10, pp. 1340-1347,
2010.
[17] Alyxandria M. Schubert, Mary A. M. Rogers,
Cathrin Ring, Jill Mogle, Joseph P. Petrosino, Vincent B. Young, David M. Aronoff, Patrick
D. Schlossa, "Microbiome data distinguish
patients with Clostridium difficile infection and non-C. difficile-associated diarrhea from
healthy controls," MBio, p. 5(3), 2014.
[18] Wirbel, J., Pyl, P. T., Kartal, E., Zych, K.,
Kashani, A., Milanese, A., ... & Sunagawa, S,
"Meta-analysis of fecal metagenomes reveals global microbial signatures that are specific for
colorectal cancer," Nature medicine, vol. 4, no.
25, pp. 679-689, 2019.
[19] Silverman, J. D., Washburne, A. D.,
Mukherjee, S., & David, L. A, "A phylogenetic transform enhances analysis of
compositional microbiota data," Elife, p.
e21887, 2017.
[20] Aßhauer, K. P., Wemheuer, B., Daniel, R., &
Meinicke, P, "Tax4Fun: predicting functional

profiles from metagenomic 16S rRNA data," Bioinformatics, pp. 2882-2884, 2015.
[21] Milani, C., Ticinesi, A., Gerritsen, J., Nouvenne, A., Lugli, G. A., Mancabelli, L., ...
& Ferrario, C, "Gut microbiota composition
and Clostridium difficile infection in hospitalized elderly individuals: a
metagenomic study," Scientific reports, vol. 6,
no. 1, pp. 1-12, 2016.
[22] Ross, C. L., Spinler, J. K., & Savidge, T. C,
"Structural and functional changes within the gut microbiota and susceptibility to
Clostridium difficile infection," Anaerobe, vol.
41, pp. 37-43, 2016.
[23] Ling, Z., Liu, X., Jia, X., Cheng, Y., Luo, Y.,
Yuan, L., ... & Xu, X, "Impacts of infection with different toxigenic Clostridium difficile
strains on faecal microbiota in children,"
Scientific reports, no. 4, p. 7485, 2014.
[24] De Wolfe, T. J., Eggers, S., Barker, A. K.,
Kates, A. E., Dill-McFarland, K. A., Suen, G., & Safdar, N, "Oral probiotic combination of
Lactobacillus and Bifidobacterium alters the
gastrointestinal microbiota during antibiotic
treatment for Clostridium difficile infection," PLoS One, vol. 13, no. 9, p. e0204253, 2018.
[25] Kolling, G. L., Wu, M., Warren, C. A.,
Durmaz, E., Klaenhammer, T. R., & Guerrant,
R. L, "Lactic acid production by Streptococcus
thermophilus alters Clostridium difficile infection and in vitro Toxin A production,"
Gut Microbes, vol. 3, no. 6, pp. 523-529, 2012.
[26] Gazzola, A., Panelli, S., Corbella, M., Merla,
C., Comandatore, F., De Silvestri, A., ... &
Cambieri, P, "Microbiota in Clostridioides difficile-Associated Diarrhea: Comparison in
Recurrent and Non-Recurrent Infections,"
Biomedicines, vol. 8, no. 9, p. 335, 2020.
[27] Pérez-Cobas, A. E., Artacho, A., Ott, S. J.,
Moya, A., Gosalbes, M. J., & Latorre, A., "Structural and functional changes in the gut
microbiota associated to Clostridium difficile
infection," Frontiers in microbiology, p. 335, 2014.
[28] Tanaka, S., Kobayashi, T., Songjinda, P., Tateyama, A., Tsubouchi, M., Kiyohara, C., ...
& Nakayama, J, "Influence of antibiotic
exposure in the early postnatal period on the development of intestinal microbiota," FEMS
Immunology & Medical Microbiology, vol. 56,
no. 1, pp. 80-87, 2009.
[29] Prasad, N., Labaze, G., Kopacz, J., Chwa, S.,
Platis, D., Pan, C. X., ... & Kreiswirth, B. N, "Asymptomatic rectal colonization with
carbapenem-resistant Enterobacteriaceae and
Clostridium difficile among residents of a long-term care facility in New York City,"
American journal of infection control, vol. 44,
no. 5, pp. 525-532, 2016.
[30] Seddon, M. M., Bookstaver, P. B., Justo, J. A.,
Kohn, J., Rac, H., Haggard, E., ... & Al-Hasan, M. N, "Role of early de-escalation of
antimicrobial therapy on risk of Clostridioides
difficile infection following
Enterobacteriaceae bloodstream infections," Clinical Infectious Diseases, vol. 69, no. 3, pp.
414-420, 2019.
[31] Maslowski, K. M., Vieira, A. T., Ng, A.,
Kranich, J., Sierro, F., Yu, D., ... & Xavier, R.
J, "Regulation of inflammatory responses by gut microbiota and chemoattractant receptor
GPR43," Nature, vol. 461, no. 7268, pp. 1282-
1286, 2009.
[32] Koruda, M. J., Rolandelli, R. H., Bliss, D. Z.,
Hastings, J., Rombeau, J. L., & Settle, R. G, "Parenteral nutrition supplemented with short-
chain fatty acids: effect on the small-bowel
mucosa in normal rats," The American journal of clinical nutrition, vol. 51, no. 4, pp. 685-
689, 1990.
[33] Lawley, T. D., Clare, S., Walker, A. W.,
Stares, M. D., Connor, T. R., Raisen, C., ... &
Deakin, L. J, "Targeted restoration of the intestinal microbiota with a simple, defined
bacteriotherapy resolves relapsing Clostridium
difficile disease in mice," PLoS Pathog, vol. 8,
no. 10, p. e1002995, 2012.
[34] Antharam, V. C., Li, E. C., Ishmael, A., Sharma, A., Mai, V., Rand, K. H., & Wang, G.
P, "Intestinal dysbiosis and depletion of
butyrogenic bacteria in Clostridium difficile
infection and nosocomial diarrhea," Journal of clinical microbiology, vol. 51, no. 9, pp. 2884-
2892, 2013.
[35] Theriot, C. M., Koenigsknecht, M. J., Carlson
Jr, P. E., Hatton, G. E., Nelson, A. M., Li, B.,
... & Young, V. B, "Antibiotic-induced shifts in the mouse gut microbiome and metabolome
increase susceptibility to Clostridium difficile
infection," Nature communications, no. 5, p. 3114, 2015.
[36] Yu, J., Feng, Q., Wong, S. H., Zhang, D., yi Liang, Q., Qin, Y., ... & Wang, X,
"Metagenomic analysis of faecal microbiome
Tung Dang et al.
as a tool towards targeted non-invasive biomarkers for colorectal cancer," Gut, pp. 70-
78, 2017.
[37] Feng, Q., Liang, S., Jia, H., Stadlmayr, A.,
Tang, L., Lan, Z., ... & Su, L., "Gut
microbiome development along the colorectal adenoma–carcinoma sequence," Nature
communications, p. 6528, 2015.
[38] Gupta, A., Dhakan, D. B., Maji, A., Saxena,
R., PK, V. P., Mahajan, S., ... & Amato, K. R,
"Association of Flavonifractor plautii, a flavonoid-degrading bacterium, with the gut
microbiome of colorectal cancer patients in
India," mSystems, vol. 4, no. 6, pp. e00438-19, 2019.
[39] Castellarin, M., Warren, R. L., Freeman, J. D., Dreolini, L., Krzywinski, M., Strauss, J., ... &
Holt, R. A, "Fusobacterium nucleatum
infection is prevalent in human colorectal carcinoma," Genome research, vol. 22, no. 2,
pp. 299-306, 2012.
[40] Kostic, A. D., Gevers, D., Pedamallu, C. S.,
Michaud, M., Duke, F., Earl, A. M., ... &
Baselga, "Genomic analysis identifies
association of Fusobacterium with colorectal carcinoma," Genome research, vol. 22, no. 2,
pp. 292-298, 2012.
[41] Kwong, T. N., Wang, X., Nakatsu, G., Chow,
T. C., Tipoe, T., Dai, R. Z., ... & Chan, F. K,
"Association between bacteremia from specific microbes and subsequent diagnosis of
colorectal cancer," Gastroenterology, pp. 383-
390, 2018.
[42] Yang, Y., Cai, Q., Shu, X. O., Steinwandel, M.
D., Blot, W. J., Zheng, W., & Long, J, "Prospective study of oral microbiome and
colorectal cancer risk in low‐income and
African American populations," International journal of cancer, vol. 144, no. 10, pp. 2381-
2389.
[43] Szafrański, S. P., Deng, Z. L., Tomasch, J.,
Jarek, M., Bhuju, S., Meisinger, C., ... &
Wagner-Döbler, I, "Functional biomarkers for chronic periodontitis and insights into the roles
of Prevotella nigrescens and Fusobacterium
nucleatum; a metatranscriptome analysis," npj Biofilms and Microbiomes, pp. 1-13, 2015.
[44] Nobili, V., Putignani, L., Mosca, A., Del Chierico, F., Vernocchi, P., Alisi, A., ... &
Drago, L, "Bifidobacteria and lactobacilli in
the gut microbiome of children with non-
alcoholic fatty liver disease: which strains act
as health players?," Archives of medical science: AMS, vol. 14, no. 1, p. 81, 2018.
[45] Agyirifo, D. S., Wamalwa, M., Otwe, E. P., Galyuon, I., Runo, S., Takrama, J., &
Ngeranwa, J, "Metagenomics analysis of cocoa
bean fermentation microbiome identifying species diversity and putative functional
capabilities," Heliyon, p. e02170, 2019.
[46] Xie, M., Wu, J., An, F., Yue, X., Tao, D., Wu,
R., & Lee, Y, "An integrated
metagenomic/metaproteomic investigation of microbiota in dajiang-meju, a traditional
fermented soybean product in Northeast
China," Food Research International, pp. 414-424, 2019.
[47] O'Callaghan, A., & van Sinderen, D, "Bifidobacteria and their role as members of
the human gut microbiota," Frontiers in
microbiology, p. 925, 2016.
[48] Nawrocki, K. L., Wetzel, D., Jones, J. B.,
Woods, E. C., & McBride, S. M., "Ethanolamine is a valuable nutrient source
that impacts Clostridium difficile
pathogenesis," pp. 1419-1435, 2018.
[49] Collins, J., Robinson, C., Danhof, H., Knetsch,
C. W., Van Leeuwen, H. C., Lawley, T. D., ... & Britton, R. A, "Dietary trehalose enhances
virulence of epidemic Clostridium difficile,"
Nature, vol. 553, pp. 291-294, 2018.
[50] Deshpande, A., Wu, X., Huo, W., Palmer, K.
L., & Hurdle, J. G, "Chromosomal Resistance to Metronidazole in Clostridioides difficile can
be Mediated By Epistasis Between Iron
Homeostasis and Oxidoreductases,"
Antimicrobial Agents and Chemotherapy, 2020.
[51] Palaniappan, A., Ramar, K., & Ramalingam,
S, "Computational identification of novel
stage-specific biomarkers in colorectal cancer
progression," PloS one, vol. 11, no. 5, p. e0156665, 2016.
[52] Langille, M. G., Zaneveld, J., Caporaso, J. G.,
McDonald, D., Knights, D., Reyes, J. A., ... &
Huttenhower, C., "Predictive functional
profiling of microbial communities using 16S rRNA marker gene sequences," Nature
biotechnology, vol. 31, no. 9, pp. 814-821,
2013.
[53] Wang, Q., Garrity, G. M., Tiedje, J. M., &
Cole, J. R, "Naive Bayesian classifier for rapid assignment of rRNA sequences into the new
bacterial taxonomy," Applied and
environmental microbiology, no. 73, pp. 5261-5267, 2007.
[54] Edgar, R., "Taxonomy annotation and guide tree errors in 16S rRNA databases," PeerJ,
vol. 6, p. e5030, 2018.
[55] Xing, E. P., Ho, Q., Xie, P., & Wei, D,
"Strategies and principles of distributed
machine learning on big data," Engineering, vol. 2, no. 2, pp. 179-195, 2016.
[56] Lee, S., Kim, J. K., Zheng, X., Ho, Q., Gibson,
G. A., & Xing, E. P, "On model parallelization
and scheduling strategies for distributed
machine learning," In Advances in neural information processing systems, pp. 2834-
2842, 2014.
[57] Wemheuer, F., Taylor, J. A., Daniel, R.,
Johnston, E., Meinicke, P., Thomas, T., &
Wemheuer, B, "Tax4Fun2: prediction of habitat-specific functional profiles and
functional redundancy based on 16S rRNA
gene sequences," Environmental Microbiome, pp. 1-12, 2020.
[58] Quast, C., Pruesse, E., Yilmaz, P., Gerken, J., Schweer, T., Yarza, P., ... & Glöckner, F. O,
"The SILVA ribosomal RNA gene database
project: improved data processing and web-based tools," Nucleic acids research, vol. 41,
no. D1, pp. D590-D596, 2012.
[59] Kanehisa, M., Goto, S., Sato, Y., Kawashima,
M., Furumichi, M., & Tanabe, M, "Data,
information, knowledge and principle: back to metabolism in KEGG," Nucleic acids
research, vol. 42, no. D1, pp. D199-D205,
2014.
[60] Gloor, G. B., Macklaim, J. M., Pawlowsky-
Glahn, V., & Egozcue, J. J, "Microbiome
datasets are compositional: and this is not optional," Frontiers in microbiology, p. 2224,
2017.
[61] Baxter, N. T., Ruffin, M. T., Rogers, M. A., &
Schloss, P. D, "Microbiota-based model
improves the sensitivity of fecal immunochemical test for detecting colonic
lesions," Genome medicine, no. 8, pp. 1-10,
2016.
[62] Milanese, A., Mende, D. R., Paoli, L., Salazar,
G., Ruscheweyh, H. J., Cuenca, M., ... & Schmidt, T. S, "Microbial abundance, activity
and population genomic profiling with
mOTUs2," Nature communications, no. 10, pp. 1-11, 2019.
[63] Duvallet, C., Gibbons, S. M., Gurry, T., Irizarry, R. A., & Alm, E. J, "Meta-analysis of
gut microbiome studies identifies disease-
specific and shared responses," Nature communications, pp. 8(1), 1-10, 2017.
[64] Kanehisa, M., Goto, S., Sato, Y., Kawashima, M., Furumichi, M., & Tanabe, M, "Data,
information, knowledge and principle: back to
metabolism in KEGG," Nucleic acids
research, vol. 42, no. D1, pp. D199-D205, 2014.
[65] Huerta-Cepas, J., Szklarczyk, D., Forslund, K.,
Cook, H., Heller, D., Walter, M. C., ... &
Jensen, L. J, "eggNOG 4.5: a hierarchical
orthology framework with improved functional annotations for eukaryotic,
prokaryotic and viral sequences," Nucleic
acids research, vol. 44, no. D1, pp. D286-D293, 2016.
Figure and table legends

Figures
Figure 1 Performance of the random forest classifier for 16S rRNA gene amplicon data from the Clostridioides difficile
infection (CDI) dataset. a Accuracy of random forest classifier with different variable selection methods for the 16S rRNA
gene amplicon dataset. b ROC and AUC of random forest classifier for the 16S rRNA gene amplicon dataset; RF: Random
forest algorithm, RF-PI: Random forest algorithm with permutation importance algorithm, RF-BR: Random forest algorithm
with Boruta algorithm, RF-FVS: Random forest algorithm with forward variable selection algorithm.
Figure 2 Phylogenetic tree of the 16S rRNA microbiota (OTU) data from the CDI dataset. a Positions indicate the 119
important microbial species that remained after forward variable selection. b Positions indicate about 1000 important
microbial species that remained after applying the Boruta algorithm. c Positions indicate about 2000 important microbial
species that remained after applying the permutation importance algorithm. Red indicates OTUs associated with CDI cases;
blue indicates OTUs associated with the non-diarrheal controls; green indicates group A; orange indicates group B; purple
indicates group C.
Figure 3 Performance of the random forest classifier for the shotgun metagenomics data of colorectal cancer (CRC) dataset.
a Accuracy of random forest classifier with the different variable selection methods for the shotgun metagenomics dataset; b
ROC and AUC of random forest classifier for the shotgun metagenomics dataset. RF: Random forest algorithm, RF-PI:
Random forest algorithm with permutation importance algorithm, RF-BR: Random forest algorithm with Boruta algorithm,
RF-FVS: Random forest algorithm with forward variable selection algorithm.
Figure 4 Correlations among the 23 main functional profiles with CDI cases, antibiotics, proton pump inhibitors, and non-
diarrheal controls.
Figure 5 Massively parallel forward variable selection algorithm for the random forest (RF) classifier. The number of queues
depends on the number of CPU cores available in the computer system.
Tables
Table 1 Random forest classifier with forward variable selection (RF-FVS) with and without the prescreen algorithm for the
CDI dataset. ✔, the prescreen algorithm was used; ✖, the prescreen algorithm was not used. All algorithms were run in a

parallel environment. The properties of the parallel version were evaluated on a high-performance computer (Intel® Xeon®
Gold 6230 Processor 2.10 GHz × 2, 40 cores, 2 threads per core, 93.1-Gb RAM) under Ubuntu 20.04.1 LTS.
Figures
Figure 1
Performance of the random forest classi�er for 16S rRNA gene amplicon data from the Clostridioidesdi�cile infection (CDI) dataset. a Accuracy of random forest classi�er with different variable selectionmethods for the 16S rRNA gene amplicon dataset. b ROC and AUC of random forest classi�er for the 16SrRNA gene amplicon dataset; RF: Random forest algorithm, RF-PI: Random forest algorithm withpermutation importance algorithm, RF-BR: Random forest algorithm with Boruta algorithm, RF-FVS:Random forest algorithm with forward variable selection algorithm.
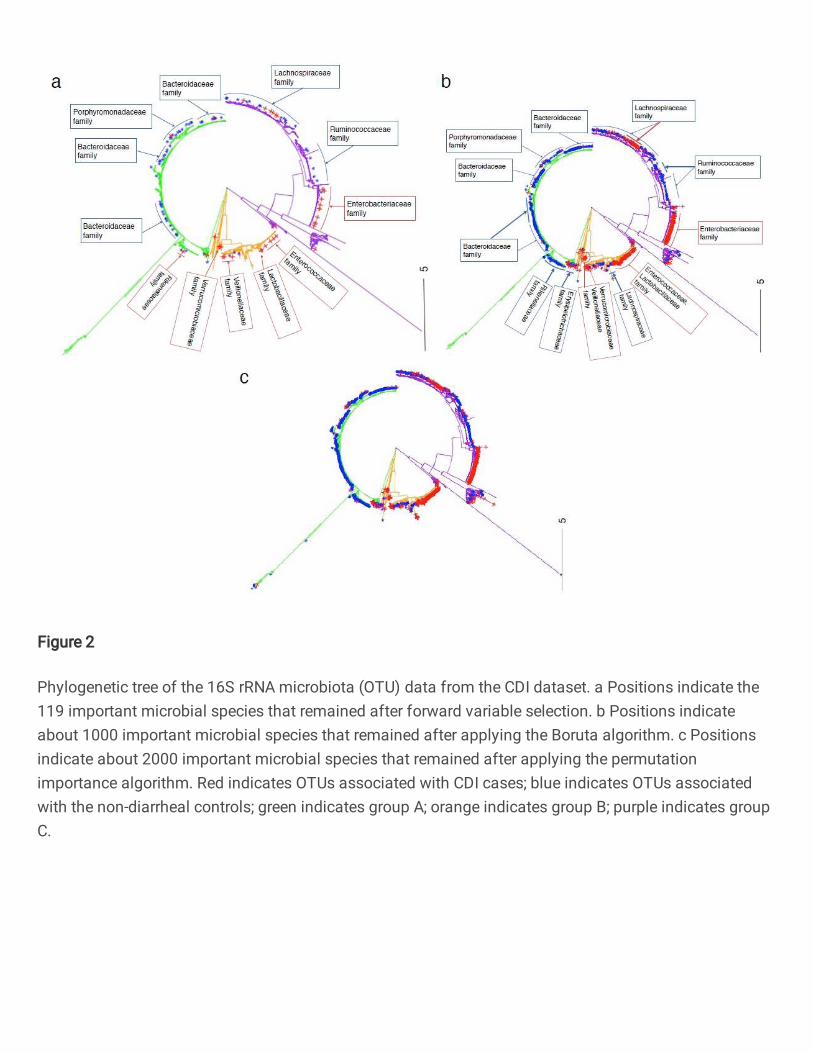
Figure 2
Phylogenetic tree of the 16S rRNA microbiota (OTU) data from the CDI dataset. a Positions indicate the119 important microbial species that remained after forward variable selection. b Positions indicateabout 1000 important microbial species that remained after applying the Boruta algorithm. c Positionsindicate about 2000 important microbial species that remained after applying the permutationimportance algorithm. Red indicates OTUs associated with CDI cases; blue indicates OTUs associatedwith the non-diarrheal controls; green indicates group A; orange indicates group B; purple indicates groupC.

Figure 3
Performance of the random forest classi�er for the shotgun metagenomics data of colorectal cancer(CRC) dataset. a Accuracy of random forest classi�er with the different variable selection methods for theshotgun metagenomics dataset; b ROC and AUC of random forest classi�er for the shotgunmetagenomics dataset. RF: Random forest algorithm, RF-PI: Random forest algorithm with permutationimportance algorithm, RF-BR: Random forest algorithm with Boruta algorithm, RF-FVS: Random forestalgorithm with forward variable selection algorithm.

Figure 4
Correlations among the 23 main functional pro�les with CDI cases, antibiotics, proton pump inhibitors,and non-diarrheal controls.

Figure 5
Massively parallel forward variable selection algorithm for the random forest (RF) classi�er. The numberof queues depends on the number of CPU cores available in the computer system.
Supplementary Files
This is a list of supplementary �les associated with this preprint. Click to download.
2021manuscriptSI�nal.pdf