freeze concentration of coffee extract: study of block and falling-film
TRANSCRIPT
ADVERTIMENT. La consulta d’aquesta tesi queda condicionada a l’acceptació de les següents condicions d'ús: La difusió d’aquesta tesi per mitjà del servei TDX (www.tesisenxarxa.net) ha estat autoritzada pels titulars dels drets de propietat intel·lectual únicament per a usos privats emmarcats en activitats d’investigació i docència. No s’autoritza la seva reproducció amb finalitats de lucre ni la seva difusió i posada a disposició des d’un lloc aliè al servei TDX. No s’autoritza la presentació del seu contingut en una finestra o marc aliè a TDX (framing). Aquesta reserva de drets afecta tant al resum de presentació de la tesi com als seus continguts. En la utilització o cita de parts de la tesi és obligat indicar el nom de la persona autora. ADVERTENCIA. La consulta de esta tesis queda condicionada a la aceptación de las siguientes condiciones de uso: La difusión de esta tesis por medio del servicio TDR (www.tesisenred.net) ha sido autorizada por los titulares de los derechos de propiedad intelectual únicamente para usos privados enmarcados en actividades de investigación y docencia. No se autoriza su reproducción con finalidades de lucro ni su difusión y puesta a disposición desde un sitio ajeno al servicio TDR. No se autoriza la presentación de su contenido en una ventana o marco ajeno a TDR (framing). Esta reserva de derechos afecta tanto al resumen de presentación de la tesis como a sus contenidos. En la utilización o cita de partes de la tesis es obligado indicar el nombre de la persona autora. WARNING. On having consulted this thesis you’re accepting the following use conditions: Spreading this thesis by the TDX (www.tesisenxarxa.net) service has been authorized by the titular of the intellectual property rights only for private uses placed in investigation and teaching activities. Reproduction with lucrative aims is not authorized neither its spreading and availability from a site foreign to the TDX service. Introducing its content in a window or frame foreign to the TDX service is not authorized (framing). This rights affect to the presentation summary of the thesis as well as to its contents. In the using or citation of parts of the thesis it’s obliged to indicate the name of the author
FREEZE CONCENTRATION OF COFFEE EXTRACT: STUDY OF BLOCK AND FALLING-FILM TECHNIQUES
2014
Fabian Leonardo Moreno Moreno UNIVERSIDAD DE LA SABANA
UNIVERSITAT POLITÈCNICA DE
CATALUNYA BARCELONATECH
BIOSCIENCE DOCTORATE PROGRAM
UNIVERSIDAD DE LA SABANA
AGRIBUSINESS TECHNOLOGY AND BIOTECHNOLOGY DOCTORATE
UNIVERSITAT POLITÈCNICA DE CATALUNYA BARCELONATECH
FREEZE CONCENTRATION OF COFFEE EXTRACT: STUDY OF BLOCK AND
FALLING-FILM TECHNIQUES.
Author:
Eng. MSc. Fabian Leonardo Moreno Moreno
This work has been carried out under the direction of:
Dr. Ruth Yolanda Ruiz Pardo
Dr. Mercè Raventós Santamaría
Chía, Colombia; Barcelona, España; 2014
UNIVERSIDAD DE LA SABANA
DOCTORADO EN BIOCIENCIAS
UNIVERSIDAD POLITÉCNICA DE CATALUÑA BARCELONATECH
DOCTORADO EN TECNOLOGÍA AGROALIMENTARIA Y BIOTECNOLOGÍA
CRIOCONCENTRACIÓN DE EXTRACTO ACUOSO DE CAFÉ: ESTUDIO DE LAS
TÉCNICAS DE BLOQUE TOTAL Y PELÍCULA DESCENDENTE.
Autor:
Ing. MSc. Fabian Leonardo Moreno Moreno
Memoria presentada para optar al título de
Doctor en Biociencias por la Universidad de La Sabana
y
Doctor por La Universidad Politécnica de Cataluña
Directores:
Dr. Ruth Yolanda Ruiz Pardo
Dr. Mercè Raventós Santamaría
Chía, Colombia; Barcelona, España; 2014
Freeze concentration of coffee extract: Study of block and falling-film techniques
ii
A mi esposa María Isabel y mi hija Natalia, la razón de mi vida.
Freeze concentration of coffee extract: Study of block and falling-film techniques
iii
AGRADECIMIENTOS
Es un gran placer para mí agradecer sinceramente a todas las personas que
contribuyeron a la realización de esta tesis doctoral.
En primer lugar agradezco a mis directoras, Dra. Ruth Yolanda Ruíz y Dra. Mercè
Raventós Santamaria, por su acertada dirección, por su contribución, guía, disposición
y apoyo constante durante toda la realización de la tesis. Gracias por la gestión de la
cotutela que me ha permitido vivir la experiencia del desarrollo de la tesis en dos
excelentes universidades.
Agradezco al Dr. Eduard Hernández por su apoyo desde el comité tutorial y su
contribución en la discusión de aspectos fundamentales del proyecto. Gracias por su
apoyo y amistad durante las estancias en la UPC
Al Dr. Josep Auleda, por su orientación en la fase inicial del proyecto y por su amistad.
A la ingeniera Catalina Robles, por su apoyo en la realización de la fase experimental
y su total disposición durante el proyecto.
Al Dr. Mauricio Pardo Benito, por la participación en el comité tutorial, por ser gestor
del proyecto y por su constante contribución en el desarrollo del mismo.
A la Dra. Indira Sotelo por sus consejos y apoyo permanentes.
Al Ing. Carlos Eduardo Osorio, de la empresa Buencafé liofilizado de Colombia, por su
apoyo en el proyecto, por la asesoría y por permitirme contrastar tecnologías de
crioconcenrtación aplicadas a la industria de café.
A todas las personas que colaboraron en la fase experimental. Dr Sergio Cuervo por
su ayuda en los ensayos de cromatografía, Dra Ximena Quintanilla por su ayuda en
los ensayos de análisis de imágenes, Ing. Yomaira Uscategui por su ayuda en los
ensayos de actividad antioxidante y al personal de los laboratorios de Procesos
Agroindustriales de la Universidad de La Sabana y la planta pilot d`aliments de la
Universidad Politécnica de Cataluña por su colaboración.
A los estudiantes de Ingeniería de Producción Agroindustrial de la Universidad de La
Sabana que participaron en el proyecto global.
A mis compañeros del Doctorado en Biociencias, por su amistad y por su ejemplo.
A mi familia, por ayudarme siempre a cumplir mis metas.
Este proyecto fue financiado por Colciencias y la Universidad de La Sabana con el
proyecto 1230521-28461 (2011)
Freeze concentration of coffee extract: Study of block and falling-film techniques
iv
ABSTRACT
Coffee is the most traded food in the world. The coffee industry has a great economic
and social relevance worldwide. The sensory and functional properties of the product
are highly important for the consumers, and therefore, technologies that promote
quality preservation are highly valued in coffee processing. In the production of freeze-
dried coffee, freeze concentration is used to remove water from the extract. Water
removal in freeze concentration is achieved by cooling the solution until ice crystals
form and separate. Freeze concentration is a technology known for its ability to
preserve the quality of the product thanks to low processing temperatures.
Three techniques are used according to ice crystal growth: suspension, film
(progressive or falling-film) and block (total or partial). Suspension freeze concentration
is the most implemented technique at the industrial level. This is an efficient technique
in terms of ice purity and increased concentration; however, it requires complex
systems for ice separation and many moving parts, which increases the initial and
operating costs. For this reason, other freeze concentration techniques have been
studied. Different techniques, such as falling-film freeze concentration, and block
freeze concentration are being developed seeking to reduce operational costs.
In the present work, block and falling-film freeze concentration techniques used to
concentrate aqueous coffee extract were studied. Equipment to study those techniques
was designed and implemented. The effect of the operational variables of block and
falling-film freeze concentration on separation efficiency was established. Preservation
of bioactive compounds, volatile compounds, antioxidant activity, and sensory quality of
the coffee extract when using freeze concentration was demonstrated. Finally, an
operational strategy was proposed to integrate the studied techniques. Separation
efficiency obtained with this process was comparable to industrial standards.
The project was developed as a doctoral thesis under joint supervision by the Ph.D. in
Biosciences of the University of La Sabana in Bogotá, Colombia and the Agribusiness
Technology and Biotechnology Doctorate of the Technical University of Catalonia in
Barcelona, Spain. Five papers were published as a result of the present work.

Freeze concentration of coffee extract: Study of block and falling-film techniques
v
RESUMEN
El café es el alimento más comercializado en el mundo y por esto es alta su
importancia económica y social. En la industria del café, la calidad sensorial y
funcional de la bebida es un parámetro de alta importancia, por lo cual se promueve el
uso de tecnologías de proceso que permitan su preservación. En el proceso de
obtención de café soluble liofilizado se utiliza la crioconcentración como una etapa
para la eliminación parcial del agua del extracto.
La crioconcentración es una tecnología para la eliminación de agua de soluciones
mediante su enfriamiento hasta la formación y separación de cristales de hielo. Es
una técnica que puede preservar la calidad del producto debido a las bajas
temperaturas que maneja.
Existen tres técnicas de crioconcentración: suspensión, película y bloque. La única
técnica disponible comercialmente a nivel mundial es la crioconcentración en
suspensión. Esta es una técnica que logra altas eficiencias de separación pero los
equipos requieren gran número de partes móviles por lo cual es relativamente costosa.
Debido a esto se busca el desarrollo de técnicas más simples que a la vez consigan
una alta eficiencia en la separación. La crioconcentración en película descendente y
en bloque son nuevas técnicas que se han propuesto como alternativas más simples
que pueden reducir costos operacionales.
En el presente proyecto se estudió la crioconcentración en bloque total y en película
descendente para la obtención de extractos concentrados de café. Se realizó el
diseñó de una unidad de estudios para la crioconentración. Igualmente, se estableció
el efecto de las variables operativas de la crioconcentración en bloque y en película
sobre la eficiencia de la separación y se demostró la preservación de los
componentes bioactivos, la preservación de los componentes volátiles y de la calidad
sensorial del extracto de café. Se obtuvieron modelos matemáticos para la predicción
del coeficiente de distribución en el hielo que permite predecir el comportamiento de la
crioconcentración. Finalmente, se propuso una estrategia operativa para integración
de las técnicas estudiadas que permite obtener eficiencias de separación acordes con
los estándares industriales.
El proyecto se desarrolló bajo la modalidad de Cotutela de Tesis Doctoral en forma
conjunta entre el Doctorado en Biociencias de la Universidad de La Sabana en Bogotá,
Colombia y el Doctorado en Tecnología Agroalimentaria y Biotecnología de la
Universidad Politécnica de Cataluña en Barcelona, España. Como resultado del
proyecto se publicaron cinco artículos en revistas indexadas.
Freeze concentration of coffee extract: Study of block and falling-film techniques
vi
RESUM
El cafè és l'aliment més comercialitzat del món i té una gran importància econòmica i
social. En la indústria del cafè, la qualitat sensorial i funcional de la beguda és un
paràmetre important la qual cosa incentiva l'ús de tecnologies de procés que permetin
mantenir-ne la qualitat. Durant el procés d'obtenció de cafè liofilitzat s'utilitza la
crioconcentració com etapa prèvia d'eliminació de part de l'aigua continguda en la
solució.
La crioconcentració és una tecnologia que permet l'eliminació d'aigua d'una solució a
través del seu refredament fins a la formació i la separació dels cristalls de gel. Es
tracta d'una tècnica que pot preservar la qualitat del producte a causa de les baixes
temperatures utilitzades.
Hi ha tres tècniques de crioconcentració: suspensió, pel·lícula i bloc. La única tècnica
disponible comercialment arreu del món és la crioconcentració en suspensió. Aquesta
és una tècnica que aconsegueix una gran eficiència en la separació, però és
relativament cara per la qual cosa es busca el desenvolupament de tècniques més
senzilles que al mateix temps aconsegueixin una alta eficiència de separació. La
crioconcentració de pel·lícula descendent i en bloc es mostren com a alternatives.
En aquest projecte hem estudiat la crioconcentració en bloc total i en pel·lícula
descendent per a la producció d'extractes concentrats de cafè. S'ha dissenyat una
unitat d'estudi per a la crioconcentracio. També s'ha establert l'efecte de les variables
operatives de la crioconcentració en bloc i pel·lícula sobre l'eficàcia de la separació i
s'ha demostrat la preservació de compostos bioactius, la preservació dels components
volàtils i de la qualitat sensorial de l'extracte de cafè. S’han obtingut models
matemàtics per a la predicció del coeficient de distribució en el gel que li permeten
predir el comportament de la crioconcentració. Finalment, es proposa una estratègia
operativa per a la integració de les tècniques estudiades permetent obtenir eficiències
de separació coherents amb estàndards de la indústria.
El projecte s’ha desenvolupat en forma de tesi cotutelada conjuntament entre el
doctorat en Biociències de la Universidad de La Sabana de Bogotà, Colòmbia i el
doctorat en Tecnologia dels aliments i Biotecnologia de la Universitat Politècnica de
Catalunya a Barcelona, Espanya. Arran del projecte hi ha cinc articles publicats en
revistes indexades.
Freeze concentration of coffee extract: Study of block and falling-film techniques
vii
CONTENT
ABSTRACT .....................................................................................................................iv
RESUMEN ...................................................................................................................... v
RESUM ...........................................................................................................................vi
CONTENT ..................................................................................................................... vii
LIST OF FIGURES .........................................................................................................xi
LIST OF TABLES ......................................................................................................... xiii
1. INTRODUCTION ..................................................................................................... 1
1.1. State of the art .................................................................................................. 1
1.1.1. Coffee ........................................................................................................ 1
1.1.1. Freeze Concentration ................................................................................ 2
1.1.1. Suspension Freeze Concentration ............................................................ 3
1.1.1. Film Freeze Concentration ........................................................................ 4
1.1.1. Block Freeze Concentration ...................................................................... 6
1.2. Research question ........................................................................................... 8
1.2. Objectives ......................................................................................................... 9
1.2.1. General Objective ..................................................................................... 9
1.2.1.1. Specific Objectives ................................................................................ 9
1.3. Structure of the document .............................................................................. 10
1.4. Published papers ............................................................................................ 12
2. DESIGN OF AN EQUIPMENT FOR THE STUDY OF BLOCK AND FALLING-FILM
FREEZE CONCENTRATION ....................................................................................... 13
2.1. Systems of the Test Unit ................................................................................ 13
2.2. Structure of the Freeze Concentration Unit .................................................... 14
2.3. Design Parameters and Operational Intervals. .............................................. 16
3. RHEOLOGICAL BEHAVIOUR, FREEZING CURVE, AND DENSITY OF COFFEE
SOLUTIONS AT TEMPERATURES CLOSE TO FREEZING ...................................... 19
3.1. Abstract .......................................................................................................... 19
3.2. Introduction ..................................................................................................... 20
3.3. Materials and methods ................................................................................... 21
3.4. Results and discussion ................................................................................... 23
3.5. Conclusions .................................................................................................... 31
3.6. References ..................................................................................................... 31
Freeze concentration of coffee extract: Study of block and falling-film techniques
viii
4. BLOCK FREEZE-CONCENTRATION OF COFFEE EXTRACT: EFFECT OF
FREEZING AND THAWING STAGES ON SOLUTE RECOVERY AND BIOACTIVE
COMPOUNDS .............................................................................................................. 34
4.1. Abstract .......................................................................................................... 34
4.2. Introduction ..................................................................................................... 35
4.3. Materials and Methods ................................................................................... 36
4.3.1. Materials .................................................................................................. 36
4.3.2. Methods .................................................................................................. 36
4.4. Results and discussion ................................................................................... 42
4.4.1. Temperature profiles ............................................................................... 42
4.4.2. Freeze-concentration tests ...................................................................... 42
4.4.3. Effect of each operational factor on solute recovery ............................... 45
4.4.4. Bioactive compounds and the antioxidant activity of coffee .................... 50
4.5. Conclusions .................................................................................................... 51
4.6. References ..................................................................................................... 52
5. EFFECT OF SEPARATION AND THAWING MODE ON BLOCK FREEZE-
CONCENTRATION OF COFFEE BREWS ................................................................... 55
5.1. Abstract .......................................................................................................... 55
5.2. Introduction ..................................................................................................... 55
5.3. Materials and methods ................................................................................... 56
5.3.1. Materials .................................................................................................. 56
5.3.2. Methods .................................................................................................. 57
5.3.3. Data analysis and modeling .................................................................... 58
5.3.4. Mathematical model ................................................................................ 59
5.3.5. Statistic analysis ...................................................................................... 60
5.4. Results and discussion ................................................................................... 60
5.5. Conclusions .................................................................................................... 66
5.6. References ..................................................................................................... 67
6. BEHAVIOUR OF FALLING-FILM FREEZE CONCENTRATION OF COFFEE
EXTRACT ..................................................................................................................... 69
6.1. ABSTRACT .................................................................................................... 69
6.2. Introduction ..................................................................................................... 70
6.3. Materials and Methods ................................................................................... 71
6.3.1. Materials .................................................................................................. 71
6.3.2. Methods .................................................................................................. 71
6.4. Results ........................................................................................................... 74

Freeze concentration of coffee extract: Study of block and falling-film techniques
ix
6.4.1. Effect of the average ice growth rate and the fluid velocity ..................... 74
6.4.2. Effect of solid concentration .................................................................... 76
6.4.3. Mathematical modelling .......................................................................... 77
6.4.4. Model for solid concentration prediction in successive stages ................ 79
6.5. Conclusions .................................................................................................... 80
6.6. References ..................................................................................................... 81
7. VOLATILE COMPOUNDS PRESERVATION AND SOLUTES RETENTION OF
BLOCK AND FALLING-FILM FREEZE CONCENTRATION OF COFFEE EXTRACT . 84
7.1. Abstract .......................................................................................................... 84
7.2. Introduction ..................................................................................................... 84
7.3. Materials and Methods ................................................................................... 86
7.3.1. Materials .................................................................................................. 86
7.3.2. Methods .................................................................................................. 86
7.4. Results ........................................................................................................... 90
7.4.1. Freeze Concentration Tests .................................................................... 90
7.4.2. Image Analysis of Morphological Structure of the Ice Crystals ............... 91
7.4.3. Identification and Quantification of the Volatile Compounds ................... 93
7.4.4. Sensory Evaluation ................................................................................. 96
7.5. Conclusions .................................................................................................... 98
7.6. References ..................................................................................................... 98
8. A PROCESS TO CONCENTRATE COFFEE EXTRACT BY THE INTEGRATION
OF FALLING FILM AND BLOCK FREEZE-CONCENTRATION ................................ 103
8.1. Abstract ........................................................................................................ 103
8.2. Introduction ................................................................................................... 103
8.3. Materials and Methods ................................................................................. 104
8.3.1. Materials ................................................................................................ 104
8.3.2. Methods ................................................................................................ 105
8.4. Results and Discussion ................................................................................ 108
8.4.1. Falling film freeze concentration ........................................................... 108
8.4.2. Coffee solids recovery by fractionated thawing ..................................... 110
8.4.3. Block freeze-concentration .................................................................... 113
8.4.4. Integration of falling film freeze concentration, ice thawing and block
freeze concentration ............................................................................................ 114
8.5. Conclusions .................................................................................................. 116
8.6. References ................................................................................................... 117
9. MAIN RESULTS OF THIS DISSERTATION ....................................................... 120

Freeze concentration of coffee extract: Study of block and falling-film techniques
x
10. CONCLUSIONS AND SUGGESTIONS ........................................................... 124
11. REFERENCES ................................................................................................ 126
12. APPENDIXES .................................................................................................. 135
Freeze concentration of coffee extract: Study of block and falling-film techniques
xi
LIST OF FIGURES
Figure 1.1. Process used to obtain soluble coffee .......................................................... 2
Figure 1.2. Freeze concentration techniques. Source: The author. ................................ 3
Figure 1.3. Structure of the document. ......................................................................... 11
Figure 2.1. Piping and instrumentation diagram of block freeze concentrator. ............. 14
Figure 2.2. Piping and instrumentation diagram of falling-film freeze concentrator. ..... 14
Figure 2.3. Overall setup of the freeze concentration unit. ........................................... 15
Figure 2.4. Mechanical planes of freeze concentrator. Isometric projection. ................ 15
Figure 2.5. Mechanical planes of freeze concentrator. ................................................. 16
Figure 2.6. Block freeze concentrator. .......................................................................... 17
Figure 2.7. Cooling container ........................................................................................ 17
Figure 2.8. Falling film freeze concentrator. ................................................................. 18
Figure 2.9. Freezing chamber. ...................................................................................... 18
Figure 3.1 Cooling curves of coffee solutions. Xs=0.40 ............................................... 25
Figure 3.2. Rheogram of coffee solutions ..................................................................... 26
Figure 3.3. Coffee solutions viscosity as a function of temperature and coffee mass
fraction. ......................................................................................................................... 30
Figure 4.1. Experimental set up for block freeze concentration .................................... 37
Figure 4.2. Solute yield during freeze concentration tests. ........................................... 39
Figure 4.3. Temperature profile during freezing and thawing stages. .......................... 43
Figure 4.4. Effect of coffee mass fraction on solute yield and the concentration index. 46
Figure 4.5. Effect of freezing direction on solute yield and the concentration index. .... 47
Figure 4.6. Effect of cooling temperature on solute yield and the concentration index. 48
Figure 4.7. Effect of heating temperature on solute yield and the concentration index. 49
Figure 5.1. Experimental set up. ................................................................................... 57
Figure 5.2. Parity plot: experimental Y values against predicted Ŷ values. ................. 62
Figure 5.3. Effect of temperature on Solute Yield. ........................................................ 63
Figure 5.4. Effect of separation mode on Solute Yield ................................................. 64
Figure 5.5. Effect of Thawing mode on Solute Yield ..................................................... 64
Figure 5.6. Effect of Thawing mode on Solute Yield ..................................................... 65
Figure 6.1. Experimental setup. .................................................................................... 72
Figure 6.2. Effect of the ratio between average ice growth rate and fluid velocity on the
average distribution coefficient. .................................................................................... 75
Figure 6.3. Effect of coffee mass fraction on average distribution coefficient ............... 76
Figure 6.4. Modelling of the partition coefficient as a function of Xs, V ice and Us. ........ 78
Figure 6.5. Parity plot of the average distribution coefficient. ....................................... 78
Figure 6.6. Predicted values of successive stages of falling film freeze concentration of
coffee extract. ............................................................................................................... 79
Figure 7.1 Experimental set up. (a) block freeze concentrator; (b) falling-film freeze
concentrator .................................................................................................................. 87
Figure 7.2. Microphotographs of ice crystals of block and falling film-freeze
concentration at three positions from the cooling surface. 10X. ................................... 92
Figure 7.3. Chromatograms of coffee extract. .............................................................. 94
Figure 7.4. Quantitative descriptive analysis of initial extract and freeze-concentrated
samples ........................................................................................................................ 96

Freeze concentration of coffee extract: Study of block and falling-film techniques
xii
Figure 8.1. Flowchart of freeze concentration tests .................................................... 105
Figure 8.2. Experimental setup for freeze concentration tests. .................................. 106
Figure 8.3. Solid concentration in liquid (○) and ice (□) at each stage of falling film
freeze concentration. .................................................................................................. 109
Figure 8.4. Concentration index as a function of the thawing fraction. ....................... 111
Figure 8.5. Concentration index (CI) at the recommended thawing fraction as a function
of the initial solid concentration (C s0) of the ice. ......................................................... 112
Figure 8.6. Solute yield (Y) and concentration index (CI) after block freeze
concentration. ............................................................................................................. 113
Figure 8.7. Integrated process to freeze-concentrate coffee extract using falling film
freeze concentration (FFFC), fractionated thawing (T) and block freeze concentration
(BFC). ......................................................................................................................... 115
Freeze concentration of coffee extract: Study of block and falling-film techniques
xiii
LIST OF TABLES
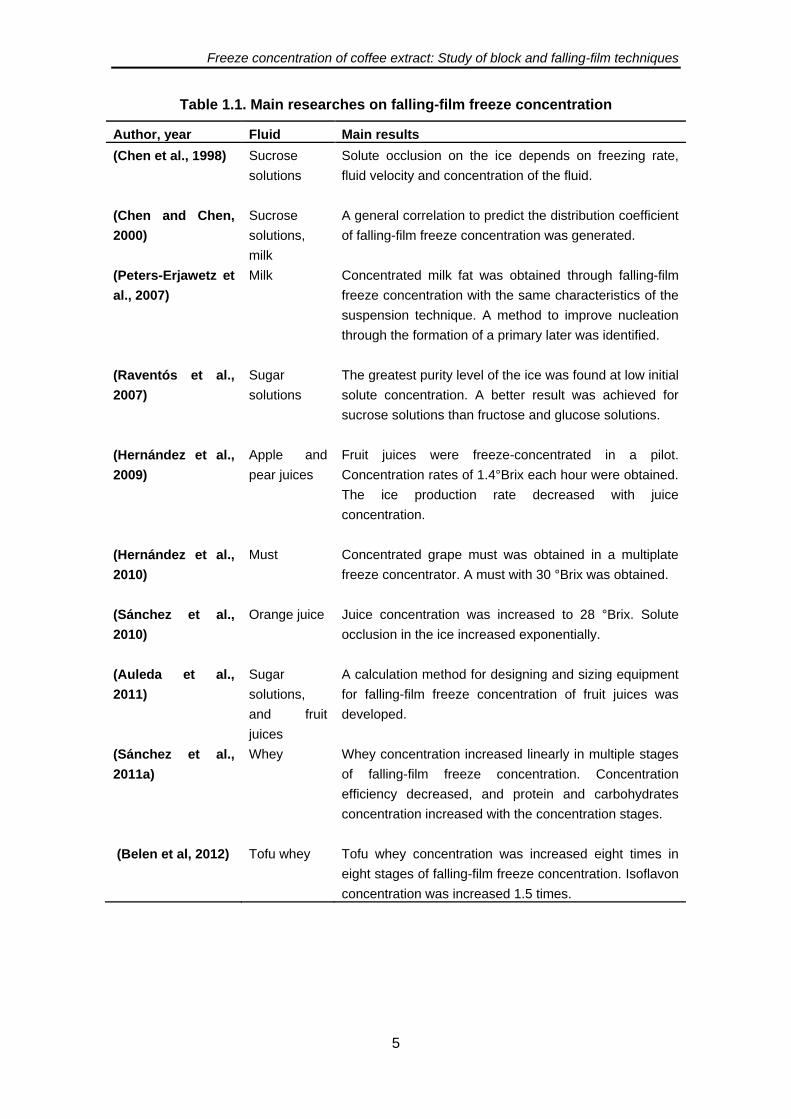
Table 1.1. Main researches on falling-film freeze concentration .................................... 5
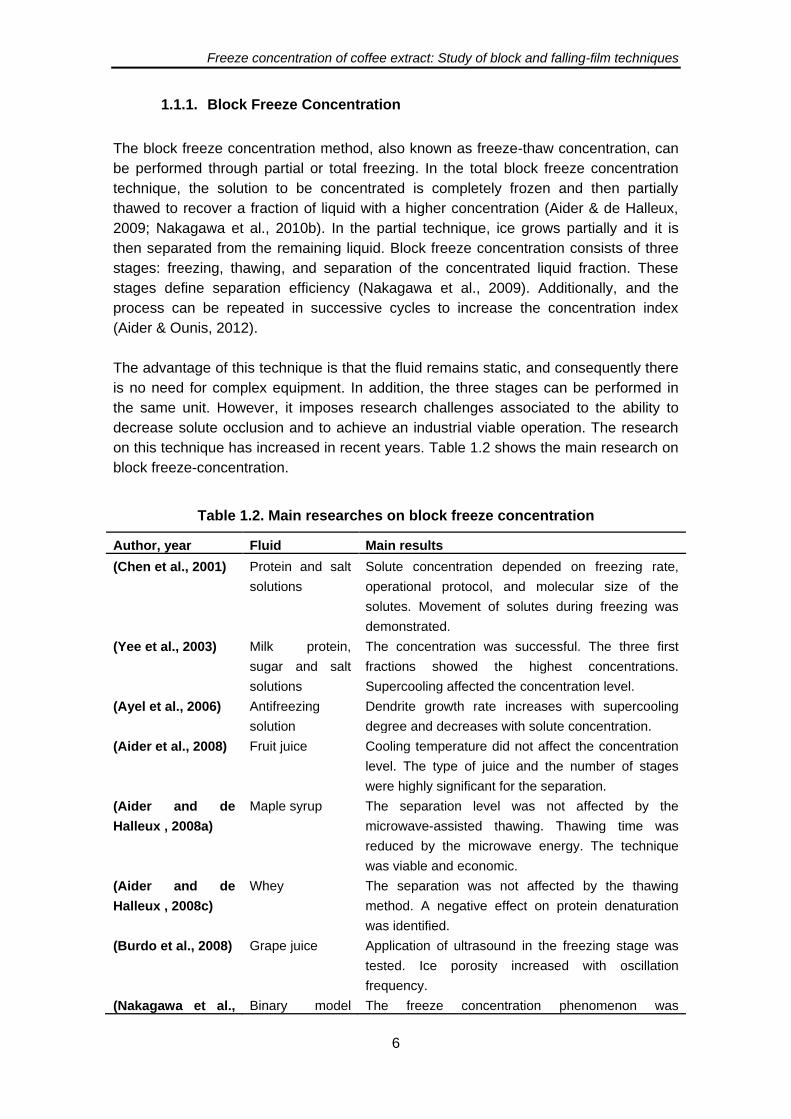
Table 1.2. Main researches on block freeze concentration ............................................ 6
Table 2.1 Systems of the concentration unit. ................................................................ 13
Table 3.1 Xs and refractive index as a function of brix degrees for coffee solutions .... 24
Table 3.2. Freezing point of coffee solutions as a function of coffee mass fraction ..... 25
Table 3.3. Parameters of power law (Eq. 1) for different coffee mass fractions and
temperatures ................................................................................................................. 27
Table 3.4. Viscosity of coffee solutions at different temperatures (T) and coffee mass
fractions (Xs). (mPa·s) .................................................................................................. 28
Table 3.5. Parameters of Arrhenius equation (Eq. 2.) for coffee solutions at different Xs
...................................................................................................................................... 28
Table 3.6. Parameters of mathematical models for prediction of coffee solution's
viscosity. ....................................................................................................................... 29
Table 3.7. Density of coffee extract (kg·m-3) as a function of coffee mass fraction and
temperature. ................................................................................................................. 30
Table 4.1. Experimental design .................................................................................... 37
Table 4.2. Freeze concentration tests in descending order of area under the curve .... 44
Table 4.3. Significance analysis for freeze concentration factors ................................. 45
Table 5.1. Experimental design .................................................................................... 58
Table 5.2. Solute recovery ratio. ................................................................................... 61
Table 5.3. Effect of TT, TM and SM on solute recovery ratio. ...................................... 62
Table 6.1. Experimental design. ................................................................................... 71
Table 6.2. Multiple regression analysis of Eq. (15) ....................................................... 76
Table 6.3. Parameters of Eq. (8) for several food fluids. .............................................. 79
Table 7.1. Results of freeze concentration tests ........................................................... 91
Table 7.2. Morphometric parameters of ice crystals produced in block and falling-film
freeze concentration ..................................................................................................... 93
Table 7.3. Relative percent area of major volatile compounds in coffee extract before
and after freeze concentration. ..................................................................................... 95
Table 7.4. Ice loss percentage of volatile compounds after freeze concentration ........ 95
Table 7.5. Significance of differences of quantitative descriptive analysis among freeze
concentration techniques .............................................................................................. 97
Table 8.1. Initial coffee solid concentration (C s0), concentration index (CI), solute yield
at each stage (Y STAGE), ice fraction (f ice) and concentration efficiency (Eff) of falling film
freeze concentration tests ........................................................................................... 110
Table 8.2. Concentration of the diluted (C s dil) and concentrated fractions (C s conc) of
the recommended thawing fraction (f at CI=1). .......................................................... 112
Table 8.3. Results of block freeze concentration. ....................................................... 114
Table 8.4. Final results of the integrated freeze-concentration process. .................... 116
Freeze concentration of coffee extract: Study of block and falling-film techniques
1
1. INTRODUCTION
This chapter offers a brief introduction of this thesis. The chapter describes the state of
the art of freeze concentration research, the motivations of conducting this study and
the research question. Then the objectives of the study are presented. Finally, the
chapter introduces the overall structure of the document.
1.1. State of the art
1.1.1. Coffee
Coffee is the second most traded commodity in the world after petroleum and the most
traded food worldwide (Esquivel and Jiménez, 2012; Vignoli et al., 2011). Current
competition in the coffee industry focuses on product quality. Soluble coffee is a
processed product created to facilitate beverage preparation, while preserving product
quality (Cheong et al., 2013; Farah et al., 2006).
Two value parameters are recognized in soluble coffee: sensory quality and functional
quality. Coffee has more than 800 compounds responsible for its aroma, but few
impact compounds are particularly important (Franca et al., 2005; Sarrazin and Que,
2000). The sensory evaluation and volatile compounds determinations are parameters
of sensory quality evaluation (Farah et al., 2006). On the other hand, several studies
report the health benefits of consuming coffee beverages. Compounds with antioxidant
activity have been identified in coffee extract, including those of the chlorogenic acid
group: chlorogenic acid (CGA) (3-caffeoylquinic acid), crypto-chlorogenic acid (cCGA)
(4-caffeoylquinic acid), neo chlorogenic acid (n-CGA) (5-caffeoylquinic acid), and
caffeine (Fujioka and Shibamoto, 2008; Sopelana et al., 2013; Vignoli et al., 2011).
Functional quality and organoleptic quality are common parameters used in the
evaluation of soluble coffee production.
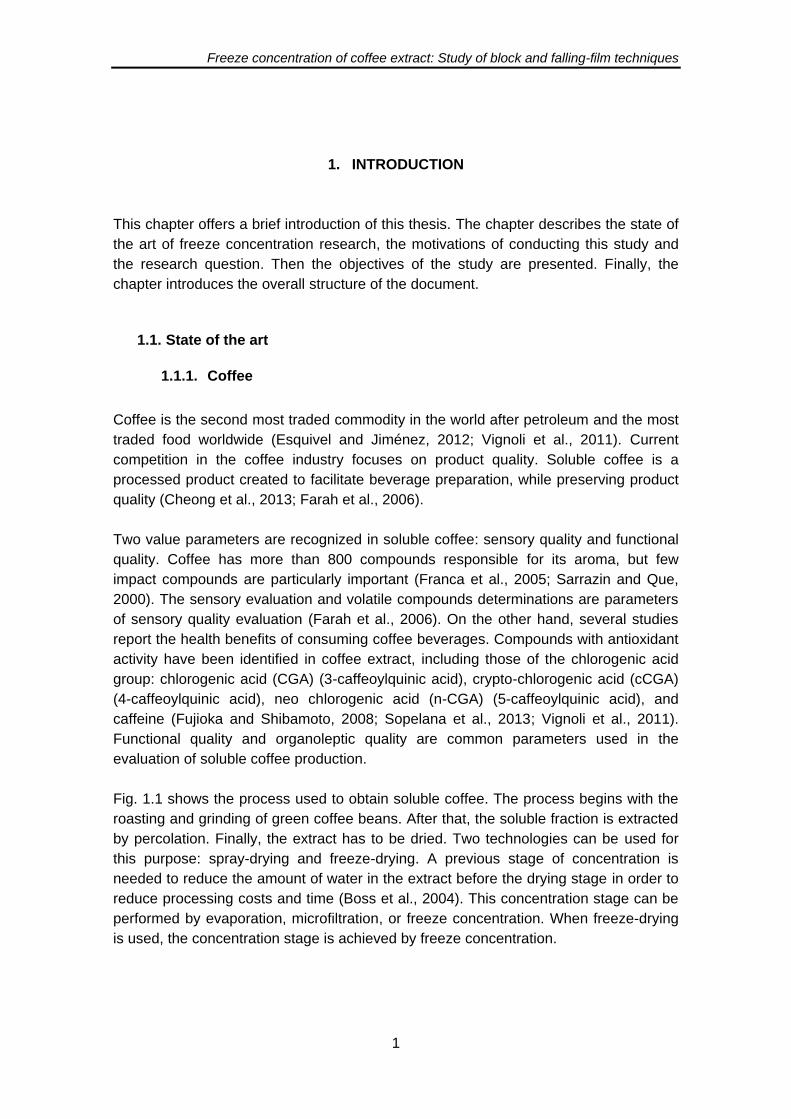
Fig. 1.1 shows the process used to obtain soluble coffee. The process begins with the
roasting and grinding of green coffee beans. After that, the soluble fraction is extracted
by percolation. Finally, the extract has to be dried. Two technologies can be used for
this purpose: spray-drying and freeze-drying. A previous stage of concentration is
needed to reduce the amount of water in the extract before the drying stage in order to
reduce processing costs and time (Boss et al., 2004). This concentration stage can be
performed by evaporation, microfiltration, or freeze concentration. When freeze-drying
is used, the concentration stage is achieved by freeze concentration.
Freeze concentration of coffee extract: Study of block and falling-film techniques
2
Figure 1.1. Process used to obtain soluble coffee
1.1.1. Freeze Concentration
Freeze Concentration (FC) is a technology used to remove water at low temperatures,
preserving the quality of the original material. Water removal in FC is achieved by
cooling the solution until ice crystals form and separate, producing a more
concentrated fluid (Sánchez et al., 2009). Several industries use freeze concentration
technology, including the food industry −fruit juices, dairy products, wine, and beer−,
biotechnology and waste water treatment (Aider and de Halleux, 2009b; Sánchez et al.,
2009).
Two phases are obtained when the temperature of an aqueous solution is decreased
below the freezing point: a liquid phase with higher solute concentration than the initial
solution, and a solid phase composed by pure ice in the ideal situation or ice with
trapped solutes in the practical situation (Rahman, 2006). This phenomenon is known
as solute occlusion (Aider and de Halleux, 2009b; Sánchez et al., 2009) and it implies
heat and mass transfer (Petzold and Aguilera, 2009).
The freezing process involves the crystallization of water contained in the solution.
Crystallization is the formation of solid particles from a homogenous phase (Chen et
al., 1998). This process involves three steps. First, the solution must be subjected to
supersaturation or supercooling. Second, a nucleation or production of the first stable
particles is needed. Finally, crystal particles grow to their final size depending on
temperature conditions (Sánchez et al., 2009). Primary heterogeneous nucleation
occurs on surfaces different than the crystal itself, such as the container wall or
impurities (Mullin, 2001). Once the ice seeds are produced, they grow through a
process known as Ostwald ripening (Aider et al., 2009a). Crystallization plays an
important role on the behaviour of freeze concentration technology. Separation is
determined by freezing and thawing stages. Research usually focuses on these stages,
as well as on the type of solution and the operational variables that have an effect on
separation.
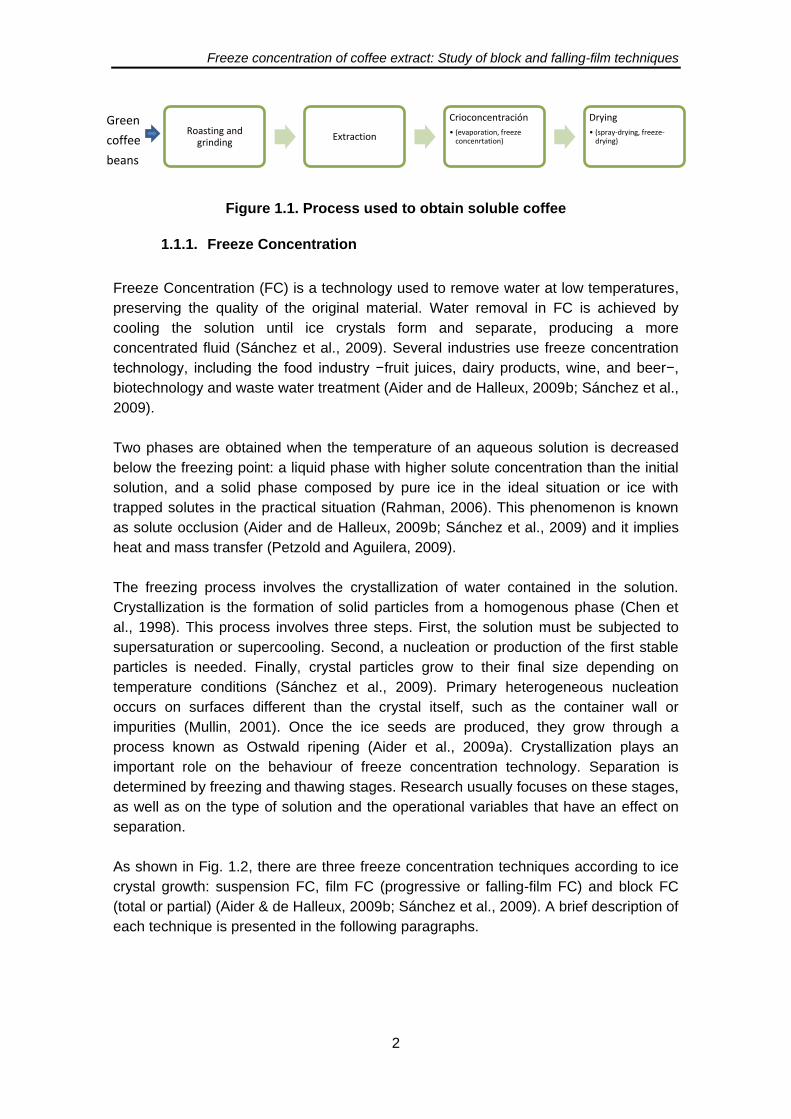
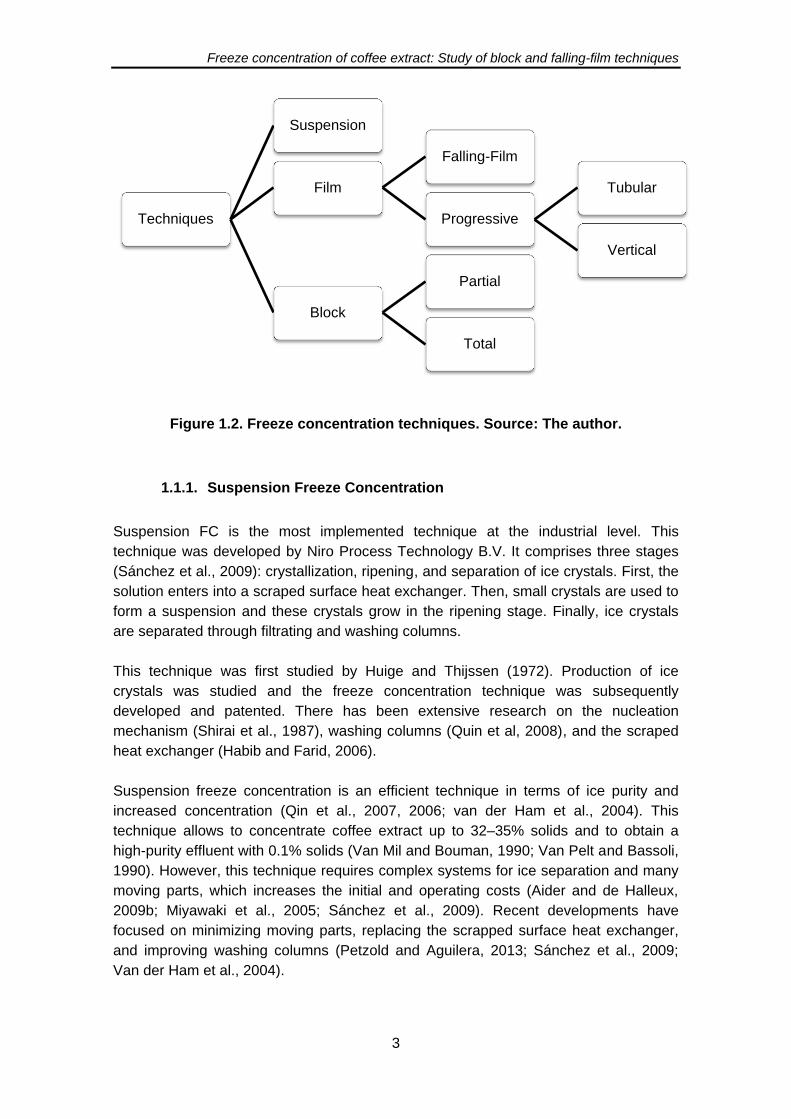
As shown in Fig. 1.2, there are three freeze concentration techniques according to ice
crystal growth: suspension FC, film FC (progressive or falling-film FC) and block FC
(total or partial) (Aider & de Halleux, 2009b; Sánchez et al., 2009). A brief description of
each technique is presented in the following paragraphs.
Roasting and grinding
Extraction
Crioconcentración
• (evaporation, freeze concenrtation)
Drying
• (spray-drying, freeze-drying)
Green
coffee
beans
Freeze concentration of coffee extract: Study of block and falling-film techniques
3
Figure 1.2. Freeze concentration techniques. Source: The author.
1.1.1. Suspension Freeze Concentration
Suspension FC is the most implemented technique at the industrial level. This
technique was developed by Niro Process Technology B.V. It comprises three stages
(Sánchez et al., 2009): crystallization, ripening, and separation of ice crystals. First, the
solution enters into a scraped surface heat exchanger. Then, small crystals are used to
form a suspension and these crystals grow in the ripening stage. Finally, ice crystals
are separated through filtrating and washing columns.
This technique was first studied by Huige and Thijssen (1972). Production of ice
crystals was studied and the freeze concentration technique was subsequently
developed and patented. There has been extensive research on the nucleation
mechanism (Shirai et al., 1987), washing columns (Quin et al, 2008), and the scraped
heat exchanger (Habib and Farid, 2006).
Suspension freeze concentration is an efficient technique in terms of ice purity and
increased concentration (Qin et al., 2007, 2006; van der Ham et al., 2004). This
technique allows to concentrate coffee extract up to 32–35% solids and to obtain a
high-purity effluent with 0.1% solids (Van Mil and Bouman, 1990; Van Pelt and Bassoli,
1990). However, this technique requires complex systems for ice separation and many
moving parts, which increases the initial and operating costs (Aider and de Halleux,
2009b; Miyawaki et al., 2005; Sánchez et al., 2009). Recent developments have
focused on minimizing moving parts, replacing the scrapped surface heat exchanger,
and improving washing columns (Petzold and Aguilera, 2013; Sánchez et al., 2009;
Van der Ham et al., 2004).
Techniques
Suspension
Film
Falling-Film
Progressive
Tubular
Vertical
Block
Partial
Total
Freeze concentration of coffee extract: Study of block and falling-film techniques
4
1.1.1. Film Freeze Concentration
Film freeze concentration consists in the formation of a single ice film on a cooling
surface. Separation of the ice is easier than in the suspension technique as the film
remains adhered to the surface. Ice growing and separation stages are carried out
using the same equipment. Heat transfer is achieved across the ice layer. Two different
options have been developed for film freeze concentration: falling-film freeze
concentration and progressive freeze concentration.
Progressive Freeze Concentration
In progressive freeze concentration, an ice film is produced on a cooling surface while
the fluid is moving on the growing ice layer (Miyawaki et al., 2005). Progressive freeze
concentration can be performed in vertical or tubular equipment.
Tubular progressive freeze concentration was proposed by Shirai et al. (1998) and it
consists of two concentric tubes that are connected. The solution to be concentrated
and the refrigerant fluid circulate through the inner and the external tube, respectively.
Ice is produced on the internal wall of the inner tube. The velocity of the fluid reduces
solute occlusion on the ice layer. Relevant operational variables include initial
concentration and type of solution, cooling temperature, and flow rate of the solution
(Miyawaki et al., 2005; Shirai et al., 1998; Wakisaka et al., 2001).
On the other hand, the vertical system is composed by a cylindrical agitated tank
equipped with a cooling jacket. Ice grows on the cooling wall. Agitation is applied to
reduce solute occlusion. Operational variables in this technique are cooling rate,
agitation rate, and type and initial concentration of the solution. (Liu et al., 1998)
Falling-Film Freeze Concentration
Falling-film freeze concentration is carried out in a plate equipment. In this technique,
the solution to be concentrated re-circulates on a cooled vertical plate. Fluid descends
down a film, and an ice sheet is produced by freezing. Ice forms a single layer on the
cold surface. The solution is collected and re-circulated continuously (Sánchez et al.,
2011b). The process is performed in batch operation. The simplicity of ice separation is
an advantage of this technique. Current studies of this technique focus on how to
increase the concentration level of the solution and the purity of ice. Table 1.1 shows
the main research on falling-film freeze concentration.
Freeze concentration of coffee extract: Study of block and falling-film techniques
5
Table 1.1. Main researches on falling-film freeze concentration
Author, year Fluid Main results
(Chen et al., 1998) Sucrose
solutions
Solute occlusion on the ice depends on freezing rate,
fluid velocity and concentration of the fluid.
(Chen and Chen,
2000)
Sucrose
solutions,
milk
A general correlation to predict the distribution coefficient
of falling-film freeze concentration was generated.
(Peters-Erjawetz et
al., 2007)
Milk Concentrated milk fat was obtained through falling-film
freeze concentration with the same characteristics of the
suspension technique. A method to improve nucleation
through the formation of a primary later was identified.
(Raventós et al.,
2007)
Sugar
solutions
The greatest purity level of the ice was found at low initial
solute concentration. A better result was achieved for
sucrose solutions than fructose and glucose solutions.
(Hernández et al.,
2009)
Apple and
pear juices
Fruit juices were freeze-concentrated in a pilot.
Concentration rates of 1.4°Brix each hour were obtained.
The ice production rate decreased with juice
concentration.
(Hernández et al.,
2010)
Must Concentrated grape must was obtained in a multiplate
freeze concentrator. A must with 30 °Brix was obtained.
(Sánchez et al.,
2010)
Orange juice Juice concentration was increased to 28 °Brix. Solute
occlusion in the ice increased exponentially.
(Auleda et al.,
2011)
Sugar
solutions,
and fruit
juices
A calculation method for designing and sizing equipment
for falling-film freeze concentration of fruit juices was
developed.
(Sánchez et al.,
2011a)
Whey Whey concentration increased linearly in multiple stages
of falling-film freeze concentration. Concentration
efficiency decreased, and protein and carbohydrates
concentration increased with the concentration stages.
(Belen et al, 2012)
Tofu whey Tofu whey concentration was increased eight times in
eight stages of falling-film freeze concentration. Isoflavon
concentration was increased 1.5 times.
Freeze concentration of coffee extract: Study of block and falling-film techniques
6
1.1.1. Block Freeze Concentration
The block freeze concentration method, also known as freeze-thaw concentration, can
be performed through partial or total freezing. In the total block freeze concentration
technique, the solution to be concentrated is completely frozen and then partially
thawed to recover a fraction of liquid with a higher concentration (Aider & de Halleux,
2009; Nakagawa et al., 2010b). In the partial technique, ice grows partially and it is
then separated from the remaining liquid. Block freeze concentration consists of three
stages: freezing, thawing, and separation of the concentrated liquid fraction. These
stages define separation efficiency (Nakagawa et al., 2009). Additionally, and the
process can be repeated in successive cycles to increase the concentration index
(Aider & Ounis, 2012).
The advantage of this technique is that the fluid remains static, and consequently there
is no need for complex equipment. In addition, the three stages can be performed in
the same unit. However, it imposes research challenges associated to the ability to
decrease solute occlusion and to achieve an industrial viable operation. The research
on this technique has increased in recent years. Table 1.2 shows the main research on
block freeze-concentration.
Table 1.2. Main researches on block freeze concentration
Author, year Fluid Main results
(Chen et al., 2001) Protein and salt
solutions
Solute concentration depended on freezing rate,
operational protocol, and molecular size of the
solutes. Movement of solutes during freezing was
demonstrated.
(Yee et al., 2003) Milk protein,
sugar and salt
solutions
The concentration was successful. The three first
fractions showed the highest concentrations.
Supercooling affected the concentration level.
(Ayel et al., 2006) Antifreezing
solution
Dendrite growth rate increases with supercooling
degree and decreases with solute concentration.
(Aider et al., 2008) Fruit juice Cooling temperature did not affect the concentration
level. The type of juice and the number of stages
were highly significant for the separation.
(Aider and de
Halleux , 2008a)
Maple syrup The separation level was not affected by the
microwave-assisted thawing. Thawing time was
reduced by the microwave energy. The technique
was viable and economic.
(Aider and de
Halleux , 2008c)
Whey The separation was not affected by the thawing
method. A negative effect on protein denaturation
was identified.
(Burdo et al., 2008) Grape juice Application of ultrasound in the freezing stage was
tested. Ice porosity increased with oscillation
frequency.
(Nakagawa et al., Binary model The freeze concentration phenomenon was
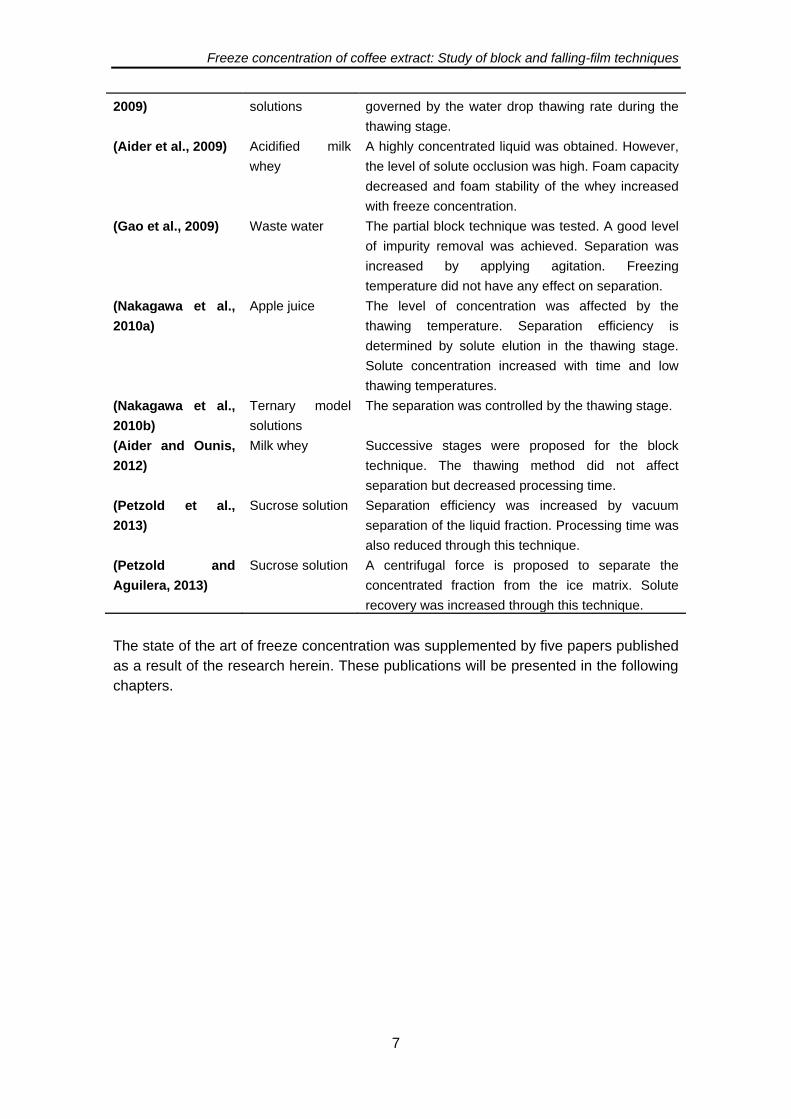
Freeze concentration of coffee extract: Study of block and falling-film techniques
7
2009) solutions governed by the water drop thawing rate during the
thawing stage.
(Aider et al., 2009) Acidified milk
whey
A highly concentrated liquid was obtained. However,
the level of solute occlusion was high. Foam capacity
decreased and foam stability of the whey increased
with freeze concentration.
(Gao et al., 2009) Waste water The partial block technique was tested. A good level
of impurity removal was achieved. Separation was
increased by applying agitation. Freezing
temperature did not have any effect on separation.
(Nakagawa et al.,
2010a)
Apple juice The level of concentration was affected by the
thawing temperature. Separation efficiency is
determined by solute elution in the thawing stage.
Solute concentration increased with time and low
thawing temperatures.
(Nakagawa et al.,
2010b)
Ternary model
solutions
The separation was controlled by the thawing stage.
(Aider and Ounis,
2012)
Milk whey Successive stages were proposed for the block
technique. The thawing method did not affect
separation but decreased processing time.
(Petzold et al.,
2013)
Sucrose solution Separation efficiency was increased by vacuum
separation of the liquid fraction. Processing time was
also reduced through this technique.
(Petzold and
Aguilera, 2013)
Sucrose solution A centrifugal force is proposed to separate the
concentrated fraction from the ice matrix. Solute
recovery was increased through this technique.
The state of the art of freeze concentration was supplemented by five papers published
as a result of the research herein. These publications will be presented in the following
chapters.
Freeze concentration of coffee extract: Study of block and falling-film techniques
8
1.2. Research question
Freeze concentration is a technology used to eliminate water from aqueous solutions,
preserving quality through low processing temperatures. This technology is used in the
food, pharmaceutical, and biotechnological industries. Freeze concentration is used in
the process to obtain freeze-dried coffee. The most implemented technique is
suspension freeze concentration, which is effective for separation; however, this
technique requires systems of ice separation and many moving parts, which increases
initial and operating costs. For this reason, other freeze concentration techniques have
been studied. Different techniques, such as falling-film, and block freeze-concentration
are being developed seeking to reduce operational costs. The operational conditions of
these new techniques have not been defined, hindering their industrial implementation.
The use of these techniques in coffee extraction through concentration has not been
tested yet.
A key problem for researchers is to establish the relationship between the operational
variables and the phenomena required to reduce solute occlusion and to increase
separation efficiency of block and falling-film freeze concentration. In addition, the
functional quality and sensory quality of the product are highly important in the coffee
industry. For this reason, the effect of freeze concentration on the organoleptic quality
and functional quality of coffee extract should be studied. From this context, the
following research questions can be formulated:
¿What is the effect of the operational variables of block and falling-film freeze
concentration on separation efficiency and quality of coffee extract?
Freeze concentration of coffee extract: Study of block and falling-film techniques
9
1.2. Objectives
1.2.1. General Objective
The main objective of the present study was to establish the effect of the operational
variables of block and falling-film freeze concentration on separation efficiency and
quality of coffee extract.
1.2.1.1. Specific Objectives
1. Design and implement an equipment to study block and falling-film freeze
concentration.
2. Determine the effect of operational variables of freeze concentration on
separation efficiency.
3. Assess the effect of freeze concentration on volatile and bioactive
compounds of coffee extract.
4. Propose operative strategies to integrate block and falling-film freeze
concentration of coffee extract in order to increase solute recovery.
Freeze concentration of coffee extract: Study of block and falling-film techniques
10
1.3. Structure of the document
The present thesis document is organized in ten chapters.
The first chapter offers a brief presentation of the state of the art, the research
question, and the objectives of the study. The second chapter presents the design of a
test unit for studying block and falling-film freeze concentration.
Chapter three presents the characterization of the main physical properties of coffee
extract at temperatures close to freezing. The relations between coffee mass fraction
and Brix degrees, freezing curve, rheological behaviour, and density of coffee solutions
at temperatures close to the freezing point were measured and modelled
mathematically.
Chapter four focuses on the study of the effect of the operational variables of block and
falling-film freeze concentration on separation efficiency. This chapter presents the
evaluation of the effect of the initial coffee mass fraction, the cooling temperature, the
heating temperature, and the freezing direction on the solute yield and concentration
index of block freeze-concentrated coffee extracts. In addition, it discusses the impact
of the technique on the bioactive compound concentration and antioxidant activity of
the coffee extract.
The effect of different separation and thawing methods in block freeze-concentration is
provided in chapter five. The effect of gravitational and vacuum assisted separation,
thawing temperature, and thawing method on solute yield is also studied.
The effect of the operational variables on solute occlusion in falling-film freeze
concentration is studied in chapter six. The aim of this chapter is to evaluate the
behaviour of coffee extract during falling-film freeze concentration at different coffee
mass fractions, ice growth rates, and film velocities on the plate, and to obtain the
parameters for average distribution coefficient modelling.
A comparative of solute retention, productivity, ice morphology, volatile compounds
preservation and sensory quality between block and falling-film freeze concentration of
coffee extract is presented in chapter seven.
Chapter eight proposes a process for integrating block and falling-film freeze
concentration seeking to increase separation efficiency. The process presented in
chapter eight includes recovery of coffee solids by fractionated thawing and block
freeze-concentration techniques.
The main results of the study are summarized in chapter nine. Finally, conclusions and
suggestions for future work are provided in chapter ten.
Freeze concentration of coffee extract: Study of block and falling-film techniques
11
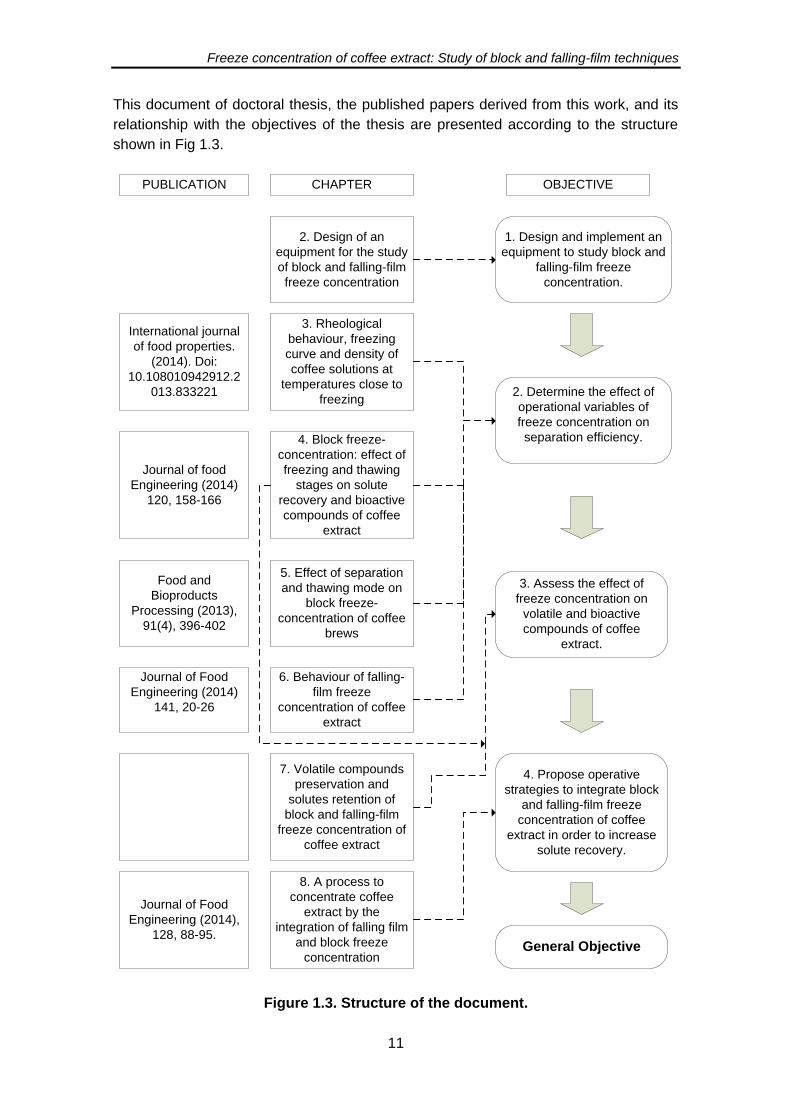
This document of doctoral thesis, the published papers derived from this work, and its
relationship with the objectives of the thesis are presented according to the structure
shown in Fig 1.3.
2. Design of an
equipment for the study
of block and falling-film
freeze concentration
3. Rheological
behaviour, freezing
curve and density of
coffee solutions at
temperatures close to
freezing
4. Block freeze-
concentration: effect of
freezing and thawing
stages on solute
recovery and bioactive
compounds of coffee
extract
5. Effect of separation
and thawing mode on
block freeze-
concentration of coffee
brews
6. Behaviour of falling-
film freeze
concentration of coffee
extract
7. Volatile compounds
preservation and
solutes retention of
block and falling-film
freeze concentration of
coffee extract
8. A process to
concentrate coffee
extract by the
integration of falling film
and block freeze
concentrationGeneral Objective
3. Assess the effect of
freeze concentration on
volatile and bioactive
compounds of coffee
extract.
4. Propose operative
strategies to integrate block
and falling-film freeze
concentration of coffee
extract in order to increase
solute recovery.
2. Determine the effect of
operational variables of
freeze concentration on
separation efficiency.
1. Design and implement an
equipment to study block and
falling-film freeze
concentration.
Journal of food
Engineering (2014)
120, 158-166
International journal
of food properties.
(2014). Doi:
10.108010942912.2
013.833221
Food and
Bioproducts
Processing (2013),
91(4), 396-402
Journal of Food
Engineering (2014)
141, 20-26
Journal of Food
Engineering (2014),
128, 88-95.
CHAPTER OBJECTIVEPUBLICATION
Figure 1.3. Structure of the document.
Freeze concentration of coffee extract: Study of block and falling-film techniques
12
1.4. Published papers
The following research papers were published as a result of the present work:
1. Moreno F.L., Raventós M., Hernández E., Santamaría N., Acosta J., Pirachican O., Torres
L. and Ruiz Y. (2014) Rheological behaviour, freezing curve and density of coffee solutions
at temperatures close to freezing. International Journal of Food Properties. DOI:
10.1080/10942912.2013.833221
2. Moreno, F.L., Raventós, M., Hernández, E., & Ruiz, Y. (2014). Block freeze-concentration
of coffee extract: effect of freezing and thawing stages on solute recovery and bioactive
compounds. Journal of Food Engineering, 120, 158-166
3. Moreno, F.L., Robles, C. M., Sarmiento, Z., Ruiz, Y., & Pardo, J. M. (2013). Effect of
separation and thawing mode on block freeze-concentration of coffee brews. Food and
Bioproducts Processing, 91(4), 396-402
4. Moreno, F.L., Raventós, M., Hernández, E., Ruiz, Y. (2014). Behaviour of falling-film freeze
concentration of coffee extract. Journal of Food Engineering 141, 20-26.
5. Moreno, F.L., Hernández, E., Raventós, M., Robles, C., & Ruiz, Y. (2014). A process to
concentrate coffee extract by the integration of falling film and block freeze-concentration.
Journal of Food Engineering, 128, 88-95.
In addition, the following works were presented in scientific congresses:
1. Moreno, F.L., Hernández, E., Raventós, M., Robles, C., & Ruiz, Y. (2012). Mathematical
modelling of rheological behaviour of coffee extract at temperatures close to freezing. In:
Congreso Español de Ingeniería de Alimentos CESIA VII. Ciudad Real, España.
2. Ramírez, A. Moreno, F.L. Ruiz, Y. Block freeze concentration of coffee extract. (2012).
Revista Vitae 19, (1). In: I Congreso Internacional de investigación e innovación en ciencia
y tecnología de alimentos IICTA. Bogotá, Colombia.
3. Moreno, F. L., Raventós, M., Hernández E., Gulfo R., Ruiz, Y. (2014) Technical, energetic
and economic comparative of three concentration systems in a fruit juice industry: Case of
study. In: Congreso Iberoamericano de Ingeniería de Alimentos CIBIA 9. Valencia, España.
4. Moreno, F. L., Raventós, M., Hernández E., Gulfo R., Robles, C., Ruiz, Y. (2014)
Integration of block and falling-film freeze concentration applied to concentrate sucrose
solutions. In: Congreso Iberoamericano de Ingeniería de Alimentos CIBIA 9. Valencia,
España.
5. Moreno, F. L., Hernández A.J., Moreno Y., Ruiz, Y. (2014). Soluble solids and sediments
determination during block freeze concentration of coffee extract. In: II Congreso
Internacional de investigación e innovación en ciencia y tecnología de alimentos IICTA.
Medellín, Colombia.
Freeze concentration of coffee extract: Study of block and falling-film techniques
13
2. DESIGN OF AN EQUIPMENT FOR THE STUDY OF BLOCK AND FALLING-FILM
FREEZE CONCENTRATION
A unit for the study of block and falling-film freeze concentration was designed in order
to develop the present research. The main results of the design process are presented
in this chapter.
2.1. Systems of the Test Unit
The unit for the study of freeze concentration must control the main operational
variables of freeze concentration required to develop the tests. Firstly, the unit should
provide cooling and heating fluids with the possibility of temperature and freezing
direction controlling. Secondly, the temperature and concentration of the solution
should be measured during the tests. In addition, the equipment should be able to
couple a block or a falling-film freeze concentration device. For these reasons, the
freeze concentration unit is composed by the systems shown in Table 2.1.
Table 2.1 Systems of the concentration unit.
SYSTEM DESCRIPTION
Cooling system Thermostatic bath to provide a cooling fluid (ethylene glycol-water 50%
m/m). The fluid is pumped to the freeze concentration device.
Heating system
In block freeze concentration a thawing stage is needed. For this reason a
thermostatic bath to provide a heating fluid (ethylene glycol-water 50%
m/m) was used. The fluid is pumped to the block freeze-concentration
device during the thawing stage.
Block freeze-
concentration
device
The block freeze-concentration device is a cylindrical container. The
container consists in a double jacket device for the circulation of cooling
and heating fluids. The device has thermal insulation and exit valves to
collect the thawing fraction.
Falling-film
freeze
concentration
device
The falling-film freeze concentration device is a chamber with an internal
cooling plate to freeze the solution. The cooling fluid circulates inside the
plate. The fluid flows through a descending film over the cooling plate,
and it is collected in a tank and re-circulated by peristaltic pump. Ice
grows on the surface of the plate.
Valves and
connexions
It consists in a system of flexible hosepipe that conducts cooling and
heating fluids to the block device and the plate of the falling-film chamber.
A set of valves is provided to control freezing and thawing direction
according to experimental requirements.
Support
structure
It consists in a structure that supports the freezing container, the falling-
film chamber, the hosepipe, and the valves.
Freeze concentration of coffee extract: Study of block and falling-film techniques
14
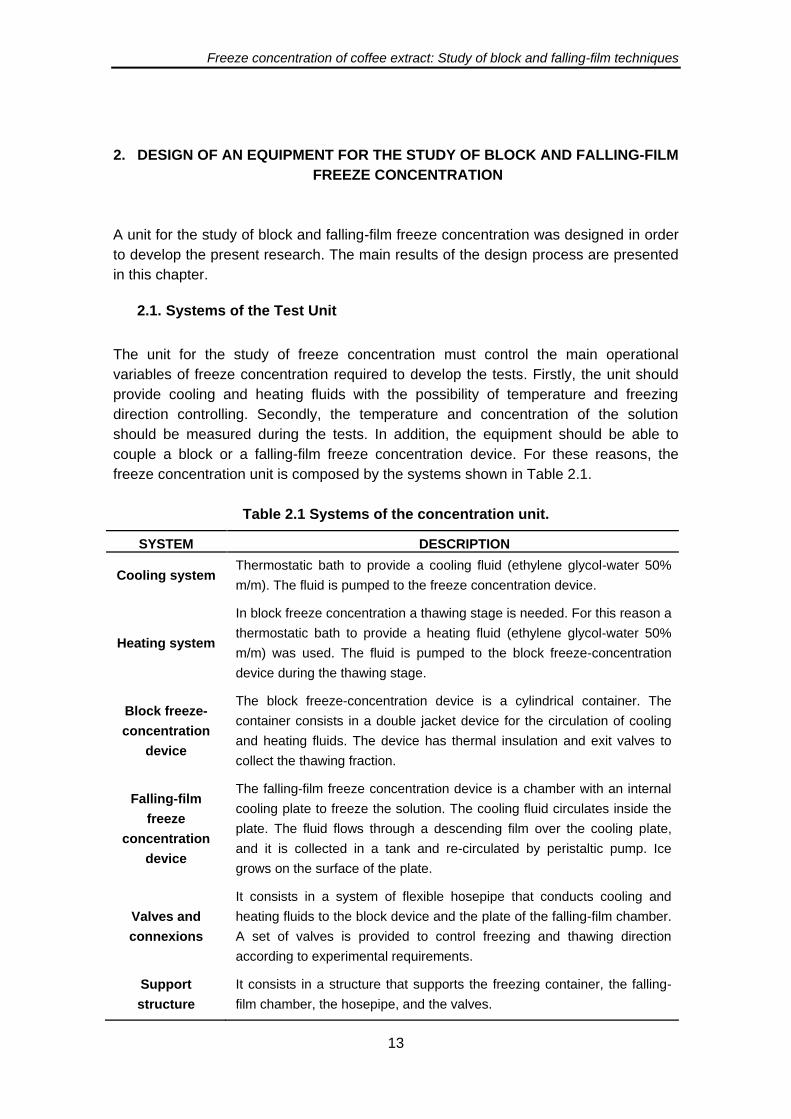
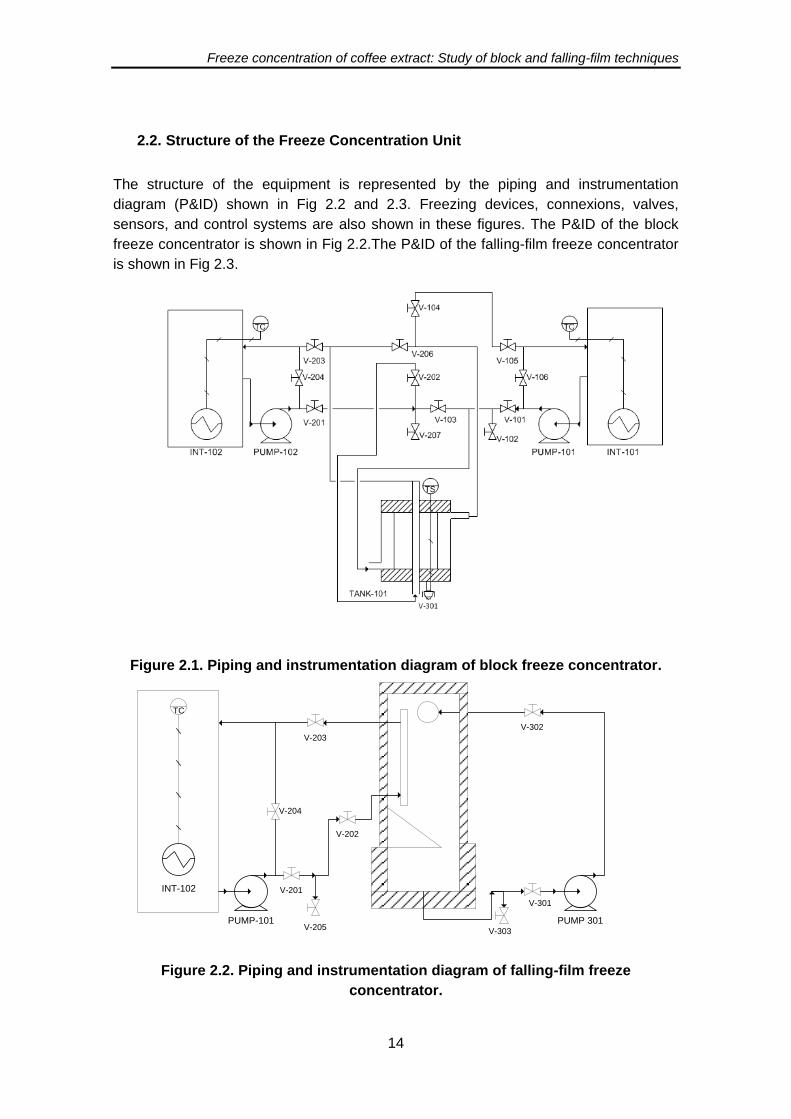
2.2. Structure of the Freeze Concentration Unit
The structure of the equipment is represented by the piping and instrumentation
diagram (P&ID) shown in Fig 2.2 and 2.3. Freezing devices, connexions, valves,
sensors, and control systems are also shown in these figures. The P&ID of the block
freeze concentrator is shown in Fig 2.2.The P&ID of the falling-film freeze concentrator
is shown in Fig 2.3.
Figure 2.1. Piping and instrumentation diagram of block freeze concentrator.
PUMP-101
INT-102
V-301
V-303
V-302
V-201
V-204
V-203
TC
V-205
V-202
PUMP 301
Figure 2.2. Piping and instrumentation diagram of falling-film freeze
concentrator.
Freeze concentration of coffee extract: Study of block and falling-film techniques
15
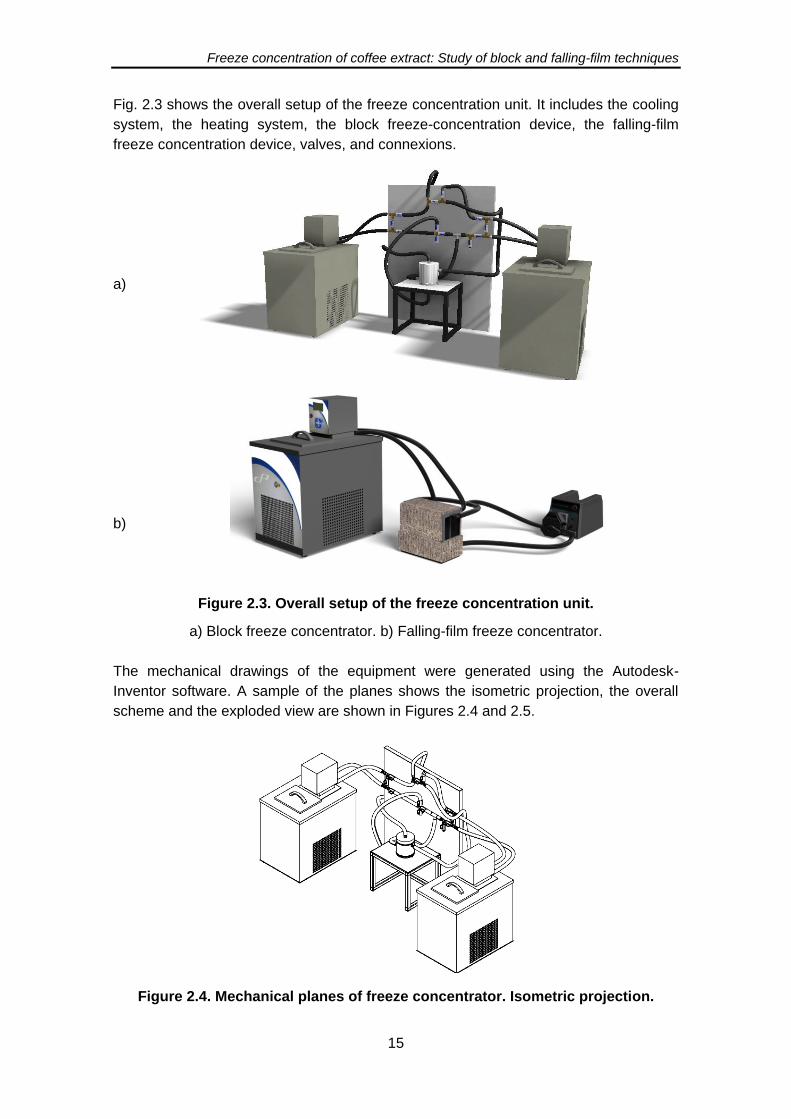
Fig. 2.3 shows the overall setup of the freeze concentration unit. It includes the cooling
system, the heating system, the block freeze-concentration device, the falling-film
freeze concentration device, valves, and connexions.
a)
b)
Figure 2.3. Overall setup of the freeze concentration unit.
a) Block freeze concentrator. b) Falling-film freeze concentrator.
The mechanical drawings of the equipment were generated using the Autodesk-
Inventor software. A sample of the planes shows the isometric projection, the overall
scheme and the exploded view are shown in Figures 2.4 and 2.5.
Figure 2.4. Mechanical planes of freeze concentrator. Isometric projection.
Freeze concentration of coffee extract: Study of block and falling-film techniques
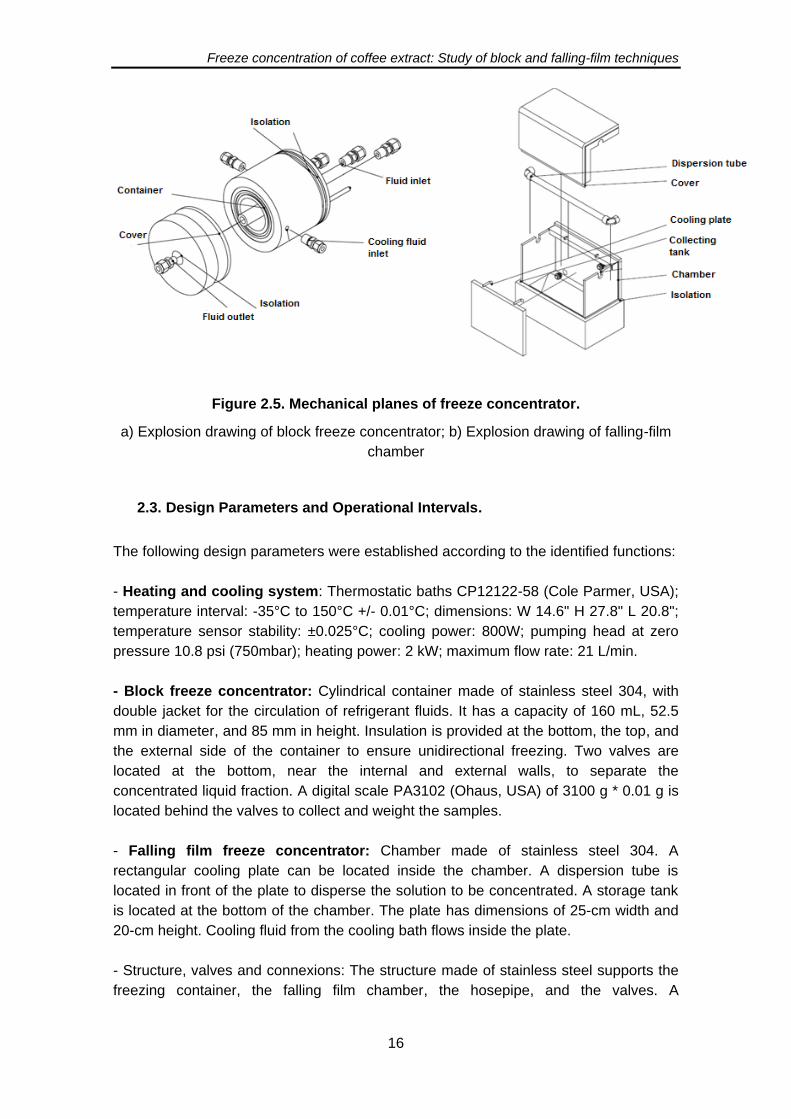
16
Figure 2.5. Mechanical planes of freeze concentrator.
a) Explosion drawing of block freeze concentrator; b) Explosion drawing of falling-film
chamber
2.3. Design Parameters and Operational Intervals.
The following design parameters were established according to the identified functions:
- Heating and cooling system: Thermostatic baths CP12122-58 (Cole Parmer, USA);
temperature interval: -35°C to 150°C +/- 0.01°C; dimensions: W 14.6" H 27.8" L 20.8";
temperature sensor stability: ±0.025°C; cooling power: 800W; pumping head at zero
pressure 10.8 psi (750mbar); heating power: 2 kW; maximum flow rate: 21 L/min.
- Block freeze concentrator: Cylindrical container made of stainless steel 304, with
double jacket for the circulation of refrigerant fluids. It has a capacity of 160 mL, 52.5
mm in diameter, and 85 mm in height. Insulation is provided at the bottom, the top, and
the external side of the container to ensure unidirectional freezing. Two valves are
located at the bottom, near the internal and external walls, to separate the
A digital scale PA3102 (Ohaus, USA) of 3100 g * 0.01 g is concentrated liquid fraction.
located behind the valves to collect and weight the samples.
- Falling film freeze concentrator: Chamber made of stainless steel 304. A
rectangular cooling plate can be located inside the chamber. A dispersion tube is
located in front of the plate to disperse the solution to be concentrated. A storage tank
is located at the bottom of the chamber. The plate has dimensions of 25-cm width and
20-cm height. Cooling fluid from the cooling bath flows inside the plate.
- Structure, valves and connexions: The structure made of stainless steel supports the
freezing container, the falling film chamber, the hosepipe, and the valves. A
Freeze concentration of coffee extract: Study of block and falling-film techniques
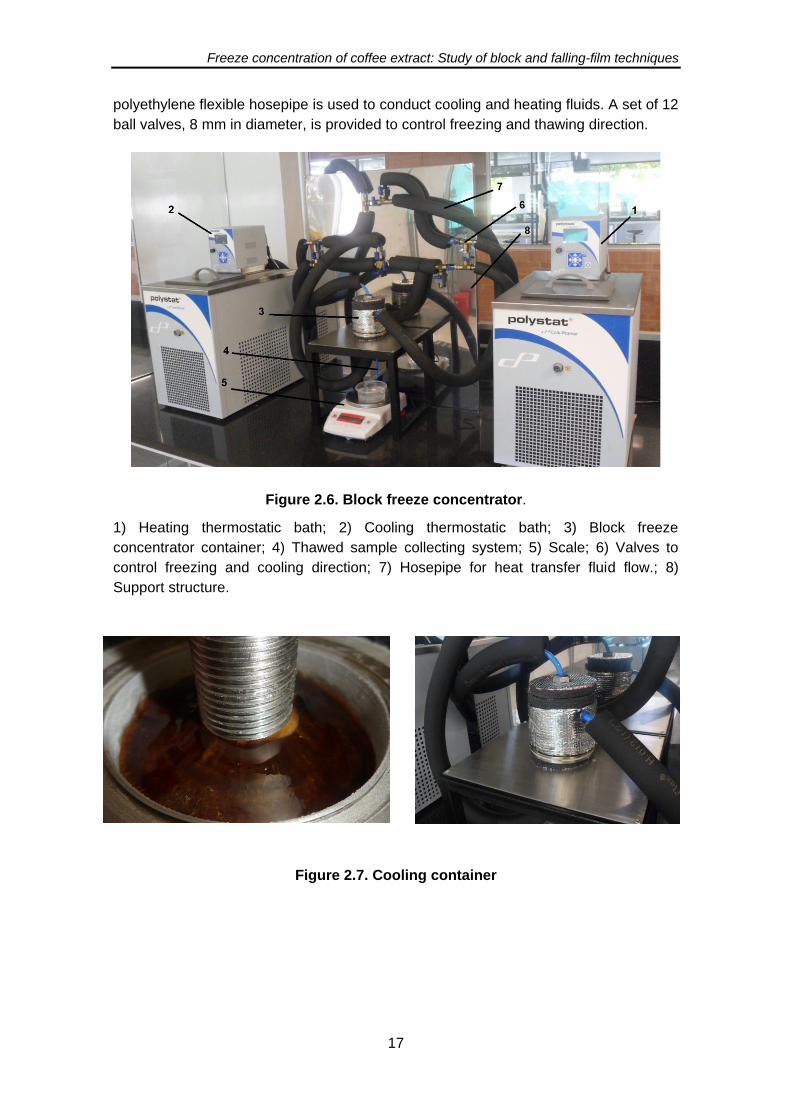
17
polyethylene flexible hosepipe is used to conduct cooling and heating fluids. A set of 12
ball valves, 8 mm in diameter, is provided to control freezing and thawing direction.
Figure 2.6. Block freeze concentrator.
1) Heating thermostatic bath; 2) Cooling thermostatic bath; 3) Block freeze
concentrator container; 4) Thawed sample collecting system; 5) Scale; 6) Valves to
control freezing and cooling direction; 7) Hosepipe for heat transfer fluid flow.; 8)
Support structure.
Figure 2.7. Cooling container
Freeze concentration of coffee extract: Study of block and falling-film techniques
18
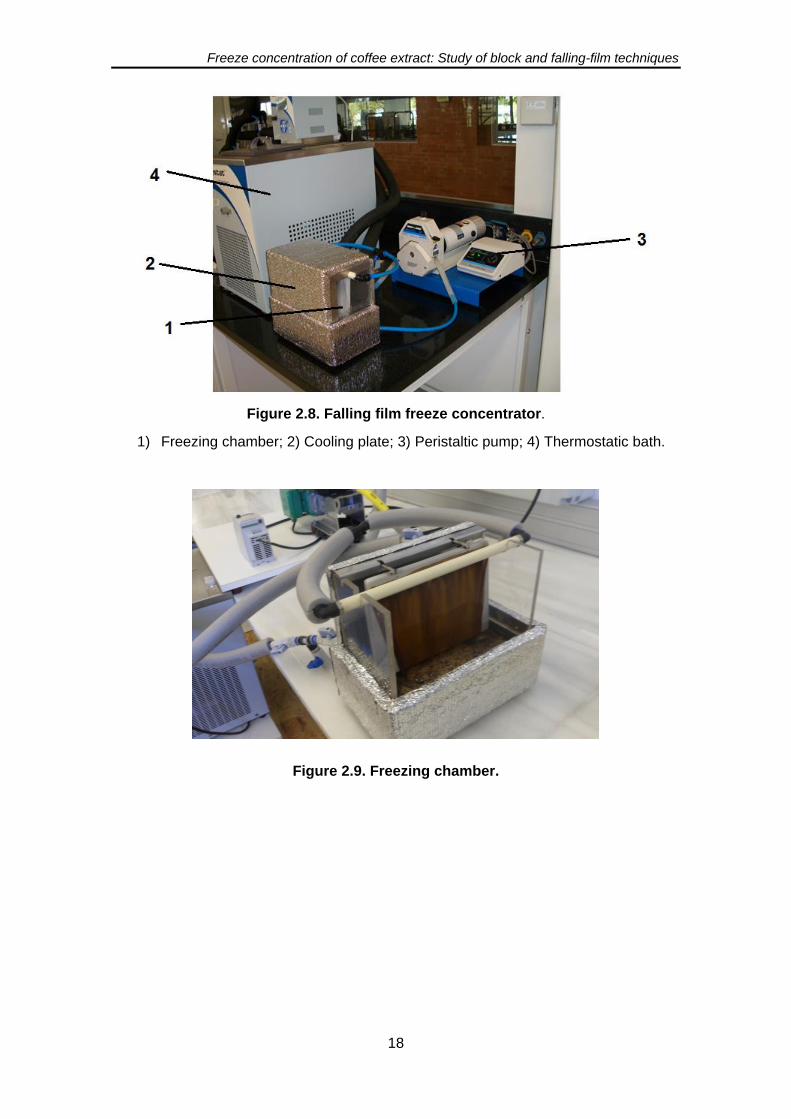
Figure 2.8. Falling film freeze concentrator.
1) Freezing chamber; 2) Cooling plate; 3) Peristaltic pump; 4) Thermostatic bath.
Figure 2.9. Freezing chamber.

Freeze concentration of coffee extract: Study of block and falling-film techniques
19
3. RHEOLOGICAL BEHAVIOUR, FREEZING CURVE, AND DENSITY OF COFFEE
SOLUTIONS AT TEMPERATURES CLOSE TO FREEZING
3.1. Abstract
The physical properties of coffee solutions were determined for temperatures close to
the freezing point. Rheological behaviour, freezing curve, density and their relationship
between coffee mass fraction and brix degrees were determined for coffee mass
fractions between 5 and 50% (wet basis) in the -6°C to 20°C temperature interval.
Values of viscosity varied from 1.99 to 1037 mPa·s and values of density from 1000 to
1236 kg·m-3. The freezing curve was generated using the undercooling method, giving
values within freezing curves for food fluids. The results were used to generate
mathematical models to predict viscosity, freezing point depression, and density as a
function of coffee mass fraction and temperature.
Keywords: Coffee; Properties; Rheology; Freezing; Modelling; Freeze-Concentration
Nomenclature
°Brix Brix degrees
a, b, c, d parameters of Eq. 3 and Eq. 4
a1, a2, b1, b2, c1 parameters of Eq. 5
a3, a4, a5, a6 a7 parameters of Eq. 7
Ea Activation energy (kJ•mol-1)
FPD Freezing point depression
γ Shear rate (s-1)
K Consistency coefficient (Pa•sn)
k0 Frequency factor (mPa•s)
n Flow behaviour index
nD Refractive index
R \ Universal gas constant (8.314 kJ•mol-1•K-1)
R2 Coefficient of determination
T Temperature (°C)
Xs Coffee mass fraction (g coffee/ g solution)
ρ Density
ρc Density of coffee solids
ρw Density of water
σ Shear stress (Pa)
Φ Temperature correction
ω Rotational speed (rpm)
𝜼 Viscosity (mPa•s)
𝜼* Standard reference Viscosity (1 mPa•s)
Freeze concentration of coffee extract: Study of block and falling-film techniques
20
3.2. Introduction
Coffee is the second traded commodity in the world after petroleum and one of the
most consumed food beverage worldwide (Cheong et al., 2013; Esquivel y Jiménez,
2012). In the coffee industry, preservation of quality is highly important; for this reason,
low temperature technologies are commonly implemented. Technologies such as
freeze-concentration and freeze-drying are used to produce soluble coffee thanks to
the flavour preservation promoted for the low temperatures using (McLeod et al., 2016;
Miyawaki et al., 2005; Sánchez et al., 2009).
The measurement of physical properties of food fluids at low temperatures is relevant
in the designing of processes and equipment for freezing technologies. The freezing
curve of food fluids represents the state of food as a function of solid concentration and
temperature. The state diagram is useful for process conditions selection in freezing
technologies (Rahman, 2006). Flux behaviour comprehension at temperatures just
above the freezing point of fluids is required for sizing freeze-concentration equipment,
such as falling film or tubular systems. In a similar way, determining of the viscosity and
density is important to establish the power requirements for pumping during fluid
processing (Chin et al., 2009). Determining of mathematical models for physical
properties and rheological behaviour at low temperatures and at different mass
fractions allows applying calculation methods for designing and sizing equipment for
freeze concentration (Auleda et al., 2011).
The coffee mass fraction or solid content can be measured by gravimetric techniques;
however, Brix degrees determination can be a faster technique. There is no
coincidence between Brix degrees and solid content because the darker colour of
coffee solutions and the minimum fraction of sediments of coffee extract can affect the
diffraction of light. A relationship between Brix degree and coffee mass fraction has not
been described.
There are several mathematical models for viscosity prediction of food fluids (Ibarz et
al., 1992; Longinotty and Corti ,2008; Falguera and Ibarz, 2010). However, few studies
report mathematical modelling of food fluids viscosity at low temperatures. In this
sense, viscosities for sugar solutions, fruit juices, and dairy emulsions at low
temperatures were reported by (Falguera et al.,2010; Ibarz et al., 2009; Ruiz et al.,
2010;Tavares et al., 2007; Gabriele et al., 2011). In the case of coffee solutions,
viscosity and some physical properties have been reported by (Sobolik et al., 2002;
Telis-Romero et al., 2001) for temperatures ranging from 20 to 80°C. The freezing
curve of coffee extract was obtained by Thijssen (1969) and Pardo et al. (2002);
nevertheless, the authors report the dependence of data on the type of coffee and
extraction methods. Additionally, telis-Romero et al. (2000) studied the physical
properties of coffee extract. However, there are no reports of coffee solutions viscosity
and physical properties for temperatures below 0°C. The modelling of viscosity and
other physical properties at temperatures close to the freezing point could contribute to
the design of processes and equipment for freezing technologies such as freeze
Freeze concentration of coffee extract: Study of block and falling-film techniques
21
concentration, freeze drying, and coffee extract handling in the coffee industry. The aim
of the present work was to measure and model the relation of coffee mass fraction and
Brix degrees, freezing curve, rheological behaviour, and density of coffee solutions at
temperatures close to the freezing point.
3.3. Materials and methods
Materials
Colombian freeze-dried coffee (Buencafé, Buencafé Liofilizado de Colombia) provided
by the Colombian Coffee Growers Federation was used to prepare aqueous solutions
at different coffee mass fraction. Soluble coffee granules were dissolved in distilled
water at 30°C to obtain samples at different concentrations.
Relationship between Coffee Mass Fraction and Brix Degrees
Coffee solutions were prepared at different coffee mass fraction: Xs= 0.10, 0.20, 0.30,
0.40, and 0.50. The solutions were stored at 20°C. Brix degrees and index refraction
were measured by refractometry (Atago Pal 100, Japan) at 20°C ±1°C. The total dry
matter was measured by weight-loss after oven drying at 103 °C +/- 1°C for four hours
according to technical standards (Icontec, 2009). Measurements were performed in
quadruplicate.
Freezing Curve
The method of undercooling reported by (Auleda et al, 2011; Ayel et al., 2005; Jie et
al., 2003) was used to determine the freezing point of coffee solutions. Coffee
solutions at Xs= 0.10, 0.20, 0.30, 0.40 and 0.50 were tested. The method consisted of
cooling the sample by immersion in a cooling bath. Four test tubes with 10 mL of the
sample were immersed in a cooling bath (Polystat, Cole Parmer, USA). The cooling
fluid was a mixture of ethylene glycol and water (53% w/w). The bath was temperature
controlled at an interval from -35 °C to 150 °C +/- 0.01 °C. The temperature of the bath
was settled at -13°C +/- 0.01 °C. The test tubes were immersed after the bath reached
the temperature. The test tubes contained inside a PT100-IP65 temperature sensor
(Testo, Germany) located in the centre of the sample. The sensor had a 2 mm
diameter and a precision of ±0.01 °C, and it was connected to a 176 T2 datalogger
(Testo, Germany). The temperature profile was stored in a PC. The freezing points
were determined based on the cooling curves. The highest temperature reached after
the undercooling due to nucleation corresponded to the freezing point. All the
experiments were performed in quadruplicate.
The method was previously standardized by measuring the freezing curve of sucrose
solutions and comparing it with reported data (Auleda et al., 2011; Longinotti y Corti,
2008). The solutions were prepared with sucrose analytic grade (Panreac Química,
Colombia) at solid concentrations of 10-50% w/w and distilled water at 40°C. The
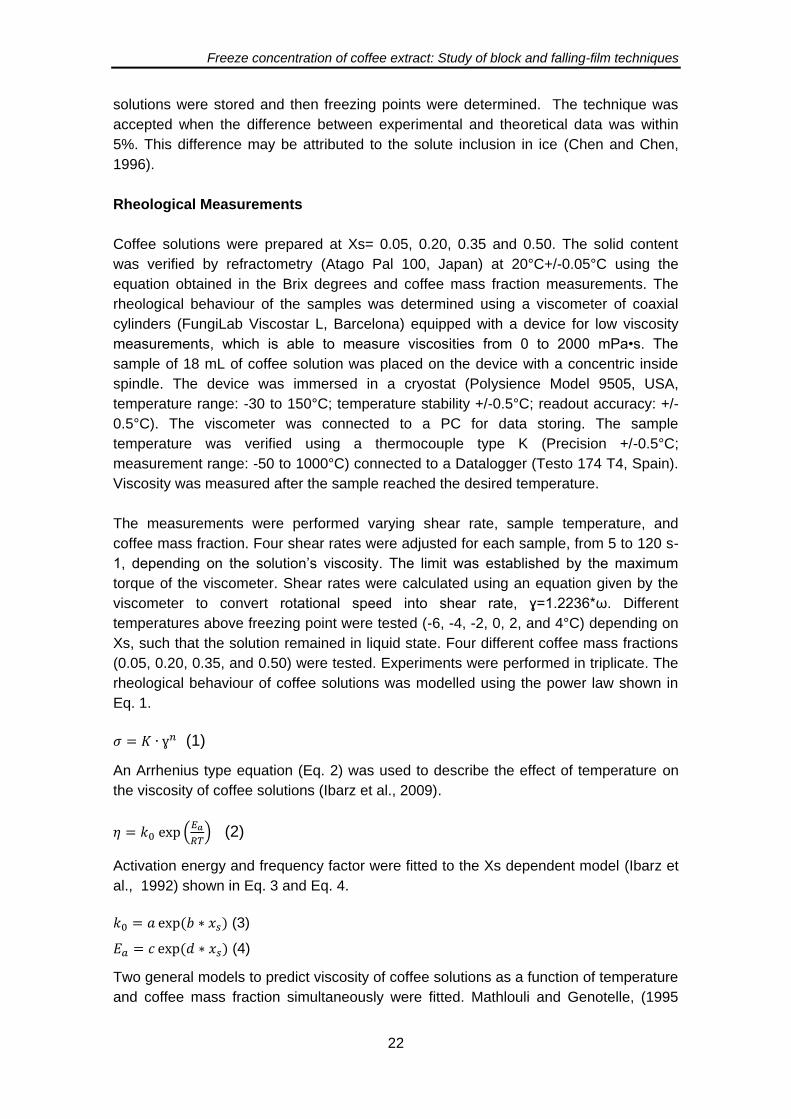
Freeze concentration of coffee extract: Study of block and falling-film techniques
22
solutions were stored and then freezing points were determined. The technique was
accepted when the difference between experimental and theoretical data was within
5%. This difference may be attributed to the solute inclusion in ice (Chen and Chen,
1996).
Rheological Measurements
Coffee solutions were prepared at Xs= 0.05, 0.20, 0.35 and 0.50. The solid content
was verified by refractometry (Atago Pal 100, Japan) at 20°C+/-0.05°C using the
equation obtained in the Brix degrees and coffee mass fraction measurements. The
rheological behaviour of the samples was determined using a viscometer of coaxial
cylinders (FungiLab Viscostar L, Barcelona) equipped with a device for low viscosity
measurements, which is able to measure viscosities from 0 to 2000 mPa•s. The
sample of 18 mL of coffee solution was placed on the device with a concentric inside
spindle. The device was immersed in a cryostat (Polysience Model 9505, USA,
temperature range: -30 to 150°C; temperature stability +/-0.5°C; readout accuracy: +/-
0.5°C). The viscometer was connected to a PC for data storing. The sample
temperature was verified using a thermocouple type K (Precision +/-0.5°C;
measurement range: -50 to 1000°C) connected to a Datalogger (Testo 174 T4, Spain).
Viscosity was measured after the sample reached the desired temperature.
The measurements were performed varying shear rate, sample temperature, and
coffee mass fraction. Four shear rates were adjusted for each sample, from 5 to 120 s-
1, depending on the solution’s viscosity. The limit was established by the maximum
torque of the viscometer. Shear rates were calculated using an equation given by the
viscometer to convert rotational speed into shear rate, ɣ=1.2236*ω. Different
temperatures above freezing point were tested (-6, -4, -2, 0, 2, and 4°C) depending on
Xs, such that the solution remained in liquid state. Four different coffee mass fractions
(0.05, 0.20, 0.35, and 0.50) were tested. Experiments were performed in triplicate. The
rheological behaviour of coffee solutions was modelled using the power law shown in
Eq. 1.
(1)
An Arrhenius type equation (Eq. 2) was used to describe the effect of temperature on
the viscosity of coffee solutions (Ibarz et al., 2009).
(
) (2)
Activation energy and frequency factor were fitted to the Xs dependent model (Ibarz et
al., 1992) shown in Eq. 3 and Eq. 4.
(3)
(4)
Two general models to predict viscosity of coffee solutions as a function of temperature
and coffee mass fraction simultaneously were fitted. Mathlouli and Genotelle, (1995

Freeze concentration of coffee extract: Study of block and falling-film techniques
23
cited by Longinotti and Corti, 2008) proposed a general model for sucrose solutions
shown in Eq. 5.
(
) (5)
Where:
φ=(30-T)/(91+T) (6)
Moreover, Sobolik et al. (2002) proposed a model applied to coffee solutions at room
temperatures and higher, shown in Eq. 7.
(
) (7)
Density
The density of coffee solutions at Xs= 0.10, 0.20, 0.30, 0.40, and 0.50 was determined
by using a pycnometer at temperatures of 0, 5, 10, 15, 20 and 25 °C ± 0.01°C. The
pycnometers with the samples were immersed in a cooling bath at the settled
temperature (Polystat Cole Parmer, USA). One blank sample had a PT100-IP65
temperature sensor (Testo, Germany) immersed to check temperature. After the
sample reached the temperature, the pycnometers were closed and weighed in an
analytical scale (Mettler Toledo, USA). The measures were performed in triplicate.
Statistical Analysis
The average and the standard deviation of all data were calculated by SPSS 20.0
software. The unknown parameters of the models showed in Eq. 1 to 10 were adjusted
from experimental results using a linear regression fitting procedure with SPSS 20.0 for
Eq. 2 to 4 and a non-linear regression procedure for the other intrinsically non-linear
models. The goodness of model fit was based on coefficient of determination (R2),
defined by the ratio between the regression sum of square and the total sum of
squares. For the best fit, the R2 value should be high.
3.4. Results and discussion
Relationship between Coffee Mass Fraction and Brix Degrees
The Brix degrees are a measure of the soluble solid content of sugar solutions. The
relationship between Brix degrees and coffee mass fraction is presented in Table 3.1.
A linear relation was obtained as seen in Eq. 8. The equation allows measuring coffee
mass fraction by refractometry. The equation can be modified to %Solids=0.87•°Brix, in
order to obtain solid percentage. Similar relationships are used in the coffee industry
(Moreno et al., 2013). The refractive index was also measured and its relation with Xs
is presented in Table 3.1. The relationship was fitted in the Eq. 9. The models allowed
calculating coffee mass fraction using a quick technique such as refractometry.
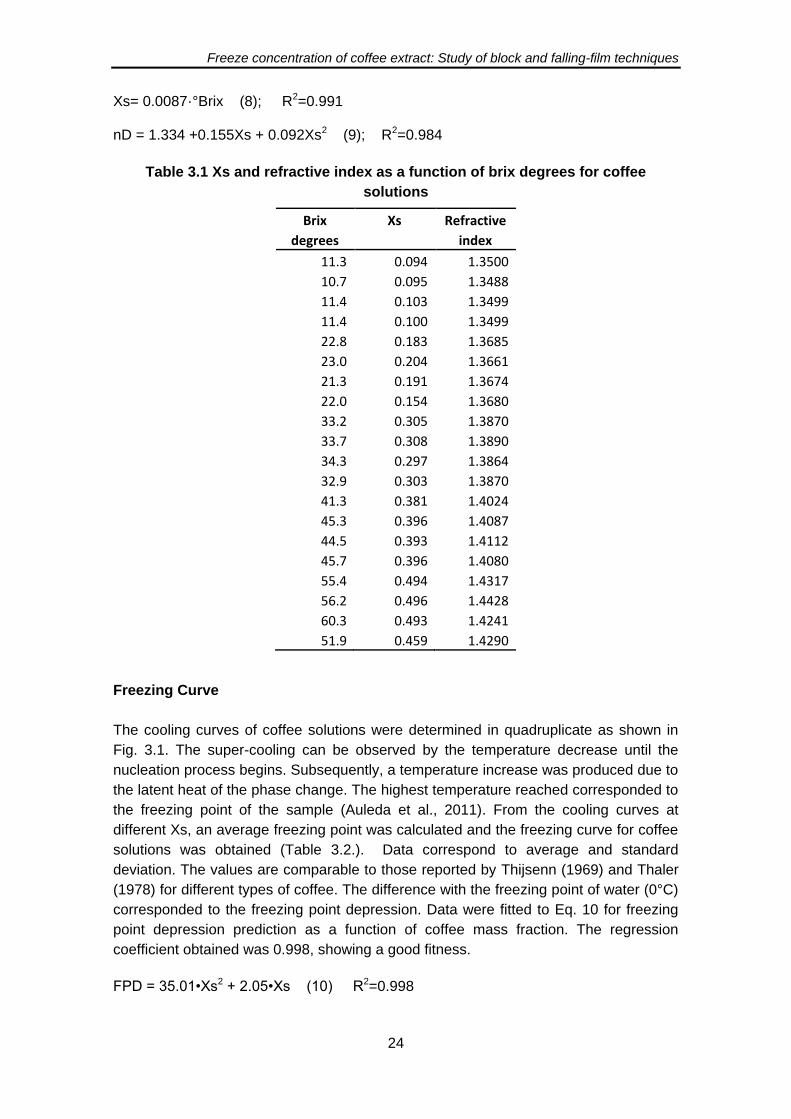
Freeze concentration of coffee extract: Study of block and falling-film techniques
24
Xs= 0.0087·°Brix (8); R2=0.991
nD = 1.334 +0.155Xs + 0.092Xs2 (9); R2=0.984
Table 3.1 Xs and refractive index as a function of brix degrees for coffee
solutions
Brix
degrees
Xs Refractive
index
11.3 0.094 1.3500
10.7 0.095 1.3488
11.4 0.103 1.3499
11.4 0.100 1.3499
22.8 0.183 1.3685
23.0 0.204 1.3661
21.3 0.191 1.3674
22.0 0.154 1.3680
33.2 0.305 1.3870
33.7 0.308 1.3890
34.3 0.297 1.3864
32.9 0.303 1.3870
41.3 0.381 1.4024
45.3 0.396 1.4087
44.5 0.393 1.4112
45.7 0.396 1.4080
55.4 0.494 1.4317
56.2 0.496 1.4428
60.3 0.493 1.4241
51.9 0.459 1.4290
Freezing Curve
The cooling curves of coffee solutions were determined in quadruplicate as shown in
Fig. 3.1. The super-cooling can be observed by the temperature decrease until the
nucleation process begins. Subsequently, a temperature increase was produced due to
the latent heat of the phase change. The highest temperature reached corresponded to
the freezing point of the sample (Auleda et al., 2011). From the cooling curves at
different Xs, an average freezing point was calculated and the freezing curve for coffee
solutions was obtained (Table 3.2.). Data correspond to average and standard
deviation. The values are comparable to those reported by Thijsenn (1969) and Thaler
(1978) for different types of coffee. The difference with the freezing point of water (0°C)
corresponded to the freezing point depression. Data were fitted to Eq. 10 for freezing
point depression prediction as a function of coffee mass fraction. The regression
coefficient obtained was 0.998, showing a good fitness.
FPD = 35.01•Xs2 + 2.05•Xs (10) R2=0.998

Freeze concentration of coffee extract: Study of block and falling-film techniques
25
Figure 3.1 Cooling curves of coffee solutions. Xs=0.40
Table 3.2. Freezing point of coffee solutions as a function of coffee mass
fraction
Xs Freezing point (°C)
0.1 -0.76 ± 0.04
0.2 -1.92 ± 0.08
0.3 -3.45 ± 0.06
0.4 -6.54 ± 0.19
0.5 -9.79 ± 0.24
The freezing curve of coffee is between the freezing curves of glucose and sucrose,
within the typical region of food fluids proposed by Auleda et al. (2011). This can be
attributed to the polysaccharides content of coffee extract, which varies from 20 to 75%
dry basis (Thaler, 1978; Franca et al., 2005; De Maria et al., 2006), depending on
coffee variety, roasting and extracting processes.
Rheological Measurements
Rheological Behaviour
The rheograms of coffee solutions at Xs 5, 20, 35, and 50% and temperatures between
-6 and 4°C are presented in Fig. 3.2, where shear stress (σ) as a function of shear rate
(γ) is plotted. The dots correspond to experimental data and the lines were generated
from parameters of Eq. 1, shown in Table 3.3. For this regression, coefficients of
determination between 0.95 and 1.00 were obtained, suggesting good fitness of the
models. A Newtonian behaviour was obtained with a flow index close to 1. Exponents
of power law were less than 1 for high Xs and low temperatures, showing a slightly
pseudoplastic behaviour. However, this result is not significant according to standard
deviation.
-20
-15
-10
-5
0
5
10
15
20
25
30
0 200 400 600 800
Tem
pe
ratu
re (
°C)
time (s)
Freezing point Super coolin
Nucleation
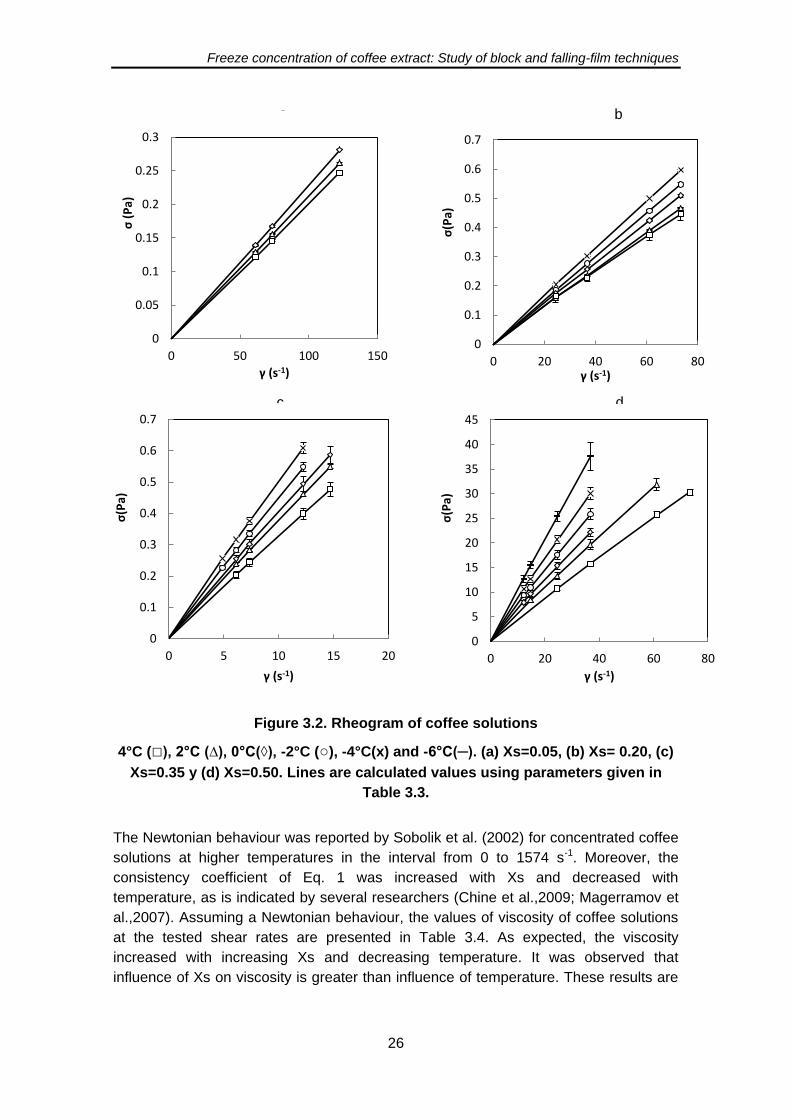
Freeze concentration of coffee extract: Study of block and falling-film techniques
26
Figure 3.2. Rheogram of coffee solutions
4°C (□), 2°C (∆), 0°C(◊), -2°C (○), -4°C(x) and -6°C(─). (a) Xs=0.05, (b) Xs= 0.20, (c)
Xs=0.35 y (d) Xs=0.50. Lines are calculated values using parameters given in
Table 3.3.
The Newtonian behaviour was reported by Sobolik et al. (2002) for concentrated coffee
solutions at higher temperatures in the interval from 0 to 1574 s-1. Moreover, the
consistency coefficient of Eq. 1 was increased with Xs and decreased with
temperature, as is indicated by several researchers (Chine et al.,2009; Magerramov et
al.,2007). Assuming a Newtonian behaviour, the values of viscosity of coffee solutions
at the tested shear rates are presented in Table 3.4. As expected, the viscosity
increased with increasing Xs and decreasing temperature. It was observed that
influence of Xs on viscosity is greater than influence of temperature. These results are
b a
0
0.05
0.1
0.15
0.2
0.25
0.3
0 50 100 150
σ (
Pa)
γ (s-1)
d c
0
0.1
0.2
0.3
0.4
0.5
0.6
0.7
0 5 10 15 20
σ(P
a)
γ (s-1)
0
5
10
15
20
25
30
35
40
45
0 20 40 60 80
σ(P
a)
γ (s-1)
0
0.1
0.2
0.3
0.4
0.5
0.6
0.7
0 20 40 60 80
σ(P
a)
γ (s-1)
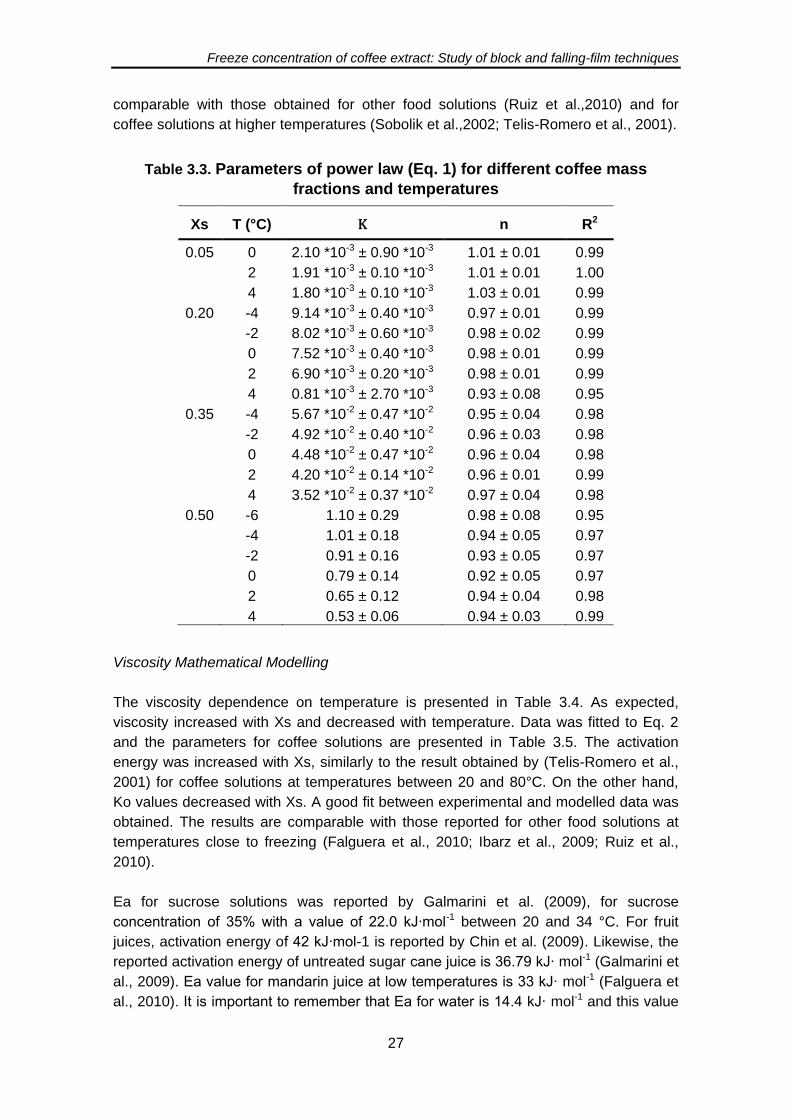
Freeze concentration of coffee extract: Study of block and falling-film techniques
27
comparable with those obtained for other food solutions (Ruiz et al.,2010) and for
coffee solutions at higher temperatures (Sobolik et al.,2002; Telis-Romero et al., 2001).
Table 3.3. Parameters of power law (Eq. 1) for different coffee mass
fractions and temperatures
Xs T (°C) K n R2
0.05 0 2.10 *10-3 ± 0.90 *10-3 1.01 ± 0.01 0.99
2 1.91 *10-3 ± 0.10 *10-3 1.01 ± 0.01 1.00
4 1.80 *10-3 ± 0.10 *10-3 1.03 ± 0.01 0.99
0.20 -4 9.14 *10-3 ± 0.40 *10-3 0.97 ± 0.01 0.99
-2 8.02 *10-3 ± 0.60 *10-3 0.98 ± 0.02 0.99
0 7.52 *10-3 ± 0.40 *10-3 0.98 ± 0.01 0.99
2 6.90 *10-3 ± 0.20 *10-3 0.98 ± 0.01 0.99
4 0.81 *10-3 ± 2.70 *10-3 0.93 ± 0.08 0.95
0.35 -4 5.67 *10-2 ± 0.47 *10-2 0.95 ± 0.04 0.98
-2 4.92 *10-2 ± 0.40 *10-2 0.96 ± 0.03 0.98
0 4.48 *10-2 ± 0.47 *10-2 0.96 ± 0.04 0.98
2 4.20 *10-2 ± 0.14 *10-2 0.96 ± 0.01 0.99
4 3.52 *10-2 ± 0.37 *10-2 0.97 ± 0.04 0.98
0.50 -6 1.10 ± 0.29 0.98 ± 0.08 0.95
-4 1.01 ± 0.18 0.94 ± 0.05 0.97
-2 0.91 ± 0.16 0.93 ± 0.05 0.97
0 0.79 ± 0.14 0.92 ± 0.05 0.97
2 0.65 ± 0.12 0.94 ± 0.04 0.98
4 0.53 ± 0.06 0.94 ± 0.03 0.99
Viscosity Mathematical Modelling
The viscosity dependence on temperature is presented in Table 3.4. As expected,
viscosity increased with Xs and decreased with temperature. Data was fitted to Eq. 2
and the parameters for coffee solutions are presented in Table 3.5. The activation
energy was increased with Xs, similarly to the result obtained by (Telis-Romero et al.,
2001) for coffee solutions at temperatures between 20 and 80°C. On the other hand,
Ko values decreased with Xs. A good fit between experimental and modelled data was
obtained. The results are comparable with those reported for other food solutions at
temperatures close to freezing (Falguera et al., 2010; Ibarz et al., 2009; Ruiz et al.,
2010).
Ea for sucrose solutions was reported by Galmarini et al. (2009), for sucrose
concentration of 35% with a value of 22.0 kJ∙mol-1 between 20 and 34 °C. For fruit
juices, activation energy of 42 kJ∙mol-1 is reported by Chin et al. (2009). Likewise, the
reported activation energy of untreated sugar cane juice is 36.79 kJ∙ mol-1 (Galmarini et
al., 2009). Ea value for mandarin juice at low temperatures is 33 kJ∙ mol-1 (Falguera et
al., 2010). It is important to remember that Ea for water is 14.4 kJ∙ mol-1 and this value
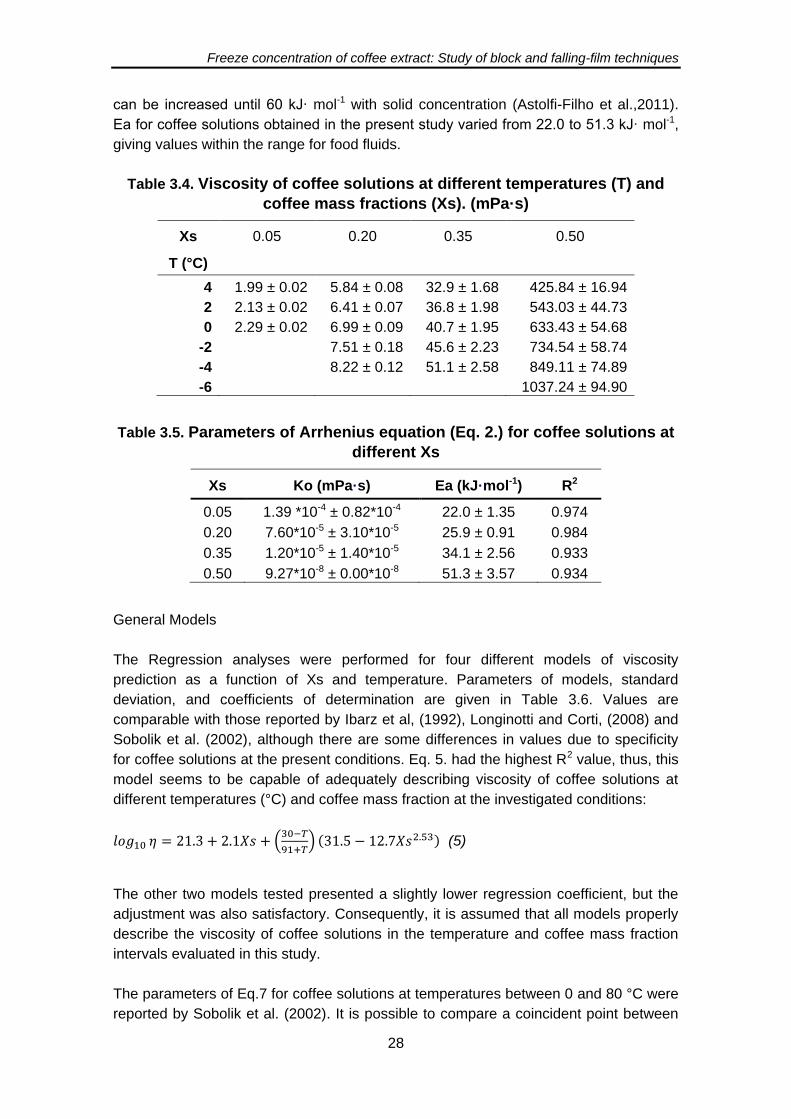
Freeze concentration of coffee extract: Study of block and falling-film techniques
28
can be increased until 60 kJ∙ mol-1 with solid concentration (Astolfi-Filho et al.,2011).
Ea for coffee solutions obtained in the present study varied from 22.0 to 51.3 kJ∙ mol-1,
giving values within the range for food fluids.
Table 3.4. Viscosity of coffee solutions at different temperatures (T) and
coffee mass fractions (Xs). (mPa·s)
Xs 0.05 0.20 0.35 0.50
T (°C)
4 1.99 ± 0.02 5.84 ± 0.08 32.9 ± 1.68 425.84 ± 16.94
2 2.13 ± 0.02 6.41 ± 0.07 36.8 ± 1.98 543.03 ± 44.73
0 2.29 ± 0.02 6.99 ± 0.09 40.7 ± 1.95 633.43 ± 54.68
-2
7.51 ± 0.18 45.6 ± 2.23 734.54 ± 58.74
-4
8.22 ± 0.12 51.1 ± 2.58 849.11 ± 74.89
-6
1037.24 ± 94.90
Table 3.5. Parameters of Arrhenius equation (Eq. 2.) for coffee solutions at
different Xs
Xs Ko (mPa·s) Ea (kJ·mol-1) R2
0.05 1.39 *10-4 ± 0.82*10-4 22.0 ± 1.35 0.974
0.20 7.60*10-5 ± 3.10*10-5 25.9 ± 0.91 0.984
0.35 1.20*10-5 ± 1.40*10-5 34.1 ± 2.56 0.933
0.50 9.27*10-8 ± 0.00*10-8 51.3 ± 3.57 0.934
General Models
The Regression analyses were performed for four different models of viscosity
prediction as a function of Xs and temperature. Parameters of models, standard
deviation, and coefficients of determination are given in Table 3.6. Values are
comparable with those reported by Ibarz et al, (1992), Longinotti and Corti, (2008) and
Sobolik et al. (2002), although there are some differences in values due to specificity
for coffee solutions at the present conditions. Eq. 5. had the highest R2 value, thus, this
model seems to be capable of adequately describing viscosity of coffee solutions at
different temperatures (°C) and coffee mass fraction at the investigated conditions:
(
) (5)
The other two models tested presented a slightly lower regression coefficient, but the
adjustment was also satisfactory. Consequently, it is assumed that all models properly
describe the viscosity of coffee solutions in the temperature and coffee mass fraction
intervals evaluated in this study.
The parameters of Eq.7 for coffee solutions at temperatures between 0 and 80 °C were
reported by Sobolik et al. (2002). It is possible to compare a coincident point between
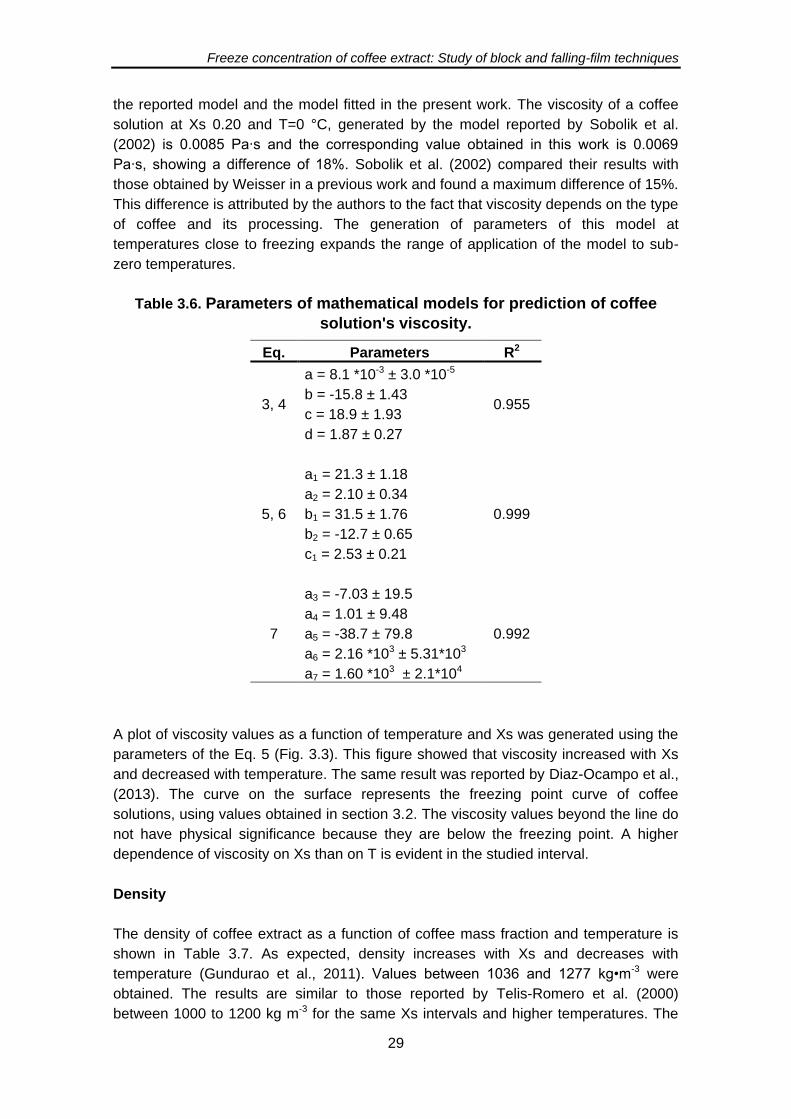
Freeze concentration of coffee extract: Study of block and falling-film techniques
29
the reported model and the model fitted in the present work. The viscosity of a coffee
solution at Xs 0.20 and T=0 °C, generated by the model reported by Sobolik et al.
(2002) is 0.0085 Pa∙s and the corresponding value obtained in this work is 0.0069
Pa∙s, showing a difference of 18%. Sobolik et al. (2002) compared their results with
those obtained by Weisser in a previous work and found a maximum difference of 15%.
This difference is attributed by the authors to the fact that viscosity depends on the type
of coffee and its processing. The generation of parameters of this model at
temperatures close to freezing expands the range of application of the model to sub-
zero temperatures.
Table 3.6. Parameters of mathematical models for prediction of coffee
solution's viscosity.
Eq. Parameters R2
3, 4
a = 8.1 *10-3 ± 3.0 *10-5
0.955 b = -15.8 ± 1.43
c = 18.9 ± 1.93
d = 1.87 ± 0.27
5, 6
a1 = 21.3 ± 1.18
0.999
a2 = 2.10 ± 0.34
b1 = 31.5 ± 1.76
b2 = -12.7 ± 0.65
c1 = 2.53 ± 0.21
7
a3 = -7.03 ± 19.5
0.992
a4 = 1.01 ± 9.48
a5 = -38.7 ± 79.8
a6 = 2.16 *103 ± 5.31*103
a7 = 1.60 *103 ± 2.1*104
A plot of viscosity values as a function of temperature and Xs was generated using the
parameters of the Eq. 5 (Fig. 3.3). This figure showed that viscosity increased with Xs
and decreased with temperature. The same result was reported by Diaz-Ocampo et al.,
(2013). The curve on the surface represents the freezing point curve of coffee
solutions, using values obtained in section 3.2. The viscosity values beyond the line do
not have physical significance because they are below the freezing point. A higher
dependence of viscosity on Xs than on T is evident in the studied interval.
Density
The density of coffee extract as a function of coffee mass fraction and temperature is
shown in Table 3.7. As expected, density increases with Xs and decreases with
temperature (Gundurao et al., 2011). Values between 1036 and 1277 kg•m-3 were
obtained. The results are similar to those reported by Telis-Romero et al. (2000)
between 1000 to 1200 kg m-3 for the same Xs intervals and higher temperatures. The
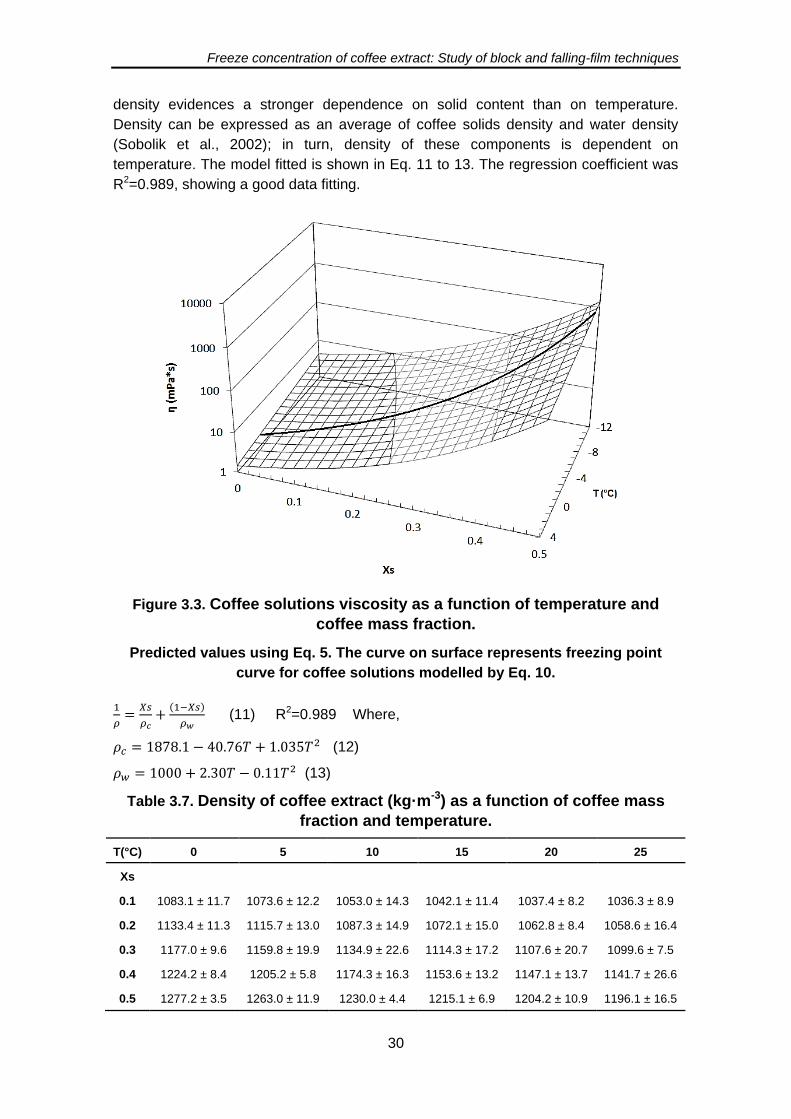
Freeze concentration of coffee extract: Study of block and falling-film techniques
30
density evidences a stronger dependence on solid content than on temperature.
Density can be expressed as an average of coffee solids density and water density
(Sobolik et al., 2002); in turn, density of these components is dependent on
temperature. The model fitted is shown in Eq. 11 to 13. The regression coefficient was
R2=0.989, showing a good data fitting.
Figure 3.3. Coffee solutions viscosity as a function of temperature and
coffee mass fraction.
Predicted values using Eq. 5. The curve on surface represents freezing point
curve for coffee solutions modelled by Eq. 10.
(11) R2=0.989 Where,
(12)
(13)
Table 3.7. Density of coffee extract (kg·m-3) as a function of coffee mass
fraction and temperature.
T(°C) 0 5 10 15 20 25
Xs
0.1 1083.1 ± 11.7 1073.6 ± 12.2 1053.0 ± 14.3 1042.1 ± 11.4 1037.4 ± 8.2 1036.3 ± 8.9
0.2 1133.4 ± 11.3 1115.7 ± 13.0 1087.3 ± 14.9 1072.1 ± 15.0 1062.8 ± 8.4 1058.6 ± 16.4
0.3 1177.0 ± 9.6 1159.8 ± 19.9 1134.9 ± 22.6 1114.3 ± 17.2 1107.6 ± 20.7 1099.6 ± 7.5
0.4 1224.2 ± 8.4 1205.2 ± 5.8 1174.3 ± 16.3 1153.6 ± 13.2 1147.1 ± 13.7 1141.7 ± 26.6
0.5 1277.2 ± 3.5 1263.0 ± 11.9 1230.0 ± 4.4 1215.1 ± 6.9 1204.2 ± 10.9 1196.1 ± 16.5
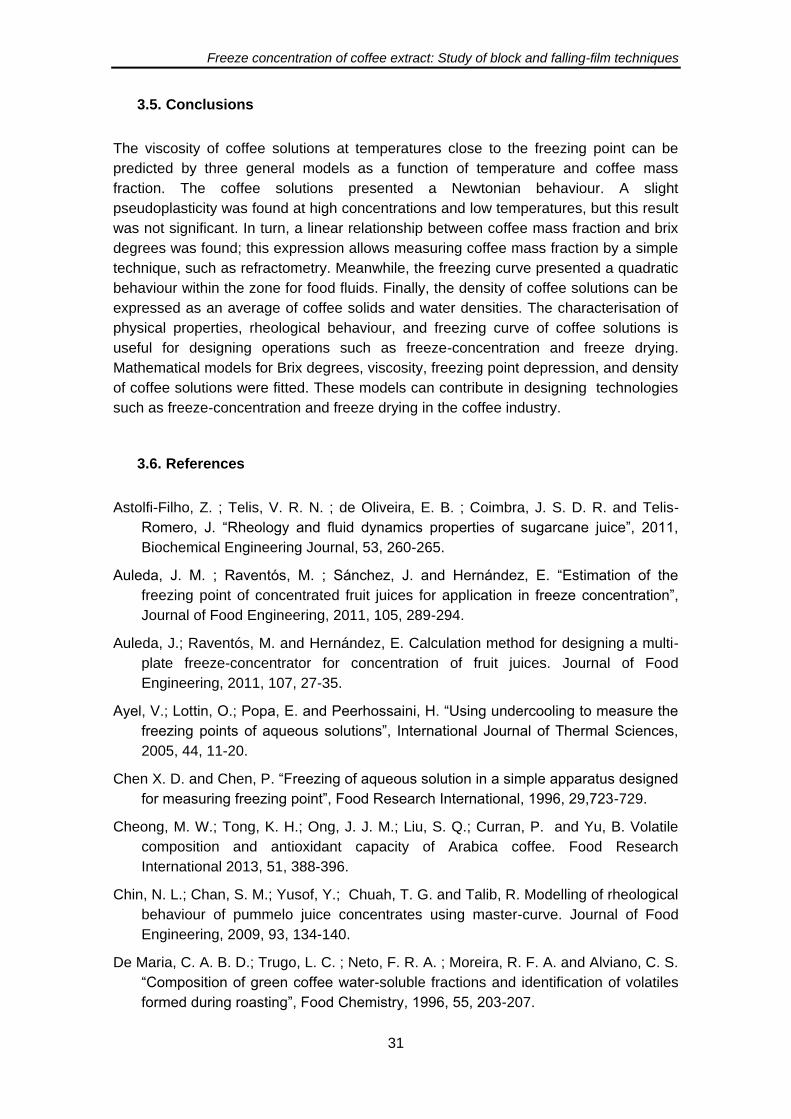
Freeze concentration of coffee extract: Study of block and falling-film techniques
31
3.5. Conclusions
The viscosity of coffee solutions at temperatures close to the freezing point can be
predicted by three general models as a function of temperature and coffee mass
fraction. The coffee solutions presented a Newtonian behaviour. A slight
pseudoplasticity was found at high concentrations and low temperatures, but this result
was not significant. In turn, a linear relationship between coffee mass fraction and brix
degrees was found; this expression allows measuring coffee mass fraction by a simple
technique, such as refractometry. Meanwhile, the freezing curve presented a quadratic
behaviour within the zone for food fluids. Finally, the density of coffee solutions can be
expressed as an average of coffee solids and water densities. The characterisation of
physical properties, rheological behaviour, and freezing curve of coffee solutions is
useful for designing operations such as freeze-concentration and freeze drying.
Mathematical models for Brix degrees, viscosity, freezing point depression, and density
of coffee solutions were fitted. These models can contribute in designing technologies
such as freeze-concentration and freeze drying in the coffee industry.
3.6. References
Astolfi-Filho, Z. ; Telis, V. R. N. ; de Oliveira, E. B. ; Coimbra, J. S. D. R. and Telis-
Romero, J. “Rheology and fluid dynamics properties of sugarcane juice”, 2011,
Biochemical Engineering Journal, 53, 260-265.
Auleda, J. M. ; Raventós, M. ; Sánchez, J. and Hernández, E. “Estimation of the
freezing point of concentrated fruit juices for application in freeze concentration”,
Journal of Food Engineering, 2011, 105, 289-294.
Auleda, J.; Raventós, M. and Hernández, E. Calculation method for designing a multi-
plate freeze-concentrator for concentration of fruit juices. Journal of Food
Engineering, 2011, 107, 27-35.
Ayel, V.; Lottin, O.; Popa, E. and Peerhossaini, H. “Using undercooling to measure the
freezing points of aqueous solutions”, International Journal of Thermal Sciences,
2005, 44, 11-20.
Chen X. D. and Chen, P. “Freezing of aqueous solution in a simple apparatus designed
for measuring freezing point”, Food Research International, 1996, 29,723-729.
Cheong, M. W.; Tong, K. H.; Ong, J. J. M.; Liu, S. Q.; Curran, P. and Yu, B. Volatile
composition and antioxidant capacity of Arabica coffee. Food Research
International 2013, 51, 388-396.
Chin, N. L.; Chan, S. M.; Yusof, Y.; Chuah, T. G. and Talib, R. Modelling of rheological
behaviour of pummelo juice concentrates using master-curve. Journal of Food
Engineering, 2009, 93, 134-140.
De Maria, C. A. B. D.; Trugo, L. C. ; Neto, F. R. A. ; Moreira, R. F. A. and Alviano, C. S.
“Composition of green coffee water-soluble fractions and identification of volatiles
formed during roasting”, Food Chemistry, 1996, 55, 203-207.
Freeze concentration of coffee extract: Study of block and falling-film techniques
32
Díaz-Ocampo, R.; Sánchez, R. and Franco, J.M. “Rheology of commercial and model
borojo jam formulations”, International Journal of Food Properties, 2013, In Press,
DOI:10.1080/10942912.2012.665406.
Esquivel P. and Jiménez, V. M. Functional properties of coffee and coffee by-products.
Food Research International, 2012, 46, 488-495.
Falguera, V. and Ibarz, A. “A new model to describe flow behaviour of concentrated
orange juice,” Food Biophisycs, 2010, 5, 114-119.
Falguera, V.; Vélez-Ruiz, J. F.; Alins, V. and Ibarz, A. “Rheological behaviour of
concentrated mandarin juice at low temperatures,” International Journal of Food
Science & Technology, 2010, 10, 2194-2200.
Franca, A. S. ; Mendonça, J. C. F. and Oliveira, S. D. “Composition of green and
roasted coffees of different cup qualities”, LWT - Food Science and Technology,
2005, 38, 709-715.
Gabriele, D.; Migliori, M.; Baldino, N.; Di Sanzo, R.; de Cindio B; and Vuozzo, D.
“Rheological Characterisation of Dairy Emulsions For Cold Foam Applications”
International Journal of Food Properties, 2011,14:4, 786-798.
Galmarini, M. V.; Baeza, R. ; Sanchez, V. ; Zamora, M. C. and Chirife, J. “Comparison
of the viscosity of trehalose and sucrose solutions at various temperatures: Effect
of guar gum addition”, LWT - Food Science and Technology, 2011, 44, 186-190..
Gundurao, A.; Ramaswamy, H. and Ahmed, J. “Effect of Soluble Solids Concentration
and Temperature on Thermo-Physical and Rheological Properties of Mango
Puree”, International Journal of Food Properties. , 2011, 14:5, 1018-1036
Ibarz, A.; Gonzalez, C.; Esplugas, S. and Vicente, M. Rheology of clarified fruit juices.
I: Peach juices. Journal of Food Engineering, 1992, 15, 49-61.
Ibarz, R.; Falguera, V.; Garvín, A.; Garza, S.; Pagán, J. and Ibarz, A. “Flow Behavior of
clarified orange juice at low temperatures,” Journal of Texture Studies, 2009, 40,
445-456.
Icontec Standrad “Determination of extraction yield and soluble solids in coffee
beverage”, NTC 4602-1, Colombia, 2009.
Jie, W.; Lite, L. and Yang, D. “The correlation between freezing point and soluble solids
of fruits”, Journal of Food Engineering, 2003, 60,481-484.
Longinotti M. P. and Corti, H. R. Viscosity of concentrated sucrose and trehalose
aqueous solutions including the supercooled regime. Journal of Physical and
Chemical Reference Data, 2008, 37,1503-1515.
MacLeod, C. S.; McKittrick, J. A.; Hindmarsh, J. P.; Johns, M. L. and Wilson, D. I.
Fundamentals of spray freezing of instant coffee. Journal of Food Engineering
2006, 74, 451-461.
Magerramov, M. A.; Abdulagatov, A. L.; Azizov, N. D. and Abdulagatov, I. M. “Effect of
temperature, concentration, and pressure on the viscosity of pomegranate and
pear juice concentrates”, Journal of Food Engineering, 2007, 80, 476-489.
Freeze concentration of coffee extract: Study of block and falling-film techniques
33
Miyawaki, O.; Liu, L.; Shirai, Y. ; Sakashita, S. and Kagitani, K. Tubular ice system for
scale-up of progressive freeze-concentration. Journal of Food Engineering 2005,
69, 107-113.
Moreno, F. L.; Robles, C. M.; Sarmiento, Z.; Ruiz, Y. and Pardo, J. M. “Effect of
separation and thawing mode on block freeze-concentration of coffee brews”,
Food and Bioproducts Processing, 2013, 91 (4), 396-402.
Pardo, J. M.; Suess, F. and Niranjan, K. “An investigation into the relationship between
freezing rate and mean ice crystal size of coffee extracts”, Trans IChemE, 2002,
80, 176-182.
Rahman, M. S. State diagram of foods: Its potential use in food processing and product
stability. Trends in Food Science & Technology 2006, 17, 129-141.
Ruiz, Y.; Sánchez, J.; Hernández, E.; Auleda, J.M. and Raventós, M. “Viscosidad de
zumos comerciales de melocotón, manzana y pera a temperaturas cercanas a la
congelación”, Afinidad, 2010, 66, 114-118.
Sánchez, J.; Ruiz, Y.; Auleda, J. M.; Hernandez, E. and Raventos M. Review. Freeze
Concentration in the Fruit Juices Industry. Food Science and Technology
International 2009, 15, 303-315.
Saravacos G. and Maroulis, Z. Food Process Engineering Operations, CRC Press,
Boca Raton, USA, 2011, p. 94.
Sobolík, V.; Zitny, R.; Tovcigrecko, V.; Delgado, M. and Allaf, K. “Viscosity and
electrical conductivity of concentrated solutions of soluble coffee”, Journal of Food
Engineering, 2002, 51, 93-98.
Tavares, D.; Alcantara, M.; Tadini, C. and Telis-Romero, J. “Rheological properties of
frozen concentrated orange juice (FCOJ) as a function of concentration and
subzero temperatures” International Journal of Food Properties, 2007, 10,829-839.
Telis, V. R. N.; Telis-Romero, V; Mazzotti, H. B. and Gabas, L. “Viscosity of Aqueous
Carbohydrate Solutions at Different Temperatures and Concentrations,”
International Journal of Food Properties, 2007, 10, 185-195.
Telis-Romero, J.; Ferreira, R.; Gabas, A. and Niccoletti, V. “Rheological properties and
fluid dynamics of coffee extract”, Journal of Food Process Engineering, 2001, 24,
217-230.
Telis-Romero, J.; Gabas, A. L.; Polizelli, M. A. and Telis, V. R. N. “Temperature and
water content influence on thermophysical properties of coffee extract”,
International Journal of Food Properties, 2000, 3:3, 375-384.
Thaler, H. “The chemistry of coffee extraction in relation to polysaccharides”, Food
Chemistry, 1978, 4,13-22.
Thijssen, H. A. C. “Freeze concentration of food liquids”, Food Manufacture, 1969, 44,
49-53.
Freeze concentration of coffee extract: Study of block and falling-film techniques
34
4. BLOCK FREEZE-CONCENTRATION OF COFFEE EXTRACT: EFFECT OF
FREEZING AND THAWING STAGES ON SOLUTE RECOVERY AND
BIOACTIVE COMPOUNDS
4.1. Abstract
Coffee extract was freeze-concentrated using the total block technique. The effects of
four parameters were evaluated: the initial coffee mass fraction (5 and 15% w/w), the
cooling temperature (-10 and -20 °C), the heating temperature (20 and 40 °C) and the
freezing direction (parallel and counter-flow to the thawing direction). The solid
concentration was measured during the thawing stage to quantify the solute recovery
and the concentration index for one stage of freeze concentration. The coffee mass
fraction, the freezing direction and the cooling temperature significantly influenced the
solute recovery. A concentration index between 1 and 2.3 was obtained in one cycle.
The effect of block freeze concentration on the bioactive compound concentration and
the antioxidant activity was measured. The coffee bioactive compounds were
distributed in proportion to the total solid content in the ice and liquid. Therefore, block
freeze concentration is an effective technique to preserve functional properties of
coffee extracts.
Keywords: Cryoconcentration; solute yield; coffee; chlorogenic acids; antioxidant
activity
Nomenclature
CI Concentration index
CIcum Cumulative concentration index
CFCL Concentration of bioactive compounds in the freeze-concentrated liquid
CRI Concentration of bioactive compounds in the residual ice
f Thawing fraction
FD Freezing direction
IL Ice loss percentage
m s 0 Initial solute mass
m s liq Solute mass in the liquid fraction
m0 Initial mass
mliq Collected liquid mass
TC Cooling temperature
TH Heating temperature
Xs 0 Coffee mass fraction in the initial solution
XS Coffee mass fraction
Xs liq Coffee mass fraction in the freeze-concentrated liquid fraction
Y Solute yield
Freeze concentration of coffee extract: Study of block and falling-film techniques
35
4.2. Introduction
Coffee is the most traded food in the world, and its production has great economic and
social importance worldwide (Esquivel & Jiménez, 2012; Vignoli et al., 2011). For the
consumer, the value of coffee is provided by its sensory and functional properties; for
this reason, technologies that promote quality preservation are highly valued in coffee
processing. In the production of freeze-dried coffee, freeze concentration (FC)
technology is used to remove water from coffee extracts to increase the solid content
and reduce the time and cost of the freeze-drying process. At the same time, the
sensory properties of the product are preserved using low temperatures (Boss et al.,
2004; Joët et al., 2010; Sánchez et al., 2009).
Water removal in FC is achieved by cooling the solution until the ice crystals form and
separate (Miyawaki et al., 2005). Three techniques are used according to the ice
crystal growth: suspension FC, film FC (progressive or falling film FC) and block FC
(total or partial) (Aider & de Halleux, 2009; Sánchez et al., 2009). Suspension FC is a
unique technique implemented at the industrial level. Different techniques, such as
falling film FC, (Chen et al., 1998; Sánchez et al., 2011), progressive FC (Miyawaki et
al., 2005) and block FC (Aider & Ounis, 2012; Nakagawa et al., 2010a), are being
developed to reduce operational costs.
In the block FC method, also known as freeze–thaw concentration, the solution to be
concentrated is completely frozen and then partially thawed to recover a fraction of
liquid with a higher concentration (Aider & de Halleux, 2009; Nakagawa et al., 2010b).
Block FC consists of three stages: freezing, thawing and separation of the
concentrated liquid fraction (Moreno et al., 2013). These stages define the separation
efficiency (Nakagawa et al., 2009). Additionally, the process can be repeated in
successive cycles to increase the concentration index (Aider & Ounis, 2012).
The technical viability of the block FC method has been proposed recently by several
researchers (Gao et al., 2009; Nakagawa et al., 2010a; Aider & Ounis, 2012;
Boaventura et al., 2012; Miyawaki et al., 2012; Petzold et al., 2013). During the
freezing stage, heat and mass transfer phenomena can modify the solute occlusion,
which should be as low as possible. Chen et al. (2001) reported that the solute elution
in the freezing front in FC depends on the molecular size of the compounds. Certain
authors have reported that the solute separation is controlled by the thawing stage
(Nakagawa et al., 2010b). For coffee solutions, Moreno et al. (2013) studied the use of
aids in the separation stage. These authors reported the influence of the FC protocol
and solution type on solute recovery and the concentration index; for this reason, there
is no agreement on the significance of the process variables. The effects of the process
variables of block FC on the separation efficiency of coffee extracts have not been
reported.
Coffee can be considered to be a functional beverage due to its radical scavenging
capabilities (Cheong et al., 2013; Esquivel & Jiménez, 2012). Several studies have
reported the health benefits of coffee consumption related to the components with
antioxidant activity, such as the group of chlorogenic acids and caffeine. Chlorogenic

Freeze concentration of coffee extract: Study of block and falling-film techniques
36
acid (3-caffeoylquinic acid), cryptochlorogenic acid (4-caffeoylquinic acid),
neoclorogenic acid (5-caffeoylquinic acid) and caffeine are the major bioactive
compounds present in coffee (Ferruzzi, 2010; Fujioka & Shibamoto, 2008; Sopelana et
al., 2013; Vignoli et al., 2011). The block FC method has been shown to retain
nutritional and functional properties of the product using low processing temperatures
(Belén et al., 2013; Boaventura et al., 2012); however, this effect has not been tested
for coffee extracts.
The aim of the present study was to evaluate the effect of the initial coffee mass
fraction, the cooling temperature, the heating temperature and the freezing direction on
the solute yield and concentration index of block freeze-concentrated coffee extracts.
Additionally, the impact of the technique on bioactive compound concentration and the
antioxidant activity of the coffee extract was tested.
4.3. Materials and Methods
4.3.1. Materials
Coffee solutions were prepared from freeze-dried soluble coffee supplied by the
company Buencafé Liofilizado de Colombia (Colombian Coffee Growers Federation,
Colombia) for the FC tests. The coffee was added to distilled water at 35 °C and mixed
for 20 min. The samples were stored at 4 °C for 12 h. The solid concentration is
expressed as the coffee mass fraction (XS), which is defined as the mass of coffee
solids per unit of coffee solution mass. The relationship between Brix degrees and XS is
represented by the equation XS=0.0087 °Brix (R2=0.991). This expression was
obtained by preparing coffee solutions at 10, 20, 30, 40 and 50 °Brix and by measuring
coffee mass fraction using the weight loss technique in the oven at 103 °C for four
hours according to technical standard NTC4602 (Icontec, 2009). The measurements
were performed in triplicate. The coffee mass fraction of the solutions was ascertained
immediately before the FC tests by refractometry (Atago Pal 100, Japan). A liquid
coffee extract was used for the measurement of bioactive compounds. This extract
belonged to the same batch of soluble coffee and was also provided by Buencafé
Liofilizado de Colombia.
4.3.2. Methods
Freeze concentration protocol
The effects of the initial coffee mass fraction (XS), cooling temperature (TC), heating
temperature (TH) and the freezing direction (FD) were studied. A full factorial design
with four factors and two levels was used for a total number of 16 tests (Table 4.1). The
coffee solutions were subjected to one cycle of freezing, thawing and separation to
study the effect of process variables on solute yield after one cycle of FC.
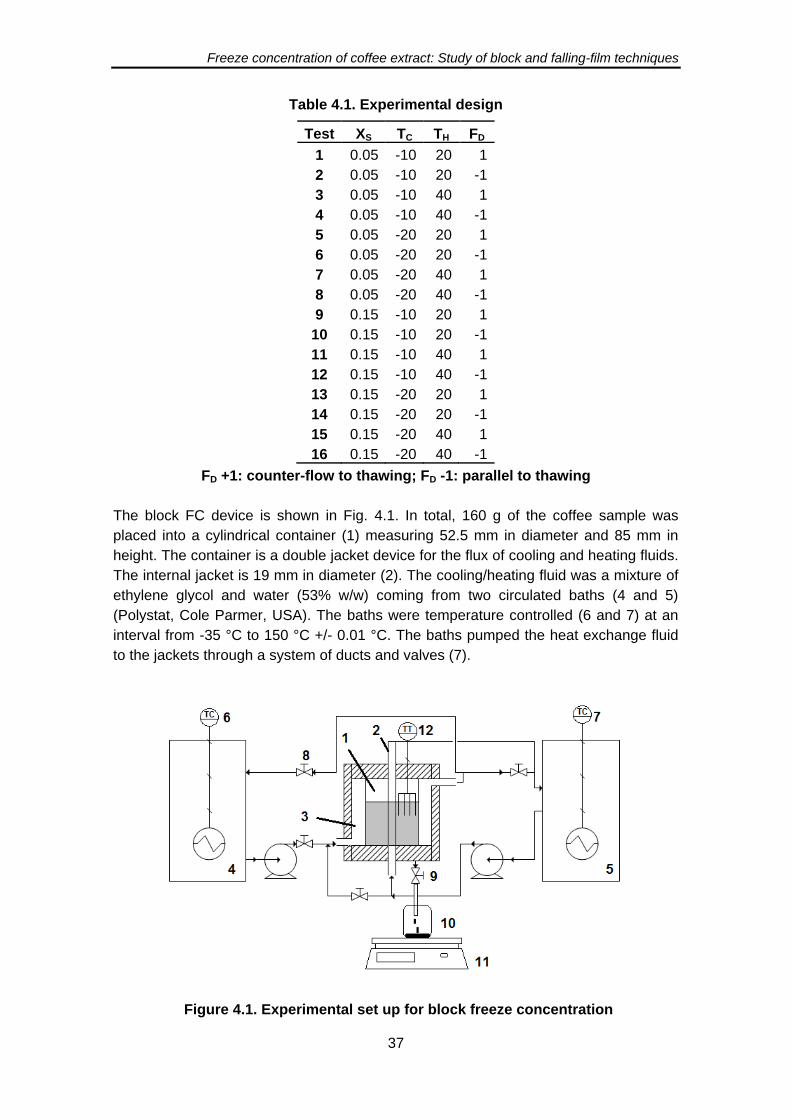
Freeze concentration of coffee extract: Study of block and falling-film techniques
37
Table 4.1. Experimental design
Test XS TC TH FD
1 0.05 -10 20 1
2 0.05 -10 20 -1
3 0.05 -10 40 1
4 0.05 -10 40 -1
5 0.05 -20 20 1
6 0.05 -20 20 -1
7 0.05 -20 40 1
8 0.05 -20 40 -1
9 0.15 -10 20 1
10 0.15 -10 20 -1
11 0.15 -10 40 1
12 0.15 -10 40 -1
13 0.15 -20 20 1
14 0.15 -20 20 -1
15 0.15 -20 40 1
16 0.15 -20 40 -1
FD +1: counter-flow to thawing; FD -1: parallel to thawing
The block FC device is shown in Fig. 4.1. In total, 160 g of the coffee sample was
placed into a cylindrical container (1) measuring 52.5 mm in diameter and 85 mm in
height. The container is a double jacket device for the flux of cooling and heating fluids.
The internal jacket is 19 mm in diameter (2). The cooling/heating fluid was a mixture of
ethylene glycol and water (53% w/w) coming from two circulated baths (4 and 5)
(Polystat, Cole Parmer, USA). The baths were temperature controlled (6 and 7) at an
interval from -35 °C to 150 °C +/- 0.01 °C. The baths pumped the heat exchange fluid
to the jackets through a system of ducts and valves (7).
Figure 4.1. Experimental set up for block freeze concentration
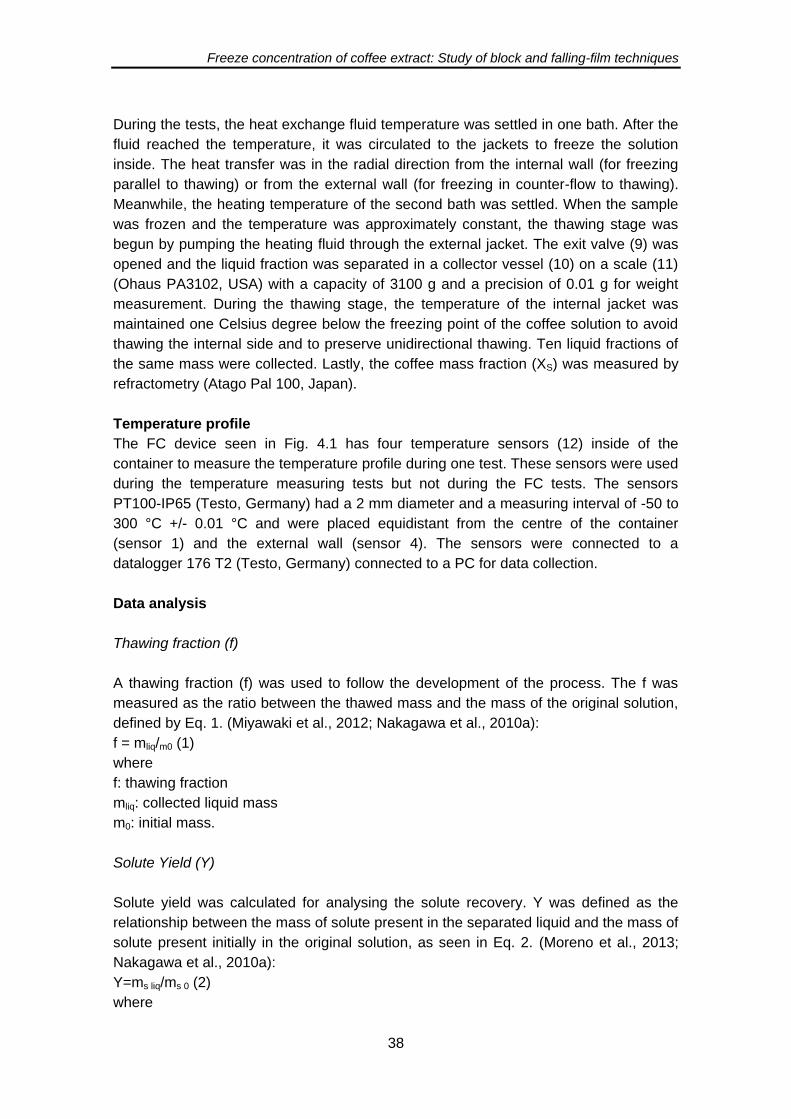
Freeze concentration of coffee extract: Study of block and falling-film techniques
38
During the tests, the heat exchange fluid temperature was settled in one bath. After the
fluid reached the temperature, it was circulated to the jackets to freeze the solution
inside. The heat transfer was in the radial direction from the internal wall (for freezing
parallel to thawing) or from the external wall (for freezing in counter-flow to thawing).
Meanwhile, the heating temperature of the second bath was settled. When the sample
was frozen and the temperature was approximately constant, the thawing stage was
begun by pumping the heating fluid through the external jacket. The exit valve (9) was
opened and the liquid fraction was separated in a collector vessel (10) on a scale (11)
(Ohaus PA3102, USA) with a capacity of 3100 g and a precision of 0.01 g for weight
measurement. During the thawing stage, the temperature of the internal jacket was
maintained one Celsius degree below the freezing point of the coffee solution to avoid
thawing the internal side and to preserve unidirectional thawing. Ten liquid fractions of
the same mass were collected. Lastly, the coffee mass fraction (XS) was measured by
refractometry (Atago Pal 100, Japan).
Temperature profile
The FC device seen in Fig. 4.1 has four temperature sensors (12) inside of the
container to measure the temperature profile during one test. These sensors were used
during the temperature measuring tests but not during the FC tests. The sensors
PT100-IP65 (Testo, Germany) had a 2 mm diameter and a measuring interval of -50 to
300 °C +/- 0.01 °C and were placed equidistant from the centre of the container
(sensor 1) and the external wall (sensor 4). The sensors were connected to a
datalogger 176 T2 (Testo, Germany) connected to a PC for data collection.
Data analysis
Thawing fraction (f)
A thawing fraction (f) was used to follow the development of the process. The f was
measured as the ratio between the thawed mass and the mass of the original solution,
defined by Eq. 1. (Miyawaki et al., 2012; Nakagawa et al., 2010a):
f = mliq/m0 (1)
where
f: thawing fraction
mliq: collected liquid mass
m0: initial mass.
Solute Yield (Y)
Solute yield was calculated for analysing the solute recovery. Y was defined as the
relationship between the mass of solute present in the separated liquid and the mass of
solute present initially in the original solution, as seen in Eq. 2. (Moreno et al., 2013;
Nakagawa et al., 2010a):
Y=ms liq/ms 0 (2)
where
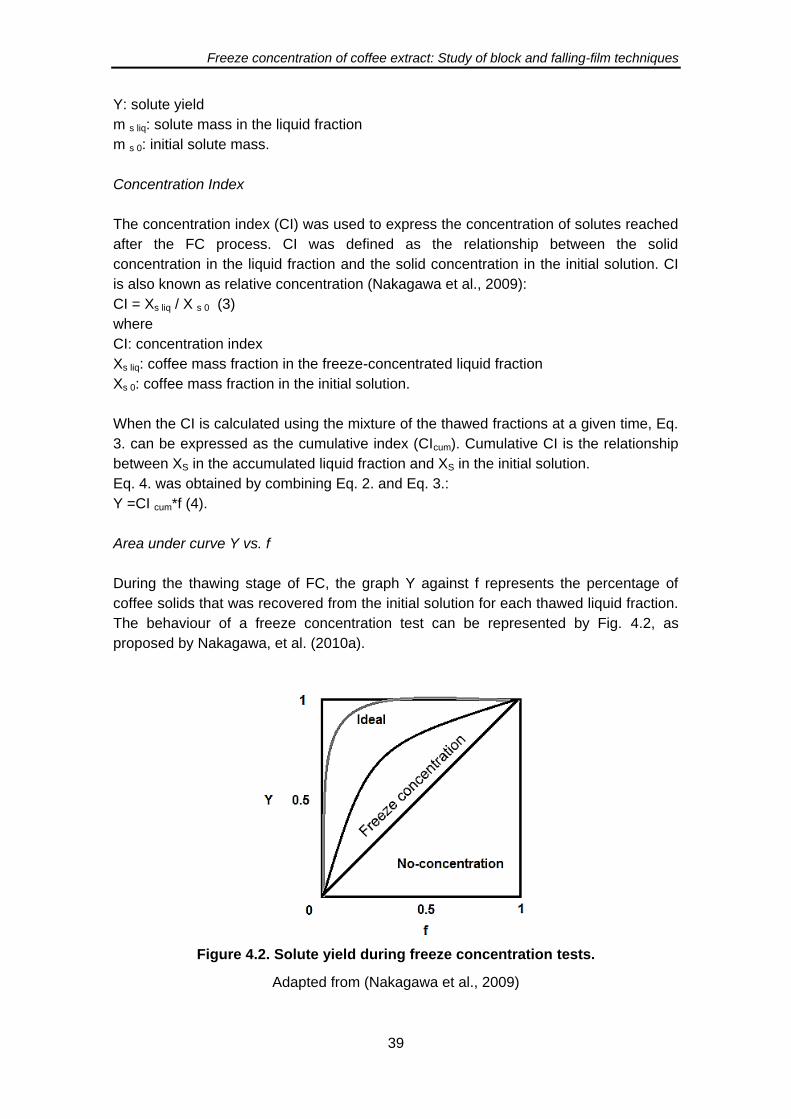
Freeze concentration of coffee extract: Study of block and falling-film techniques
39
Y: solute yield
m s liq: solute mass in the liquid fraction
m s 0: initial solute mass.
Concentration Index
The concentration index (CI) was used to express the concentration of solutes reached
after the FC process. CI was defined as the relationship between the solid
concentration in the liquid fraction and the solid concentration in the initial solution. CI
is also known as relative concentration (Nakagawa et al., 2009):
CI = Xs liq / X s 0 (3)
where
CI: concentration index
Xs liq: coffee mass fraction in the freeze-concentrated liquid fraction
Xs 0: coffee mass fraction in the initial solution.
When the CI is calculated using the mixture of the thawed fractions at a given time, Eq.
3. can be expressed as the cumulative index (CIcum). Cumulative CI is the relationship
between XS in the accumulated liquid fraction and XS in the initial solution.
Eq. 4. was obtained by combining Eq. 2. and Eq. 3.:
Y =CI cum*f (4).
Area under curve Y vs. f
During the thawing stage of FC, the graph Y against f represents the percentage of
coffee solids that was recovered from the initial solution for each thawed liquid fraction.
The behaviour of a freeze concentration test can be represented by Fig. 4.2, as
proposed by Nakagawa, et al. (2010a).
Figure 4.2. Solute yield during freeze concentration tests.
Adapted from (Nakagawa et al., 2009)
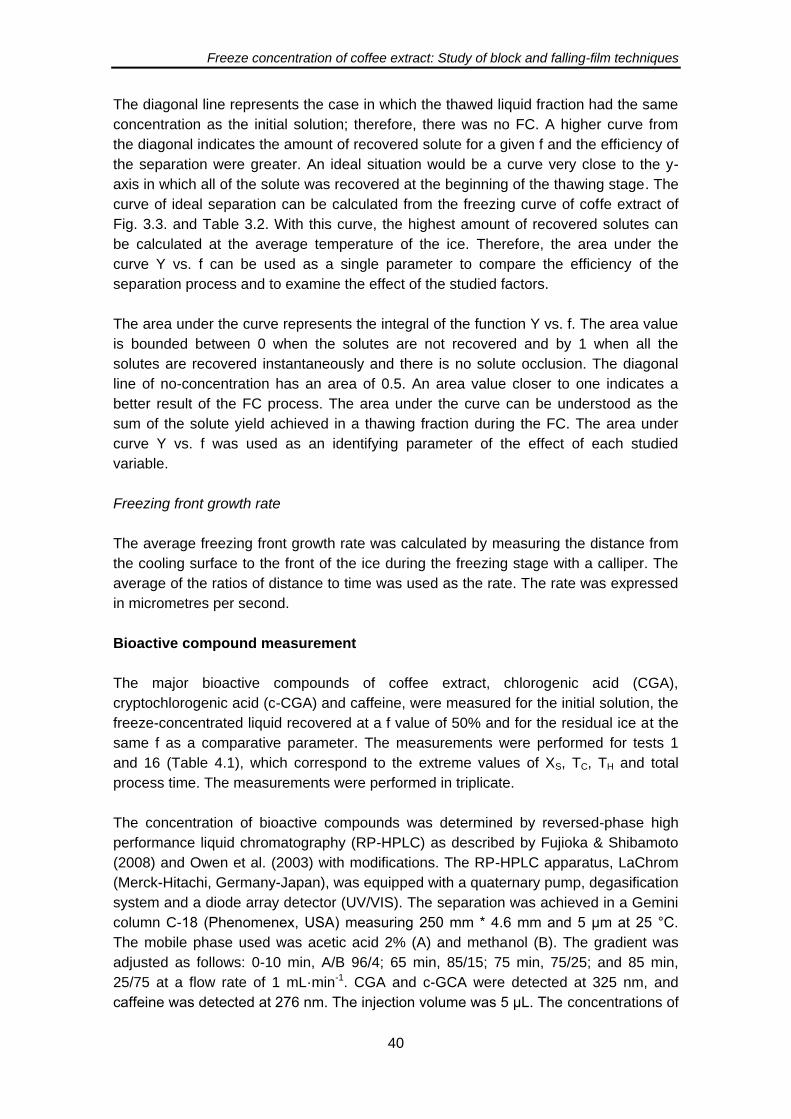
Freeze concentration of coffee extract: Study of block and falling-film techniques
40
The diagonal line represents the case in which the thawed liquid fraction had the same
concentration as the initial solution; therefore, there was no FC. A higher curve from
the diagonal indicates the amount of recovered solute for a given f and the efficiency of
the separation were greater. An ideal situation would be a curve very close to the y-
axis in which all of the solute was recovered at the beginning of the thawing stage. The
curve of ideal separation can be calculated from the freezing curve of coffe extract of
Fig. 3.3. and Table 3.2. With this curve, the highest amount of recovered solutes can
be calculated at the average temperature of the ice. Therefore, the area under the
curve Y vs. f can be used as a single parameter to compare the efficiency of the
separation process and to examine the effect of the studied factors.
The area under the curve represents the integral of the function Y vs. f. The area value
is bounded between 0 when the solutes are not recovered and by 1 when all the
solutes are recovered instantaneously and there is no solute occlusion. The diagonal
line of no-concentration has an area of 0.5. An area value closer to one indicates a
better result of the FC process. The area under the curve can be understood as the
sum of the solute yield achieved in a thawing fraction during the FC. The area under
curve Y vs. f was used as an identifying parameter of the effect of each studied
variable.
Freezing front growth rate
The average freezing front growth rate was calculated by measuring the distance from
the cooling surface to the front of the ice during the freezing stage with a calliper. The
average of the ratios of distance to time was used as the rate. The rate was expressed
in micrometres per second.
Bioactive compound measurement
The major bioactive compounds of coffee extract, chlorogenic acid (CGA),
cryptochlorogenic acid (c-CGA) and caffeine, were measured for the initial solution, the
freeze-concentrated liquid recovered at a f value of 50% and for the residual ice at the
same f as a comparative parameter. The measurements were performed for tests 1
and 16 (Table 4.1), which correspond to the extreme values of XS, TC, TH and total
process time. The measurements were performed in triplicate.
The concentration of bioactive compounds was determined by reversed-phase high
performance liquid chromatography (RP-HPLC) as described by Fujioka & Shibamoto
(2008) and Owen et al. (2003) with modifications. The RP-HPLC apparatus, LaChrom
(Merck-Hitachi, Germany-Japan), was equipped with a quaternary pump, degasification
system and a diode array detector (UV/VIS). The separation was achieved in a Gemini
column C-18 (Phenomenex, USA) measuring 250 mm * 4.6 mm and 5 μm at 25 °C.
The mobile phase used was acetic acid 2% (A) and methanol (B). The gradient was
adjusted as follows: 0-10 min, A/B 96/4; 65 min, 85/15; 75 min, 75/25; and 85 min,
25/75 at a flow rate of 1 mL·min-1. CGA and c-GCA were detected at 325 nm, and
caffeine was detected at 276 nm. The injection volume was 5 μL. The concentrations of
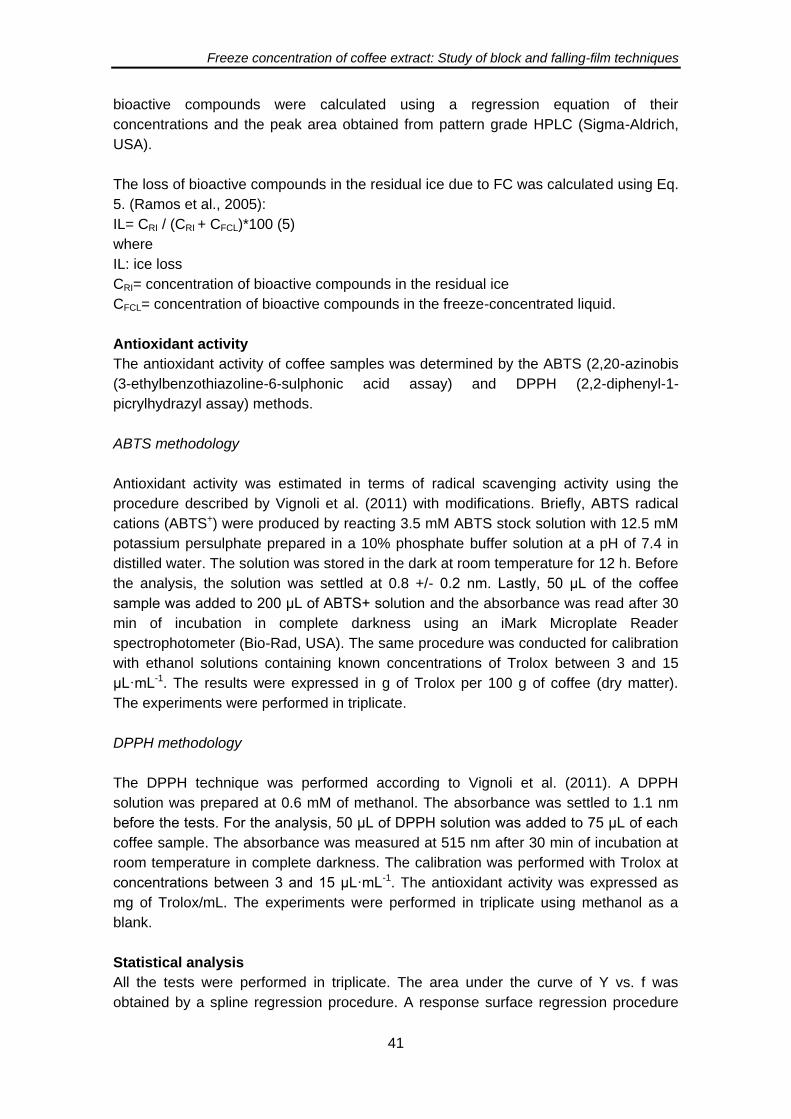
Freeze concentration of coffee extract: Study of block and falling-film techniques
41
bioactive compounds were calculated using a regression equation of their
concentrations and the peak area obtained from pattern grade HPLC (Sigma-Aldrich,
USA).
The loss of bioactive compounds in the residual ice due to FC was calculated using Eq.
5. (Ramos et al., 2005):
IL= CRI / (CRI + CFCL)*100 (5)
where
IL: ice loss
CRI= concentration of bioactive compounds in the residual ice
CFCL= concentration of bioactive compounds in the freeze-concentrated liquid.
Antioxidant activity
The antioxidant activity of coffee samples was determined by the ABTS (2,20-azinobis
(3-ethylbenzothiazoline-6-sulphonic acid assay) and DPPH (2,2-diphenyl-1-
picrylhydrazyl assay) methods.
ABTS methodology
Antioxidant activity was estimated in terms of radical scavenging activity using the
procedure described by Vignoli et al. (2011) with modifications. Briefly, ABTS radical
cations (ABTS+) were produced by reacting 3.5 mM ABTS stock solution with 12.5 mM
potassium persulphate prepared in a 10% phosphate buffer solution at a pH of 7.4 in
distilled water. The solution was stored in the dark at room temperature for 12 h. Before
the analysis, the solution was settled at 0.8 +/- 0.2 nm. Lastly, 50 μL of the coffee
sample was added to 200 μL of ABTS+ solution and the absorbance was read after 30
min of incubation in complete darkness using an iMark Microplate Reader
spectrophotometer (Bio-Rad, USA). The same procedure was conducted for calibration
with ethanol solutions containing known concentrations of Trolox between 3 and 15
μL·mL-1. The results were expressed in g of Trolox per 100 g of coffee (dry matter).
The experiments were performed in triplicate.
DPPH methodology
The DPPH technique was performed according to Vignoli et al. (2011). A DPPH
solution was prepared at 0.6 mM of methanol. The absorbance was settled to 1.1 nm
before the tests. For the analysis, 50 μL of DPPH solution was added to 75 μL of each
coffee sample. The absorbance was measured at 515 nm after 30 min of incubation at
room temperature in complete darkness. The calibration was performed with Trolox at
concentrations between 3 and 15 μL·mL-1. The antioxidant activity was expressed as
mg of Trolox/mL. The experiments were performed in triplicate using methanol as a
blank.
Statistical analysis
All the tests were performed in triplicate. The area under the curve of Y vs. f was
obtained by a spline regression procedure. A response surface regression procedure

Freeze concentration of coffee extract: Study of block and falling-film techniques
42
was used to determine the effect of each studied factor listed in Table 1 on the area
under the curve with a confidence interval of 95%. One-way analysis of variance
(ANOVA) was applied to the results of the area under the curve followed by a LSD test
with a level of significance of 95%. For the bioactive compound measurement, the
mean values were calculated and a correlation analysis was performed by comparing
the Pearson coefficients. All statistical analysis were performed using the SAS 9.2
software package.
4.4. Results and discussion
4.4.1. Temperature profiles
The temperature profiles during FC tests for tests 1 and 8 described in Table 4.1 are
shown in Fig. 4.3. These tests corresponded to the lowest and highest overall process
time; therefore, the other tests were within this time interval. Temperature sensor 1 was
located beside the internal wall of the container and sensor 4 was located in the
external wall. In test 1, the freezing was achieved from the centre and the thawing from
the external wall. For this reason, the temperature dropped first in sensor 1 and last in
sensor 4, as can be seen in Fig. 3a; during the thawing stage, the order was reversed.
Point “a” shows the nucleation phenomenon that caused a temperature increase due to
the latent heat of the phase change. The latent heat released from the portion of liquid
closest to the centre (line 1) caused a temperature increasing of the external portion
before it was frozen (line 4). For this reason, a temperature increasing in the interval
0°C to 5°C was observed. After that, the whole solution was frozen and the
temperature tended to be constant. A similar behaviour was reported by Nakagawa et
al. (2010b).
When the temperature was stable, the thawing phase began (point b). A change in the
temperature was observed in the opposite order than it was in the freezing stage. For
test 1, the thawing time was 180 min and the average freezing growth rate was 1.84
μm·s-1. Alternatively, in test 8 (Fig. 4.3b), the freezing and the thawing were both
achieved from the external wall in parallel. The first portion that was frozen and thawed
corresponded to sensor 4, which was located beside the external wall. A freezing time
of 45 min and an average ice growth rate of 7.17 μm·s-1 were obtained.
4.4.2. Freeze-concentration tests
The results of the block FC tests are shown in Table 4.2 in descending order of the
area under the curve of Y vs. f. The greatest area was obtained for test 1, which
corresponded to the lowest coffee mass fraction, the greatest cooling temperature, the
lowest heating temperature and freezing direction in counter-flow to the thawing. The
treatments showed significant differences at p<0.05. The LSD test indicated
differences among treatments for XS 0.05. Differences in FD and TC can be observed.
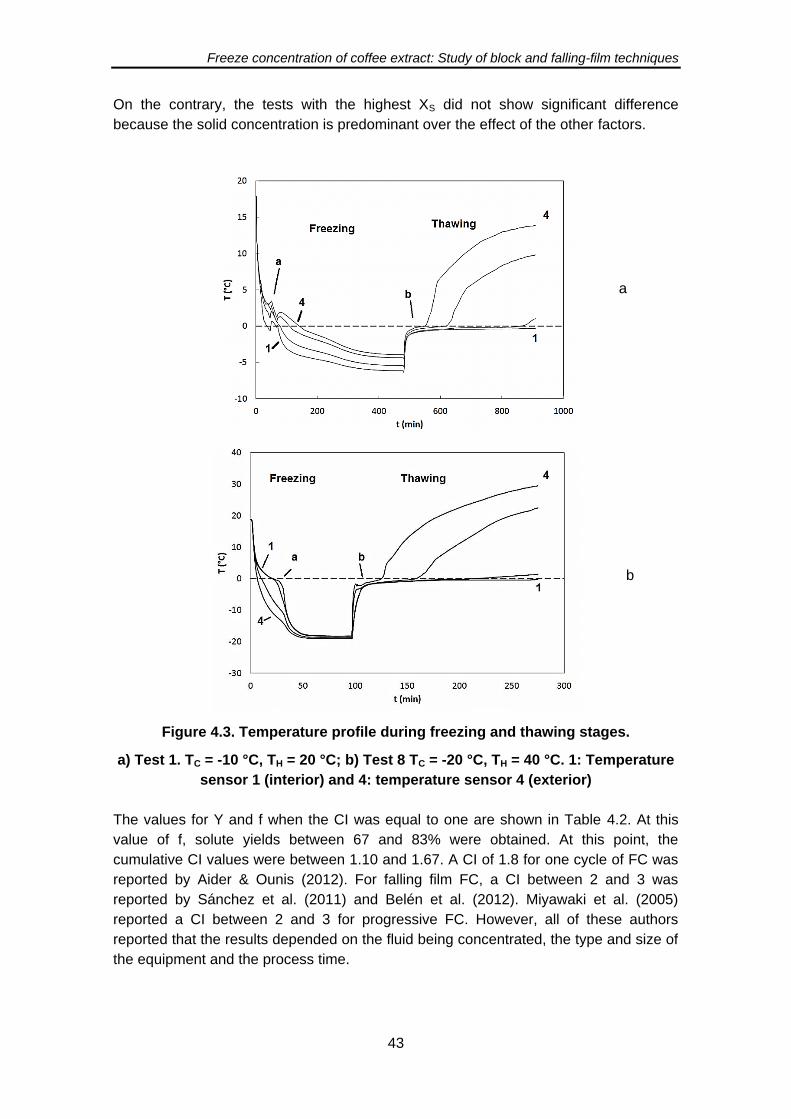
Freeze concentration of coffee extract: Study of block and falling-film techniques
43
On the contrary, the tests with the highest XS did not show significant difference
because the solid concentration is predominant over the effect of the other factors.
Figure 4.3. Temperature profile during freezing and thawing stages.
a) Test 1. TC = -10 °C, TH = 20 °C; b) Test 8 TC = -20 °C, TH = 40 °C. 1: Temperature
sensor 1 (interior) and 4: temperature sensor 4 (exterior)
The values for Y and f when the CI was equal to one are shown in Table 4.2. At this
value of f, solute yields between 67 and 83% were obtained. At this point, the
cumulative CI values were between 1.10 and 1.67. A CI of 1.8 for one cycle of FC was
reported by Aider & Ounis (2012). For falling film FC, a CI between 2 and 3 was
reported by Sánchez et al. (2011) and Belén et al. (2012). Miyawaki et al. (2005)
reported a CI between 2 and 3 for progressive FC. However, all of these authors
reported that the results depended on the fluid being concentrated, the type and size of
the equipment and the process time.
a
b
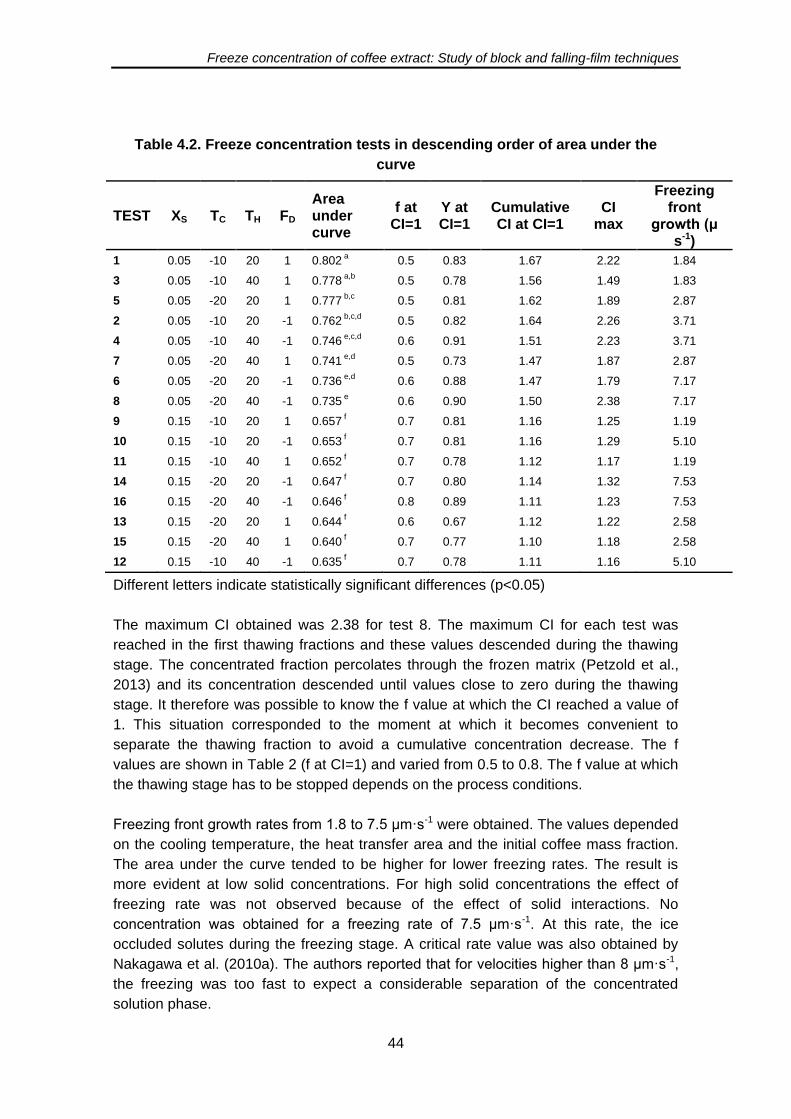
Freeze concentration of coffee extract: Study of block and falling-film techniques
44
Table 4.2. Freeze concentration tests in descending order of area under the
curve
TEST XS TC TH FD Area under curve
f at CI=1
Y at CI=1
Cumulative CI at CI=1
CI max
Freezing front
growth (μ s-1)
1 0.05 -10 20 1 0.802 a
0.5 0.83 1.67 2.22 1.84
3 0.05 -10 40 1 0.778 a,b
0.5 0.78 1.56 1.49 1.83
5 0.05 -20 20 1 0.777 b,c
0.5 0.81 1.62 1.89 2.87
2 0.05 -10 20 -1 0.762 b,c,d
0.5 0.82 1.64 2.26 3.71
4 0.05 -10 40 -1 0.746
e,c,d 0.6 0.91 1.51 2.23 3.71
7 0.05 -20 40 1 0.741
e,d 0.5 0.73 1.47 1.87 2.87
6 0.05 -20 20 -1 0.736 e,d
0.6 0.88 1.47 1.79 7.17
8 0.05 -20 40 -1 0.735 e
0.6 0.90 1.50 2.38 7.17
9 0.15 -10 20 1 0.657 f 0.7 0.81 1.16 1.25 1.19
10 0.15 -10 20 -1 0.653 f 0.7 0.81 1.16 1.29 5.10
11 0.15 -10 40 1 0.652 f 0.7 0.78 1.12 1.17 1.19
14 0.15 -20 20 -1 0.647
f 0.7 0.80 1.14 1.32 7.53
16 0.15 -20 40 -1 0.646 f 0.8 0.89 1.11 1.23 7.53
13 0.15 -20 20 1 0.644
f 0.6 0.67 1.12 1.22 2.58
15 0.15 -20 40 1 0.640
f 0.7 0.77 1.10 1.18 2.58
12 0.15 -10 40 -1 0.635
f 0.7 0.78 1.11 1.16 5.10
Different letters indicate statistically significant differences (p<0.05)
The maximum CI obtained was 2.38 for test 8. The maximum CI for each test was
reached in the first thawing fractions and these values descended during the thawing
stage. The concentrated fraction percolates through the frozen matrix (Petzold et al.,
2013) and its concentration descended until values close to zero during the thawing
stage. It therefore was possible to know the f value at which the CI reached a value of
1. This situation corresponded to the moment at which it becomes convenient to
separate the thawing fraction to avoid a cumulative concentration decrease. The f
values are shown in Table 2 (f at CI=1) and varied from 0.5 to 0.8. The f value at which
the thawing stage has to be stopped depends on the process conditions.
Freezing front growth rates from 1.8 to 7.5 μm·s-1 were obtained. The values depended
on the cooling temperature, the heat transfer area and the initial coffee mass fraction.
The area under the curve tended to be higher for lower freezing rates. The result is
more evident at low solid concentrations. For high solid concentrations the effect of
freezing rate was not observed because of the effect of solid interactions. No
concentration was obtained for a freezing rate of 7.5 μm·s-1. At this rate, the ice
occluded solutes during the freezing stage. A critical rate value was also obtained by
Nakagawa et al. (2010a). The authors reported that for velocities higher than 8 μm·s-1,
the freezing was too fast to expect a considerable separation of the concentrated
solution phase.
Freeze concentration of coffee extract: Study of block and falling-film techniques
45
4.4.3. Effect of each operational factor on solute recovery
A regression analysis was performed to determine the statistical significance of the
factors of the study on the area under the curve of Y vs. f. The result is shown in Table
4.3. The analysis showed a good fitting of the experimental data (R2=0.9874 and
RMSE=0.0123). The parameters with a Pr<0.05 significantly affected the area under
the curve. The main effects XS, TC and FD and the interaction terms TC·XS and FD·XS
significantly affected the freeze concentration.
Table 4.3. Significance analysis for freeze concentration factors
Parameter Estimator Pr > |t|
Intercept 0.917 <0.001 XS - 1.617 0.0002 * TC 0.004 0.039 * TH - 0.001 0.077 FD 0.037 0.010 *
TC·XS - 0.020 0.049 * TH·XS - 0.006 0.184 TH·TC - 0.001 0.545 FD·XS - 0.133 0.019 * FD·TC 0.001 0.141 FD·TH 0.001 0.358
* statistically significant at α<0.05
The coffee mass fraction had the greatest influence with a negative correlation; in other
words, the grade of concentration achieved with the block FC decreased with the
increase in XS. The second main effect was the freezing direction followed by the
cooling temperature. The interactions between XS and the other two mean factors were
also significant, indicating the influence of these variables. Alternatively, the TH did not
significantly affect the studied intervals. Nakagawa et al. (2010b) and Moreno et al.
(2013) reported that the TH influenced the solute yield when lower thawing
temperatures were compared. This result depended on the FC protocol and the level of
TH.
Effect of initial coffee mass fraction (XS)
The curves Y against f and CI against f for tests 5 and 13 are shown in Fig. 4.4. These
test had different values of XS, but the other factors were constant. A higher solute
recovery was obtained for XS = 0.05. This result was the same for all of the tests.
Comparing the curve with the diagonal line of no-concentration, the area under the
curve was higher for the lowest XS.
This result can be explained by different factors. First, during the freezing stage, the ice
grows by the diffusion of water molecules to the ice surface and the counter-diffusion of
solutes to the liquid phase (Petzold & Aguilera, 2009). The diffusion rate of solutes
decreases when the solid concentration increases due to the interactions between
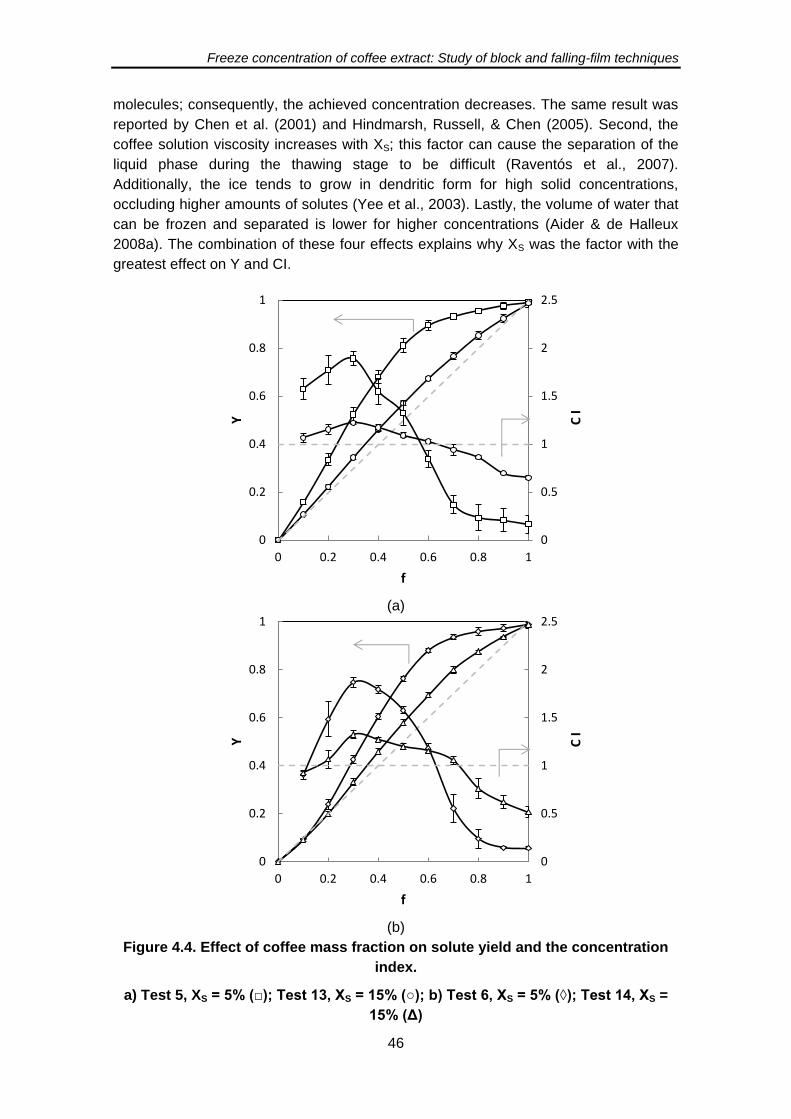
Freeze concentration of coffee extract: Study of block and falling-film techniques
46
molecules; consequently, the achieved concentration decreases. The same result was
reported by Chen et al. (2001) and Hindmarsh, Russell, & Chen (2005). Second, the
coffee solution viscosity increases with XS; this factor can cause the separation of the
liquid phase during the thawing stage to be difficult (Raventós et al., 2007).
Additionally, the ice tends to grow in dendritic form for high solid concentrations,
occluding higher amounts of solutes (Yee et al., 2003). Lastly, the volume of water that
can be frozen and separated is lower for higher concentrations (Aider & de Halleux
2008a). The combination of these four effects explains why XS was the factor with the
greatest effect on Y and CI.
(a)
(b)
Figure 4.4. Effect of coffee mass fraction on solute yield and the concentration
index.
a) Test 5, XS = 5% (□); Test 13, XS = 15% (○); b) Test 6, XS = 5% (◊); Test 14, XS =
15% (Δ)
0
0.5
1
1.5
2
2.5
0
0.2
0.4
0.6
0.8
1
0 0.2 0.4 0.6 0.8 1
Y
f C
I
0
0.5
1
1.5
2
2.5
0
0.2
0.4
0.6
0.8
1
0 0.2 0.4 0.6 0.8 1
Y
f
C I
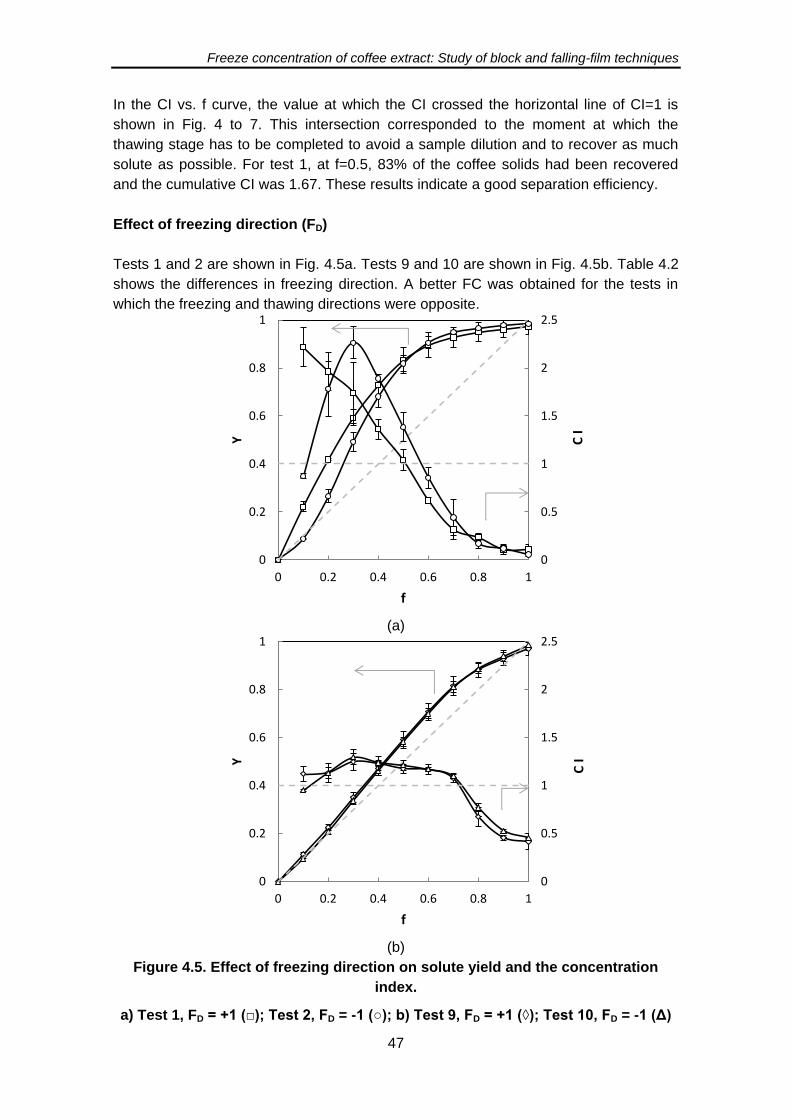
Freeze concentration of coffee extract: Study of block and falling-film techniques
47
In the CI vs. f curve, the value at which the CI crossed the horizontal line of CI=1 is
shown in Fig. 4 to 7. This intersection corresponded to the moment at which the
thawing stage has to be completed to avoid a sample dilution and to recover as much
solute as possible. For test 1, at f=0.5, 83% of the coffee solids had been recovered
and the cumulative CI was 1.67. These results indicate a good separation efficiency.
Effect of freezing direction (FD)
Tests 1 and 2 are shown in Fig. 4.5a. Tests 9 and 10 are shown in Fig. 4.5b. Table 4.2
shows the differences in freezing direction. A better FC was obtained for the tests in
which the freezing and thawing directions were opposite.
(a)
(b)
Figure 4.5. Effect of freezing direction on solute yield and the concentration
index.
a) Test 1, FD = +1 (□); Test 2, FD = -1 (○); b) Test 9, FD = +1 (◊); Test 10, FD = -1 (Δ)
0
0.5
1
1.5
2
2.5
0
0.2
0.4
0.6
0.8
1
0 0.2 0.4 0.6 0.8 1
Y
f
C I
0
0.5
1
1.5
2
2.5
0
0.2
0.4
0.6
0.8
1
0 0.2 0.4 0.6 0.8 1
Y
f
C I
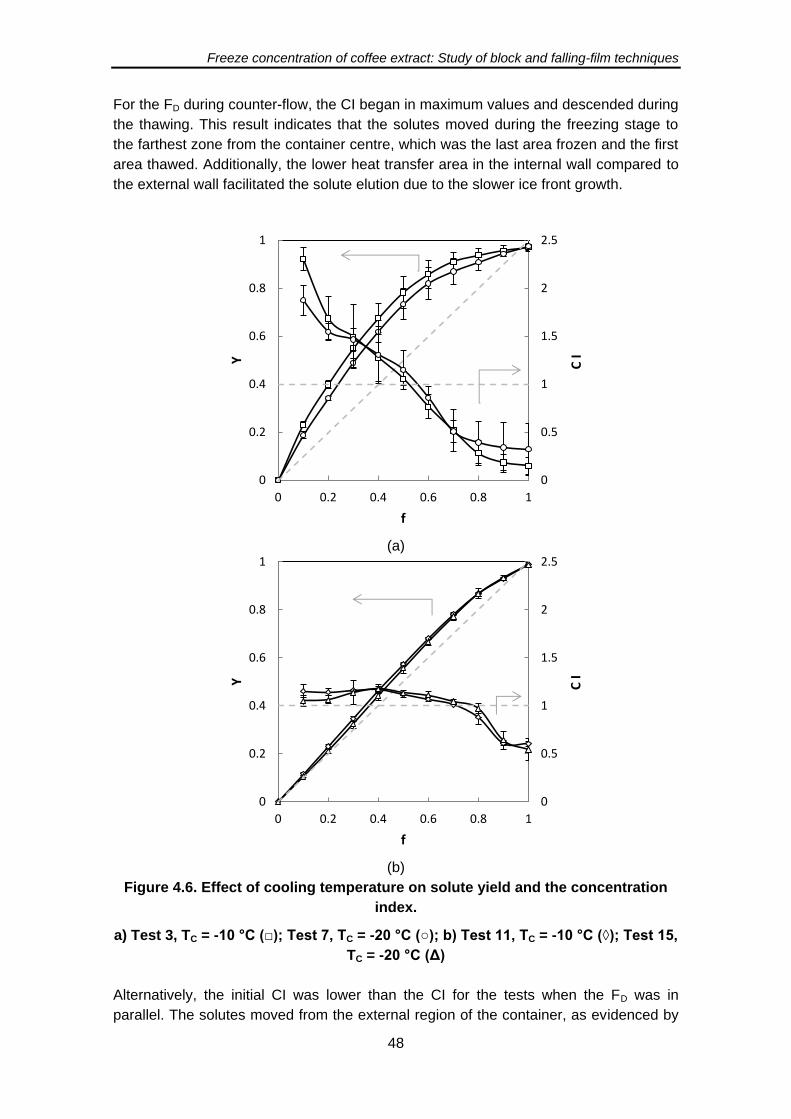
Freeze concentration of coffee extract: Study of block and falling-film techniques
48
For the FD during counter-flow, the CI began in maximum values and descended during
the thawing. This result indicates that the solutes moved during the freezing stage to
the farthest zone from the container centre, which was the last area frozen and the first
area thawed. Additionally, the lower heat transfer area in the internal wall compared to
the external wall facilitated the solute elution due to the slower ice front growth.
(a)
(b)
Figure 4.6. Effect of cooling temperature on solute yield and the concentration
index.
a) Test 3, TC = -10 °C (□); Test 7, TC = -20 °C (○); b) Test 11, TC = -10 °C (◊); Test 15,
TC = -20 °C (Δ)
Alternatively, the initial CI was lower than the CI for the tests when the FD was in
parallel. The solutes moved from the external region of the container, as evidenced by
0
0.5
1
1.5
2
2.5
0
0.2
0.4
0.6
0.8
1
0 0.2 0.4 0.6 0.8 1
Y
f
C I
0
0.5
1
1.5
2
2.5
0
0.2
0.4
0.6
0.8
1
0 0.2 0.4 0.6 0.8 1
Y
f
C I
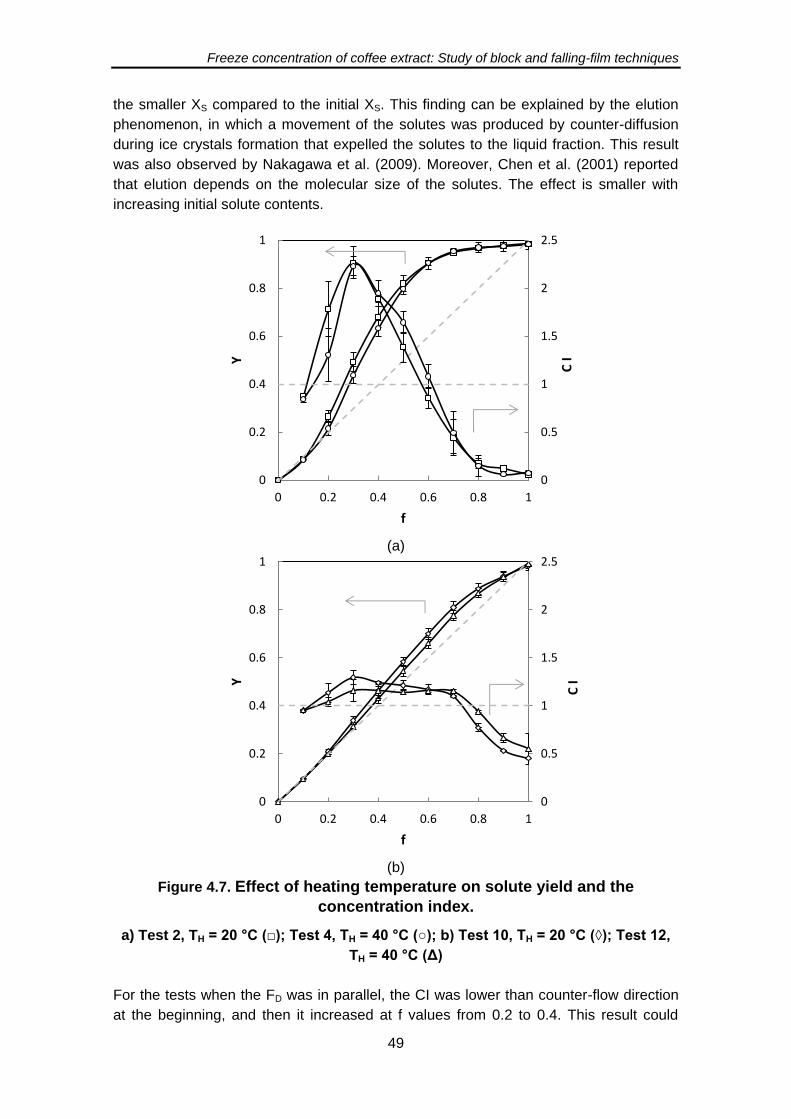
Freeze concentration of coffee extract: Study of block and falling-film techniques
49
the smaller XS compared to the initial XS. This finding can be explained by the elution
phenomenon, in which a movement of the solutes was produced by counter-diffusion
during ice crystals formation that expelled the solutes to the liquid fraction. This result
was also observed by Nakagawa et al. (2009). Moreover, Chen et al. (2001) reported
that elution depends on the molecular size of the solutes. The effect is smaller with
increasing initial solute contents.
(a)
(b)
Figure 4.7. Effect of heating temperature on solute yield and the
concentration index.
a) Test 2, TH = 20 °C (□); Test 4, TH = 40 °C (○); b) Test 10, TH = 20 °C (◊); Test 12,
TH = 40 °C (Δ)
For the tests when the FD was in parallel, the CI was lower than counter-flow direction
at the beginning, and then it increased at f values from 0.2 to 0.4. This result could
0
0.5
1
1.5
2
2.5
0
0.2
0.4
0.6
0.8
1
0 0.2 0.4 0.6 0.8 1
Y
f
C I
0
0.5
1
1.5
2
2.5
0
0.2
0.4
0.6
0.8
1
0 0.2 0.4 0.6 0.8 1
Y
f
C I
Freeze concentration of coffee extract: Study of block and falling-film techniques
50
have occurred because the solutes diffused from the concentrated liquid fractions to
the droplet of water that had melted during thawing. This phenomenon is known as
sweating. This result was also reported by Nakagawa et al. (2009). Likewise, the
concentrated portions were the first fractions to be thawed and separated due to the
difference in densities, as reported by Yee et al. (2003). The results show the freezing
direction as a variable of interest in the study of block FC to promote the intensification
of solute recovery.
Effect of cooling temperature (TC)
Fig. 4.6 shows the tests comparing the effect of TC. Better outcomes were obtained at -
10 °C. The heat transfer rate was slower at higher cooling temperatures. The ice
crystals were able to grow in a more ordered pattern that occluded a smaller amount of
solutes. For the elution to occur, the solutes mass transfer rate must be greater than
the ice growth rate (Caretta et al., 2006; Petzold & Aguilera, 2009). In addition, the ice
crystal size depends on the cooling rate, which can affect the level of occlusion (Pardo
et al., 2002). Certain authors have reported that the cooling temperature is not a
significant factor impacting block FC (Aider & de Halleux, 2008b; Gao et al., 2009).
These reports suggest that the effect of TC depends on the FC protocol during both the
freezing and thawing stages and depends on the separation mode of the liquid phase.
Effect of heating temperature (TH)
A slightly higher solute recovery was obtained at a TH of 20 °C (Fig. 4.7). The average
temperature in the empty region of the container after each liquid fraction separation
during the thawing was 10 °C (Fig. 3). The treatments with the lowest TH allowed for a
slower thawing and avoided the dilution of the concentrated phase. However, the effect
was not significant at the studied levels. The TH may be significant at different levels, as
reported by Moreno et al. (2013) where the tested heating temperatures were closer to
the freezing point.
4.4.4. Bioactive compounds and the antioxidant activity of coffee
The concentrations of the major bioactive compounds in coffee solutions were
determined for the initial solution (C0), the liquid freeze-concentrated liquid (CFCL) and
the residual ice (C RI) obtained for a thawing fraction of 50%. A typical chromatogram is
shown in Fig. 8. Chlorogenic acids were the major component in the solutions. The
bioactive compounds concentration and the ice loss percentage are shown in Table 4.
The ice loss percentage was approximately 16% for the lowest XS and 41% for the
highest XS. This factor was related to the concentration index. When the ice loss (IL)
was calculated on a coffee dry matter basis, the result was approximately 50%. This
result indicates that the functional compounds were equally distributed in the ice and
liquid fractions. There was a greater amount of bioactive compounds in the liquid phase
because the concentrated liquid had a higher XS. The results correspond to tests 1 and
16 (Table 1), which had extreme values of XS, TC, TH and total process time. All of the
other tests were inside the intervals of tests 1 and 16.
Freeze concentration of coffee extract: Study of block and falling-film techniques
51
The CI of total coffee solids for tests 1 and 16 at f=0.5 were 1.60 and 1.15, respectively
as seen in table 4. These values were statistically equal to the CI for the bioactive
compounds, according to the LSD test. A higher significant correlation (1.00) was found
(p<0.01) between XS and the concentrations of CGA, 4-CQA and caffeine. The same
correlation between CI and %LI was found. Consequently, the amount of bioactive
compounds was maintained in proportion to the amount of total coffee solids.
Therefore, the concentration of bioactive compounds was enhanced through freeze
concentration and the bioactive compounds of the beverage were preserved by block
FC.
Highly significant correlations (p<0.01) between antioxidant activity measured by DPPH
and the concentrations of CGA, c-CGA and caffeine were demonstrated, as seen in
table 5. The correlations of the ABTS measurements were significant (p<0.05). These
results confirm that the antioxidant activity of coffee depends on the CGA and caffeine
content, as reported by Fujioka & Shibamoto (2008).
A ratio between the antioxidant activity of the liquid fraction and the initial solution was
calculated to represent the antioxidant activity relative index (CFCL/C0) (Table 4). There
was no significant difference between the antioxidant activity relative index and the CI
of the total coffee solids. The antioxidant activity was increased until 2.4 in one FC
cycle. The increase of the antioxidant activity of mate extract was also reported by
Boaventura et al. (2012) using block freeze concentration. This finding suggests block
FC is an effective technique to preserve the functional properties of coffee extracts.
4.5. Conclusions
Coffee extract was freeze-concentrated by the total block technique. A significant effect
of the initial coffee mass fraction, freezing direction and cooling temperature on solute
recovery was found. The highest solute recovery was achieved at the lowest coffee
mass fraction, when the freezing direction was in counter-flow to the thawing direction
and at the highest cooling temperatures. The thawing fractions at which completion of
the thawing stage was convenient were found between the values of 0.5 and 0.8. The
initial coffee mass fraction was the factor with the highest influence on the solute yield
and the concentration index. Using a freezing direction in counter-flow to the thawing
direction represents an interesting alternative to increase solute recovery due to solute
elution. Furthermore, the coffee bioactive compounds were distributed in the ice and
liquid phase in proportion to the total solid content. Very significant correlations
between the antioxidant activity and chlorogenic acid and caffeine contents in the
freeze-concentrated extract were found. Consequently, the freeze concentration
method increased the bioactive compound concentration and the antioxidant activity of
the coffee extract. The block freeze concentration method is a potential technique to
remove water and preserve the functional properties of coffee extracts.
Freeze concentration of coffee extract: Study of block and falling-film techniques
52
4.6. References
Aider, M., & Ounis, W. B. (2012). Skim milk cryoconcentration as affected by the
thawing mode: gravitational vs. microwave-assisted. International Journal of Food
Science & Technology, 47(1), 195-202.
Aider, M., & de Halleux, D. (2008a). Production of concentrated cherry and apricot
juices by cryoconcentration technology. LWT - Food Science and Technology,
41(10), 1768-1775.
Aider, M., & de Halleux, D. (2008b). Passive and microwave-assisted thawing in maple
sap cryoconcentration technology. Journal of Food Engineering, 85(1), 65-72.
Aider, M., & de Halleux, D. (2009). Cryoconcentration technology in the bio-food
industry: Principles and applications. LWT - Food Science and Technology, 42(3),
679-685.
Belén, F., Benedetti, S., Sánchez, J., Hernández, E., Auleda, J. M., Prudêncio, E. S.,
Petrus, J. C. C., et al. (2013). Behavior of functional compounds during freeze
concentration of tofu whey. Journal of Food Engineering, 116(3), 681-688.
Belén, F., Sánchez, J., Hernández, E., Auleda, J. M., & Raventós, M. (2012). One
option for the management of wastewater from tofu production: Freeze
concentration in a falling-film system. Journal of Food Engineering, 110(3), 364-373.
Boaventura, B. C. B., Murakami, A. N. N., Prudêncio, E. S., Maraschin, M., Murakami,
F. S., Amante, E. R., Amboni, R. D. D. M. C. (2013). Enhancement of bioactive
compounds content and antioxidant activity of aqueous extract of mate (Ilex
paraguariensis A. St. Hil.) through freeze concentration technology. Food Research
International, 53(2), 686-692.
Boss, E. A., Filho, R. M., & de Toledo, E. C. V. (2004). Freeze drying process: real time
model and optimization. Chemical Engineering and Processing: Process
Intensification, 43(12), 1475-1485.
Caretta, O., Courtot, F., & Davies, T. (2006). Measurement of salt entrapment during
the directional solidification of brine under forced mass convection. Journal of
Crystal Growth, 294(2), 151-155.
Chen, P., Chen, X. D., & Free, K. W. (1998). Solute Inclusion in Ice Formed From
Sucrose Solutions on a Sub-cooled Surface-an Experimental Study. Process
Engineering, 38(1), 1-13.
Chen, Y. H., Cao, E., & Cui, Z. F. (2001). An experimental study of freeze
concentration in biological media. Trans IChemE, 79, 35-40.
Cheong, M. W., Tong, K. H., Ong, J. J. M., Liu, S. Q., Curran, P., & Yu, B. (2013).
Volatile composition and antioxidant capacity of Arabica coffee. Food Research
International, 51(1), 388-396.
Esquivel, P., & Jiménez, V. M. (2012). Functional properties of coffee and coffee by-
products. Food Research International, 46(2), 488-495.
Freeze concentration of coffee extract: Study of block and falling-film techniques
53
Ferruzzi, M. G. (2010). The influence of beverage composition on delivery of phenolic
compounds from coffee and tea. Physiology & behavior, 100(1), 33-41.
Fujioka, K., & Shibamoto, T. (2008). Chlorogenic acid and caffeine contents in various
commercial brewed coffees. Food Chemistry, 106(1), 217-221.
Gao, W., Habib, M., & Smith, D. W. (2009). Removal of organic contaminants and
toxiciy from industrial effluents using freezing processes. Desalination, 245(1-3),
108-119.
Hindmarsh, J. P., Russell, a. B., & Chen, X. D. (2005). Measuring dendritic growth in
undercooled sucrose solution droplets. Journal of Crystal Growth, 285(1-2), 236-
248.
Icontec. (2009). NTC 4602-1, Determination of extraction yield and soluble solids in
coffee beverage. Colombia.
Joët, T., Laffargue, A., Descroix, F., Doulbeau, S., Bertrand, B., Kochko, A. D., &
Dussert, S. (2010). Influence of environmental factors, wet processing and their
interactions on the biochemical composition of green Arabica coffee beans. Food
Chemistry, 118(3), 693-701.
Miyawaki, O., Liu L., Shirai, Y., Sakashita, S., Kagitani, K. (2005). Tubular ice system
for scale-up of progressive freeze-concentration. Journal of Food Engineering, 69,
107-113.
Miyawaki, O., Kato, S., & Watabe, K. (2012). Yield improvement in progressive freeze-
concentration by partial melting of ice. Journal of Food Engineering, 108(3), 377-
382.
Moreno, F. L.; Robles, C. M.; Sarmiento, Z.; Ruiz, Y. and Pardo, J. M. (2013). Effect of
separation and thawing mode on block freeze-concentration of coffee brews, Food
and Bioproducts Processing, 91 (4), 396-402.
Nakagawa, K., Maebashi, S., & Maeda, K. (2009). Concentration of aqueous dye
solution by freezing and thawing. The Canadian Journal of Chemical Engineering,
87(5), 779-787.
Nakagawa, K., Maebashi, S., & Maeda, K. (2010a). Freeze-thawing as a path to
concentrate aqueous solution. Separation and Purification Technology, 73(3), 403-
408.
Nakagawa, K., Nagahama, H., Maebashi, S., & Maeda, K. (2010b). Usefulness of
solute elution from frozen matrix for freeze-concentration technique. Chemical
Engineering Research and Design, 88(5-6), 718-724.
Owen, R. ., Haubner, R., Mier, W., Giacosa, a, Hull, W. ., Spiegelhalder, B., & Bartsch,
H. (2003). Isolation, structure elucidation and antioxidant potential of the major
phenolic and flavonoid compounds in brined olive drupes. Food and Chemical
Toxicology, 41(5), 703-717.
Pardo, J M, Suess, F., & Niranjan, K. (2002). An investigation into the relationship
between freezing rate and mean ice crystal size of coffee extarcts. Trans IChemE,
80, 176-182.
Freeze concentration of coffee extract: Study of block and falling-film techniques
54
Petzold, G., & Aguilera, J. M. (2009). Ice Morphology: Fundamentals and
Technological Applications in Foods. Food Biophysics, 4(4), 378-396.
Petzold, G., Niranjan, K., & Aguilera, J. M. (2013). Vacuum-assisted freeze
concentration of sucrose solutions. Journal of Food Engineering, 115(3), 357-361.
Ramos, F. a., Delgado, J. L., Bautista, E., Morales, a. L., & Duque, C. (2005). Changes
in volatiles with the application of progressive freeze-concentration to Andes berry
(Rubus glaucus Benth). Journal of Food Engineering, 69(3), 291-297.
Raventós, M., Hernández, E., Auleda, J., & Ibarz, A. (2007). Concentration of aqueous
sugar solutions in a multi-plate cryoconcentrator. Journal of Food Engineering,
79(2), 577-585.
Sopelana, P., Pérez-Martínez, M., López-Galilea, I., de Peña, M. P., & Cid, C. (2013).
Effect of ultra high temperature (UHT) treatment on coffee brew stability. Food
Research International. 50(2), 682-690.
Sánchez, J., Hernández, E., Auleda, J. M., & Raventós, M. (2011). Freeze
concentration of whey in a falling-film based pilot plant: Process and
characterization. Journal of Food Engineering, 103(2), 147-155.
Sánchez, J., Ruiz, Y., Auleda, J. M., Hernández, E., & Raventós, M. (2009). Review.
Freeze Concentration in the Fruit Juices Industry. Food Science and Technology
International, 15(4), 303-315.
Vignoli, J. A., Bassoli, D. G., & Benassi, M. T. (2011). Antioxidant activity , polyphenols
, caffeine and melanoidins in soluble coffee : The influence of processing conditions
and raw material. Food Chemistry, 124(3), 863-868.
Yee, P. L., Wakisaka, M., Shirai, Y., & Hassan, M. A. (2003). Effects of single food
components on freeze concentration by freezing and thawing technique. Japanese
Journal of food engineering, 4, 77-82.
Freeze concentration of coffee extract: Study of block and falling-film techniques
55
5. EFFECT OF SEPARATION AND THAWING MODE ON BLOCK FREEZE-
CONCENTRATION OF COFFEE BREWS
5.1. Abstract
Coffee brews were freeze-concentrated using block technique to evaluate the effect of
thawing temperature, thawing mode and separation mode on solute yield. Samples
were frozen and solute recovered using different thawing and separation conditions.
Three thawing temperatures (20, 4 and 1°C), two thawing modes (microwave assisted
and free thawing) and two liquid fraction separation modes (gravitational and vacuum
assisted) were tested. Solute yield was evaluated as a function of thawing ratio. Data
were fitted to a monomolecular model to compare separation quality by means of the
solute recovery ratio for each treatment. A combination of microwave assisted thawing
and vacuum separation showed the best results in terms of solute recovery ratio. On
the other hand, applying microwave assisted thawing or vacuum separation individually
did not significantly enhance the solute recovery ratio. Additionally a thawing
temperature effect on the solute recover ratio was also found. These results show that
it is possible to improve the separation quality of Block FC by combining this
technology with vacuum-assisted separation microwave heating. These results suggest
that block freeze-concentration has potential industrial application.
Keywords: Cryoconcentration; thawing; coffee; vacuum; microwave; solute yield;
monomolecular model
5.2. Introduction
Freeze-concentration (FC) is a technology used to remove water at low temperatures
preserving the quality of the original material (Miyawaki et al., 2005). Water remotion is
achieved once water ice crystals are formed, leaving behind a more concentrated fluid
(Sánchez et al., 2009). Moreover, FC allows to reduce processing time during the
industrial freeze drying (Boss et al., 2004).
FC techniques can be classified in three groups: suspension crystallization (Huige and
Thijssen, 1972), film freeze concentration (Sánchez et al., 2009) and freeze-thaw
method, known also as block freeze concentration (Aider and de Halleux, 2009;
Sánchez et al., 2011a). For suspension crystallization a scraped surface heat
exchanger is used to form a suspension of ice crystals that can be subsequently
separated (Miyawaki et al., 2005), (Habib and Farid, 2006). In Film FC a single crystal
layer is formed by contact with a refrigerated surface (Raventós et al., 2007; Sánchez
et al., 2011b). Freeze-thaw FC can be achieved using two different techniques: total or
partial block (Nakagawa et al., 2010a). In the partial block technique, the solution is
partially frozen and the remaining concentrated liquid is separated after a pre-
Freeze concentration of coffee extract: Study of block and falling-film techniques
56
determined time (Burdo et al., 2008). On the other hand, the total block technique
consists of completely freezing the sample with a subsequent thawing until the desired
amount of solute has been recovered (Aider and de Halleux, 2009). Consequently,
block FC comprises three important steps: freezing, thawing and separation.
Increasing ice purity is a big challenge for block FC (Aider and de Halleux, 2008).
Although, it is clear that the mass of the collected liquid increases with the collection
time, increasing it until collection of the entire original solution will lead to no overall
concentration effect. Therefore, it is important to determine the mass of the collected
sample in which solute recovery and concentration are high enough in order to stop the
process at this point. In the same way, it is important to establish the thawing
conditions or aids in separation stage to recover as much solute as possible.
The block FC method has been recently studied as a way to improve solute yield (Gao
et al., 2009; Okawa et al., 2009; Nakagawa et al., 2010a; Nakagawa et al., 2010b;
Miyawaki, et al., 2012). Furthermore, microwave assisted and gravitational thawing
have been studied for milk whey (Aider et al., 2008) and for maple sap (Aider and de
Halleux, 2008). It is worth noting that there are no reported studies about vacuum
application and its relationship with process variables during the thawing and
separation stages of block FC.
Meanwhile, coffee is the most traded food commodity worldwide (Esquivel and
Jiménez, 2011). The functional and organoleptic properties of coffee are highly
important for its processing and trading. Coffee processing technologies play a large
role in defining the quality of the beverage (Joët et al., 2010), therefore, in the soluble
coffee industry, technologies that preserve the initial characteristics of the brew are
useful. Currently, suspension FC is the unique technique that is being used by coffee
industry. This technique shows a high efficiency and purity of separated ice crystals,
however, it is recognized as an expensive method for food concentration (Aider and de
Halleux, 2009). Therefore, the use of this separation process is restricted to large-scale
processing plants. For this reason, the block FC technique has been proposed in order
to reduce cost and maintain high crystal purity (Aider and the Halleux, 2009), including
different modes to increase solute recovery in thawing and separation stages, looking
forward to implement this technique at different industrial scales.
In this paper, the total block FC of coffee brews is studied, analyzing the effect of
separation mode (gravitational and vacuum assisted), thawing temperature (1°C, 4 °C
and 20 °C) and thawing mode (natural convection and microwave assisted) on solute
yield.
5.3. Materials and methods
5.3.1. Materials
Coffee solutions were prepared from commercial soluble coffee, (Aroma brand,
Colombia) and distilled water at 20 °C. An initial concentration of 4.3 grams of
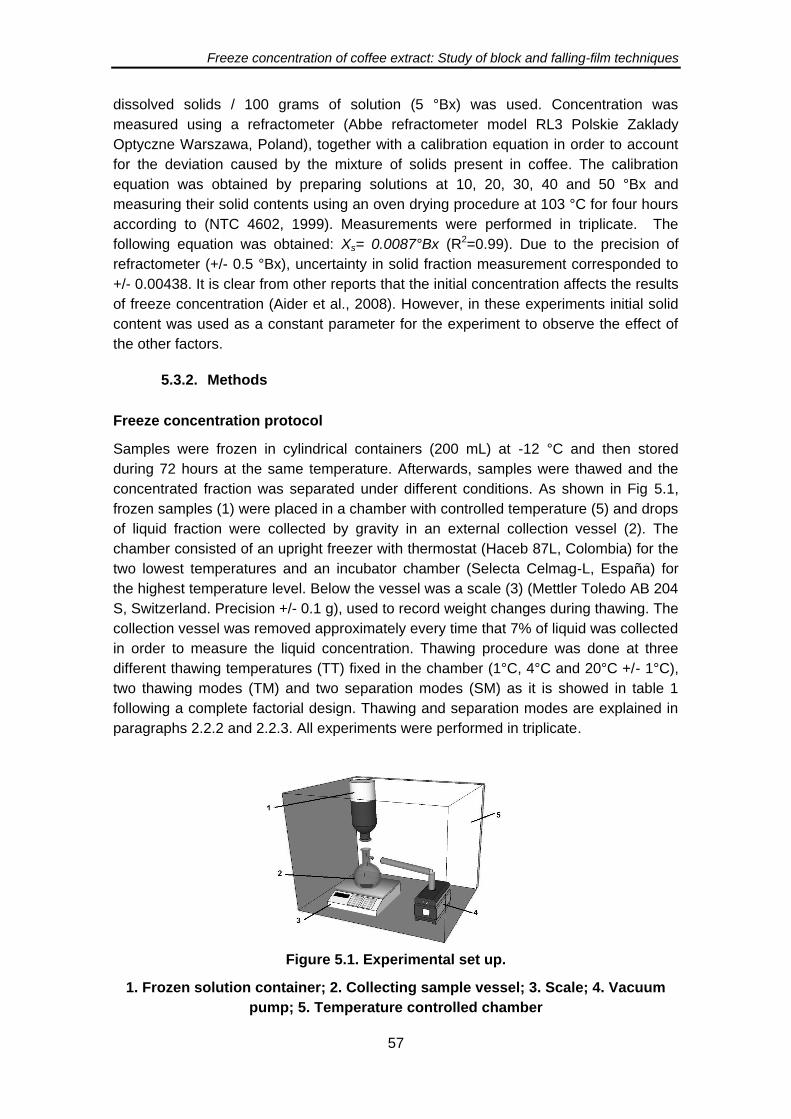
Freeze concentration of coffee extract: Study of block and falling-film techniques
57
dissolved solids / 100 grams of solution (5 °Bx) was used. Concentration was
measured using a refractometer (Abbe refractometer model RL3 Polskie Zaklady
Optyczne Warszawa, Poland), together with a calibration equation in order to account
for the deviation caused by the mixture of solids present in coffee. The calibration
equation was obtained by preparing solutions at 10, 20, 30, 40 and 50 °Bx and
measuring their solid contents using an oven drying procedure at 103 °C for four hours
according to (NTC 4602, 1999). Measurements were performed in triplicate. The
following equation was obtained: Xs= 0.0087°Bx (R2=0.99). Due to the precision of
refractometer (+/- 0.5 °Bx), uncertainty in solid fraction measurement corresponded to
+/- 0.00438. It is clear from other reports that the initial concentration affects the results
of freeze concentration (Aider et al., 2008). However, in these experiments initial solid
content was used as a constant parameter for the experiment to observe the effect of
the other factors.
5.3.2. Methods
Freeze concentration protocol
Samples were frozen in cylindrical containers (200 mL) at -12 °C and then stored
during 72 hours at the same temperature. Afterwards, samples were thawed and the
concentrated fraction was separated under different conditions. As shown in Fig 5.1,
frozen samples (1) were placed in a chamber with controlled temperature (5) and drops
of liquid fraction were collected by gravity in an external collection vessel (2). The
chamber consisted of an upright freezer with thermostat (Haceb 87L, Colombia) for the
two lowest temperatures and an incubator chamber (Selecta Celmag-L, España) for
the highest temperature level. Below the vessel was a scale (3) (Mettler Toledo AB 204
S, Switzerland. Precision +/- 0.1 g), used to record weight changes during thawing. The
collection vessel was removed approximately every time that 7% of liquid was collected
in order to measure the liquid concentration. Thawing procedure was done at three
different thawing temperatures (TT) fixed in the chamber (1°C, 4°C and 20°C +/- 1°C),
two thawing modes (TM) and two separation modes (SM) as it is showed in table 1
following a complete factorial design. Thawing and separation modes are explained in
paragraphs 2.2.2 and 2.2.3. All experiments were performed in triplicate.
Figure 5.1. Experimental set up.
1. Frozen solution container; 2. Collecting sample vessel; 3. Scale; 4. Vacuum
pump; 5. Temperature controlled chamber
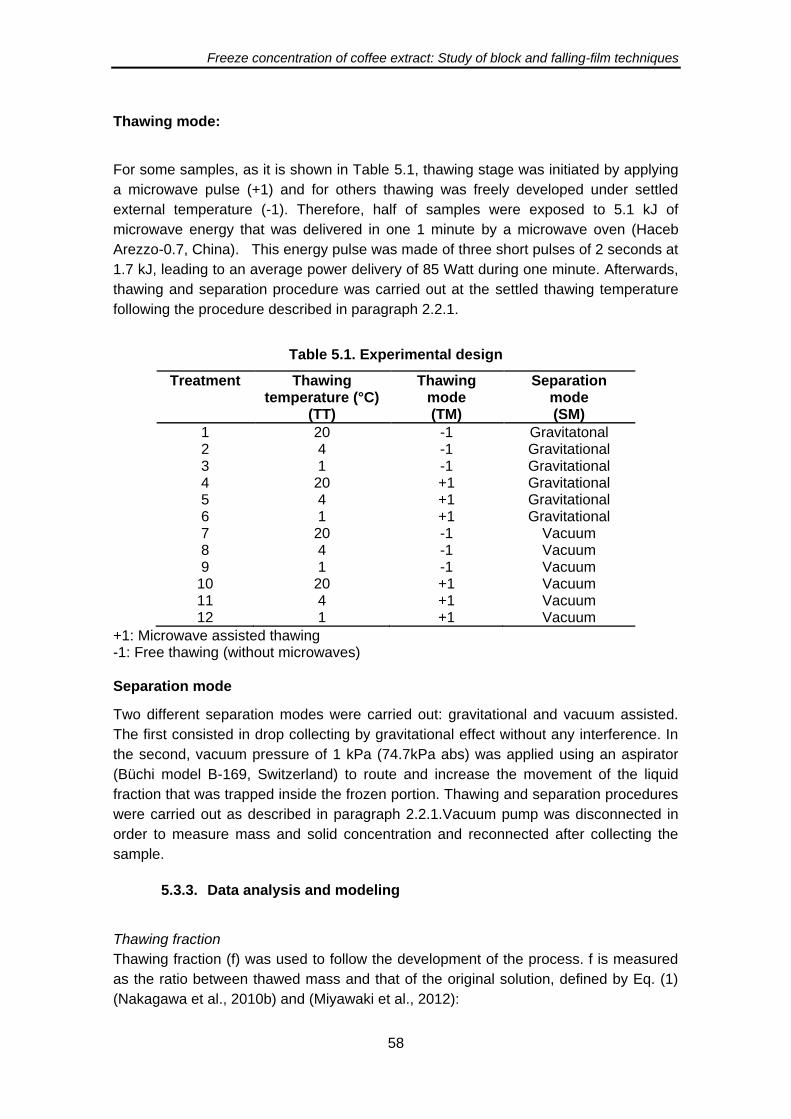
Freeze concentration of coffee extract: Study of block and falling-film techniques
58
Thawing mode:
For some samples, as it is shown in Table 5.1, thawing stage was initiated by applying
a microwave pulse (+1) and for others thawing was freely developed under settled
external temperature (-1). Therefore, half of samples were exposed to 5.1 kJ of
microwave energy that was delivered in one 1 minute by a microwave oven (Haceb
Arezzo-0.7, China). This energy pulse was made of three short pulses of 2 seconds at
1.7 kJ, leading to an average power delivery of 85 Watt during one minute. Afterwards,
thawing and separation procedure was carried out at the settled thawing temperature
following the procedure described in paragraph 2.2.1.
Table 5.1. Experimental design
Treatment Thawing temperature (°C)
(TT)
Thawing mode (TM)
Separation mode (SM)
1 20 -1 Gravitatonal 2 4 -1 Gravitational 3 1 -1 Gravitational 4 20 +1 Gravitational 5 4 +1 Gravitational 6 1 +1 Gravitational 7 20 -1 Vacuum 8 4 -1 Vacuum 9 1 -1 Vacuum
10 20 +1 Vacuum 11 4 +1 Vacuum 12 1 +1 Vacuum
+1: Microwave assisted thawing -1: Free thawing (without microwaves) Separation mode
Two different separation modes were carried out: gravitational and vacuum assisted.
The first consisted in drop collecting by gravitational effect without any interference. In
the second, vacuum pressure of 1 kPa (74.7kPa abs) was applied using an aspirator
(Büchi model B-169, Switzerland) to route and increase the movement of the liquid
fraction that was trapped inside the frozen portion. Thawing and separation procedures
were carried out as described in paragraph 2.2.1.Vacuum pump was disconnected in
order to measure mass and solid concentration and reconnected after collecting the
sample.
5.3.3. Data analysis and modeling
Thawing fraction
Thawing fraction (f) was used to follow the development of the process. f is measured
as the ratio between thawed mass and that of the original solution, defined by Eq. (1)
(Nakagawa et al., 2010b) and (Miyawaki et al., 2012):
Freeze concentration of coffee extract: Study of block and falling-film techniques
59
f = mliq/m0 (1)
Where,
f: thawing fraction
mliq : collected liquid mass
m0: initial mass
Solute Yield
Solute yield is defined as the fraction of recovered solute, calculated by the relation
between mass of solids present in the separated liquid and the mass of solute present
initially in the original solution (Nakagawa et al., 2010a):
Y=ms liq/ms 0 (2)
Where,
Y: Solute yield
m s liq: Solute mass in liquid fraction
m s 0: Initial solute mass
Concentration factor
Concentration factor is defined as the relation between the solid concentration in the
liquid fraction and the solid concentration in the initial solution:
CF = Xs liq / X s 0 (3)
Where,
CF: Concentration factor
Xs liq: solid fraction in freeze concentrated liquid fraction
Xs 0: solid fraction in initial solution
Additionally, Y can be obtained as shown in the Eq. 4 by combining Eq. 1, 2 and 3:
Y = CF * f (4)
5.3.4. Mathematical model
Both Solute yield (Y) and thawing fraction (f) vary between 0 and 1. It is important to
note that a diagonal line with slope equal to one in the plot Y against f represents a
process without concentration and is considered a process with a perfect solute
inclusion (Nakagawa et al., 2010a). Therefore, at any point on the diagonal line,
concentration of solids in the portion sample is that of the initial sample as seen from
Eq. (5).
If Y=f ⇒ ms0/m0 =ms liq/m liq (5)
It can be inferred from Y-f plot that the further a point is from the diagonal line, the
higher the concentration of the sample. It is worth pointing out that the behavior of the
FC process in this plot is a curve bounded between the points (0,0) and (1,1). This
relationship can be represented by a "monomolecular" model Eq. (6), which is
Freeze concentration of coffee extract: Study of block and falling-film techniques
60
frequently used in the statistical analysis of nonlinear relationships (Nothnagl et al.,
2004).
dY/df=r(1-Y) (6)
Where,
Y: Solute Yield
f: thawing fraction
r: solute recovery ratio (constant for each condition)
Eq. (7) is obtained solving the differential equation and transforming it into a linear
equation using natural logarithm:
ln(1/(1-Y))=r∙f (7)
Therefore, constant r is the slope of straight line calculated from Eq. (7) and is not
directly related with time. Furthermore, it represents the solute yield per thawed liquid
fraction and can be named “solute recovery ratio”. The higher slope r, the fewer
amount of ice that should be melted to recover a defined amount of solute, thus r can
be used as an indicator of separation quality. Monomolecular model is an intrinsically
linear model with one parameter (r). As CF is the ratio between Y and f according to
Eq. 4, the r parameter can be understood as the change of concentration factor in the
graph Y vs f.
5.3.5. Statistic analysis
Parameters of monomolecular model for each treatment were obtained by a simple
linear regression procedure using SAS 9.2. The result was the r value for each of
twelve evaluated treatments. A ratio comparison with confidence interval procedure at
p<0.05 was used to determine differences of r value between treatments.
Additionally, it is possible to identify the influence of factors TT, TM and SM on solute
recovery ratio (r). The r value can be considered as a functional value, it represents the
relationship between Y and f. A multiple linear regression procedure (p<0.05) was
applied using SAS 9.2 to this purpose. Significance of mean and combined effects on r
value was established.
5.4. Results and discussion
Solute recovery ratio (r), defined in Eq. (7), was obtained for each treatment and these
values are presented in decreasing order in table 5.2. In this table, the best conditions
for solute recovery in freeze concentration correspond to those with the highest r
values. There, it can be seen that regression coefficients vary between 0.93 and 0.99,
showing a good adjustment of the model. The majority of treatments were statistically
different from each other, except for the treatments 10, 11 and 12 that showed
statistically the same values (95% confidence) as well as treatments 1, 4 and 7.
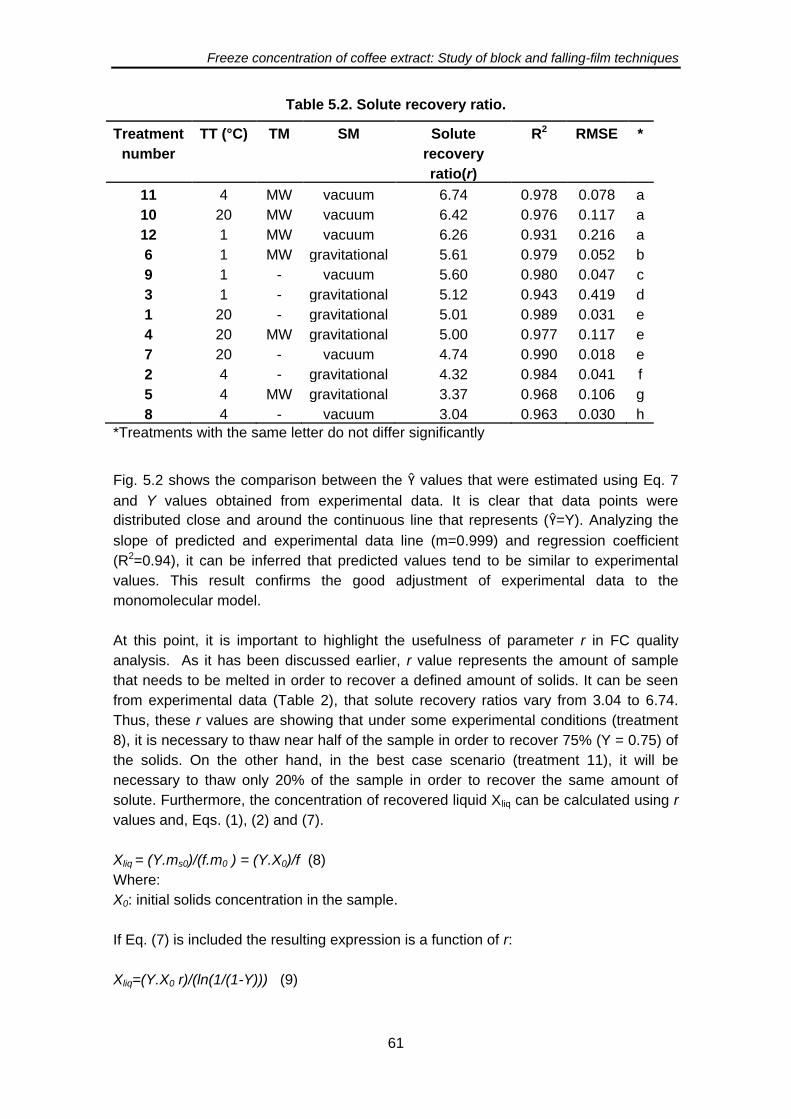
Freeze concentration of coffee extract: Study of block and falling-film techniques
61
Table 5.2. Solute recovery ratio.
Treatment
number
TT (°C) TM SM Solute
recovery
ratio(r)
R2 RMSE *
11 4 MW vacuum 6.74 0.978 0.078 a
10 20 MW vacuum 6.42 0.976 0.117 a
12 1 MW vacuum 6.26 0.931 0.216 a
6 1 MW gravitational 5.61 0.979 0.052 b
9 1 - vacuum 5.60 0.980 0.047 c
3 1 - gravitational 5.12 0.943 0.419 d
1 20 - gravitational 5.01 0.989 0.031 e
4 20 MW gravitational 5.00 0.977 0.117 e
7 20 - vacuum 4.74 0.990 0.018 e
2 4 - gravitational 4.32 0.984 0.041 f
5 4 MW gravitational 3.37 0.968 0.106 g
8 4 - vacuum 3.04 0.963 0.030 h
*Treatments with the same letter do not differ significantly
Fig. 5.2 shows the comparison between the Ŷ values that were estimated using Eq. 7
and Y values obtained from experimental data. It is clear that data points were
distributed close and around the continuous line that represents (Ŷ=Y). Analyzing the
slope of predicted and experimental data line (m=0.999) and regression coefficient
(R2=0.94), it can be inferred that predicted values tend to be similar to experimental
values. This result confirms the good adjustment of experimental data to the
monomolecular model.
At this point, it is important to highlight the usefulness of parameter r in FC quality
analysis. As it has been discussed earlier, r value represents the amount of sample
that needs to be melted in order to recover a defined amount of solids. It can be seen
from experimental data (Table 2), that solute recovery ratios vary from 3.04 to 6.74.
Thus, these r values are showing that under some experimental conditions (treatment
8), it is necessary to thaw near half of the sample in order to recover 75% (Y = 0.75) of
the solids. On the other hand, in the best case scenario (treatment 11), it will be
necessary to thaw only 20% of the sample in order to recover the same amount of
solute. Furthermore, the concentration of recovered liquid Xliq can be calculated using r
values and, Eqs. (1), (2) and (7).
Xliq = (Y.ms0)/(f.m0 ) = (Y.X0)/f (8)
Where:
X0: initial solids concentration in the sample.
If Eq. (7) is included the resulting expression is a function of r:
Xliq=(Y.X0 r)/(ln(1/(1-Y))) (9)
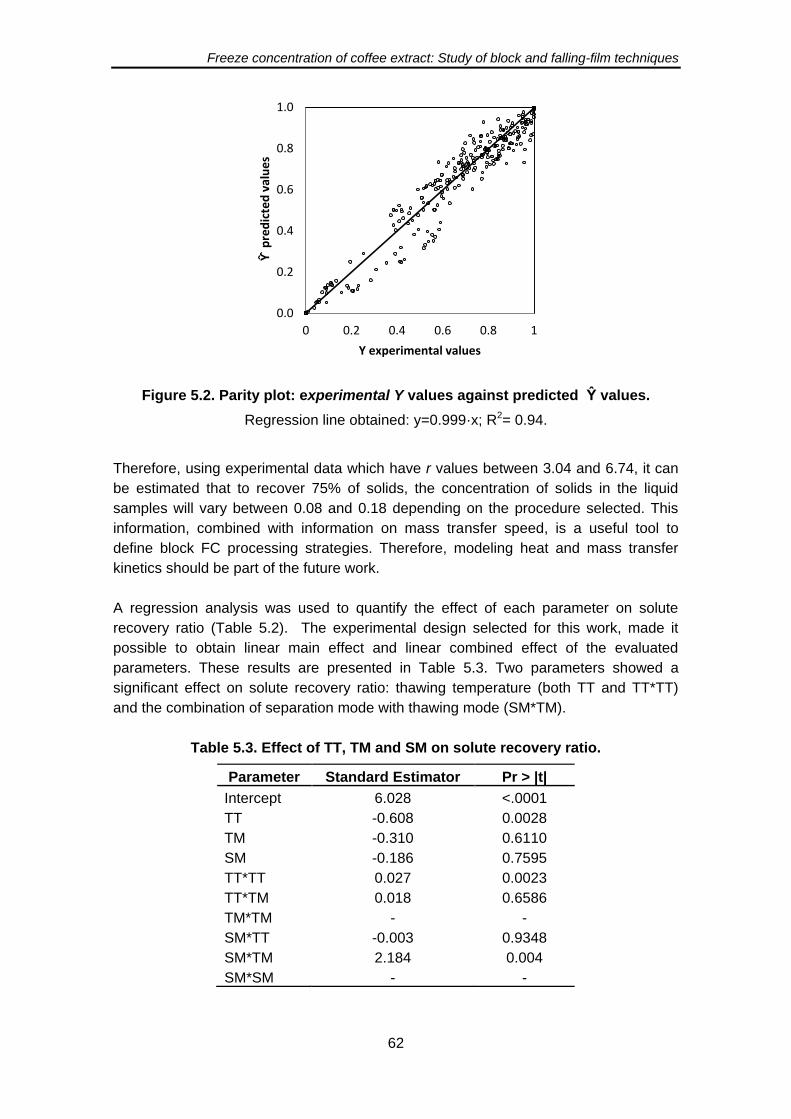
Freeze concentration of coffee extract: Study of block and falling-film techniques
62
Figure 5.2. Parity plot: experimental Y values against predicted Ŷ values.
Regression line obtained: y=0.999·x; R2= 0.94.
Therefore, using experimental data which have r values between 3.04 and 6.74, it can
be estimated that to recover 75% of solids, the concentration of solids in the liquid
samples will vary between 0.08 and 0.18 depending on the procedure selected. This
information, combined with information on mass transfer speed, is a useful tool to
define block FC processing strategies. Therefore, modeling heat and mass transfer
kinetics should be part of the future work.
A regression analysis was used to quantify the effect of each parameter on solute
recovery ratio (Table 5.2). The experimental design selected for this work, made it
possible to obtain linear main effect and linear combined effect of the evaluated
parameters. These results are presented in Table 5.3. Two parameters showed a
significant effect on solute recovery ratio: thawing temperature (both TT and TT*TT)
and the combination of separation mode with thawing mode (SM*TM).
Table 5.3. Effect of TT, TM and SM on solute recovery ratio.
Parameter Standard Estimator Pr > |t|
Intercept 6.028 <.0001
TT -0.608 0.0028
TM -0.310 0.6110
SM -0.186 0.7595
TT*TT 0.027 0.0023
TT*TM 0.018 0.6586
TM*TM - -
SM*TT -0.003 0.9348
SM*TM 2.184 0.004
SM*SM - -
0.0
0.2
0.4
0.6
0.8
1.0
0 0.2 0.4 0.6 0.8 1
Ŷ p
red
icte
d v
alu
es
Y experimental values
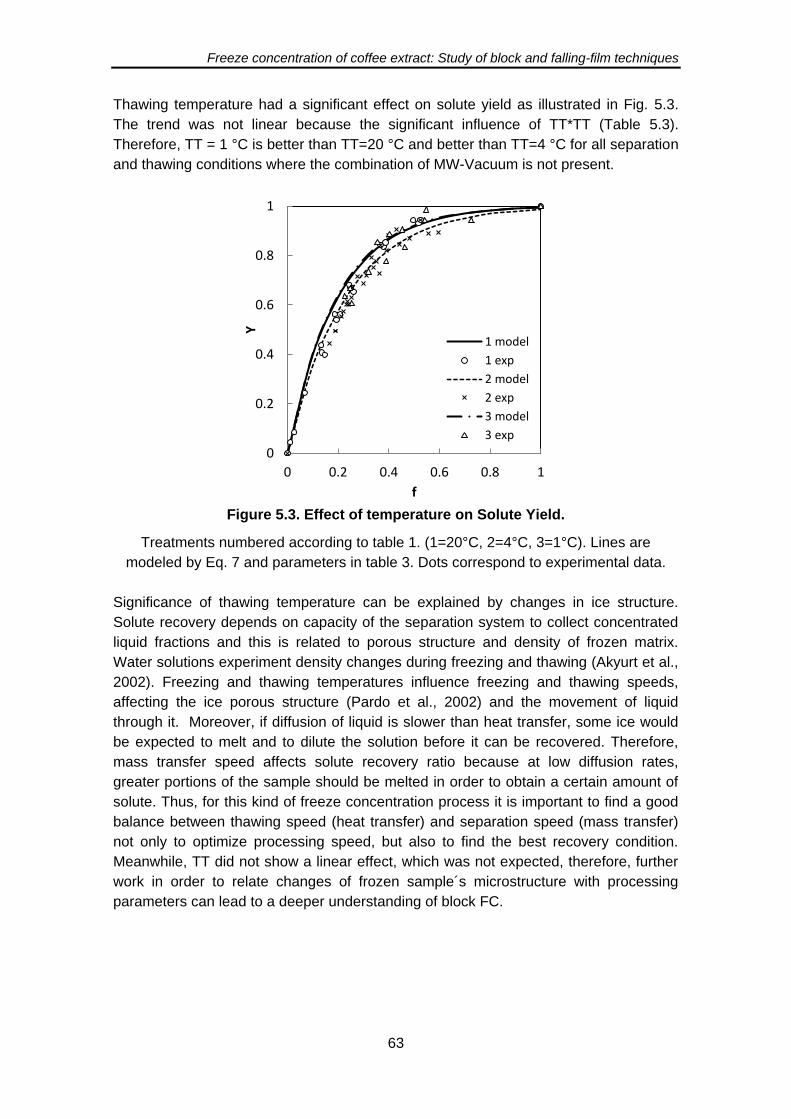
Freeze concentration of coffee extract: Study of block and falling-film techniques
63
Thawing temperature had a significant effect on solute yield as illustrated in Fig. 5.3.
The trend was not linear because the significant influence of TT*TT (Table 5.3).
Therefore, TT = 1 °C is better than TT=20 °C and better than TT=4 °C for all separation
and thawing conditions where the combination of MW-Vacuum is not present.
Figure 5.3. Effect of temperature on Solute Yield.
Treatments numbered according to table 1. (1=20°C, 2=4°C, 3=1°C). Lines are
modeled by Eq. 7 and parameters in table 3. Dots correspond to experimental data.
Significance of thawing temperature can be explained by changes in ice structure.
Solute recovery depends on capacity of the separation system to collect concentrated
liquid fractions and this is related to porous structure and density of frozen matrix.
Water solutions experiment density changes during freezing and thawing (Akyurt et al.,
2002). Freezing and thawing temperatures influence freezing and thawing speeds,
affecting the ice porous structure (Pardo et al., 2002) and the movement of liquid
through it. Moreover, if diffusion of liquid is slower than heat transfer, some ice would
be expected to melt and to dilute the solution before it can be recovered. Therefore,
mass transfer speed affects solute recovery ratio because at low diffusion rates,
greater portions of the sample should be melted in order to obtain a certain amount of
solute. Thus, for this kind of freeze concentration process it is important to find a good
balance between thawing speed (heat transfer) and separation speed (mass transfer)
not only to optimize processing speed, but also to find the best recovery condition.
Meanwhile, TT did not show a linear effect, which was not expected, therefore, further
work in order to relate changes of frozen sample´s microstructure with processing
parameters can lead to a deeper understanding of block FC.
0
0.2
0.4
0.6
0.8
1
0 0.2 0.4 0.6 0.8 1
Y
f
1 model
1 exp
2 model
2 exp
3 model
3 exp
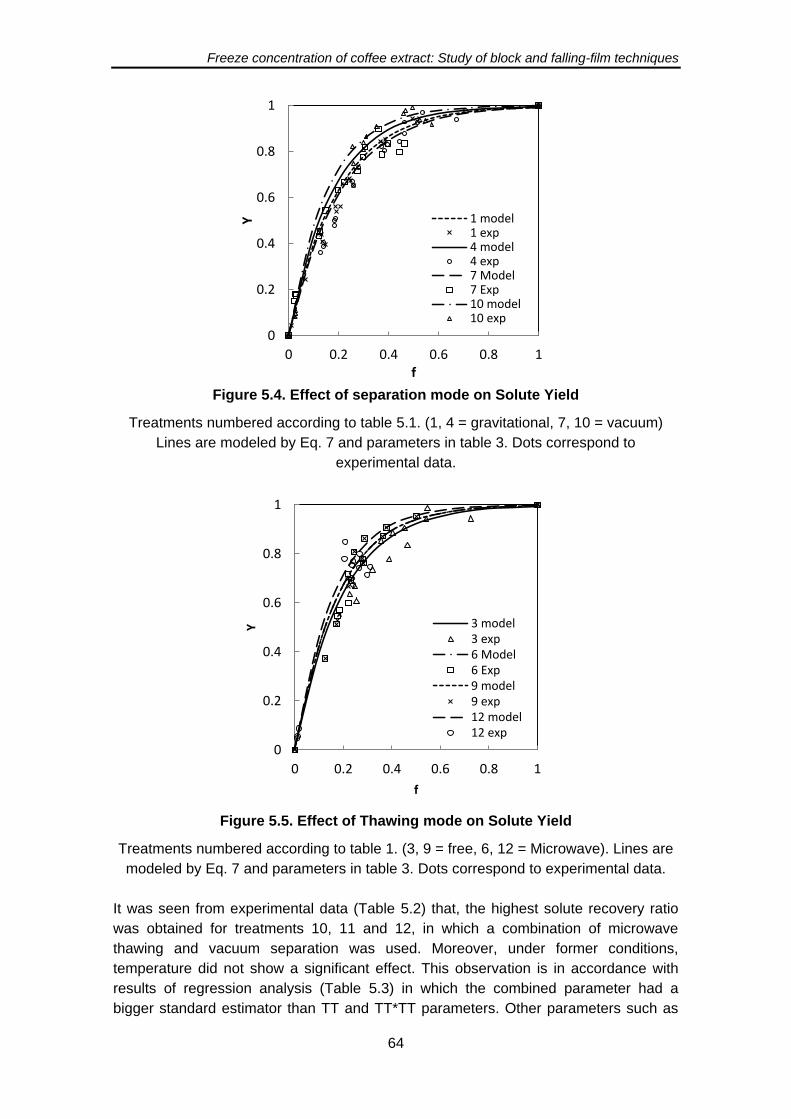
Freeze concentration of coffee extract: Study of block and falling-film techniques
64
Figure 5.4. Effect of separation mode on Solute Yield
Treatments numbered according to table 5.1. (1, 4 = gravitational, 7, 10 = vacuum)
Lines are modeled by Eq. 7 and parameters in table 3. Dots correspond to
experimental data.
Figure 5.5. Effect of Thawing mode on Solute Yield
Treatments numbered according to table 1. (3, 9 = free, 6, 12 = Microwave). Lines are
modeled by Eq. 7 and parameters in table 3. Dots correspond to experimental data.
It was seen from experimental data (Table 5.2) that, the highest solute recovery ratio
was obtained for treatments 10, 11 and 12, in which a combination of microwave
thawing and vacuum separation was used. Moreover, under former conditions,
temperature did not show a significant effect. This observation is in accordance with
results of regression analysis (Table 5.3) in which the combined parameter had a
bigger standard estimator than TT and TT*TT parameters. Other parameters such as
0
0.2
0.4
0.6
0.8
1
0 0.2 0.4 0.6 0.8 1
Y
f
1 model1 exp4 model4 exp7 Model7 Exp10 model10 exp
0
0.2
0.4
0.6
0.8
1
0 0.2 0.4 0.6 0.8 1
Y
f
3 model3 exp6 Model6 Exp9 model9 exp12 model12 exp

Freeze concentration of coffee extract: Study of block and falling-film techniques
65
TM and SM had no significant influence when analyzed alone. A similar result, where
MW thawing has not a significant effect on separation efficiency was reported by (Aider
and Ounis, 2012). Fig. 5.4, 5.5 and 5.6 depict this situation, in which the effect of
microwave thawing and vacuum separation is significant only when both of them are
present in the treatment.
Experimental results showed that r value was increased up to two times when MW was
combined with vacuum separation. This means that a similar Y can be reached with a
lower f, increasing concentration of separated liquid portion. On the other hand, effect
of vacuum was very small without microwave assisted thawing as it is showed in Fig.
5.5. Actually, r values decreased when vacuum was present, but table 5.3 shows that
this effect is not significant when compared with other parameters. This suggests that
vacuum separation promotes the separation of concentrated liquid fraction from the ice
matrix and increases process efficiency only when microwave thawing is present.
Therefore, this synergy present when MW and vacuum are combined shows that this
operating condition is an appropriate tool to improve separation quality in block FC.
Figure 5.6. Effect of Thawing mode on Solute Yield
Treatments numbered according to table 1. (2, 8 = free, 5, 11 = Microwave). Lines are
modeled by Eq 7 and parameters in table 5.3. Dots correspond to experimental data.
This synergistic behavior can be explained using two different mechanisms:
accelerated internal thawing and hydrodynamic movement of molten portions of the
sample. As it is known, the absorbed microwave energy is related to the loss factor of
the material. Thus, substances with a high loss factor will readily absorb microwave
energy, while those with a low loss factor are either reflecting or transparent to
microwave energy (Wu et al., 2004), (Wang et al., 2011). It is important to highlight that
loss factor of liquid water is greater than that of ice (Ryyniinen, 1995). Microwave can
penetrate frozen layer and reach up the unfrozen liquid (Rattanadecho, 2004).
Therefore, it would be expected that during a microwave pulse, liquid pockets will be
formed in regions with higher concentration of solids and lower melting points.
0
0.2
0.4
0.6
0.8
1
0 0.2 0.4 0.6 0.8 1
Y
f
2 model2 exp5 Model5 Exp8 model8 exp11 model11 exp
Freeze concentration of coffee extract: Study of block and falling-film techniques
66
However, these liquid pockets cannot be easily separated from the sample because of
the tortuosity of diffusion path inside the frozen matrix. Here, vacuum plays a
synergistic role because pressure difference helps evacuating the concentrated liquid
phase easily promoting liquid movement and separation. Experimental data showed
that this hydrodynamic movement enabled by vacuum is a good way to accelerate
liquid removal. Therefore, in a future paper, the effect of these parameters on the Block
FC process kinetics will be analyzed.
As solute yield indicates the amount of solute recovery but not the process velocity, it is
useful to combine this parameter with the analysis of thawing time. Thawing time (t)
required to collect 50% of liquid (t at f=0.5) is showed in table 4 in increasing order.
Also, the Solute yield at the moment (Y at f=0.5) and the concentration factor (CF at
f=0.5) are presented.
Thawing time was lower for treatments 10, 4, 7, and 1, which correspond to TT= 20°C.
Treatments with TT=4°C and TT=1°C presented until 25 times more thawing time. The
result is similar for solute recovery rate, in which TT showed a significant effect.
Comparing treatments with the same TT, microwave thawing slightly allows spending
less time.
Vacuum separation helped to reduce t slightly. At the same time, vacuum separation
allowed to recover more solute. This suggests that vacuum separation promotes
separation of concentrated liquid fraction from the ice matrix and increases process
efficiency, showing this separation mode as an interesting topic in block FC.
The concentration factor (CF) at 50% of thawing is presented for each condition.
Values between 1.4 and 1.9 were obtained. These values are comparable with those
obtained using other concentration techniques`. For example, in falling film FC, CF is
around 2 for one stage of FC (Raventós et. al., 2007), in progressive FC, where CF is
around 2.8 (Miyawaki et. all, 2005), in Block FC, CF=1.4 without separation assistance
(Nakagawa et. al., 2010) and in microwave assisted thawing Block FC, CF is close to
1.7 (Aider and Ounis, 2012) for one stage. The highest CF was obtained for treatments
with vacuum separation, due to the positive effect of pressure difference on the
movement of the concentrated liquid fraction.
On the other hand the lowest thawing time was obtained for treatment 10 (TT=20°C,
MW thawing and vacuum separation). The same treatment showed the highest solute
recovery rate. Consequently, this condition is appropriate for the performance of FC,
recovering 98% of solute when 50% of mass is thawed and just spending 2.7 h of
thawing.
5.5. Conclusions
The relationship between solute yield and thawing fraction can be represented using
the monomolecular model. Linearization of this model, using slope r which is not
related to time, allows to ease analysis in terms of the separation efficiency, and quality
Freeze concentration of coffee extract: Study of block and falling-film techniques
67
of the recovered liquid. Combination of microwave assisted thawing and vacuum
separation exerts a synergistic positive effect on solute recovery ratio. Experimental
results showed that this operating condition is an appropriate tool to improve
separation quality in block FC. Thawing temperature has a significant effect on solute
recovery ratio; both TT and TT*TT, are highly influential parameters. Therefore, under
the experimental conditions used in this work temperature did not show a linear effect
on separation quality. Block freeze-concentration is a potential technology for food
concentration. Process alternatives such as, thawing temperature control, microwave
thawing and vacuum separation are helpful to increase solute recovery and should be
taken into account when scaling up this technology.
5.6. References
Aider, M. and de Halleux, D. 2008a, Passive and microwave-assisted thawing in maple
sap cryoconcentration technology. J Food Eng, 85: 65-72.
Aider, M., de Halleux, D. and Melnikova, I. 2008b, Gravitational and microwave-
assisted thawing during milk whey cryoconcentration. J Food Eng, 88, 373-380.
Aider, M. and de Halleux, D. 2009, Cryoconcentration technology in the bio-food
industry: principles and applications. LWT Food Sci Technol, 42: 679-685.
Aider, M. and Ounis, W. B. 2012, Skim milk cryoconcentration is affected by the
thawing mode: gravitational vs. microwave-assisted. Int J Food Sci Technol, 47:
195-202.
Akyurt, M., Zaki, G. and Habeebullah, B. 2002, Freezing phenomena in ice – water
systems. Energy Convers Manag, 43: 1773-1789.
Boss, E. A., Filho, R. M. and de Toledo, E. C. V. 2004, Freeze drying process: real time
model and optimization. Chem Eng Process, 43: 1475-1485.
Burdo, O. G., Kovalenko, E. and Kharenko, D. 2008, Intensification of the processes of
low-temperature separation of food solutions. Appl Therm Eng, 28: 311-316.
Esquivel P. and Jiménez, V. M. Functional properties of coffee and coffee by-products.
Food Research International, 2012, 46, 488-495.
Gao, W., Habib, M. and Smith, D. W. 2009, Removal of organic contaminants and
toxiciy from industrial effluents using freezing processes. Desalination, 245: 108-
119.
Habib, B. and Farid, M. 2006, Heat transfer and operating conditions for freeze
concentration in a liquid–solid fluidized bed heat exchanger. Chem Eng Process, 45:
698-710.
Huige, N. J. J. and Thijssen, H. A. C. 1972, Production of large crystals by continuous
ripening in a stirrer tank. J Cryst Growth: 483-487.
Joët, T., Laffargue, A., Descroix, F., Doulbeau, S., Bertrand, B., Kochko, A. D. and
Dussert, S. 2010, Influence of environmental factors, wet processing and their
interactions on the biochemical composition of green Arabica coffee beans. Food
Chemistry, 118: 693-701.
Freeze concentration of coffee extract: Study of block and falling-film techniques
68
Miyawaki, O., Kato, S. and Watabe, K. 2012, Yield improvement in progressive freeze-
concentration by partial melting of ice. J Food Eng, 108: 377-382.
Miyawaki, O., Liu, L., Shirai, Y., Sakashita, S. and Kagitani, K. 2005, Tubular ice
system for scale-up of progressive freeze-concentration. J Food Eng, 69: 107-113.
Nakagawa, K., Maebashi, S. and Maeda, K. 2010a. Freeze-thawing as a path to
concentrate aqueous solution. Sep Purif Technol, 73: 403-408.
Nakagawa, K., Nagahama, H., Maebashi, S. and Maeda, K. 2010b, Usefulness of
solute elution from frozen matrix for freeze-concentration technique. Chem Eng Res
Des, 88: 718-724.
Nothnagl, M., Kosiba, A. and Larsen R. 2004, Predicting the effect of irradiance and
temperature on the flower diameter of greenhouse grown Chrysanthemum. Sci Horti
99: 319–329.
Okawa, S., Ito, T. and Saito, A. 2009, Effect of crystal orientation on freeze
concentration of solutions. Int J Refrig, 32: 246-252.
Pardo, J. M., Suess, F., and Niranjan, K. 2002, An investigation into the relationship
between freezing rate and mean ice crystal size of coffee extracts. Trans IChemE,
80: 176-182.
Rattanadecho, P. 2004, Theoretical and experimental investigation of microwave
thawing of frozen layer using a microwave oven (effects of layered configurations
and layer thickness). Int J Heat Mass Transf. 47: 937-945.
Raventós, M., Hernández, E., Auleda, J. and Ibarz, A. 2007, Concentration of aqueous
sugar solutions in a multi-plate cryoconcentrator. J Food Eng, 79: 577-585.
Ryyniinen, S. 1995, The Electromagnetic Properties of Food Materials : A Review of
the Basic Principles. J Food Eng, 26: 409-429.
Sánchez, J., Ruiz, Y., Auleda, J. M., Hernandez, E. and Raventós, M. 2009, Review.
Freeze Concentration in the Fruit Juices Industry. Food Sci Technol Int, 15: 303-
315.
Sánchez, J., Hernández, E., Auleda, J. M. and Raventós, M. 2011a, Review: freeze
concentration technology applied to dairy products. Food Sci Technol Int, 17: 5-13.
Sánchez, J., Hernández, E., Auleda, J. M. and Raventós, M. 2011b, Freeze
concentration of whey in a falling-film based pilot plant: Process and
characterization. J of Food Eng, 103: 147-155.
Wang, R., Zhang, M., Mujumdar, A. S. and Jiang, H. 2011, Effect of salt and sucrose
content on dielectric properties and microwave freeze drying behavior of re-
structured potato slices. J Food Eng, 106: 290-297.
Wu, H., Tao, Z., Chen, G., Deng, H., Xu, G. and Ding, S. 2004, Conjugate heat and
mass transfer process within porous media with dielectric cores in microwave freeze
drying. Chem Eng Sci, 59: 2921-2928.
Freeze concentration of coffee extract: Study of block and falling-film techniques
69
6. BEHAVIOUR OF FALLING-FILM FREEZE CONCENTRATION OF COFFEE
EXTRACT
6.1. ABSTRACT
The behaviour of falling-film freeze concentration of coffee extract was studied through
determining the solute inclusion in the ice produced in a single-plate freeze
concentrator. The effect of the initial coffee mass fraction of the extract, the average ice
growth rate and the film velocity were studied. The coffee extract at four coffee mass
fractions (0.05, 0.15, 0.25 and 0.35 w/w) was freeze concentrated at three different
cooling temperatures (-10, -15 and -20°C) and three flow rates (5·10-5, 7.5·10-5 and
10·10-5 m3·s-1). The solute inclusion in the ice and the effect of each parameter were
determined. The coffee mass fraction, ice growth rate and film velocity affected the
average distribution coefficient. The coffee mass fraction had the greatest effect on
average distribution coefficient. The Chen model parameters to predict the average
distribution coefficient and the concentration index were found. A logistical model was
proposed to predict the concentration reached in successive stages, which tended to
35% at the studied intervals. The model showed an adjusted regression coefficient of
0.98 and the experimental values were within the 95% confidence intervals. The model
can be used to predict the behaviour of falling film freeze concentration of coffee
extract; this technique is an economic and simple alternative to conventional freeze
concentration.
Keywords: cryoconcentration; coffee; average distribution coefficient; falling-film;
modelling
Nomenclature
a: width of the ice sheet (m)
CI: concentration index (unitless)
f: liquid fraction (unitless)
g: acceleration due to gravity (9.8 m s-1)
h: height of the ice sheet (m)
K: average distribution coefficient (unitless)
m ice: mass of the ice sheet (kg)
m s 0: initial solute mass (unitless)
m s liq: solute mass in the liquid fraction (kg)
m0: initial mass (kg)
mliq: collected liquid mass (kg)
n: number of stages (unitless)
Q: fluid flow rate (m3·s-1)
T: temperature (°C)
Freeze concentration of coffee extract: Study of block and falling-film techniques
70
t: time of freezing (s)
Us,∞: fluid film velocity (m·s-1)
V ice: average ice growth rate (mm·s-1)
X s ice: coffee mass fraction in the ice (w/w)
Xs 0: coffee mass fraction in the initial solution (w/w)
Xs liq: coffee mass fraction in the freeze-concentrated liquid fraction (w/w)
Y: solute yield (unitless)
η: coffee extract viscosity (Pa·s)
ρ: coffee extract density (Kg·m-3)
ρ c: coffee solids density (Kg·m-3)
ρ ice: ice density (Kg·m-3)
ρ w: water density (Kg·m-3)
6.2. Introduction
Freeze concentration (FC) is a technique used to remove water from solutions by
cooling the solution until ice crystals are produced and separated (Sánchez et al.,
2009). The final liquid fraction has a higher concentration than the initial solution
because of the water removed in the form of ice. This technique is used in the food
industry due to its ability to preserve sensitive properties in products such as coffee
extract.
Depending on the growth of ice crystals, there are three techniques of FC, suspension
FC, film FC (progressive or falling-film FC) and block FC (also known as freeze-thaw
FC) (Aider and de Halleux, 2009; Boaventura et al., 2013; Sánchez et al., 2011a).
Suspension FC is the most implemented technique in the coffee industry. This is an
efficient technique to obtain high ice purity despite the high operational costs (Miyawaki
et al., 2005; Qin et al., 2006; Sánchez et al, 2011a; Van der Ham et al., 2004).
The falling-film freeze concentration (FFFC) is a simple technique in which the solution
to be concentrated is re-circulated on a cooled vertical plate. The fluid descends in a
film, and an ice sheet is produced by freezing. The ice forms a single layer on the cold
surface. The solution is collected and re-circulated continuously (Sánchez et al.,
2011b). FFFC has been studied with several food fluids (Belén et al., 2013; Chen et al.,
1998; Flesland, 1995; Hernández et al., 2009, 2010; Raventós et al., 2007; Sánchez et
al., 2010). Coffee extract freeze concentration has been studied using the block
technique (Moreno et al., 2014b; Moreno et al., 2013) and progressive FC (Miyawaki et
al., 2005). Moreno et al. (2014a) studied falling-film freeze concentration to propose an
alternative process to concentrate coffee extract.
The solutes retained in the ice sheets determine the concentration efficiency (Raventós
et al., 2007). Although the solute can be recovered by partial thawing of the ice (Gulfo
et al., 2013), a low amount of solute occluded in the ice is desired. One way to express
the level of solid occlusion is the average distribution coefficient. The average
distribution coefficient is defined as the ratio between the concentration of solute in the
liquid fraction and the concentration of solute in the ice. Chen and Chen (2000) studied
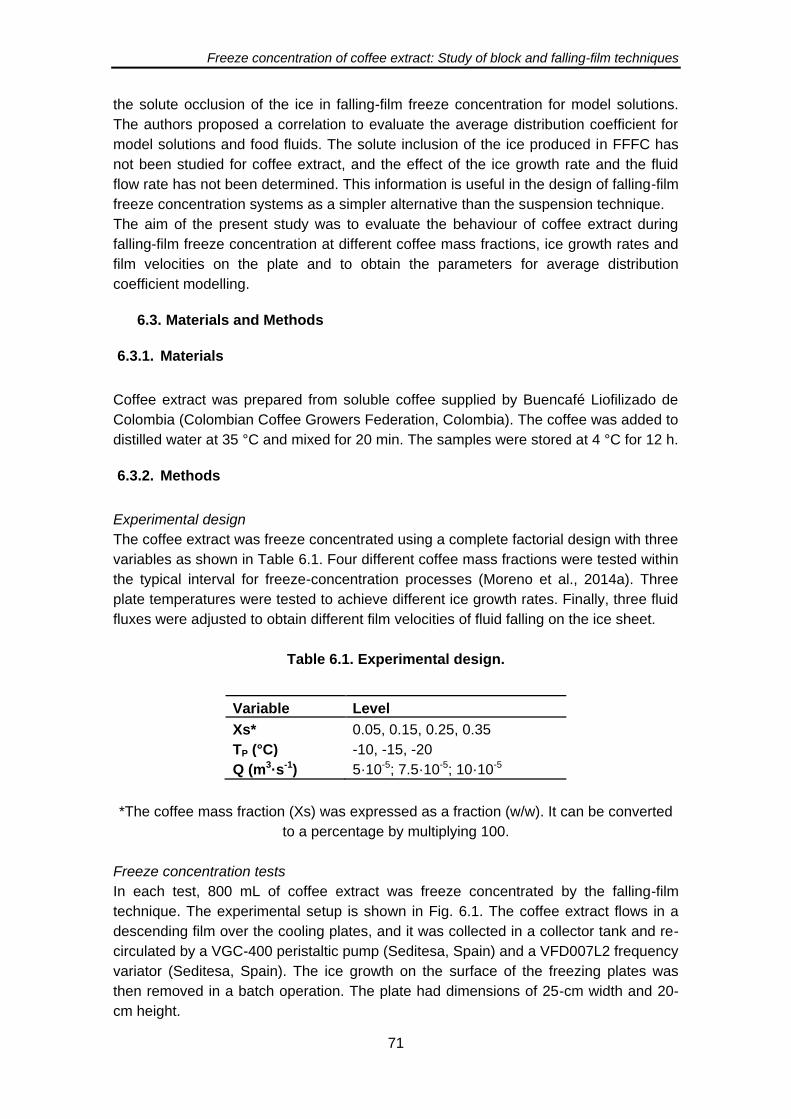
Freeze concentration of coffee extract: Study of block and falling-film techniques
71
the solute occlusion of the ice in falling-film freeze concentration for model solutions.
The authors proposed a correlation to evaluate the average distribution coefficient for
model solutions and food fluids. The solute inclusion of the ice produced in FFFC has
not been studied for coffee extract, and the effect of the ice growth rate and the fluid
flow rate has not been determined. This information is useful in the design of falling-film
freeze concentration systems as a simpler alternative than the suspension technique.
The aim of the present study was to evaluate the behaviour of coffee extract during
falling-film freeze concentration at different coffee mass fractions, ice growth rates and
film velocities on the plate and to obtain the parameters for average distribution
coefficient modelling.
6.3. Materials and Methods
6.3.1. Materials
Coffee extract was prepared from soluble coffee supplied by Buencafé Liofilizado de
Colombia (Colombian Coffee Growers Federation, Colombia). The coffee was added to
distilled water at 35 °C and mixed for 20 min. The samples were stored at 4 °C for 12 h.
6.3.2. Methods
Experimental design
The coffee extract was freeze concentrated using a complete factorial design with three
variables as shown in Table 6.1. Four different coffee mass fractions were tested within
the typical interval for freeze-concentration processes (Moreno et al., 2014a). Three
plate temperatures were tested to achieve different ice growth rates. Finally, three fluid
fluxes were adjusted to obtain different film velocities of fluid falling on the ice sheet.
Table 6.1. Experimental design.
Variable Level
Xs* 0.05, 0.15, 0.25, 0.35
TP (°C) -10, -15, -20
Q (m3·s-1) 5·10-5; 7.5·10-5; 10·10-5
*The coffee mass fraction (Xs) was expressed as a fraction (w/w). It can be converted
to a percentage by multiplying 100.
Freeze concentration tests
In each test, 800 mL of coffee extract was freeze concentrated by the falling-film
technique. The experimental setup is shown in Fig. 6.1. The coffee extract flows in a
descending film over the cooling plates, and it was collected in a collector tank and re-
circulated by a VGC-400 peristaltic pump (Seditesa, Spain) and a VFD007L2 frequency
variator (Seditesa, Spain). The ice growth on the surface of the freezing plates was
then removed in a batch operation. The plate had dimensions of 25-cm width and 20-
cm height.
Freeze concentration of coffee extract: Study of block and falling-film techniques
72
2
1
3
4
5
67
Figure 6.1. Experimental setup.
(1) Chamber; (2) Cooling bath; (3) Cooling plate; (4) Distribution duct; (5) Ice sheet; (6)
collector vessel; (7) pump.
The coffee mass fraction of the liquid fraction and the ice were measured after one
hour of processing by a Pal 100 refractometer (Atago, Japan). The coffee mass fraction
is defined as the mass of coffee solids per unit of coffee solution mass. The
relationship between Brix degrees and XS is represented by the equation XS=0.0087
°Brix reported by Moreno et al. (2014c) for the same product used in the present work.
Mathematical model
The solid inclusion in the ice is determined by the average distribution coefficient. The
concentration of the solute in the solid and liquid fractions can be calculated from this
value. The average distribution coefficient is defined as the ratio of the coffee mass
fraction of the ice to the coffee mass fraction of the freeze concentrated liquid as shown
in Eq. (1).
(1)
The mathematical model used in the present work was proposed by Chen et al. (1998).
The model expressed the average distribution coefficient as a function of the ice growth
rate on the plate of a falling-film freeze concentrator and the film velocity of the fluid on
the ice sheet produced.
The average ice growth rate depends on the heat transfer rate, the degree of
supercoiling and the thickness of the ice film, among other variables (Qin et al, 2009).
The average ice growth rate is related to the plate temperature. The average ice
growth rate was calculated from the mass of the ice sheet at the end of the process,
the solid concentration in the ice, the process time, the ice density and the dimensions
of the plate, according to the Eq. (2) (Chen et al., 1998).
(2)
Meanwhile, the fluid film velocity depends on the fluid flux regulated through the pump,
the viscosity and density of the coffee extract and the dimensions of the plate. The film
Freeze concentration of coffee extract: Study of block and falling-film techniques
73
velocity is related to the mass transfer coefficient which is proportional to the fluid
velocity to a power of 0.5 (Chen et al., 1998). Consequently, the Chen model includes
the average ice growth rate and the falling film velocity to represent heat transfer and
mass transfer rates. The fluid film velocity was calculated by Eq. (3). The Eq. (3) is
valid for films descending on a plate, in laminar flow and without superficial traction
forces (Rane and Jabade, 2005; Perry et al. 1992).
(
) ⁄ (3)
The viscosity and density of the coffee extract were calculated from the average coffee
mass fraction and the average temperature of the extract using Eq. (4) and Eq. (5-7),
respectively. Eq. (4-7) were reported by Moreno et al. (2014c) for the same coffee used
in the present work and the same temperature and concentrations intervals used in
these tests.
(
) (
) (4)
( )
(5)
(6)
(7)
Once the model variables were calculated, the correlation can be applied for prediction
of the average distribution coefficient. This correlation is presented in Eq. (8). The
equation proposed by Chen and Chen (2000) is composed of a term related to the
coffee mass fraction, a term related to the heat transfer and mass transfer and an
independent term.
(8)
The assumptions of the model presented in Eq. (8) were the following: The solid
distribution in the ice is uniform, the falling-film flows in laminar flow, the ice growth rate
is the average of the ice growth rates during the process, the time of one stage is 60
min and the freezing process is developed in vertical plate.
The concentration index, the solute yield and the liquid fraction are variables used to
evaluate the behaviour of the freeze concentration process. They can be calculated
from the average distribution coefficient. The liquid fraction is the ratio of the mass of
the concentrated liquid fraction to the mass of the original solution defined by Eq. (9)
(Miyawaki et al., 2012; Nakagawa et al., 2010).
f = mliq/m0 (9)
The solute yield was defined as the ratio of the mass of solute present in the separated
liquid to the mass of solute present in the original solution and was calculated by Eq.
(10) (Moreno et al., 2013; Nakagawa et al., 2010).
Freeze concentration of coffee extract: Study of block and falling-film techniques
74
Y=ms liq/ms 0 (10)
The concentration index was used to express the concentration of solutes reached
after the FC process. The concentration index, CI, was defined as the ratio of the solid
concentration in the liquid fraction to the solid concentration in the initial solution. CI is
also known as relative concentration (Nakagawa et al., 2009).
CI = Xs liq / X s 0 (11)
Eq. (12) can be obtained by combination of Eq. (9-11).
Y= f * CI (12)
Eq. (13) and Eq. (14) were obtained by combining Eq. (1) and Eq. (12) and by the
application of mass balance.
(13)
(14)
The average distribution coefficient can be predicted from Eq. (8) at different
operational conditions of the freeze-concentration process. The amount of solute
recovery and the concentration index can be calculated from Eq. (13 -14) for different
liquid or ice fractions.
Statistical analysis
The parameters of Eq. (8) and Eq. (16) were fit by the least squares regression
method. A multiple regression analysis was performed using the statistical software
SAS 9.0. The fit was evaluated by the adjusted regression coefficient. The 95%
confidence intervals were calculated.
6.4. Results
6.4.1. Effect of the average ice growth rate and the fluid velocity
The effect of the ratio of average ice growth rate to fluid velocity to the power of 0.5 on
the average distribution coefficient at different coffee mass fractions is shown in Fig.
6.2. The average distribution coefficient increased with the velocities ratio. A high value
of K indicates greater occlusion of solids in the ice sheet and lower concentration
efficiency. The ratio of velocities is proportional to the ice growth rate and inverse to the
squared root of the fluid velocity. The ratio, and consequently the average distribution
coefficient, increased with the ice growth rate and decreased with the fluid film velocity.
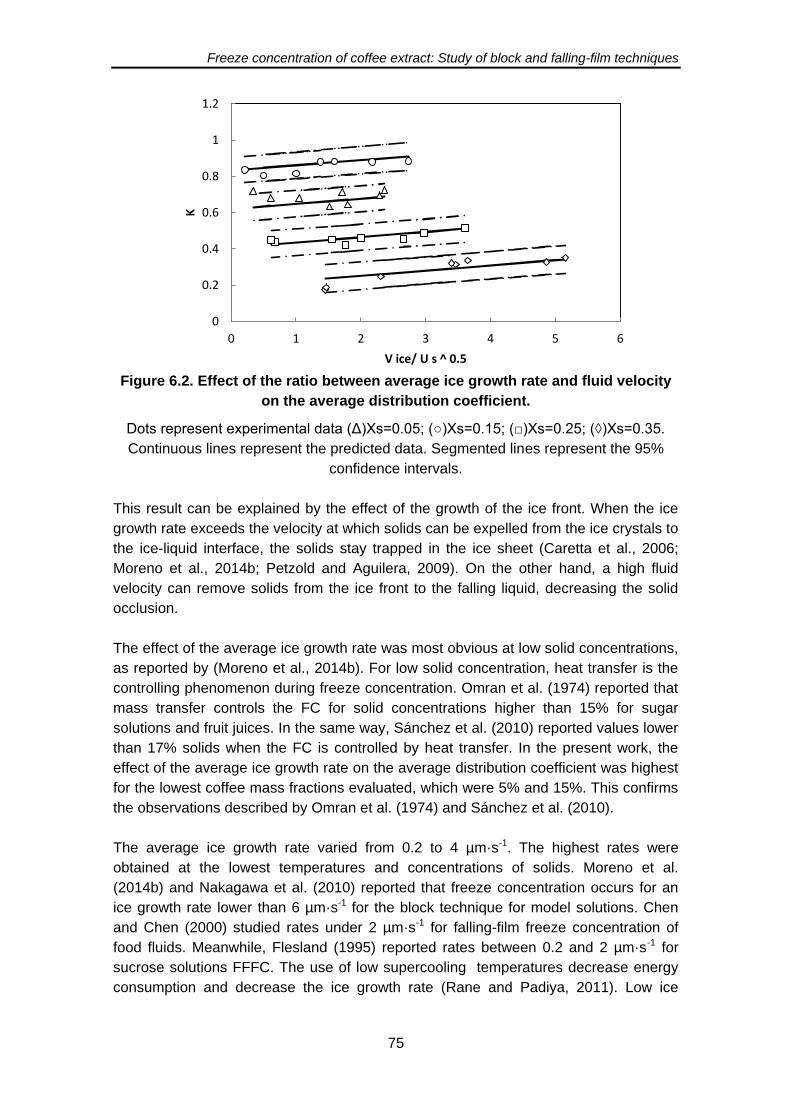
Freeze concentration of coffee extract: Study of block and falling-film techniques
75
Figure 6.2. Effect of the ratio between average ice growth rate and fluid velocity
on the average distribution coefficient.
Dots represent experimental data (Δ)Xs=0.05; (○)Xs=0.15; (□)Xs=0.25; (◊)Xs=0.35.
Continuous lines represent the predicted data. Segmented lines represent the 95%
confidence intervals.
This result can be explained by the effect of the growth of the ice front. When the ice
growth rate exceeds the velocity at which solids can be expelled from the ice crystals to
the ice-liquid interface, the solids stay trapped in the ice sheet (Caretta et al., 2006;
Moreno et al., 2014b; Petzold and Aguilera, 2009). On the other hand, a high fluid
velocity can remove solids from the ice front to the falling liquid, decreasing the solid
occlusion.
The effect of the average ice growth rate was most obvious at low solid concentrations,
as reported by (Moreno et al., 2014b). For low solid concentration, heat transfer is the
controlling phenomenon during freeze concentration. Omran et al. (1974) reported that
mass transfer controls the FC for solid concentrations higher than 15% for sugar
solutions and fruit juices. In the same way, Sánchez et al. (2010) reported values lower
than 17% solids when the FC is controlled by heat transfer. In the present work, the
effect of the average ice growth rate on the average distribution coefficient was highest
for the lowest coffee mass fractions evaluated, which were 5% and 15%. This confirms
the observations described by Omran et al. (1974) and Sánchez et al. (2010).
The average ice growth rate varied from 0.2 to 4 µm·s-1. The highest rates were
obtained at the lowest temperatures and concentrations of solids. Moreno et al.
(2014b) and Nakagawa et al. (2010) reported that freeze concentration occurs for an
ice growth rate lower than 6 µm·s-1 for the block technique for model solutions. Chen
and Chen (2000) studied rates under 2 µm·s-1 for falling-film freeze concentration of
food fluids. Meanwhile, Flesland (1995) reported rates between 0.2 and 2 µm·s-1 for
sucrose solutions FFFC. The use of low supercooling temperatures decrease energy
consumption and decrease the ice growth rate (Rane and Padiya, 2011). Low ice
0
0.2
0.4
0.6
0.8
1
1.2
0 1 2 3 4 5 6
K
V ice/ U s ^ 0.5
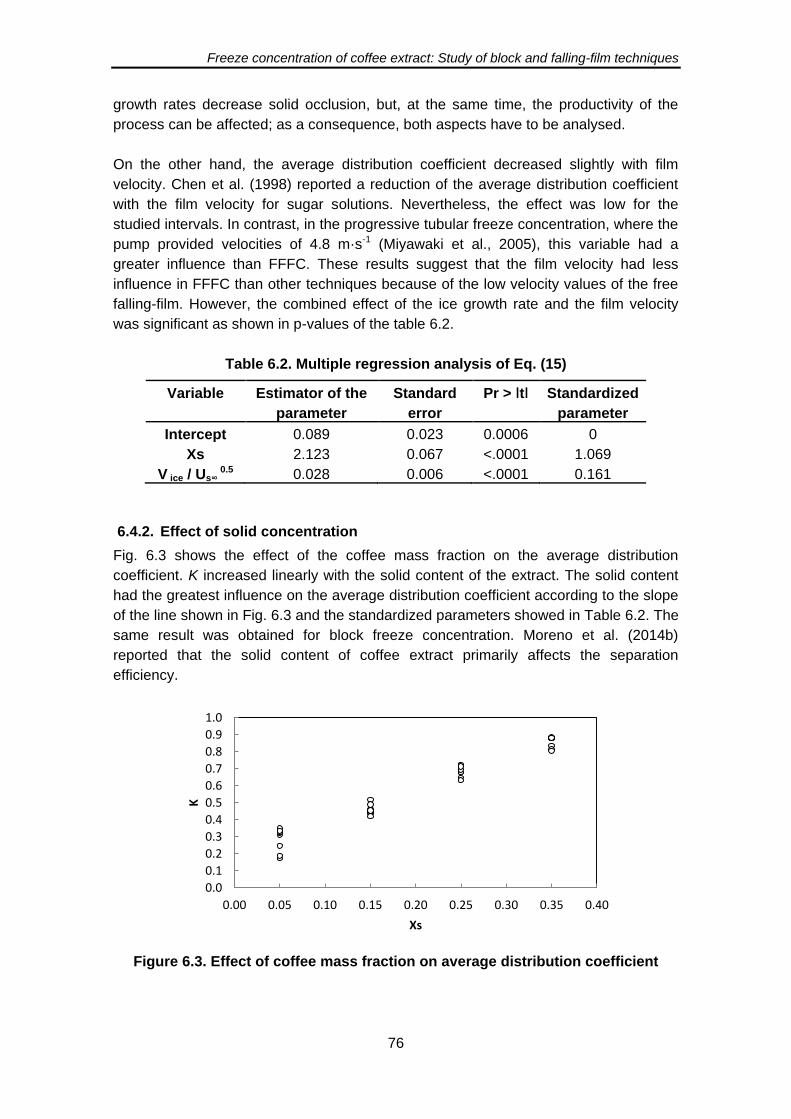
Freeze concentration of coffee extract: Study of block and falling-film techniques
76
growth rates decrease solid occlusion, but, at the same time, the productivity of the
process can be affected; as a consequence, both aspects have to be analysed.
On the other hand, the average distribution coefficient decreased slightly with film
velocity. Chen et al. (1998) reported a reduction of the average distribution coefficient
with the film velocity for sugar solutions. Nevertheless, the effect was low for the
studied intervals. In contrast, in the progressive tubular freeze concentration, where the
pump provided velocities of 4.8 m·s-1 (Miyawaki et al., 2005), this variable had a
greater influence than FFFC. These results suggest that the film velocity had less
influence in FFFC than other techniques because of the low velocity values of the free
falling-film. However, the combined effect of the ice growth rate and the film velocity
was significant as shown in p-values of the table 6.2.
Table 6.2. Multiple regression analysis of Eq. (15)
Variable Estimator of the
parameter
Standard
error
Pr > ǀtǀ Standardized
parameter
Intercept 0.089 0.023 0.0006 0
Xs 2.123 0.067 <.0001 1.069
V ice / Us∞ 0.5 0.028 0.006 <.0001 0.161
6.4.2. Effect of solid concentration
Fig. 6.3 shows the effect of the coffee mass fraction on the average distribution
coefficient. K increased linearly with the solid content of the extract. The solid content
had the greatest influence on the average distribution coefficient according to the slope
of the line shown in Fig. 6.3 and the standardized parameters showed in Table 6.2. The
same result was obtained for block freeze concentration. Moreno et al. (2014b)
reported that the solid content of coffee extract primarily affects the separation
efficiency.
Figure 6.3. Effect of coffee mass fraction on average distribution coefficient
0.0
0.1
0.2
0.3
0.4
0.5
0.6
0.7
0.8
0.9
1.0
0.00 0.05 0.10 0.15 0.20 0.25 0.30 0.35 0.40
K
Xs

Freeze concentration of coffee extract: Study of block and falling-film techniques
77
The solid occlusion was increased with the coffee mass fraction mainly for two
reasons. First, the diffusion velocity of solutes from the ice front to the falling-film of
fluid decreased with the solid content because of the interaction between solute
molecules (Hindmarsh et al., 2005; Petzold and Aguilera, 2009). Secondly, the
viscosity of the fluid increased with the solid concentration; consequently, solute
movement is slower and is therefore more easily trapped in the ice front (Moreno et al,
2014c; Raventós et al., 2007).
The average distribution coefficient increased from 0.2 to 0.9 when the coffee mass
fraction increased from 0.05 to 0.35. This result shows that when the solid extract
concentration rises above 35%, the value of k tends to one. At this value of k, the liquid
fraction has the same concentration as the ice, and the concentration efficiency tends
to zero. A high value of the average distribution coefficient is a problem in terms of the
purity of the ice and the concentration efficiency. However, this problem can be solved
by fractionated thawing of the ice sheet. Gulfo et al. (2013) proposed a partial thawing
of ice sheets to recover the retained solutes. Moreno et al. (2014a) proposed a process
to concentrate coffee extract by the integration of the ice thawing with FFFC and block
FC. With this strategy, the operational limit of progressive FC can be overtaken, and
the concentration efficiency can be increased.
6.4.3. Mathematical modelling
The parameters of the Eq. (3) were obtained from experimental data. A multiple
regression analysis was achieved to fit the parameters of the Chen model. The results
are shown in Table 6.2. The parameters of the three variables were statistically
significant for a confidence interval of 95%. These results confirm that the coffee mass
fraction and the ratio of the average ice growth rate to the fluid velocity affected
significantly the average distribution coefficient. An adjusted regression coefficient of
0.98 was obtained. According to these results, the average distribution coefficient in
FFFC of coffee extract can be calculated as a function of the coffee mass fraction of
the extract, the average ice growth rate and the fluid film velocity by the Eq. (15).
The smallest average distribution coefficient was obtained for the smallest solid
concentration and the smallest ratio of average ice growth rate to film velocity, as
shown in Fig 6.4. Experimental data were compared with the predicted data generated
from Eq. (15) in Fig. 6.5. A good fit was obtained as evaluated by the adjusted
regression coefficient.
R
2=0.98 (15)
The experimental data, the predicted data generated from Eq. (15) and the 95%
confidence intervals are shown in fig 6.2. The three parameters had significant effect
on the average distribution coefficient as shown in Table 6.2. The parameter with the
greatest effect on the average distribution coefficient was the term associated with the
coffee mass fraction, according to the standardized parameters presented in Table 6.2.
This confirms the higher influence of solid concentration on the solute occlusion in the
ice.
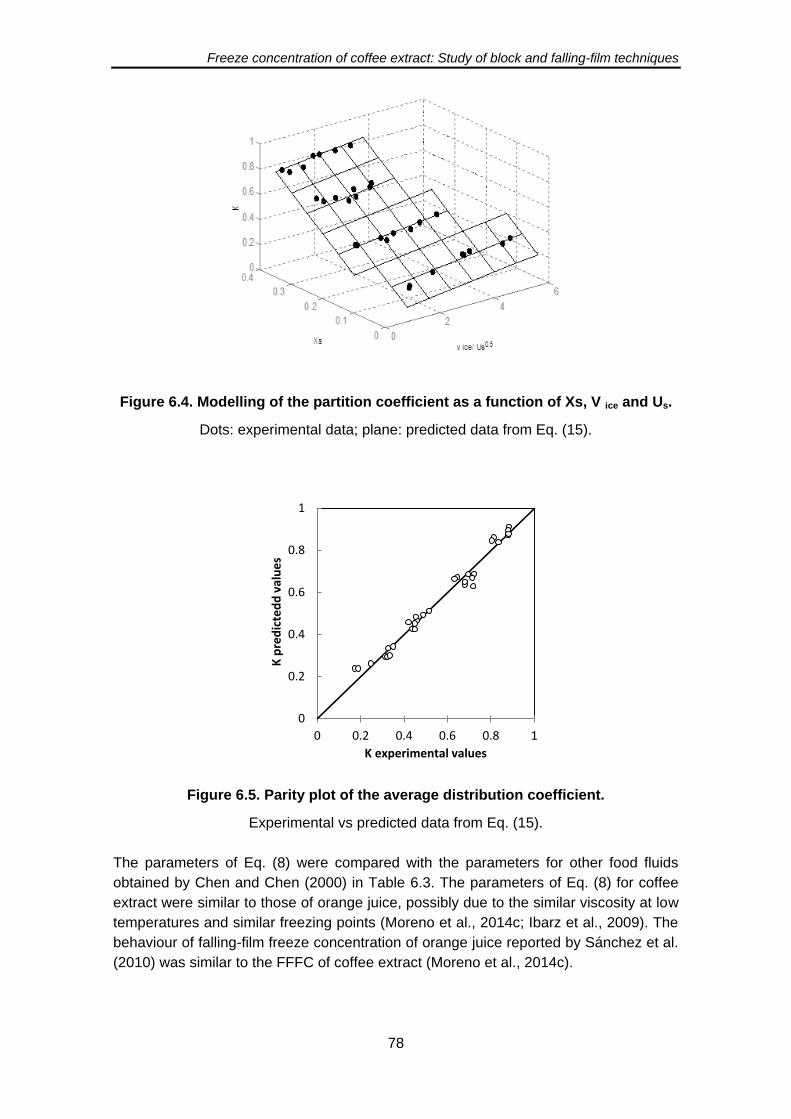
Freeze concentration of coffee extract: Study of block and falling-film techniques
78
Figure 6.4. Modelling of the partition coefficient as a function of Xs, V ice and Us.
Dots: experimental data; plane: predicted data from Eq. (15).
Figure 6.5. Parity plot of the average distribution coefficient.
Experimental vs predicted data from Eq. (15).
The parameters of Eq. (8) were compared with the parameters for other food fluids
obtained by Chen and Chen (2000) in Table 6.3. The parameters of Eq. (8) for coffee
extract were similar to those of orange juice, possibly due to the similar viscosity at low
temperatures and similar freezing points (Moreno et al., 2014c; Ibarz et al., 2009). The
behaviour of falling-film freeze concentration of orange juice reported by Sánchez et al.
(2010) was similar to the FFFC of coffee extract (Moreno et al., 2014c).
0
0.2
0.4
0.6
0.8
1
0 0.2 0.4 0.6 0.8 1
K p
red
icte
dd
val
ue
s
K experimental values
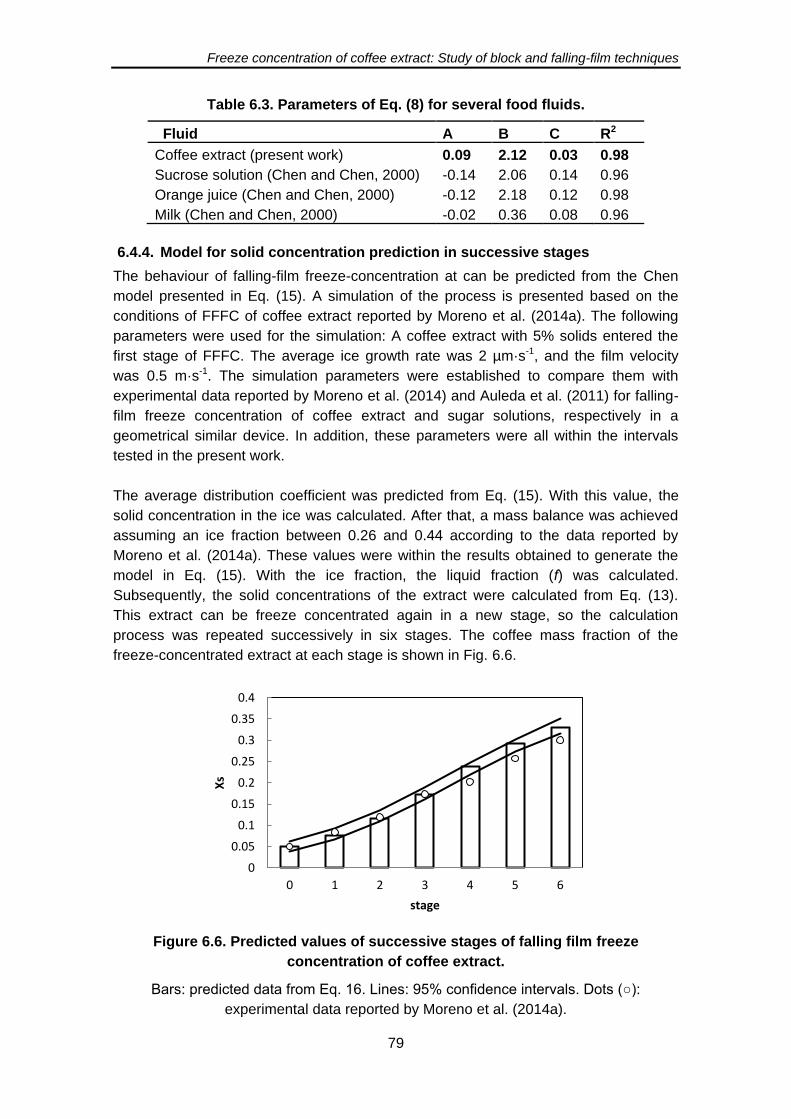
Freeze concentration of coffee extract: Study of block and falling-film techniques
79
Table 6.3. Parameters of Eq. (8) for several food fluids.
Fluid A B C R2
Coffee extract (present work) 0.09 2.12 0.03 0.98
Sucrose solution (Chen and Chen, 2000) -0.14 2.06 0.14 0.96
Orange juice (Chen and Chen, 2000) -0.12 2.18 0.12 0.98
Milk (Chen and Chen, 2000) -0.02 0.36 0.08 0.96
6.4.4. Model for solid concentration prediction in successive stages
The behaviour of falling-film freeze-concentration at can be predicted from the Chen
model presented in Eq. (15). A simulation of the process is presented based on the
conditions of FFFC of coffee extract reported by Moreno et al. (2014a). The following
parameters were used for the simulation: A coffee extract with 5% solids entered the
first stage of FFFC. The average ice growth rate was 2 µm·s-1, and the film velocity
was 0.5 m·s-1. The simulation parameters were established to compare them with
experimental data reported by Moreno et al. (2014) and Auleda et al. (2011) for falling-
film freeze concentration of coffee extract and sugar solutions, respectively in a
geometrical similar device. In addition, these parameters were all within the intervals
tested in the present work.
The average distribution coefficient was predicted from Eq. (15). With this value, the
solid concentration in the ice was calculated. After that, a mass balance was achieved
assuming an ice fraction between 0.26 and 0.44 according to the data reported by
Moreno et al. (2014a). These values were within the results obtained to generate the
model in Eq. (15). With the ice fraction, the liquid fraction (f) was calculated.
Subsequently, the solid concentrations of the extract were calculated from Eq. (13).
This extract can be freeze concentrated again in a new stage, so the calculation
process was repeated successively in six stages. The coffee mass fraction of the
freeze-concentrated extract at each stage is shown in Fig. 6.6.
Figure 6.6. Predicted values of successive stages of falling film freeze
concentration of coffee extract.
Bars: predicted data from Eq. 16. Lines: 95% confidence intervals. Dots (○):
experimental data reported by Moreno et al. (2014a).
0
0.05
0.1
0.15
0.2
0.25
0.3
0.35
0.4
0 1 2 3 4 5 6
Xs
stage
Freeze concentration of coffee extract: Study of block and falling-film techniques
80
Starting with an extract of 5% coffee solids, the concentration of the freeze-
concentrated extract tended to 37% solids at the end of the process. The concentration
showed sigmoidal behaviour. The same behaviour was reported by Bayindirli and
Ungan (1993) in the freeze concentration of apple juice and by Nonthanum and
Tansakul (2008) for lime juice. At the beginning, the concentration increased linearly.
However, at the end, the concentration tends to an asymptotic value due to the
thermodynamic limit when the extract was close to the eutectic point concentration.
The Chen model can be applied for one stage of FFFC. A mass balance is needed to
calculate the solid concentration in successive stages. However, a model to predict the
coffee mass fraction from the number of stages used in FFFC can be adjusted from
data generated with Eq. 13-15. The sigmoidal behaviour can be modelled with the
logistic model presented in Eq. 16. The model predicts the coffee mass fraction of the
concentrated liquid as a function of the initial coffee mass fraction and the number of
stages. The parameters of the Eq. 16 were obtained by least squares regression with
data generated from the Chen model.
( ) R2=0.998 (16)
The concentration reached after successive stages of FFFC can be predicted by Eq.
16. Fig. 6 shows the predicted data from Eq. (16) (bars), the 95% confidence intervals
(lines), and the experimental data of FFFC of coffee extract reported by Moreno et al.,
2014a,. The experimental data presented a good fit with the models with an adjusted
regression coefficient of 0.998. The generated parameters were significant for alpha
0.05. According to the simulation, after six stages of FFFC, a coffee extract of 31.8%
solids was obtained. The concentration tended to 35%. Moreno et al. (2014a) reported
an extract with 30.4% solids after six stages of FFFC starting with a 5% coffee extract.
The results show that the Chen model accurately predicts the behaviour of falling-film
freeze concentration of coffee extract. Likewise, the logistic model fit the data
accurately for the first stages. A slight deviation of experimental data was observed for
the three last stages. The differences can be attributed to the difference in the scale of
the device reported by Moreno et al. (2014) and those used in the present work.
However, the model showed a trend for the solid concentration increasing. The logistic
model is useful to predict the solid concentration in terms of the number of stages used
in FFFC.
6.5. Conclusions
This study showed that the mass fraction of solids and the ratio of the average growth
rate of the freezing front to the velocity of the fluid film affected significantly the average
distribution coefficient of the ice produced during the falling-film freeze concentration of
coffee extract. The greatest effect was obtained for the coffee mass fraction of the
extratc. The parameters of the Chen model were obtained for the prediction of average
distribution coefficient of coffee extract. A logistic model was adjusted to predict the
behaviour of successive stages of falling-film freeze concentration. In successive
stages of falling-film freeze concentration, the coffee mass fraction tends to 35% at the
Freeze concentration of coffee extract: Study of block and falling-film techniques
81
studied conditions. From this information, it is possible to predict the coffee mass
fraction of concentrated liquid and ice during falling-film freeze concentration at
different operational conditions. The models properly fit the experimental data.
6.6. References
Aider, M., de Halleux, D. (2009). Cryoconcentration technology in the bio-food industry:
Principles and applications. LWT - Food Science and Technology, 42(3), 679-685.
Auleda, J.M., Raventós, M., Hernández, E. (2011). Calculation method for designing a
multi-plate freeze-concentrator for concentration of fruit juices. Journal of Food
Engineering, 107(1), 27-35.
Bayindirli, L., Ungan, S. (1993). Mathematical Analysis of Freeze Concentration of
Apple Juice. Journal of Food Engineering, 19, 95-107.
Belén, F., Benedetti, S., Sánchez, J., Hernández, E., Auleda, J. M., Prudêncio, E. S.,
Petrus, J. C. C., et al. (2013). Behavior of functional compounds during freeze
concentration of tofu whey. Journal of Food Engineering, 116(3), 681-688.
Boaventura, B. C. B., Murakami, A. N. N., Prudêncio, E. S., Maraschin, M., Murakami,
F. S., Amante, E. R., Amboni, R. D. D. M. C. (2013). Enhancement of bioactive
compounds content and antioxidant activity of aqueous extract of mate (Ilex
paraguariensis A. St. Hil.) through freeze concentration technology. Food Research
International, 53(2), 686-692.
Caretta, O., Courtot, F., Davies, T. (2006). Measurement of salt entrapment during the
directional solidification of brine under forced mass convection. Journal of Crystal
Growth, 294(2), 151-155.
Chen, P., Chen, X. D. (2000). A generalized correlation of solute inclusion in ice formed
from aqueous solutions and food liquids on sub-cooled surface. The Canadian
Journal of Chemical Engineering, 78, 312-319.
Chen, P., Chen, X. D., Free, K. W. (1998). Solute Inclusion in Ice Formed From
Sucrose Solutions on a Sub-cooled Surface-an Experimental Study. Journal of Food
Engineering, 38, 1-13.
Flesland, O. (1995). Freeze cocentration by layer crystallization. Drying technology, 13,
1713-1739.
Gulfo, R., Auleda, J. M., Moreno, F. L., Ruiz, Y., Hernández, E., Raventós, M. (2013).
Multi-plate freeze concentration: Recovery of solutes occluded in the ice and
determination of thawing time. Food science and technology international.
doi:10.1177/1082013213489127
Hernández, E., Raventós, M., Auleda, J. M., Ibarz, a. (2009). Concentration of apple
and pear juices in a multi-plate freeze concentrator. Innovative Food Science &
Emerging Technologies, 10(3), 348-355.
Hernández, E., Raventós, M., Auleda, J. M., Ibarz, A. (2010). Freeze concentration of
must in a pilot plant falling film cryoconcentrator. Innovative Food Science &
Emerging Technologies, 11(1), 130-136.
Freeze concentration of coffee extract: Study of block and falling-film techniques
82
Hindmarsh, J. P., Russell, A. B., Chen, X. D. (2005). Measuring dendritic growth in
undercooled sucrose solution droplets. Journal of Crystal Growth, 285(1-2), 236-
248.
Ibarz, R., Falguera, V., Garvín, A., Garza, S., Pagán, J., Ibarz, A. (2009). Flow
Behavior of clarified orange juice at low temperatures. Journal of Texture Studies,
40, 445-456.
Miyawaki, O., Liu, L., Shirai, Y., Sakashita, S., Kagitani, K. (2005). Tubular ice system
for scale-up of progressive freeze-concentration. Journal of Food Engineering,
69(1), 107-113.
Miyawaki, O., Kato, S., Watabe, K., 2012. Yield improvement in progressive freeze-
concentration by partial melting of ice. Journal of Food Engineering 108 (3), 377–
382.
Moreno, F.L., Hernández, E., Raventós, M., Robles, C., Ruiz, Y. (2014a). A process to
concentrate coffee extract by the integration of falling film and block freeze-
concentration. Journal of Food Engineering, 128, 88-95.
Moreno, F.L., Raventós, M., Hernández, E., Ruiz, Y. (2014b). Block freeze-
concentration of coffee extract: effect of freezing and thawing stages on solute
recovery and bioactive compounds. Journal of Food Engineering, 120, 158-166.
Moreno F.L., Raventós M., Hernández E., Santamaría N., Acosta J., Pirachican O.,
Torres L. and Ruiz Y. (2014c). Rheological behaviour, freezing curve and density of
coffee solutions at temperatures close to freezing. International Journal of Food
Properties. DOI: 10.1080/10942912.2013.833221.
Moreno, F.L., Robles, C. M., Sarmiento, Z., Ruiz, Y., Pardo, J. M. (2013). Effect of
separation and thawing mode on block freeze-concentration of coffee brews. Food
and Bioproducts Processing, 91(4), 396-402.
Nakagawa, K., Maebashi, S., & Maeda, K. (2009). Concentration of aqueous dye
solution by freezing and thawing. The Canadian Journal of Chemical Engineering,
87(5), 779-787.
Nakagawa, K., Maebashi, S., Maeda, K. (2010). Freeze-thawing as a path to
concentrate aqueous solution. Separation and Purification Technology, 73(3), 403-
408.
Nonthanum, P., Tansakul, A. (2008). Freeze concentration of lime juice. Maejo
International Journal of Science and Technology, 1, 27-37.
Omran A.M. King J. (1974) Kinetics of ice crystallization in sugar solutions and fruit
juices. AIChemE Journal, 20, 795-803,
Petzold, G., Aguilera, J. M. (2009). Ice Morphology: Fundamentals and Technological
Applications in Foods. Food Biophysics, 4(4), 378-396.
Perry, H.R., Green, D., Maloney, J.O., 1992. Perry’s Chemical Engineering Handbook,
6th Edition. McGraw-Hill, New York, USA

Freeze concentration of coffee extract: Study of block and falling-film techniques
83
Qin, F., Chen, X. D., Ramachandra, S., Free, K. (2006). Heat transfer and power
consumption in a scraped-surface heat exchanger while freezing aqueous solutions.
Separation and Purification Technology, 48(2), 150-158.
Qin, F., Chen, X. D., Free, K. (2009). Freezing on subcooled surfaces, phenomena,
modeling and applications. International Journal of Heat and Mass Transfer, 52(5-6),
1245-1253.
Rane, M. V., Jabade, S. K. (2005). Freeze concentration of sugarcane juice in a
jaggery making process. Applied Thermal Engineering, 25(14-15), 2122-2137.
Rane, M. V., Padiya, Y. S. (2011). Heat pump operated freeze concentration system
with tubular heat exchanger for seawater desalination. Energy for Sustainable
Development, 15(2), 184-191.
Raventós, M., Hernández, E., Auleda, J. M., Ibarz, A. (2007). Concentration of
aqueous sugar solutions in a multi-plate cryoconcentrator. Journal of Food
Engineering, 79(2), 577-585.
Sánchez, J., Hernández, E., Auleda, J. M., Raventós, M. (2011a). Review: freeze
concentration technology applied to dairy products. Food science and technology
international, 17(1), 5-13.
Sánchez, J., Hernández, E., Auleda, J. M., Raventós, M. (2011b). Freeze
concentration of whey in a falling film based pilot plant: Process and
characterization. Journal of Food Engineering, 103(2), 147-155.
Sánchez, J., Ruiz, Y., Auleda, J. M., Hernández, E., Raventós, M. (2009). Review.
Freeze Concentration in the Fruit Juices Industry. Food Science and Technology
International, 15(4), 303-315.
Sánchez, J., Ruiz, Y., Raventós, M., Auleda, J. M., Hernández, E. (2010). Progressive
freeze concentration of orange juice in a pilot plant falling film. Innovative Food
Science & Emerging Technologies, 11(4), 644-651.
van der Ham, F., Seckler, M. M., Witkamp, G. J. (2004). Eutectic freeze crystallization
in a new apparatus: the cooled disk column crystallizer. Chemical Engineering and
Processing: Process Intensification, 43(2), 161-167.
Freeze concentration of coffee extract: Study of block and falling-film techniques
84
7. VOLATILE COMPOUNDS PRESERVATION AND SOLUTES RETENTION
OF BLOCK AND FALLING-FILM FREEZE CONCENTRATION OF
COFFEE EXTRACT
7.1. Abstract
Coffee extract was freeze-concentrated through block and falling-film techniques.
Solute retention and concentration efficiency were determined after one stage of the
process. Ice morphology was characterized through image analysis. Preservation of
volatile compounds was determined through GC-MS. The effect of coffee extract on
flavour was determined after freeze concentration through sensory evaluation. Solute
occlusion was higher for falling-film than for block freeze-concentration, with an
average distribution coefficient of 0.45 and 0.29 respectively. Ice crystal size was lower
for the falling-film technique; this explains the higher solute occlusion. Dewatering
capacity was higher for the falling-film technique as this process is faster than block
freeze-concentration. Major volatile compounds of the coffee extract were preserved
after freeze concentration with both techniques. In the same way, no differences were
found in most of the sensory attributes of the freeze-concentrated extract obtained
using both techniques. Results confirm the benefits of the block and falling-film freeze
concentration techniques in preserving the quality of coffee extract.
7.2. Introduction
Coffee is the most traded food in the world. Coffee flavour is highly important during its
processing (Caporaso et al., 2014). Freeze-dried coffee is a higher quality product than
soluble coffee due to low processing temperatures (Fissore et al., 2014). The process
to obtain freeze-dried coffee begins with an initial stage of aqueous extraction by
percolation, followed by concentration and drying of the extract. The objective of the
concentration stage is to eliminate part of the water from the extract. This stage is
performed through freeze concentration. Freeze concentration (FC) is a technology
used to remove water from aqueous solutions by freezing (Sánchez et al., 2009). This
technology is used to reduce processing times in the freeze drying stage (Moreno et
al., 2014c).
One of the advantages of using FC in soluble coffee production is the preservation of
volatile compounds (Budryn et al., 2011; Cheong et al., 2013; MacLeod et al., 2006;
Sopelana et al., 2013). The sensory attributes of the coffee beverage is one of its most
important quality parameters. Consequently, sensory analysis is the most used
technique to evaluate coffee quality (Cheong et al., 2013; Farah et al., 2006;
Freeze concentration of coffee extract: Study of block and falling-film techniques
85
Korhonová et al., 2009). However, there are few reported works on the efficacy of
volatile compounds preservation when using FC (Ramos et al., 2005).
Separation efficiency in freeze concentration (FC) is related to solid occlusion in the ice
layer. This occlusion can be influenced by the morphology of ice crystals achieved by
the freezing conditions and the solution type (Ayel et al., 2006; Butler, 2002; Okawa et
al., 2009; Pardo et al., 2002). Food materials science attempts to develop structure-
property relationships in foods. In particular, it has been demonstrated that many
desirable traits of food depend on the way foods are structured (Aguilera, 2007).
Understanding the quantitative relationships between freeze concentration and ice
crystal morphology is of practical importance. This knowledge can be applied, for
example, to engineer processes with higher efficiencies thanks to material properties.
Physical properties of ice layer can be deemed as the result of the characteristics (size)
and spatial arrangement of crystals (Germain and Aguilera, 2012). The freezing stage
is a key step because it fixes the morphology of the frozen material and, as a result, it
can affect the efficiency of the freeze concentration process. That is why it is important
to evaluate the morphology generated by the processes mentioned above. Mean
diameters and size distributions of ice crystals have been reported as the result of the
freezing process; it has been observed that distributions of ice crystal sizes depend not
only on the freezing rates, a well-known result, but also on sample size and freezing
direction, among other variables (Hottot et al. 2007).
The most implemented FC technique is called suspension FC. In this technique, small
ice crystals are produced in a scraped heat exchanger and then removed through
washing columns (Qin et al., 2009). A high separation efficiency is achieved; however,
the initial and operational costs are relatively high (Petzold and Aguilera, 2013). As a
result, different techniques such as falling-film and block FC are being developed.
In block freeze-concentration, also known as freeze-thaw FC, the solution is completely
frozen in a vessel. After that, the solution is partially thawed to recover a liquid
concentrated fraction (Aider and de Halleux, 2009; Moreno et al., 2014c; Nakagawa et
al., 2010). On the other hand, in falling-film freeze concentration (FFFC), the solution is
circulated through a cooling plate. An ice sheet is formed on the plate and the solution
is recirculated until a desired concentration is reached in a batch operation (Hernández
et al., 2010). Several researchers have established the viability of both techniques to
concentrate food solutions (Aider and de Halleux, 2008; Nakagawa et al., 2010;
Petzold and Aguilera, 2013; Raventós et al., 2007; Sánchez et al., 2010).
Block and falling-film FC have been studied in coffee extract concentration (Moreno et
al., 2014a). The preservation of bioactive compounds has been demonstrated (Moreno
et al., 2014c); however, the effect of FC on volatile compounds and sensory quality of
the beverage has not been studied. In addition, the ice morphology achieved through
these FC techniques and its relationship with solute occlusion has not been
determined.
Freeze concentration of coffee extract: Study of block and falling-film techniques
86
The aim of the present study was to compare solute retention, productivity of the
operation, ice morphology, volatile compounds preservation, and sensory quality
between falling-film freeze concentration and block freeze-concentration of coffee
extract.
7.3. Materials and Methods
7.3.1. Materials
Coffee extract supplied by the company Buencafé Liofilizado de Colombia (National
Federation of Coffee Growers of Colombia) was used for the FC tests. The extract was
13% w/w solids. The extract was stored at -18°C and thawed at 4°C for 8 hours
previously to the tests.
7.3.2. Methods
7.3.2.1. Freeze Concentration Tests
Block Freeze-Concentration Tests
One stage of block FC was tested according to the parameters reported by Moreno et
al., (2014c). The block FC technique consisted in complete freezing of the extract in a
closed vessel, and the subsequent partial thawing and separation of the liquid phase.
The tests were performed in the device shown in Fig. (7.1a). The coffee sample (160 g)
was placed into a cylindrical double-jacketed container of 5.2 cm in diameter and 8.5
cm in height. The internal jacket was cooled through a mixture of ethylene glycol and
water (53% w/w) from a bath (Polystat, Cole Parmer, USA) with temperature control (-
35 °C to 150 °C +/- 0.01 °C). The cooling fluid temperature was set at -10 °C. The
cooling fluid was circulated into the internal jacket once it reached that temperature.
Ice grew from the centre to the external wall of the container. When the sample was
completely frozen, it was thawed by heating the external jacket at 20°C with the fluid
from the second bath. Fifty percent of the extract mass was collected and separated
from the ice, according to the results proposed by Moreno et al. (2014c). The solid
concentration (Cs) of the liquid and the ice fractions was measured through
refractometry (Atago Pal 100, Japan). Cs is defined as the mass of coffee solids per
unit of mass of coffee solution. The relationship between Brix degrees and CS is
represented by the equation Cs=0.87 °Brix, reported by Moreno et al., (2014d). The
two fractions were stored at 4°C during 12 hours for the analysis of volatile compounds.
Tests were performed in triplicate.
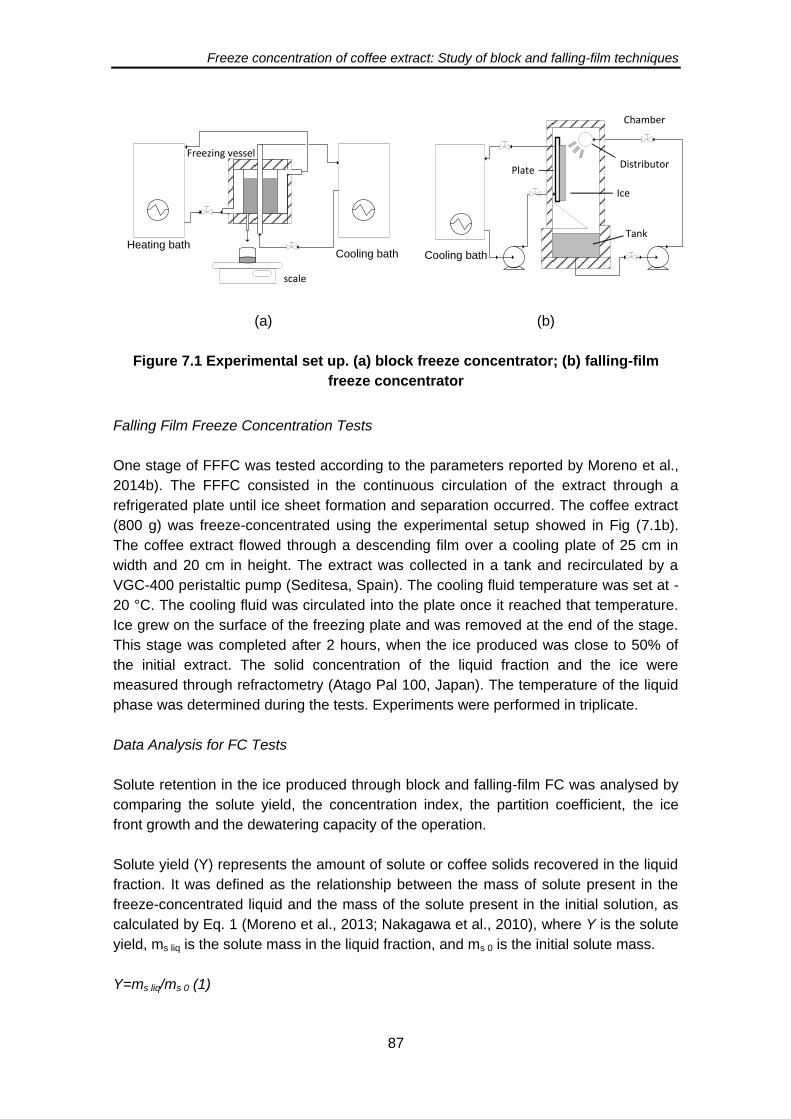
Freeze concentration of coffee extract: Study of block and falling-film techniques
87
Cooling bath
Chamber
PlateDistributor
Ice
Tank
Cooling bathHeating bath
x
Freezing vessel
scale
(a) (b)
Figure 7.1 Experimental set up. (a) block freeze concentrator; (b) falling-film
freeze concentrator
Falling Film Freeze Concentration Tests
One stage of FFFC was tested according to the parameters reported by Moreno et al.,
2014b). The FFFC consisted in the continuous circulation of the extract through a
refrigerated plate until ice sheet formation and separation occurred. The coffee extract
(800 g) was freeze-concentrated using the experimental setup showed in Fig (7.1b).
The coffee extract flowed through a descending film over a cooling plate of 25 cm in
width and 20 cm in height. The extract was collected in a tank and recirculated by a
VGC-400 peristaltic pump (Seditesa, Spain). The cooling fluid temperature was set at -
20 °C. The cooling fluid was circulated into the plate once it reached that temperature.
Ice grew on the surface of the freezing plate and was removed at the end of the stage.
This stage was completed after 2 hours, when the ice produced was close to 50% of
the initial extract. The solid concentration of the liquid fraction and the ice were
measured through refractometry (Atago Pal 100, Japan). The temperature of the liquid
phase was determined during the tests. Experiments were performed in triplicate.
Data Analysis for FC Tests
Solute retention in the ice produced through block and falling-film FC was analysed by
comparing the solute yield, the concentration index, the partition coefficient, the ice
front growth and the dewatering capacity of the operation.
Solute yield (Y) represents the amount of solute or coffee solids recovered in the liquid
fraction. It was defined as the relationship between the mass of solute present in the
freeze-concentrated liquid and the mass of the solute present in the initial solution, as
calculated by Eq. 1 (Moreno et al., 2013; Nakagawa et al., 2010), where Y is the solute
yield, ms liq is the solute mass in the liquid fraction, and ms 0 is the initial solute mass.
Y=ms liq/ms 0 (1)
Freeze concentration of coffee extract: Study of block and falling-film techniques
88
The Concentration Index (CI) was defined as the relationship between the solid
concentration in the liquid freeze-concentrated fraction and the solid concentration in
the initial solution (Nakagawa et al., 2009), where CI is the concentration index, Cs liq is
the solid concentration (% m/m) in the freeze-concentrated liquid, and Cs 0 is the solid
concentration (% m/m) in the initial solution.
CI = Cs liq/C s 0 (2)
The ice fraction (f ice) was defined as the ratio between the ice mass and the mass of
the original solution as calculated by Eq. 3 (Miyawaki et al., 2012; Nakagawa et al.,
2010):
f = mice/m0 (3)
The average distribution coefficient is defined as the ratio between the solid
concentration in the ice (Cs ice) and the solid concentration in the freeze-concentrated
liquid (Cs liq), as shown in Eq. (4) (Chen and Chen, 2000).
(4)
The average ice growth rate was calculated by Eq. 5 (Chen, Chen, & Free, 1999),
where Vice is the ice growth rate, mice is the ice mass, Cs ice is the coffee
concentration in the ice, t is the total freezing time, A is the heat transfer area, and ρice
is he density of ice.
(5)
Finally, the dewatering capacity was calculated as the relationship of the mass of water
removed from the solution per unit of mass of initial extract and per unit of time (t), Eq.
6.
Dewatering capacity= mice·(1- (Cs ice/100))/(m0·t) (6)
7.3.2.2. Image Analysis of Morphological Structure of the Ice Crystals
Samples of the ice produced through block and falling-film freeze concentration were
characterized by microscopic analysis. In every experiment, ice was removed from the
equipment. Then, a portion of the frozen sample was transferred to a cryomicrotome
CM1850 (Leica, Germany) with a chamber temperature set at -20°C. Ice crystals
produced were observed with a Nikon Eclipse Ti microscope (Nikon, United States),
using transmitted light and a 10X Nikon DS-Fi1 objective. To avoid thawing of the
frozen samples, the microscope was fitted with a PE120 Peltier-based cooling stage
coupled to a PE 94 temperature control system (Linkam Scientific Instruments, United
Kingdom), allowing temperature control down to −20 °C. This cooling stage and all the
materials employed in sample manipulation (spatula, coverslip glasses, tweezers and

Freeze concentration of coffee extract: Study of block and falling-film techniques
89
so on) were previously tempered at the freezing point of the freeze-concentrated
sample (-21°C).
The images of the ice crystals formed in the samples of 20148 x 1536 pixels were
captured using a Nikon microscope camera (Nikon, United States) fitted to the
microscope and by means of the NIS-elements F V2.30 software interfaced to a
personal computer. These images were converted to grey scale (8 bits) maps and then
to binary images (black and white) using ImageJ v.5.1 (National Institutes of Health,
Unites States) as an image analysis software. A threshold was applied to each image
by using default settings. Spatial measurements, originally expressed as number of
pixels, were calibrated using a micrograph taken from a 1-mm stage micrometer placed
on the microscope stage.
Hydraulic diameter, area, and circularity values were estimated using the ImageJ v.5.1
software. More than 30 images were analysed at the top, at the middle, and at the
bottom of the sample in order to obtain a good reproducibility of the parameters of the
ice crystals.
7.3.2.3. Identification and Quantification of Volatile Compounds
The major volatile compounds of the initial extract, the liquid, and the ice fractions of
block FC and FFFC were identified and quantified through gas chromatography and
mass spectrophotometry (GC/MS), according to the method reported by Ribeiro et al.,
(2010) with some modifications.
Extraction of volatile compounds was carried out through the Head Space Solid Phase
Micro Extraction (HS-SPME) technique, using Divinylbenzene/Polydimethylsiloxane
(DVB/ PDMS) fibre with 65 μm thickness (Supelco, USA). Sealed glass vials (40 mL)
were used to collect 2-g samples of the coffee extract, the liquid, and ice fractions
obtained from Block FC and FFFC tests. Fibres were conditioned and then used in the
injection port of the chromatographer for 30 min at 250°C in splitless mode. The fibres
were inserted in the vials and exposed for 30 min at room temperature.
CG analyses were performed in an OP5050 GC-MS system (Shimadzu, Japan)
equipped with a RTX-5 capillary column (30m×0.25mm× 0.25 μm). Helium (1.20
mL•min−1) was used as carrier gas. Oven temperature was programmed as follows: 40
°C→5°C/min→150 °C, followed by 30 °C/ min→260 °C. MS were performed using
electron ionization (energy 70 eV). The scans were recorded within the 40-350 m/z
range and compared to the Wiley 139 library using the Class 5K software.
Ice loss percentage of each FC technique was calculated by Eq. 7. (Ramos et al.,
2005), where RPA is the relative percent area in the ice fraction and liquid fractions.
Ice loss percentage= RPA ice/(RPA ice + RPA liq)*100 Eq. (7)
Freeze concentration of coffee extract: Study of block and falling-film techniques
90
7.3.2.4. Sensory Descriptive Analysis
A descriptive quantitative sensory evaluation was performed of the liquid and ice
fractions obtained from block and falling-film FC and of the initial extract. Samples were
evaluated by six panellists of the Trained Sensory Analysis Laboratory of the University
of Antioquia. Coffee extracts were evaluated based on descriptive sensory attributes
according to the National Standard NTC 4883. Coffee descriptors included aroma,
acidity, bitterness, sweetness, tobacco, fruity, floral, aftertaste, body, global impact. A
10-point scale was used, with ‘0’ indicating uncharacterised attribute intensity and ‘10’
indicating very strong attribute intensity. Coffee extract samples were diluted to 1.5%
solid content at 90°C and presented to the panellists. The results were averaged for
each of the descriptive attributes and plotted in a web diagram.
7.3.2.5. Statistical Analysis
All the tests were performed in triplicate. Data reported included the mean and
standard deviation. One-way analysis of variance (ANOVA) was applied to the results
with a level of significance of 95% in order to evaluate significance of the differences.
For the sensory evaluation, a Dunnett test was applied to establish the significance of
the difference. The statistical analysis was performed using the SAS 9.2 software
package.
7.4. Results
7.4.1. Freeze Concentration Tests
Table 7.1 shows the results on concentration of coffee solids in the liquid (C liq) and ice
(C ice) fractions achieved through block and falling-film FC. The concentration index
(CI) achieved through the block technique was significantly higher than the CI obtained
through the FFFC. The concentration increased 1.5 times to 20.8% with the block
technique. On the other hand, the FFFC increased the concentration 1.3 times,
reaching a value of 17.8%. Solute yield (Y) for the block technique was higher than for
the FFFC technique, but the difference was not statistically significant. This value is
affected by the ice fraction. Solute occlusion in the ice, expressed by the average
partition coefficient, was significantly higher in FFFC than in block FC.
The best result of the block technique in terms of the lowest solute retention can be
explained by the difference in the ice front rate, which was higher for FFFC. At a higher
freezing rate, a higher amount of solutes can be retained in the ice (Caretta et al.,
2006). When the heat transfer rate is higher than the mass transfer rate, solute elution
cannot exceed the ice front growth rate and the solute is trapped in the ice. In addition,
the difference in the freezing point produced by the concentration gradient in the liquid
around the ice front produces a zone where ice growth is unstable (Petzold and
Aguilera, 2009). The ice growth is trapped in the portions of concentrated liquid; this
phenomenon is known as constitutional supercooling and it can affect concentration
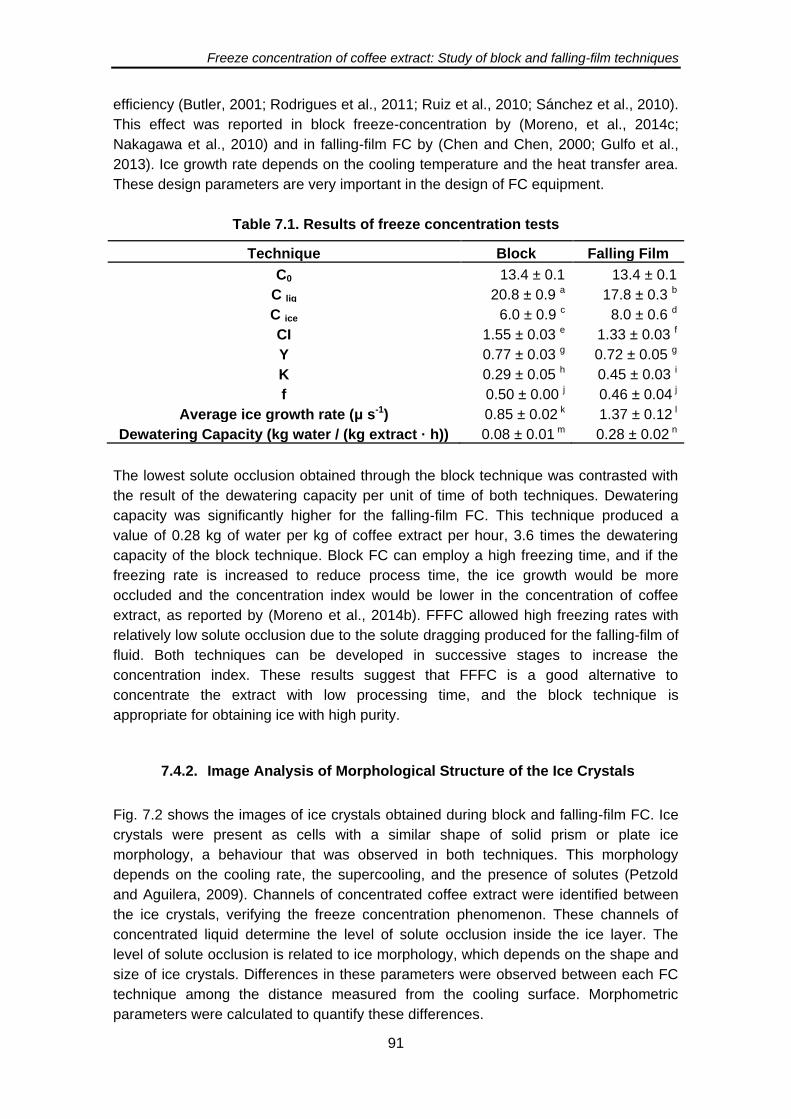
Freeze concentration of coffee extract: Study of block and falling-film techniques
91
efficiency (Butler, 2001; Rodrigues et al., 2011; Ruiz et al., 2010; Sánchez et al., 2010).
This effect was reported in block freeze-concentration by (Moreno, et al., 2014c;
Nakagawa et al., 2010) and in falling-film FC by (Chen and Chen, 2000; Gulfo et al.,
2013). Ice growth rate depends on the cooling temperature and the heat transfer area.
These design parameters are very important in the design of FC equipment.
Table 7.1. Results of freeze concentration tests
Technique Block Falling Film
C0 13.4 ± 0.1 13.4 ± 0.1
C liq 20.8 ± 0.9 a 17.8 ± 0.3 b
C ice 6.0 ± 0.9 c 8.0 ± 0.6 d
CI 1.55 ± 0.03 e 1.33 ± 0.03 f
Y 0.77 ± 0.03 g 0.72 ± 0.05 g
K 0.29 ± 0.05 h 0.45 ± 0.03 i
f 0.50 ± 0.00 j 0.46 ± 0.04 j
Average ice growth rate (μ s-1) 0.85 ± 0.02 k 1.37 ± 0.12 l
Dewatering Capacity (kg water / (kg extract · h)) 0.08 ± 0.01 m 0.28 ± 0.02 n
The lowest solute occlusion obtained through the block technique was contrasted with
the result of the dewatering capacity per unit of time of both techniques. Dewatering
capacity was significantly higher for the falling-film FC. This technique produced a
value of 0.28 kg of water per kg of coffee extract per hour, 3.6 times the dewatering
capacity of the block technique. Block FC can employ a high freezing time, and if the
freezing rate is increased to reduce process time, the ice growth would be more
occluded and the concentration index would be lower in the concentration of coffee
extract, as reported by (Moreno et al., 2014b). FFFC allowed high freezing rates with
relatively low solute occlusion due to the solute dragging produced for the falling-film of
fluid. Both techniques can be developed in successive stages to increase the
concentration index. These results suggest that FFFC is a good alternative to
concentrate the extract with low processing time, and the block technique is
appropriate for obtaining ice with high purity.
7.4.2. Image Analysis of Morphological Structure of the Ice Crystals
Fig. 7.2 shows the images of ice crystals obtained during block and falling-film FC. Ice
crystals were present as cells with a similar shape of solid prism or plate ice
morphology, a behaviour that was observed in both techniques. This morphology
depends on the cooling rate, the supercooling, and the presence of solutes (Petzold
and Aguilera, 2009). Channels of concentrated coffee extract were identified between
the ice crystals, verifying the freeze concentration phenomenon. These channels of
concentrated liquid determine the level of solute occlusion inside the ice layer. The
level of solute occlusion is related to ice morphology, which depends on the shape and
size of ice crystals. Differences in these parameters were observed between each FC
technique among the distance measured from the cooling surface. Morphometric
parameters were calculated to quantify these differences.
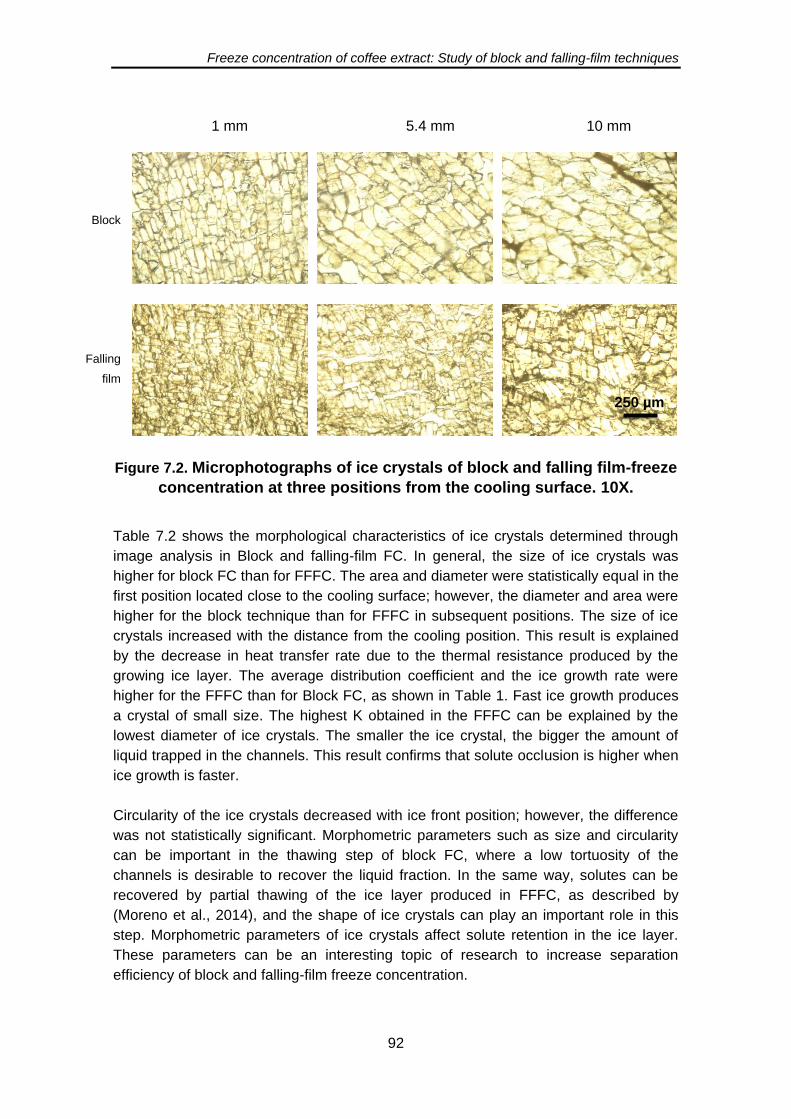
Freeze concentration of coffee extract: Study of block and falling-film techniques
92
Figure 7.2. Microphotographs of ice crystals of block and falling film-freeze
concentration at three positions from the cooling surface. 10X.
Table 7.2 shows the morphological characteristics of ice crystals determined through
image analysis in Block and falling-film FC. In general, the size of ice crystals was
higher for block FC than for FFFC. The area and diameter were statistically equal in the
first position located close to the cooling surface; however, the diameter and area were
higher for the block technique than for FFFC in subsequent positions. The size of ice
crystals increased with the distance from the cooling position. This result is explained
by the decrease in heat transfer rate due to the thermal resistance produced by the
growing ice layer. The average distribution coefficient and the ice growth rate were
higher for the FFFC than for Block FC, as shown in Table 1. Fast ice growth produces
a crystal of small size. The highest K obtained in the FFFC can be explained by the
lowest diameter of ice crystals. The smaller the ice crystal, the bigger the amount of
liquid trapped in the channels. This result confirms that solute occlusion is higher when
ice growth is faster.
Circularity of the ice crystals decreased with ice front position; however, the difference
was not statistically significant. Morphometric parameters such as size and circularity
can be important in the thawing step of block FC, where a low tortuosity of the
channels is desirable to recover the liquid fraction. In the same way, solutes can be
recovered by partial thawing of the ice layer produced in FFFC, as described by
(Moreno et al., 2014), and the shape of ice crystals can play an important role in this
step. Morphometric parameters of ice crystals affect solute retention in the ice layer.
These parameters can be an interesting topic of research to increase separation
efficiency of block and falling-film freeze concentration.
Block
Falling
film
1 mm 5.4 mm 10 mm
250 µm
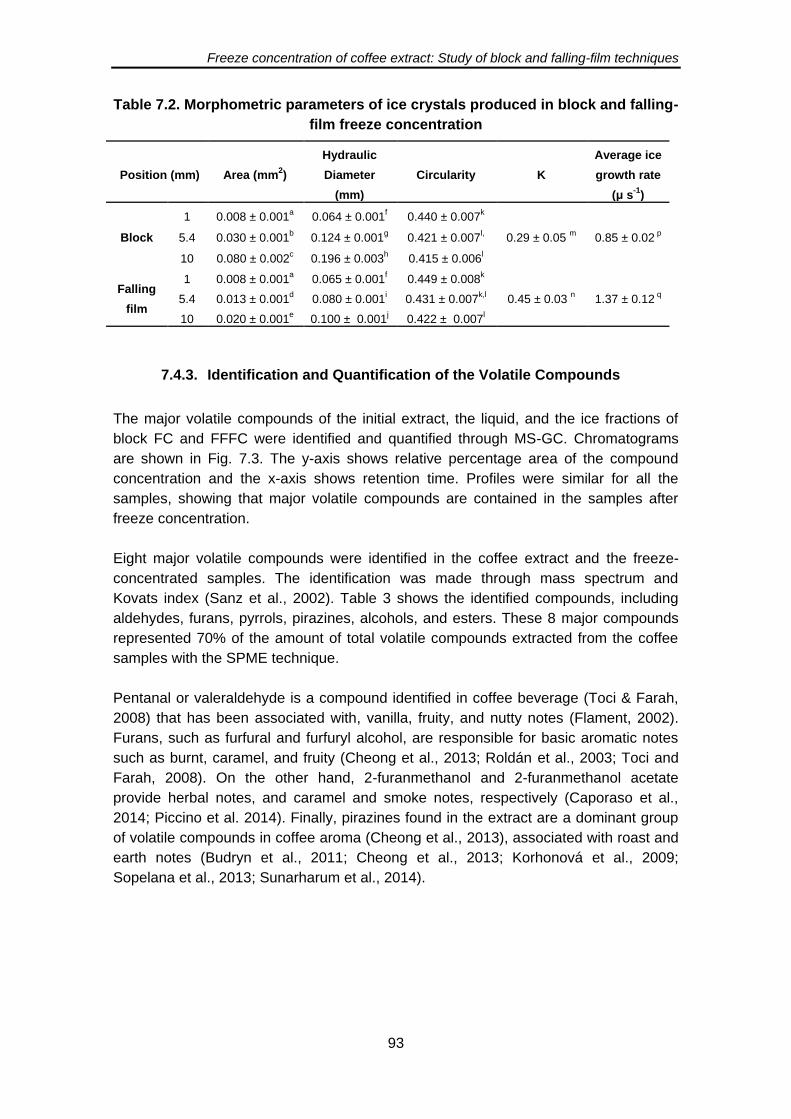
Freeze concentration of coffee extract: Study of block and falling-film techniques
93
Table 7.2. Morphometric parameters of ice crystals produced in block and falling-
film freeze concentration
Position (mm) Area (mm2)
Hydraulic
Diameter
(mm)
Circularity K
Average ice
growth rate
(μ s-1
)
Block
1 0.008 ± 0.001a
0.064 ± 0.001f
0.440 ± 0.007k
0.29 ± 0.05 m
0.85 ± 0.02 p
5.4 0.030 ± 0.001b
0.124 ± 0.001g
0.421 ± 0.007l,
10 0.080 ± 0.002c
0.196 ± 0.003h
0.415 ± 0.006l
Falling
film
1 0.008 ± 0.001a
0.065 ± 0.001f
0.449 ± 0.008k
0.45 ± 0.03 n 1.37 ± 0.12
q 5.4 0.013 ± 0.001
d 0.080 ± 0.001
i 0.431 ± 0.007
k,l
10 0.020 ± 0.001e
0.100 ± 0.001j
0.422 ± 0.007l
7.4.3. Identification and Quantification of the Volatile Compounds
The major volatile compounds of the initial extract, the liquid, and the ice fractions of
block FC and FFFC were identified and quantified through MS-GC. Chromatograms
are shown in Fig. 7.3. The y-axis shows relative percentage area of the compound
concentration and the x-axis shows retention time. Profiles were similar for all the
samples, showing that major volatile compounds are contained in the samples after
freeze concentration.
Eight major volatile compounds were identified in the coffee extract and the freeze-
concentrated samples. The identification was made through mass spectrum and
Kovats index (Sanz et al., 2002). Table 3 shows the identified compounds, including
aldehydes, furans, pyrrols, pirazines, alcohols, and esters. These 8 major compounds
represented 70% of the amount of total volatile compounds extracted from the coffee
samples with the SPME technique.
Pentanal or valeraldehyde is a compound identified in coffee beverage (Toci & Farah,
2008) that has been associated with, vanilla, fruity, and nutty notes (Flament, 2002).
Furans, such as furfural and furfuryl alcohol, are responsible for basic aromatic notes
such as burnt, caramel, and fruity (Cheong et al., 2013; Roldán et al., 2003; Toci and
Farah, 2008). On the other hand, 2-furanmethanol and 2-furanmethanol acetate
provide herbal notes, and caramel and smoke notes, respectively (Caporaso et al.,
2014; Piccino et al. 2014). Finally, pirazines found in the extract are a dominant group
of volatile compounds in coffee aroma (Cheong et al., 2013), associated with roast and
earth notes (Budryn et al., 2011; Cheong et al., 2013; Korhonová et al., 2009;
Sopelana et al., 2013; Sunarharum et al., 2014).
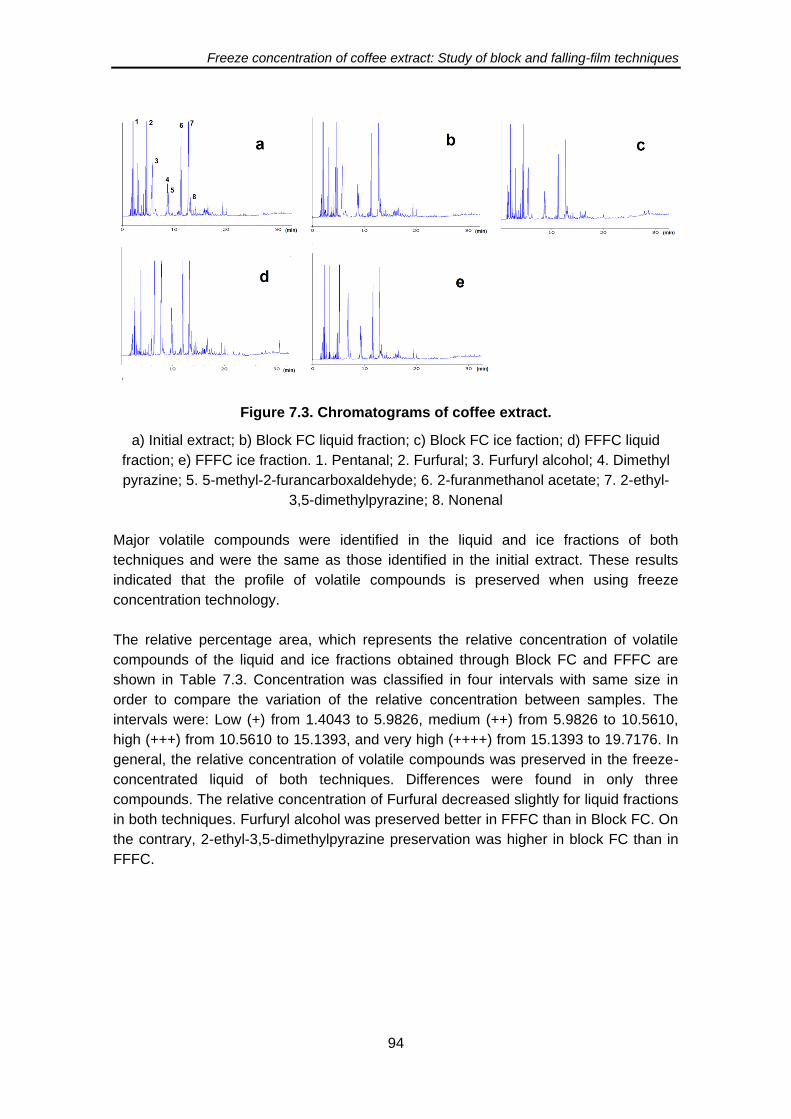
Freeze concentration of coffee extract: Study of block and falling-film techniques
94
Figure 7.3. Chromatograms of coffee extract.
a) Initial extract; b) Block FC liquid fraction; c) Block FC ice faction; d) FFFC liquid
fraction; e) FFFC ice fraction. 1. Pentanal; 2. Furfural; 3. Furfuryl alcohol; 4. Dimethyl
pyrazine; 5. 5-methyl-2-furancarboxaldehyde; 6. 2-furanmethanol acetate; 7. 2-ethyl-
3,5-dimethylpyrazine; 8. Nonenal
Major volatile compounds were identified in the liquid and ice fractions of both
techniques and were the same as those identified in the initial extract. These results
indicated that the profile of volatile compounds is preserved when using freeze
concentration technology.
The relative percentage area, which represents the relative concentration of volatile
compounds of the liquid and ice fractions obtained through Block FC and FFFC are
shown in Table 7.3. Concentration was classified in four intervals with same size in
order to compare the variation of the relative concentration between samples. The
intervals were: Low (+) from 1.4043 to 5.9826, medium (++) from 5.9826 to 10.5610,
high (+++) from 10.5610 to 15.1393, and very high (++++) from 15.1393 to 19.7176. In
general, the relative concentration of volatile compounds was preserved in the freeze-
concentrated liquid of both techniques. Differences were found in only three
compounds. The relative concentration of Furfural decreased slightly for liquid fractions
in both techniques. Furfuryl alcohol was preserved better in FFFC than in Block FC. On
the contrary, 2-ethyl-3,5-dimethylpyrazine preservation was higher in block FC than in
FFFC.
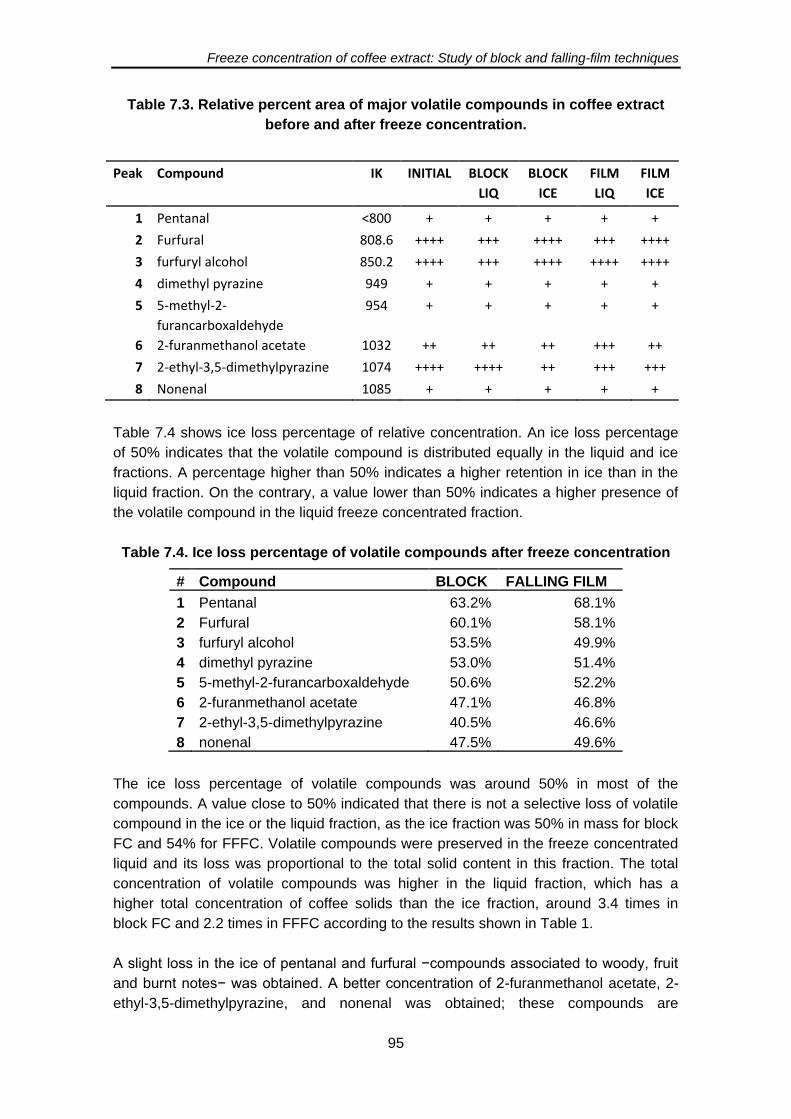
Freeze concentration of coffee extract: Study of block and falling-film techniques
95
Table 7.3. Relative percent area of major volatile compounds in coffee extract
before and after freeze concentration.
Peak Compound IK INITIAL BLOCK
LIQ
BLOCK
ICE
FILM
LIQ
FILM
ICE
1 Pentanal <800 + + + + +
2 Furfural 808.6 ++++ +++ ++++ +++ ++++
3 furfuryl alcohol 850.2 ++++ +++ ++++ ++++ ++++
4 dimethyl pyrazine 949 + + + + +
5 5-methyl-2-
furancarboxaldehyde
954 + + + + +
6 2-furanmethanol acetate 1032 ++ ++ ++ +++ ++
7 2-ethyl-3,5-dimethylpyrazine 1074 ++++ ++++ ++ +++ +++
8 Nonenal 1085 + + + + +
Table 7.4 shows ice loss percentage of relative concentration. An ice loss percentage
of 50% indicates that the volatile compound is distributed equally in the liquid and ice
fractions. A percentage higher than 50% indicates a higher retention in ice than in the
liquid fraction. On the contrary, a value lower than 50% indicates a higher presence of
the volatile compound in the liquid freeze concentrated fraction.
Table 7.4. Ice loss percentage of volatile compounds after freeze concentration
# Compound BLOCK FALLING FILM
1 Pentanal 63.2% 68.1%
2 Furfural 60.1% 58.1%
3 furfuryl alcohol 53.5% 49.9%
4 dimethyl pyrazine 53.0% 51.4%
5 5-methyl-2-furancarboxaldehyde 50.6% 52.2%
6 2-furanmethanol acetate 47.1% 46.8%
7 2-ethyl-3,5-dimethylpyrazine 40.5% 46.6%
8 nonenal 47.5% 49.6%
The ice loss percentage of volatile compounds was around 50% in most of the
compounds. A value close to 50% indicated that there is not a selective loss of volatile
compound in the ice or the liquid fraction, as the ice fraction was 50% in mass for block
FC and 54% for FFFC. Volatile compounds were preserved in the freeze concentrated
liquid and its loss was proportional to the total solid content in this fraction. The total
concentration of volatile compounds was higher in the liquid fraction, which has a
higher total concentration of coffee solids than the ice fraction, around 3.4 times in
block FC and 2.2 times in FFFC according to the results shown in Table 1.
A slight loss in the ice of pentanal and furfural −compounds associated to woody, fruit
and burnt notes− was obtained. A better concentration of 2-furanmethanol acetate, 2-
ethyl-3,5-dimethylpyrazine, and nonenal was obtained; these compounds are
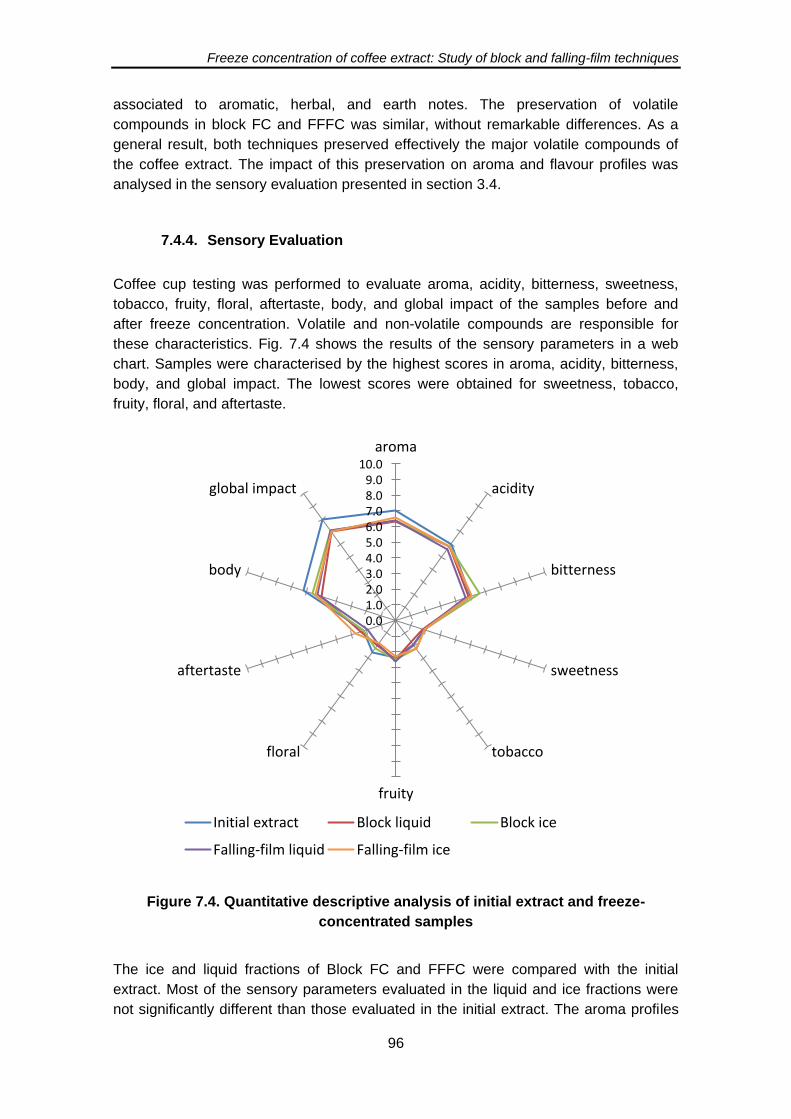
Freeze concentration of coffee extract: Study of block and falling-film techniques
96
associated to aromatic, herbal, and earth notes. The preservation of volatile
compounds in block FC and FFFC was similar, without remarkable differences. As a
general result, both techniques preserved effectively the major volatile compounds of
the coffee extract. The impact of this preservation on aroma and flavour profiles was
analysed in the sensory evaluation presented in section 3.4.
7.4.4. Sensory Evaluation
Coffee cup testing was performed to evaluate aroma, acidity, bitterness, sweetness,
tobacco, fruity, floral, aftertaste, body, and global impact of the samples before and
after freeze concentration. Volatile and non-volatile compounds are responsible for
these characteristics. Fig. 7.4 shows the results of the sensory parameters in a web
chart. Samples were characterised by the highest scores in aroma, acidity, bitterness,
body, and global impact. The lowest scores were obtained for sweetness, tobacco,
fruity, floral, and aftertaste.
Figure 7.4. Quantitative descriptive analysis of initial extract and freeze-
concentrated samples
The ice and liquid fractions of Block FC and FFFC were compared with the initial
extract. Most of the sensory parameters evaluated in the liquid and ice fractions were
not significantly different than those evaluated in the initial extract. The aroma profiles
0.01.02.03.04.05.06.07.08.09.0
10.0
aroma
acidity
bitterness
sweetness
tobacco
fruity
floral
aftertaste
body
global impact
Initial extract Block liquid Block ice
Falling-film liquid Falling-film ice
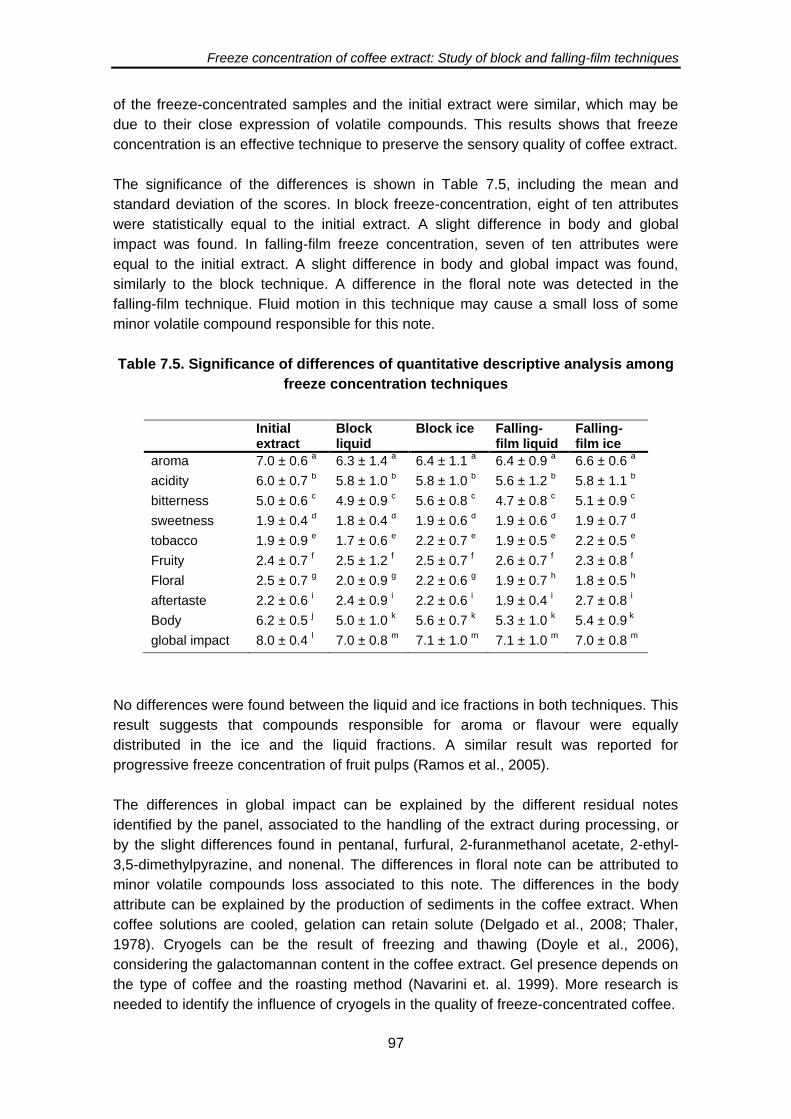
Freeze concentration of coffee extract: Study of block and falling-film techniques
97
of the freeze-concentrated samples and the initial extract were similar, which may be
due to their close expression of volatile compounds. This results shows that freeze
concentration is an effective technique to preserve the sensory quality of coffee extract.
The significance of the differences is shown in Table 7.5, including the mean and
standard deviation of the scores. In block freeze-concentration, eight of ten attributes
were statistically equal to the initial extract. A slight difference in body and global
impact was found. In falling-film freeze concentration, seven of ten attributes were
equal to the initial extract. A slight difference in body and global impact was found,
similarly to the block technique. A difference in the floral note was detected in the
falling-film technique. Fluid motion in this technique may cause a small loss of some
minor volatile compound responsible for this note.
Table 7.5. Significance of differences of quantitative descriptive analysis among
freeze concentration techniques
Initial
extract Block liquid
Block ice Falling-film liquid
Falling-film ice
aroma 7.0 ± 0.6 a 6.3 ± 1.4
a 6.4 ± 1.1
a 6.4 ± 0.9
a 6.6 ± 0.6
a
acidity 6.0 ± 0.7 b 5.8 ± 1.0
b 5.8 ± 1.0
b 5.6 ± 1.2
b 5.8 ± 1.1
b
bitterness 5.0 ± 0.6 c 4.9 ± 0.9
c 5.6 ± 0.8
c 4.7 ± 0.8
c 5.1 ± 0.9
c
sweetness 1.9 ± 0.4 d 1.8 ± 0.4
d 1.9 ± 0.6
d 1.9 ± 0.6
d 1.9 ± 0.7
d
tobacco 1.9 ± 0.9 e 1.7 ± 0.6
e 2.2 ± 0.7
e 1.9 ± 0.5
e 2.2 ± 0.5
e
Fruity 2.4 ± 0.7 f 2.5 ± 1.2
f 2.5 ± 0.7
f 2.6 ± 0.7
f 2.3 ± 0.8
f
Floral 2.5 ± 0.7 g 2.0 ± 0.9
g 2.2 ± 0.6
g 1.9 ± 0.7
h 1.8 ± 0.5
h
aftertaste 2.2 ± 0.6 i 2.4 ± 0.9
i 2.2 ± 0.6
i 1.9 ± 0.4
i 2.7 ± 0.8
i
Body 6.2 ± 0.5 j 5.0 ± 1.0
k 5.6 ± 0.7
k 5.3 ± 1.0
k 5.4 ± 0.9
k
global impact 8.0 ± 0.4 l 7.0 ± 0.8
m 7.1 ± 1.0
m 7.1 ± 1.0
m 7.0 ± 0.8
m
No differences were found between the liquid and ice fractions in both techniques. This
result suggests that compounds responsible for aroma or flavour were equally
distributed in the ice and the liquid fractions. A similar result was reported for
progressive freeze concentration of fruit pulps (Ramos et al., 2005).
The differences in global impact can be explained by the different residual notes
identified by the panel, associated to the handling of the extract during processing, or
by the slight differences found in pentanal, furfural, 2-furanmethanol acetate, 2-ethyl-
3,5-dimethylpyrazine, and nonenal. The differences in floral note can be attributed to
minor volatile compounds loss associated to this note. The differences in the body
attribute can be explained by the production of sediments in the coffee extract. When
coffee solutions are cooled, gelation can retain solute (Delgado et al., 2008; Thaler,
1978). Cryogels can be the result of freezing and thawing (Doyle et al., 2006),
considering the galactomannan content in the coffee extract. Gel presence depends on
the type of coffee and the roasting method (Navarini et. al. 1999). More research is
needed to identify the influence of cryogels in the quality of freeze-concentrated coffee.

Freeze concentration of coffee extract: Study of block and falling-film techniques
98
A comparable result for preservation of quality with freeze concentration was reported
for preservation of functional quality by Moreno et al. (2014c). The concentration of
bioactive compounds and the antioxidant activity of coffee extract were preserved
when using freeze concentration. In the present work, volatile compounds and sensory
quality were also preserved. In both results, volatile and bioactive compounds were
equally distributed in the ice and the liquid fractions, which indicates that the increase
in total solid concentration produces a concentration of the compounds responsible for
sensory and functional properties without a selectivity of the compounds retained in the
ice. These results confirmed the benefits of implementing freeze concentration to
preserve the quality of the extract.
7.5. Conclusions
Block and falling-film freeze concentration techniques were tested to compare solute
retention in ice, ice morphology, volatile compounds, and preservation of sensory
quality in both techniques. The freezing rate affects the average distribution coefficient.
Block FC produces ice with less solute retention and a higher concentration index in
one stage than falling-film FC due to low freezing rates. Falling-film FC is a faster
technique and has a higher dewatering capacity than block FC.
The morphology of the ice is related to the freezing rate. For a high freezing rate, low
size of ice crystals and high solute retention in the ice were obtained. The diameter and
area of ice crystals produced through block FC were higher than those of ice crystals
obtained from FFFC due to the freezing rate. The size of ice crystals defines the space
where the concentrated liquid is retained, its control is important to increase
concentration efficiency.
The major volatile compounds of coffee extract are preserved in both techniques of
freeze concentration. The sensory quality of the extract is preserved by freeze
concentration. Results indicate that falling-film freeze concentration can be used as a
fast technique to concentrate coffee extract, and block freeze-concentration is effective
to produce ice with low solid retention. Both techniques are useful to preserve the
sensory quality of the beverage.
7.6. References
Aider, M., & de Halleux, D. (2008). Production of concentrated cherry and apricot juices
by cryoconcentration technology. LWT - Food Science and Technology, 41(10),
1768–1775.
Aider, M., & de Halleux, D. (2009). Cryoconcentration technology in the bio-food
industry: Principles and applications. LWT - Food Science and Technology, 42(3),
679–685.

Freeze concentration of coffee extract: Study of block and falling-film techniques
99
Ayel, V., Lottin, O., Faucheux, M., Sallier, D., & Peerhossaini, H. (2006). Crystallisation
of undercooled aqueous solutions: Experimental study of free dendritic growth in
cylindrical geometry. International Journal of Heat and Mass Transfer, 49(11-12),
1876–1884.
Aguilera, J. M. (2007). Microstructure and food product engineering. Food Technology,
54 (11), 56-65.
Blond, G., Simatos, D., Gilles, C., & Bernard, J. (1997). Modeling of the water-sucrose
state diagram below 0 ° C. Carbohydrate Research, 298, 139–145.
Budryn, G., Nebesny, E., Kula, J., Majda, T., & Krysiakk, W. (2011). HS-SPME / GC /
MS Profiles of Convectively and Microwave Roasted Ivory Coast Robusta Coffee
Brews. Czeck Journal of Food Science, 29(2), 151–160.
Butler, M. F. (2001). Instability formation and directional dendritic growth of ice studied
by optical interferometry. Crystal Growth & Design, 1(3), 213–223.
Butler, M. F. (2002). Growth of Solutal Ice Dendrites Studied by Optical Interferometry.
Crystal Growth & Design, 2(1), 59–66.
Caporaso, N., Genovese, A., Canela, M. D., Civitella, A., & Sacchi, R. (2014).
Neapolitan coffee brew chemical analysis in comparison to espresso, moka and
American brews. Food Research International, 1–9.
Caretta, O., Courtot, F., & Davies, T. (2006). Measurement of salt entrapment during
the directional solidification of brine under forced mass convection. Journal of
Crystal Growth, 294(2), 151–155.
Chen, P., & Chen, X. D. (2000). A generalized correlation of solute inclusion in ice
formed from aqueous solutions and food liquids on sub-cooled surface. The
Canadian Journal of Chemical Engineering, 78, 312–319.
Chen, P., Chen, X. D., & Free, K. W. (1999). An experimental study on the spatial
uniformity of solute inclusion in ice formed from falling film flows on a sub-cooled
surface. Journal of Food Engineering, 39, 101–105.
Cheong, M. W., Tong, K. H., Ong, J. J. M., Liu, S. Q., Curran, P., & Yu, B. (2013).
Volatile composition and antioxidant capacity of Arabica coffee. Food Research
International, 51(1), 388–396.
Delgado, P., Vignoli, J., Siika-aho, M., Franco, T. 2008. Sediments in coffee extracts:
Composition and control by enzymatic hydrolysis. Food Chemistry, 110(1), 168-
176.
Doyle, J. P., Giannouli, P., Martin, E. J., Brooks, M., & Morris, E. R. (2006). Effect of
sugars, galactose content and chainlength on freeze–thaw gelation of
galactomannans. Carbohydrate Polymers, 64(3), 391–401.

Freeze concentration of coffee extract: Study of block and falling-film techniques
100
Farah, a, Monteiro, M., Calado, V., Franca, a, & Trugo, L. (2006). Correlation between
cup quality and chemical attributes of Brazilian coffee. Food Chemistry, 98(2),
373–380.
Fissore, D., Pisano, R., & Barresi, A. a. (2014). Applying quality-by-design to develop a
coffee freeze-drying process. Journal of Food Engineering, 123, 179–187.
Flament I. Coffee flavor chemistry. John Wiley and Sons. England. 2002.
Germain, J. C., & Aguilera, J. M. (2012). Identifying industrial food foam structures by
2D surface image analysis and pattern recognition. Journal of Food Engineering,
111(2), 440–448.
Gulfo, R., Auleda, J. M., Moreno, F. L., Ruiz, Y., Hernández, E., & Raventós, M.
(2013). Multi-plate freeze concentration: Recovery of solutes occluded in the ice
and determination of thawing time. Food Science and Technology International.
Hernández, E., Raventós, M., Auleda, J. M., & Ibarz, a. (2010). Freeze concentration of
must in a pilot plant falling film cryoconcentrator. Innovative Food Science &
Emerging Technologies, 11(1), 130–136.
Hottot, A., Vessot, S., & Andrieu, J. (2007). Freeze drying of pharmaceuticals in vials:
Influence of freezing protocol and sample configuration on ice morphology and
freeze-dried cake texture. Chemical Engineering and Processing: Process
Intensification, 46(7), 666–674.
Korhonová, M., Hron, K., Klimcíková, D., Müller, L., Bednár, P., & Barták, P. (2009).
Coffee aroma--statistical analysis of compositional data. Talanta, 80(2), 710–5.
MacLeod, C. S., McKittrick, J. a., Hindmarsh, J. P., Johns, M. L., & Wilson, D. I. (2006).
Fundamentals of spray freezing of instant coffee. Journal of Food Engineering,
74(4), 451–461.
Moreno, F. L., Hernández, E., Raventós, M., Robles, C., & Ruiz, Y. (2014). A process
to concentrate coffee extract by the integration of falling film and block freeze-
concentration. Journal of Food Engineering, 128, 88–95.
Moreno, F. L., Raventós, M., Hernández, E., & Ruiz, Y. (2014a). Behaviour of falling-
film freeze concentration of coffee extract. Journal of Food Engineering, 141, 20–
26.
Moreno, F. L., Raventós, M., Hernández, E., & Ruiz, Y. (2014b). Block freeze-
concentration of coffee extract: effect of freezing and thawing stages on solute
recovery and bioactive compounds. Journal of Food Engineering, 120, 158–166.
Moreno, F. L., Raventós, M., Hernández, E., Santamaría, N., Acosta, J., Pirachican,
O., Ruiz, Y. (2014). Rheological Behaviour, Freezing Curve, and Density of Coffee
Solutions at Temperatures Close to Freezing. International Journal of Food
Properties, (March), doi:10.1080/10942912.2013.833221
Freeze concentration of coffee extract: Study of block and falling-film techniques
101
Nakagawa, K., Maebashi, S., & Maeda, K. (2010). Freeze-thawing as a path to
concentrate aqueous solution. Separation and Purification Technology, 73(3),
403–408.
Nakagawa, K., Nagahama, H., Maebashi, S., & Maeda, K. (2010). Usefulness of solute
elution from frozen matrix for freeze-concentration technique. Chemical
Engineering Research and Design, 88(5-6), 718–724.
Okawa, S., Ito, T., & Saito, A. (2009). Effect of crystal orientation on freeze
concentration of solutions. International Journal of Refrigeration, 32(2), 246–252.
Pardo, J. M., Suess, F., & Niranjan, K. (2002). An investigation into the relationship
between freezing rate and mean ice crystal size of coffee extarcts. Trans IChemE,
80, 176–182.
Petzold, G., & Aguilera, J. M. (2009). Ice Morphology: Fundamentals and
Technological Applications in Foods. Food Biophysics, 4(4), 378–396.
Petzold, G., & Aguilera, J. M. (2013). Centrifugal freeze concentration. Innovative Food
Science & Emerging Technologies.
Piccino, S., Boulanger, R., Descroix, F., & Shum Cheong Sing, A. (2014). Aromatic
composition and potent odorants of the “specialty coffee” brew “Bourbon Pointu”
correlated to its three trade classifications. Food Research International, 61, 264–
271.
Qin, F. G. F., Chen, X. D., & Free, K. (2009). Freezing on subcooled surfaces,
phenomena, modeling and applications. International Journal of Heat and Mass
Transfer, 52(5-6), 1245–1253.
Ramos, F. a., Delgado, J. L., Bautista, E., Morales, a. L., & Duque, C. (2005). Changes
in volatiles with the application of progressive freeze-concentration to Andes berry
(Rubus glaucus Benth). Journal of Food Engineering, 69(3), 291–297.
Raventós, M., Hernández, E., Auleda, J. M., & Ibarz, A. (2007). Concentration of
aqueous sugar solutions in a multi-plate cryoconcentrator. Journal of Food
Engineering, 79(2), 577–585.
Ribeiro, J. S., Teófilo, R. F., Augusto, F., & Ferreira, M. M. C. (2010). Simultaneous
optimization of the microextraction of coffee volatiles using response surface
methodology and principal component analysis. Chemometrics and Intelligent
Laboratory Systems, 102(1), 45–52.
Rodrigues, M. A., Miller, M. A., Glass, M. A., Singh, S. K., & Johnston, K. P. (2011).
Effect of Freezing Rate and Dendritic Ice Formation on Concentration Profiles of
Proteins Frozen in Cylindrical Vessels. Pharmaceutical Research, 100(4), 1316–
1329.
Freeze concentration of coffee extract: Study of block and falling-film techniques
102
Roldán, D., González, F., & Salazár, M. (2003). La Cadena del Café en Colombia.
Observatorio Agrocadenas Colombia - MADR, (29).
Ruiz, Y., Sánchez, J., Hernández, E., Auleda, J. ., & Raventós, M. (2010). Viscosidad
de zumos comerciales de melocotón, manzana y pera a temperaturas cercanas a
la congelación. Afinidad, 114–118.
Sánchez, J., Ruiz, Y., Auleda, J. M., Hernández, E., & Raventós, M. (2009). Review.
Freeze Concentration in the Fruit Juices Industry. Food Science and Technology
International, 15(4), 303–315.
Sánchez, J., Ruiz, Y., Raventós, M., Auleda, J. M., & Hernández, E. (2010).
Progressive freeze concentration of orange juice in a pilot plant falling film.
Innovative Food Science & Emerging Technologies, 11(4), 644–651.
Sanz, C., Czerny, M., Cid, C., & Schieberle, P. (2002). Comparison of potent odorants
in a filtered coffee brew and in an instant coffee beverage by aroma extract dilution
analysis (AEDA). European Food Research and Technology, 214(4), 299–302.
Sopelana, P., Pérez-Martínez, M., López-Galilea, I., de Peña, M. P., & Cid, C. (2013).
Effect of ultra high temperature (UHT) treatment on coffee brew stability. Food
Research International, 50(2), 682–690.
Sunarharum, W. B., Williams, D. J., & Smyth, H. E. (2014). Complexity of coffee flavor:
A compositional and sensory perspective. Food Research International, 62, 315–
325.
Toci, A. T., & Farah, A. (2008). Volatile compounds as potential defective coffee beans’
markers. Food Chemistry, 108(3), 1133–1141.
Icontec.Standard (2000). Sensory evaluation, coffee. Method for quantitative
descriptive sensory evaluation of coffee. NTC-4883, Colombia, 2000.
Navarini, L.; Gilli, R.; Gombar, V.; Abatanangelo, A.; Bosco, M.; Toffanin, R. 1999.
Polysaccharides from hot water extracts of roasted Coffea arabica beans: isolation
and characterization. Carbohydrate polymers, 40, (1) 71-81
Thaler, H. 1978. The chemistry of coffee extraction in relation to polysaccharides. Food
Chemistry, (4), 13-22
Freeze concentration of coffee extract: Study of block and falling-film techniques
103
8. A PROCESS TO CONCENTRATE COFFEE EXTRACT BY THE INTEGRATION
OF FALLING FILM AND BLOCK FREEZE-CONCENTRATION
8.1. Abstract
A process to concentrate aqueous coffee extract by freeze concentration is proposed
to achieve an industrially viable system. The techniques of falling film freeze
concentration, fractionated thawing and block freeze concentration were studied.
Batches of 40 kg of coffee extract with 5% initial solid concentration were freeze-
concentrated in seven stages in a falling film multi-plate freeze concentrator. The ice
from each stage was fractionally thawed to recover the coffee solids retained in the ice.
The diluted fractions of the thawing stage were freeze-concentrated using the block
technique. A concentrated extract with 32.6% solids and an effluent with 0.27% solids
were obtained through the integration of these techniques. A concentration index of
6.5, a concentration efficiency of 99.2% and a solute yield of 95% were obtained. The
integration of these simple techniques results in a concentration index and solute yield
comparable to industrial standards in freeze-concentrated coffee extract production.
Keywords: cryoconcentration; freeze-dried coffee; coffee extract; thawing
8.2. Introduction
Coffee is one of the most consumed beverage worldwide (Esquivel & Jiménez, 2012;
Sopelana et al., 2011). Freeze-dried coffee is a high-quality product of the coffee
industry because of the flavour preservation due to the low-temperature processing
conditions (MacLeod et al., 2006). The process of obtaining freeze-dried coffee begins
with the extraction of roasted coffee beans by percolation. Subsequently, the extract is
freeze-concentrated to remove part of the water and to obtain a concentrated extract.
The concentrated extract may be the final product or may be freeze-dried to remove
the remaining water to obtain soluble coffee (Boss et al., 2004). The use of freeze-
concentration technology is justified by the reduction of the freeze-drying process costs
by 25% (Van Pelt and Bassoli, 1990). In addition, the quality of the product is
preserved by low processing temperatures (Rahman et al., 2007).
Freeze concentration (FC) is a technique used to remove water from food fluids by
freezing (Sánchez et al., 2009). The solution is cooled below the freezing point to
produce and separate ice crystals. Three techniques are used for growth of ice
crystals, suspension FC, film FC (progressive or falling film FC) and block FC (also
known as freeze-thaw FC) (Aider and de Halleux, 2009; Sánchez et al., 2011a).
The most implemented technique in coffee processing at the industrial level is
suspension FC. This is an efficient technique in terms of ice purity and increased

Freeze concentration of coffee extract: Study of block and falling-film techniques
104
concentration (Qin et al., 2007; Qin et al., 2006; van der Ham et al., 2004). With this
technique, it is possible to concentrate the coffee extract to 32 to 35% solids and to
obtain a high-purity effluent with 0.1% solids (Van Mil & Bouman, 1990; Van Pelt &
Bassoli, 1990). However, this technique requires complicated systems of ice separation
and many moving parts, which increases the initial and operating costs (Aider and de
Halleux, 2009; Miyawaki et al., 2005; Sánchez et al., 2009). For this reason, several
other FC techniques have been studied. Recently, the industrial future of freeze
concentration has shifted toward the configuration of one-step systems or a
combination of systems rather than suspension freeze concentration because of the
simpler separation step (Petzold & Aguilera, 2009; Petzold et al., 2013).
In falling film freeze concentration (FFFC), the solution to be concentrated is in contact
with a cooled vertical plate on which the fluid descends. The ice forms a single layer on
the cold surface, and the solution is re-circulated continuously (Sánchez et al., 2011b).
FFFC has been studied with several food fluids (Belén et al., 2013; Chen et al., 1998;
Hernández et al., 2009, 2010; Raventós et al., 2007; Sánchez et al., 2010). Flesland
(1995) proposed multi-stage FFFC coupled to reverse osmosis for water desalination.
In that study, water elimination was efficient. Recently, the recovery of solutes of
sucrose solutions retained in ice was attempted using fractionated thawing of the ice
(Gulfo et al., 2013; Miyawaki et al., 2012).
In contrast, in block freeze concentration (block FC), the whole solution is frozen and
partially thawed to recover the concentrated liquid fraction (Aider and de Halleux,
2009). Block FC has been used for sucrose solutions, dairy products, syrup, mate
extract and fruit juices (Aider and Ounis, 2012; Aider et al., 2009; Boaventura et al.,
2012; Nakagawa et al., 2010). For coffee extracts, Moreno et al. (2014) and Moreno et
al. (2013) studied the effect of process conditions on the freezing and thawing stages
of block FC. The viability of the technique was primarily demonstrated for low solid
concentrations.
In some food applications, FC can be used to maximise the final solid content of the
solution. However, in the coffee industry, the minimisation of the solid content of the
final effluent is also important due to the high value of the product. Currently, there is
no plan to use FFFC or block FC to obtain an extract with a high solid concentration
and an effluent with a low solid content that comply with industrial requirements.
The aim of the present study was to propose a process to freeze-concentrate coffee
extracts through the integration of falling film freeze concentration, which includes
coffee solids recovery by fractionated thawing and block freeze concentration
techniques.
8.3. Materials and Methods
8.3.1. Materials
A coffee extract with 5% (w/w) wet basis of total solid content was prepared from
freeze-dried soluble coffee supplied by Buencafé Liofilizado de Colombia (Colombian
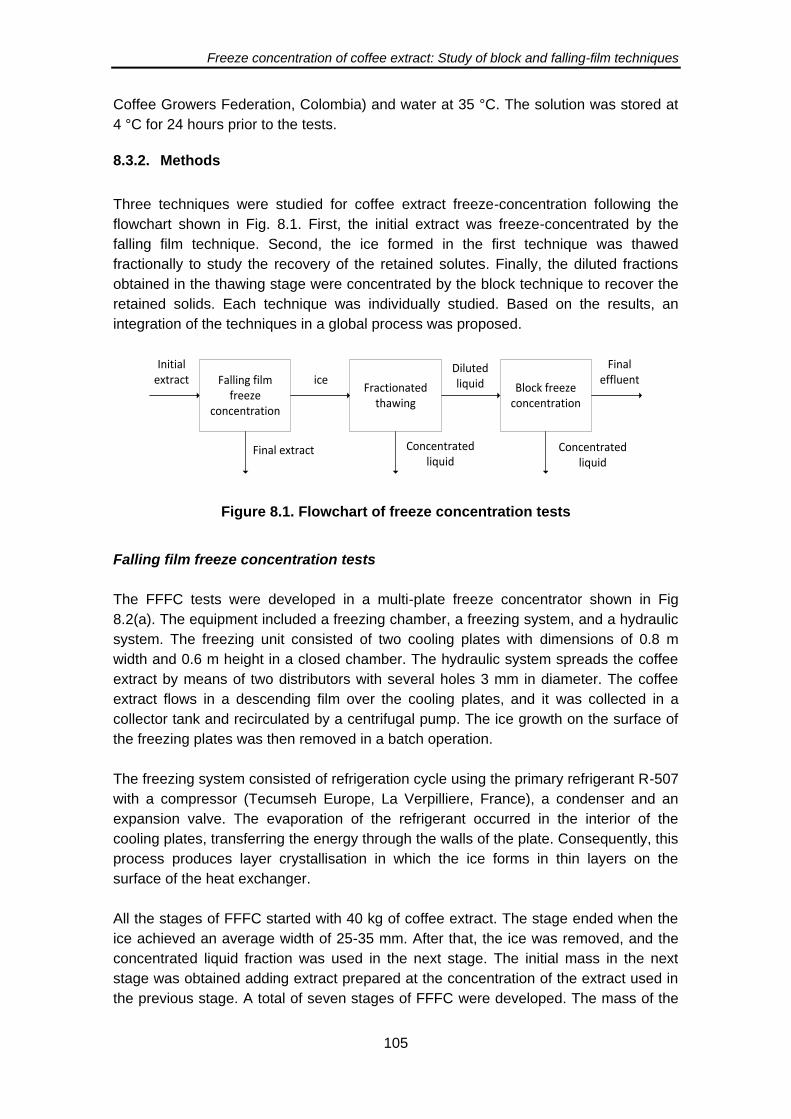
Freeze concentration of coffee extract: Study of block and falling-film techniques
105
Coffee Growers Federation, Colombia) and water at 35 °C. The solution was stored at
4 °C for 24 hours prior to the tests.
8.3.2. Methods
Three techniques were studied for coffee extract freeze-concentration following the
flowchart shown in Fig. 8.1. First, the initial extract was freeze-concentrated by the
falling film technique. Second, the ice formed in the first technique was thawed
fractionally to study the recovery of the retained solutes. Finally, the diluted fractions
obtained in the thawing stage were concentrated by the block technique to recover the
retained solids. Each technique was individually studied. Based on the results, an
integration of the techniques in a global process was proposed.
Falling film freeze
concentration
Fractionated thawing
Block freeze concentration
iceDilutedliquid
Initial extract
Final effluent
Final extract Concentrated liquid
Concentrated liquid
Figure 8.1. Flowchart of freeze concentration tests
Falling film freeze concentration tests
The FFFC tests were developed in a multi-plate freeze concentrator shown in Fig
8.2(a). The equipment included a freezing chamber, a freezing system, and a hydraulic
system. The freezing unit consisted of two cooling plates with dimensions of 0.8 m
width and 0.6 m height in a closed chamber. The hydraulic system spreads the coffee
extract by means of two distributors with several holes 3 mm in diameter. The coffee
extract flows in a descending film over the cooling plates, and it was collected in a
collector tank and recirculated by a centrifugal pump. The ice growth on the surface of
the freezing plates was then removed in a batch operation.
The freezing system consisted of refrigeration cycle using the primary refrigerant R-507
with a compressor (Tecumseh Europe, La Verpilliere, France), a condenser and an
expansion valve. The evaporation of the refrigerant occurred in the interior of the
cooling plates, transferring the energy through the walls of the plate. Consequently, this
process produces layer crystallisation in which the ice forms in thin layers on the
surface of the heat exchanger.
All the stages of FFFC started with 40 kg of coffee extract. The stage ended when the
ice achieved an average width of 25-35 mm. After that, the ice was removed, and the
concentrated liquid fraction was used in the next stage. The initial mass in the next
stage was obtained adding extract prepared at the concentration of the extract used in
the previous stage. A total of seven stages of FFFC were developed. The mass of the
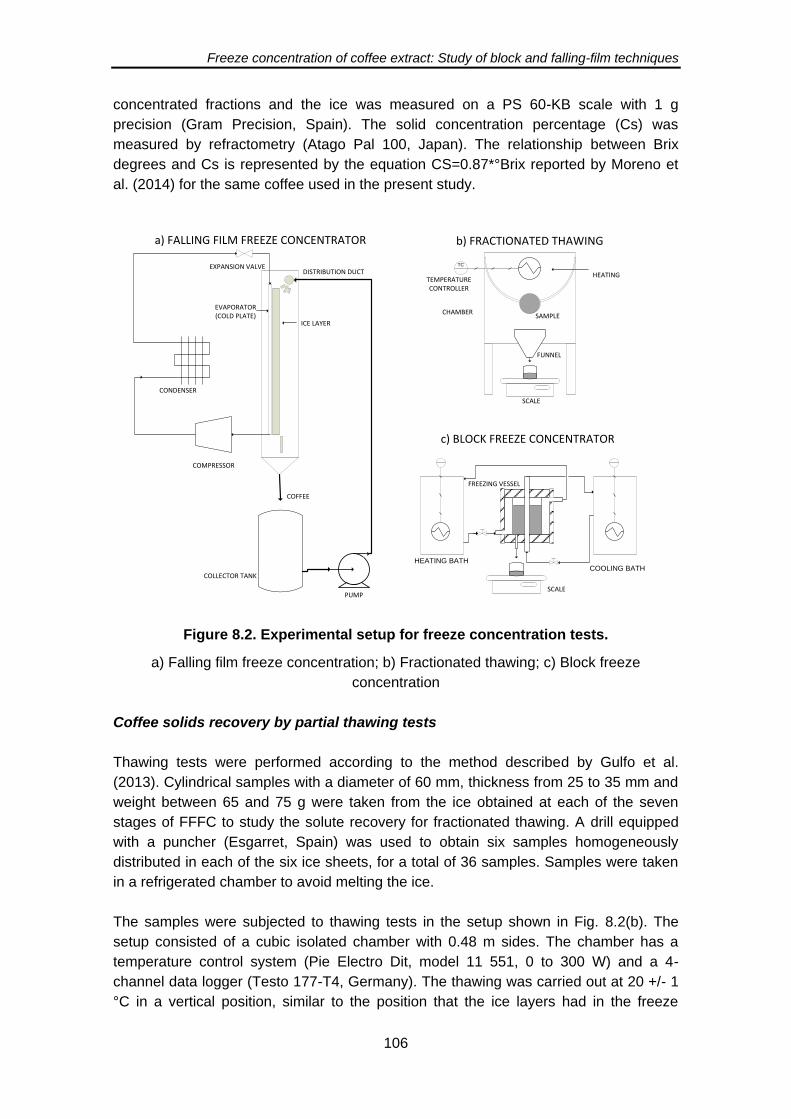
Freeze concentration of coffee extract: Study of block and falling-film techniques
106
concentrated fractions and the ice was measured on a PS 60-KB scale with 1 g
precision (Gram Precision, Spain). The solid concentration percentage (Cs) was
measured by refractometry (Atago Pal 100, Japan). The relationship between Brix
degrees and Cs is represented by the equation CS=0.87*°Brix reported by Moreno et
al. (2014) for the same coffee used in the present study.
CONDENSER
COMPRESSOR
PUMP
COLLECTOR TANK
COFFEE
EXPANSION VALVE
ICE LAYER
EVAPORATOR (COLD PLATE)
COOLING BATHHEATING BATH
x
SCALE
FREEZING VESSEL
a) FALLING FILM FREEZE CONCENTRATOR
c) BLOCK FREEZE CONCENTRATOR
SCALE
TC
CHAMBER
b) FRACTIONATED THAWING
SAMPLE
DISTRIBUTION DUCT
FUNNEL
HEATINGTEMPERATURE CONTROLLER
Figure 8.2. Experimental setup for freeze concentration tests.
a) Falling film freeze concentration; b) Fractionated thawing; c) Block freeze
concentration
Coffee solids recovery by partial thawing tests
Thawing tests were performed according to the method described by Gulfo et al.
(2013). Cylindrical samples with a diameter of 60 mm, thickness from 25 to 35 mm and
weight between 65 and 75 g were taken from the ice obtained at each of the seven
stages of FFFC to study the solute recovery for fractionated thawing. A drill equipped
with a puncher (Esgarret, Spain) was used to obtain six samples homogeneously
distributed in each of the six ice sheets, for a total of 36 samples. Samples were taken
in a refrigerated chamber to avoid melting the ice.
The samples were subjected to thawing tests in the setup shown in Fig. 8.2(b). The
setup consisted of a cubic isolated chamber with 0.48 m sides. The chamber has a
temperature control system (Pie Electro Dit, model 11 551, 0 to 300 W) and a 4-
channel data logger (Testo 177-T4, Germany). The thawing was carried out at 20 +/- 1
°C in a vertical position, similar to the position that the ice layers had in the freeze
Freeze concentration of coffee extract: Study of block and falling-film techniques
107
concentrator. The dripping of the melting ice is collected by a funnel connected to a
container on a scale (Ohaus PA3102, USA) with a precision of 0.01 g to measure the
mass. Ten thawing fractions of equal mass were separated, and the solid concentration
was measured by refractometry. The average concentration was calculated from the
data of the six samples of ice from each stage.
Block freeze concentration tests
Based on the results of the fractionated thawing tests, the diluted fractions of this stage
(fractions where the concentration index was less than 1) were mixed and freeze-
concentrated by the total block technique. The conditions of the FC test were as
follows: cooling temperature -10 °C, thawing temperature 20 °C and thawing direction
opposite to the freezing direction according to the best results reported by Moreno et
al. (2014).
The block freeze concentrator is shown in Fig. 2(c). One hundred sixty grams of the
coffee sample was placed into a cylindrical double jacked container measuring 5.2 cm
in diameter and 8.5 cm in height. The heat exchange fluid was a mixture of ethylene
glycol and water (53% w/w) coming from two baths (Polystat, Cole Parmer, USA) with
temperature control (-35 °C to 150 °C +/- 0.01 °C).
The cooling fluid temperature was settled at -10 °C. After the fluid reached that
temperature, it was circulated to the internal jacket to freeze the inner solution. The ice
growth occurred from the centre to the external wall of the container. When the sample
was completely frozen, the sample was thawed by pumping heating fluid through the
external jacket at 20 °C. A valve located on the bottom of the container and close to the
external wall was opened, and the liquid fraction was separated in a collector vessel on
a scale (Ohaus PA3102, USA) with a precision of 0.01 g for mass measurement. Ten
liquid fractions of the same mass were collected. The solid concentration of each
fraction was measured by refractometry (Atago Pal 100, Japan). Test were performed
in triplicate
Data analysis
Solute Yield (Y)
Solute yield represents the amount of solute or coffee solids recovered from the
original solution. Y was defined as the relationship between the mass of solute present
in the freeze-concentrated liquid and the mass of the solute present in the initial
solution, as calculated by Eq. 1 (Moreno et al., 2013; Nakagawa et al., 2010):
Y=ms liq/ms 0 (1)
Where, Y is the solute yield, m s liq is the solute mass in the liquid fraction, and m s 0 is
the initial solute mass.
Concentration Index
Freeze concentration of coffee extract: Study of block and falling-film techniques
108
The concentration index (CI) was defined as the relationship between the solid
concentration in the liquid freeze-concentrated fraction and the solid concentration in
the initial solution (Nakagawa et al., 2009):
CI = Cs liq / C s 0 (2)
Where, CI is the concentration index, Cs liq is the solid mass percentage in the freeze-
concentrated liquid, and Cs 0 is the solid mass percentage in the initial solution.
Thawing fraction
The thawing fraction (f) was defined as the ratio between the thawed mass and the
mass of the original solution as calculated by Eq. 3 (Miyawaki et al., 2012; Nakagawa
et al., 2010):
f = mliq/m0 (3)
Where, f is the thawing fraction, mliq is the freeze-concentrated liquid mass, and m0 is
the initial mass
Concentration efficiency
The concentration efficiency indicates the increase in the concentration of the solution
in relation to the amount of solids remaining in the ice (Hernández et al., 2010;
Sánchez et al., 2010). Efficiency was calculated by Eq. 4:
Eff = (Cs liq –Cs ice)/ Cs liq *100 (4)
Where, Eff is the concentration efficiency (%), Cs liq is the solid mass percentage in the
freeze-concentrated liquid, and Cs ice is the solid mass percentage in the ice (or diluted
fraction).
Statistical analysis
The experimental results obtained from this study were fit to different mathematical
models using the statistical software SPSS 20.0. The fit was evaluated by the
determination coefficient.
8.4. Results and Discussion
8.4.1. Falling film freeze concentration
The total solid concentration in the freeze-concentrated liquid for the seven FFFC
stages is shown in Fig. 3. The concentration progressed linearly according to Eq. 6:
Cs liq= 3.9 n + C0 R2= 0.991(6)
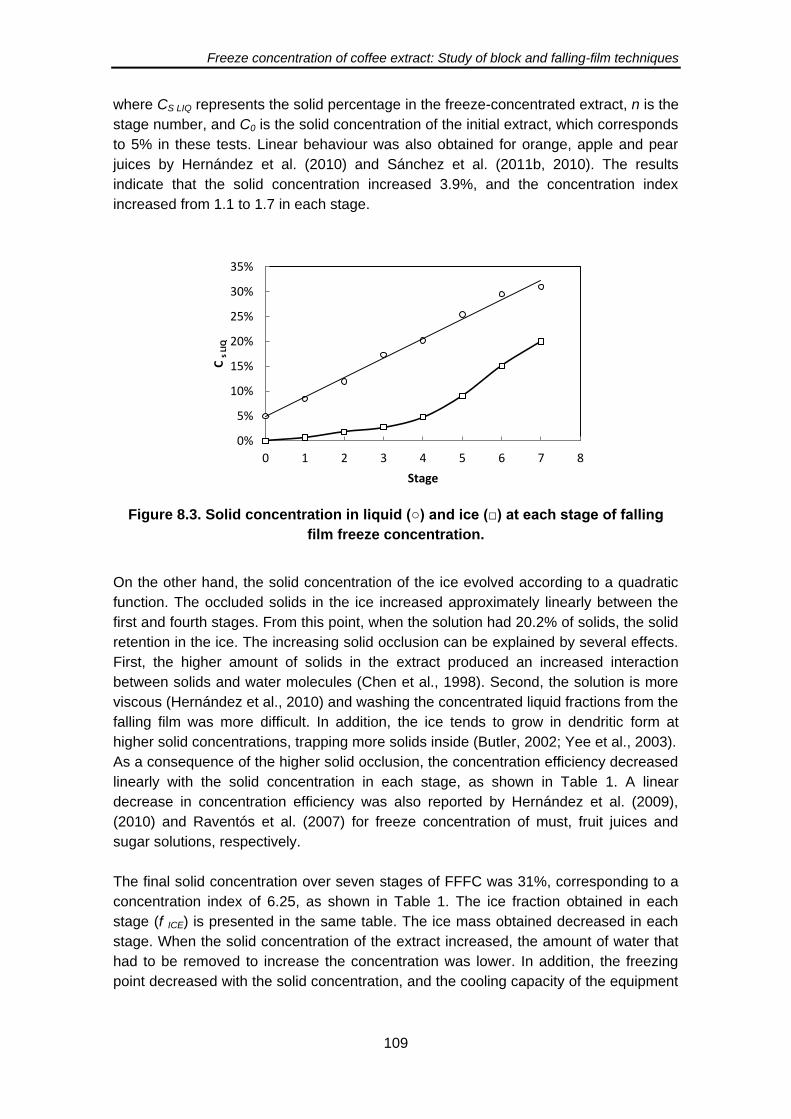
Freeze concentration of coffee extract: Study of block and falling-film techniques
109
where CS LIQ represents the solid percentage in the freeze-concentrated extract, n is the
stage number, and C0 is the solid concentration of the initial extract, which corresponds
to 5% in these tests. Linear behaviour was also obtained for orange, apple and pear
juices by Hernández et al. (2010) and Sánchez et al. (2011b, 2010). The results
indicate that the solid concentration increased 3.9%, and the concentration index
increased from 1.1 to 1.7 in each stage.
Figure 8.3. Solid concentration in liquid (○) and ice (□) at each stage of falling
film freeze concentration.
On the other hand, the solid concentration of the ice evolved according to a quadratic
function. The occluded solids in the ice increased approximately linearly between the
first and fourth stages. From this point, when the solution had 20.2% of solids, the solid
retention in the ice. The increasing solid occlusion can be explained by several effects.
First, the higher amount of solids in the extract produced an increased interaction
between solids and water molecules (Chen et al., 1998). Second, the solution is more
viscous (Hernández et al., 2010) and washing the concentrated liquid fractions from the
falling film was more difficult. In addition, the ice tends to grow in dendritic form at
higher solid concentrations, trapping more solids inside (Butler, 2002; Yee et al., 2003).
As a consequence of the higher solid occlusion, the concentration efficiency decreased
linearly with the solid concentration in each stage, as shown in Table 1. A linear
decrease in concentration efficiency was also reported by Hernández et al. (2009),
(2010) and Raventós et al. (2007) for freeze concentration of must, fruit juices and
sugar solutions, respectively.
The final solid concentration over seven stages of FFFC was 31%, corresponding to a
concentration index of 6.25, as shown in Table 1. The ice fraction obtained in each
stage (f ICE) is presented in the same table. The ice mass obtained decreased in each
stage. When the solid concentration of the extract increased, the amount of water that
had to be removed to increase the concentration was lower. In addition, the freezing
point decreased with the solid concentration, and the cooling capacity of the equipment
0%
5%
10%
15%
20%
25%
30%
35%
0 1 2 3 4 5 6 7 8
C s
LIQ
Stage

Freeze concentration of coffee extract: Study of block and falling-film techniques
110
limited the ice production. The ice in the last stage was less consistent due to the
increased amount of solids.
In Table 8.1, the solute yield of each stage (Y STAGE) is presented. The values began at
95% and decreased through the following stages. Moreover, the accumulated solute
yield in the seven stages was 0.42 based on the total amount of solids in the initial
extract. This means that 42% of the coffee solids present in the initial extract were in
the final extract. A large amount of solids was recovered in the ice due to the amount of
ice, despite the lower concentration of these solids.
Table 8.1. Initial coffee solid concentration (C s0), concentration index (CI), solute
yield at each stage (Y STAGE), ice fraction (f ice) and concentration efficiency (Eff) of
falling film freeze concentration tests
Stage C s0 (%) CI Y STAGE f ICE Eff (%)
1 5.0 1.70 0.95 0.44 91.7
2 8.4 2.40 0.87 0.39 84.9
3 11.9 3.49 0.96 0.34 83.8
4 17.3 4.07 0.78 0.33 76.2
5 20.2 5.12 0.89 0.30 64.2
6 25.4 5.95 0.78 0.33 48.8
7 29.5 6.25 0.78 0.26 35.4
The results indicated that falling film freeze concentration can be used to obtain a final
extract with a solid concentration that meets industrial requirements. However, a large
amount of solids remained occluded in the ice, and it is necessary to find a technique
to recover them. For this reason, fractionated thawing tests were performed.
8.4.2. Coffee solids recovery by fractionated thawing
The ice obtained in the seven stages of FFFC tests was thawed in ten mass fractions
to study the solid recovery. The concentration index (CI), calculated as the ratio
between the solid concentration in the thawed fraction and the average solid
concentration of the ice, is shown in Fig. 8.4. The CI began with values higher than 1
and descended throughout all stages of the thawing process. This indicated that the
concentrated extract was collected in the first fractions, and the thawing procedure can
be used for solid recovery in the ice. Gulfo et al. (2013); Miyawaki et al. (2012) and Yee
et al. (2003) reported similar behaviour of the concentration in solute recovery in the
thawing of sugar solutions.
The solid concentrations of the first fractions were higher than the average mainly due
to two phenomena. First, the concentration of the external faces of the ice is higher
than the concentration in the internal portion; the external faces were the first thawed
portions. In the face in contact with the cooling plate, the nucleation at supercooling
temperatures increased the concentration of the liquid fraction trapped when the ice

Freeze concentration of coffee extract: Study of block and falling-film techniques
111
front grew (Scholz et al, 1993). In the face in contact with the falling fluid film, the
dendritic growth of the ice trapped the concentrated extracts of the falling film (Sánchez
et al., 2010). Second, and possibly more important, there was solute diffusion from the
concentrated liquid occluded in the ice to the thawed drops. When the water drops
melted, there was enough time for solute diffusion to the drops, increasing the solid
concentration and allowing the recovery of a concentrated liquid (Nakagawa et al.,
2009). If the ice is partially thawed, the concentrated fraction trapped in the ice crystals
can flow freely and be separated. This phenomenon is known as sweating, and it is
very important in the solute recovery (Guardani et al., 2001).
Figure 8.4. Concentration index as a function of the thawing fraction.
(○) stage 1; (□) stage 2; (◊) stage 3; (Δ) stage 4; (x) stage 5; (ӿ) stage 6; (+) stage 7
Fig. 8.4 shows that the concentration index decreased with f, and there was a thawing
fraction in which the CI was less than one. From this point, the concentration of the
following fractions was less than the average; consequently, the thawing process
should be stopped at this point to avoid dilution of the recovered extract. At this fraction
(f at CI=1), two products are obtained, the initial fractions with CI>1 (concentrated
fraction) and the final fractions with CI<1 (diluted fraction).
The values of f at CI=1 between 0.3 and 0.7 were obtained as shown in Table 8.2.
These values depended on the initial solid concentration of the ice (C S 0 ice). A small
amount of ice had to be thawed to recover the solids in the first stages, in which the ice
had a lower solid concentration. In contrast, in last stages, a higher amount of ice had
to be thawed. The concentration of the thawing fraction was more homogenous (flatter
curve in Fig. 4). In addition, the movement of the solids is more difficult in high solid
concentrations because of the interaction between molecules.
The solid concentrations of the diluted (C s dil) and concentrated fractions (Cs conc ) for f
at CI=1 are shown in Table 8.2. Thawing fractions where CI=1 are also shown. These
are the fractions in which high solid recovery is achieved without excessive dilution of
0.0
0.5
1.0
1.5
2.0
2.5
3.0
3.5
4.0
4.5
0 0.1 0.2 0.3 0.4 0.5 0.6 0.7 0.8 0.9 1
C I
f
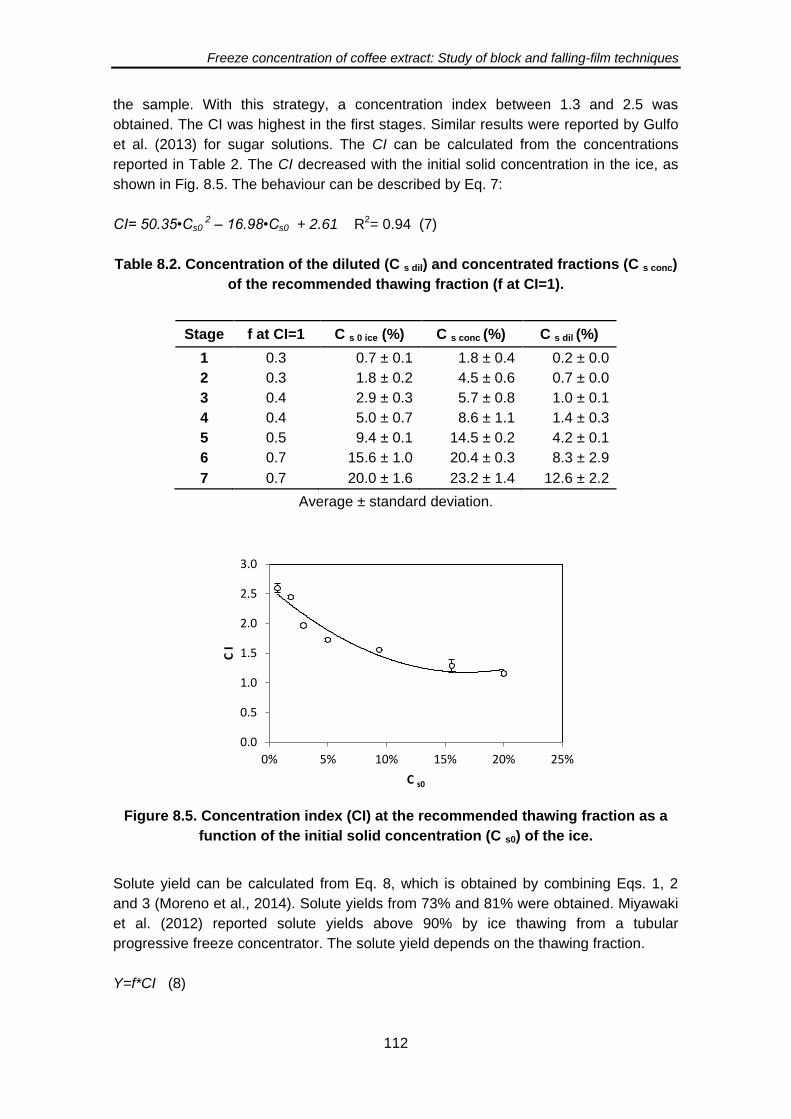
Freeze concentration of coffee extract: Study of block and falling-film techniques
112
the sample. With this strategy, a concentration index between 1.3 and 2.5 was
obtained. The CI was highest in the first stages. Similar results were reported by Gulfo
et al. (2013) for sugar solutions. The CI can be calculated from the concentrations
reported in Table 2. The CI decreased with the initial solid concentration in the ice, as
shown in Fig. 8.5. The behaviour can be described by Eq. 7:
CI= 50.35•Cs0 2 – 16.98•Cs0 + 2.61 R2= 0.94 (7)
Table 8.2. Concentration of the diluted (C s dil) and concentrated fractions (C s conc)
of the recommended thawing fraction (f at CI=1).
Stage f at CI=1 C s 0 ice (%) C s conc (%) C s dil (%)
1 0.3 0.7 ± 0.1 1.8 ± 0.4 0.2 ± 0.0
2 0.3 1.8 ± 0.2 4.5 ± 0.6 0.7 ± 0.0
3 0.4 2.9 ± 0.3 5.7 ± 0.8 1.0 ± 0.1
4 0.4 5.0 ± 0.7 8.6 ± 1.1 1.4 ± 0.3
5 0.5 9.4 ± 0.1 14.5 ± 0.2 4.2 ± 0.1
6 0.7 15.6 ± 1.0 20.4 ± 0.3 8.3 ± 2.9
7 0.7 20.0 ± 1.6 23.2 ± 1.4 12.6 ± 2.2
Average ± standard deviation.
Figure 8.5. Concentration index (CI) at the recommended thawing fraction as a
function of the initial solid concentration (C s0) of the ice.
Solute yield can be calculated from Eq. 8, which is obtained by combining Eqs. 1, 2
and 3 (Moreno et al., 2014). Solute yields from 73% and 81% were obtained. Miyawaki
et al. (2012) reported solute yields above 90% by ice thawing from a tubular
progressive freeze concentrator. The solute yield depends on the thawing fraction.
Y=f*CI (8)
0.0
0.5
1.0
1.5
2.0
2.5
3.0
0% 5% 10% 15% 20% 25%
C I
C s0
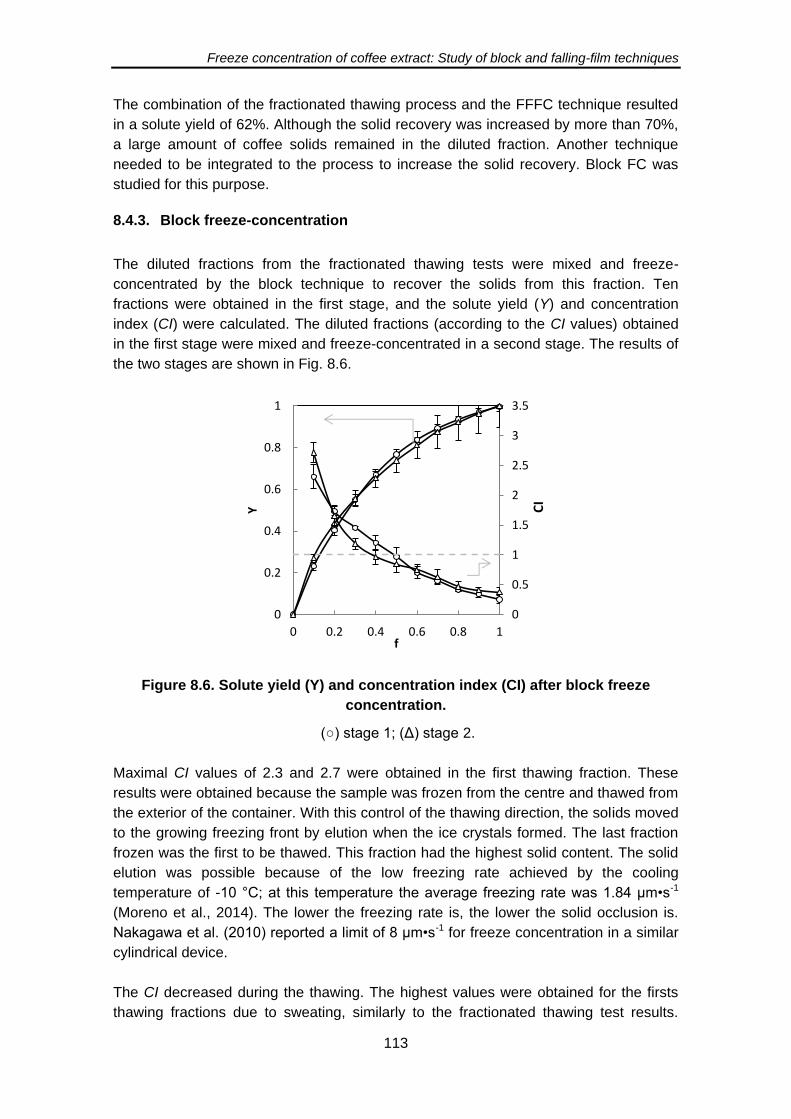
Freeze concentration of coffee extract: Study of block and falling-film techniques
113
The combination of the fractionated thawing process and the FFFC technique resulted
in a solute yield of 62%. Although the solid recovery was increased by more than 70%,
a large amount of coffee solids remained in the diluted fraction. Another technique
needed to be integrated to the process to increase the solid recovery. Block FC was
studied for this purpose.
8.4.3. Block freeze-concentration
The diluted fractions from the fractionated thawing tests were mixed and freeze-
concentrated by the block technique to recover the solids from this fraction. Ten
fractions were obtained in the first stage, and the solute yield (Y) and concentration
index (CI) were calculated. The diluted fractions (according to the CI values) obtained
in the first stage were mixed and freeze-concentrated in a second stage. The results of
the two stages are shown in Fig. 8.6.
Figure 8.6. Solute yield (Y) and concentration index (CI) after block freeze
concentration.
(○) stage 1; (Δ) stage 2.
Maximal CI values of 2.3 and 2.7 were obtained in the first thawing fraction. These
results were obtained because the sample was frozen from the centre and thawed from
the exterior of the container. With this control of the thawing direction, the solids moved
to the growing freezing front by elution when the ice crystals formed. The last fraction
frozen was the first to be thawed. This fraction had the highest solid content. The solid
elution was possible because of the low freezing rate achieved by the cooling
temperature of -10 °C; at this temperature the average freezing rate was 1.84 μm•s-1
(Moreno et al., 2014). The lower the freezing rate is, the lower the solid occlusion is.
Nakagawa et al. (2010) reported a limit of 8 μm•s-1 for freeze concentration in a similar
cylindrical device.
The CI decreased during the thawing. The highest values were obtained for the firsts
thawing fractions due to sweating, similarly to the fractionated thawing test results.
0
0.5
1
1.5
2
2.5
3
3.5
0
0.2
0.4
0.6
0.8
1
0 0.2 0.4 0.6 0.8 1
Y
f
CI

Freeze concentration of coffee extract: Study of block and falling-film techniques
114
Sweating is defined as crystal purification based on partial melting by heating the
cooling surface at a temperature close to the freezing point (Jiang et al., 2013).
Sweating depends on factors such as temperature, porosity of the ice layer, solid
concentration, and thawing rate (Rich et al., 2010). The coffee solids moved to the
thawing drops and increased the concentration in the drops; in this way, recovery of the
majority of solids was possible in the first fractions. As in fractionated thawing, sweating
is of great importance in block freeze concentration (Nakagawa et al., 2009).
The CI decreased until it reached a value of 1. In this thawing fraction (f at CI=1), it is
convenient to stop the thawing stage and to separate two streams, one diluted and one
concentrated. For the first stage of block FC with an initial solid concentration of 1.8%,
the CI was 1 at f=0.5. At this point, 77% of coffee solids have been recovered, and a CI
of 1.54 has been achieved, as can be calculated from data in Table 3. The mixture of
the five diluted fractions had a solid concentration of 0.9%; for this reason, this mixture
was freeze-concentrated in a second stage. For the second stage, CI was 1 at f=0.4.
When 40% of the extract was thawed, a solute yield of 66% and a CI of 1.6 were
achieved. The diluted fraction of the second stage had an average solid concentration
of 0.5%, as shown in Table 8.3.
Table 8.3. Results of block freeze concentration.
Thawing fractions when the concentration index (CI) is 1. thawing fraction when CI=1 (f
at CI=1); solid concentration of the Initial (C s0 (%));the concentrated (C s conc) and
diluted fractions (C s dil), and solute yield (Y)
Stage f at CI=1 C s0 (%) C s conc (%) C s dil (%) Y
1 0.5 1.9 ± 0.0 2.8 ± 0.1 0.9 ± 0.1 0.78 ± 0.01
2 0.4 0.9 ± 0.1 1.5 ± 0.1 0.5 ± 0.1 0.68 ± 0.02
Block FC was considered to be complete based on the solid concentration of the
diluted fraction in the second stage. A third stage could be implemented, but this
decision depends on the global process strategy and the desired solid concentration of
the final effluent.
8.4.4. Integration of falling film freeze concentration, ice thawing and block
freeze concentration
Falling film freeze concentration, fractionated thawing and block freeze concentration
can be integrated in a global strategy to establish an industrial process to concentrate
coffee extracts. In this process, the objective is to obtain an extract that is as
concentrated as possible and to minimise the concentration of the effluent to avoid the
coffee solid loss. Two streams, diluted and concentrated, are obtained in each
technique. The process is presented in Fig. 8.7. The mass and solid concentration of
the extract is presented for each stream. The mass balance was achieved for a basis
of calculation of 1000 kg/h of diluted coffee extract entering the process (Feed). Even
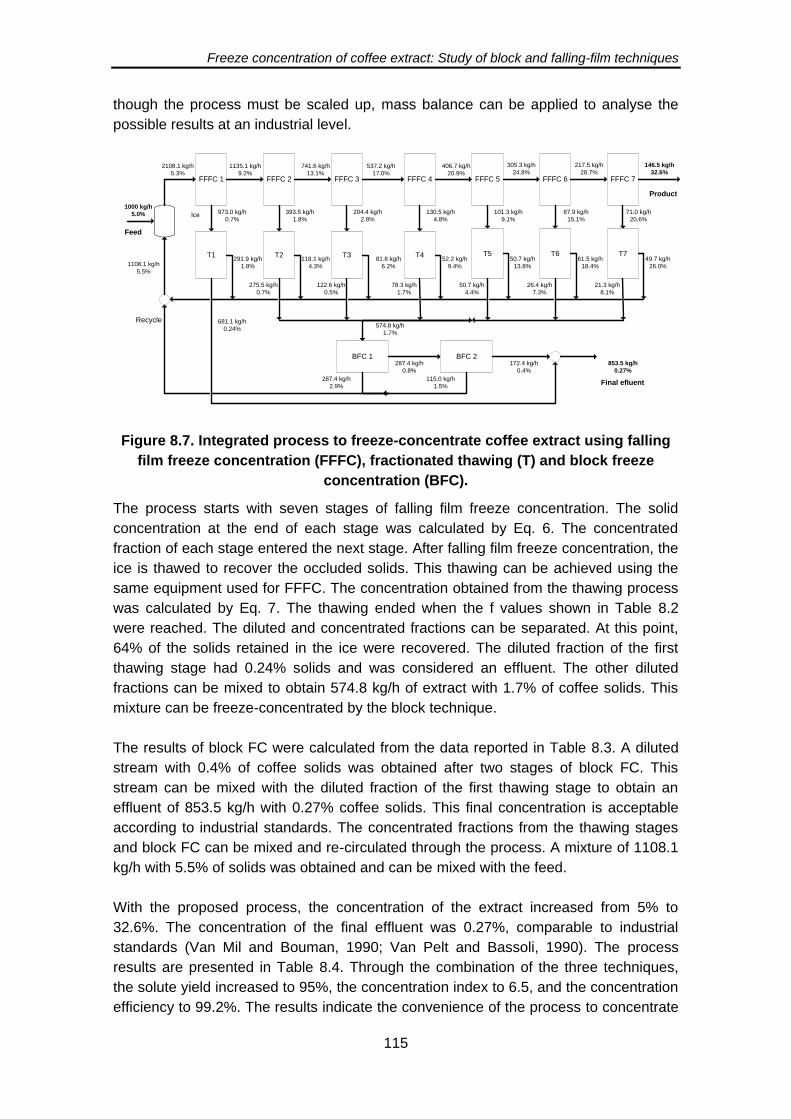
Freeze concentration of coffee extract: Study of block and falling-film techniques
115
though the process must be scaled up, mass balance can be applied to analyse the
possible results at an industrial level.
FFFC 1 FFFC 2 FFFC 3 FFFC 4 FFFC 5 FFFC 6 FFFC 7
1135.1 kg/h
9.2%
741.6 kg/h
13.1%
537.2 kg/h
17.0%
406.7 kg/h
20.9%
305.3 kg/h
24.8%
217.5 kg/h
28.7%2108.1 kg/h
5.3%
1000 kg/h
5.0% 973.0 kg/h
0.7%
T1
681.1 kg/h
0.24%
291.9 kg/h
1.8%
146.5 kg/h
32.6%
Product
Feed
Ice 393.5 kg/h
1.8%
T2
275.5 kg/h
0.7%
118.1 kg/h
4.3%
Recycle
204.4 kg/h
2.8%
T3
122.6 kg/h
0.5%
81.8 kg/h
6.2%
130.5 kg/h
4.8%
T4
78.3 kg/h
1.7%
52.2 kg/h
9.4%
101.3 kg/h
9.1%
T5
50.7 kg/h
4.4%
50.7 kg/h
13.8%
87.9 kg/h
15.1%
T6
26.4 kg/h
7.3%
61.5 kg/h
18.4%
71.0 kg/h
20.6%
T7
21.3 kg/h
8.1%
49.7 kg/h
26.0%
574.8 kg/h
1.7%
BFC 1287.4 kg/h
0.8%
BFC 2172.4 kg/h
0.4%
287.4 kg/h
2.9%
115.0 kg/h
1.5%
853.5 kg/h
0.27%
Final efluent
1108.1 kg/h
5.5%
Figure 8.7. Integrated process to freeze-concentrate coffee extract using falling
film freeze concentration (FFFC), fractionated thawing (T) and block freeze
concentration (BFC).
The process starts with seven stages of falling film freeze concentration. The solid
concentration at the end of each stage was calculated by Eq. 6. The concentrated
fraction of each stage entered the next stage. After falling film freeze concentration, the
ice is thawed to recover the occluded solids. This thawing can be achieved using the
same equipment used for FFFC. The concentration obtained from the thawing process
was calculated by Eq. 7. The thawing ended when the f values shown in Table 8.2
were reached. The diluted and concentrated fractions can be separated. At this point,
64% of the solids retained in the ice were recovered. The diluted fraction of the first
thawing stage had 0.24% solids and was considered an effluent. The other diluted
fractions can be mixed to obtain 574.8 kg/h of extract with 1.7% of coffee solids. This
mixture can be freeze-concentrated by the block technique.
The results of block FC were calculated from the data reported in Table 8.3. A diluted
stream with 0.4% of coffee solids was obtained after two stages of block FC. This
stream can be mixed with the diluted fraction of the first thawing stage to obtain an
effluent of 853.5 kg/h with 0.27% coffee solids. This final concentration is acceptable
according to industrial standards. The concentrated fractions from the thawing stages
and block FC can be mixed and re-circulated through the process. A mixture of 1108.1
kg/h with 5.5% of solids was obtained and can be mixed with the feed.
With the proposed process, the concentration of the extract increased from 5% to
32.6%. The concentration of the final effluent was 0.27%, comparable to industrial
standards (Van Mil and Bouman, 1990; Van Pelt and Bassoli, 1990). The process
results are presented in Table 8.4. Through the combination of the three techniques,
the solute yield increased to 95%, the concentration index to 6.5, and the concentration
efficiency to 99.2%. The results indicate the convenience of the process to concentrate
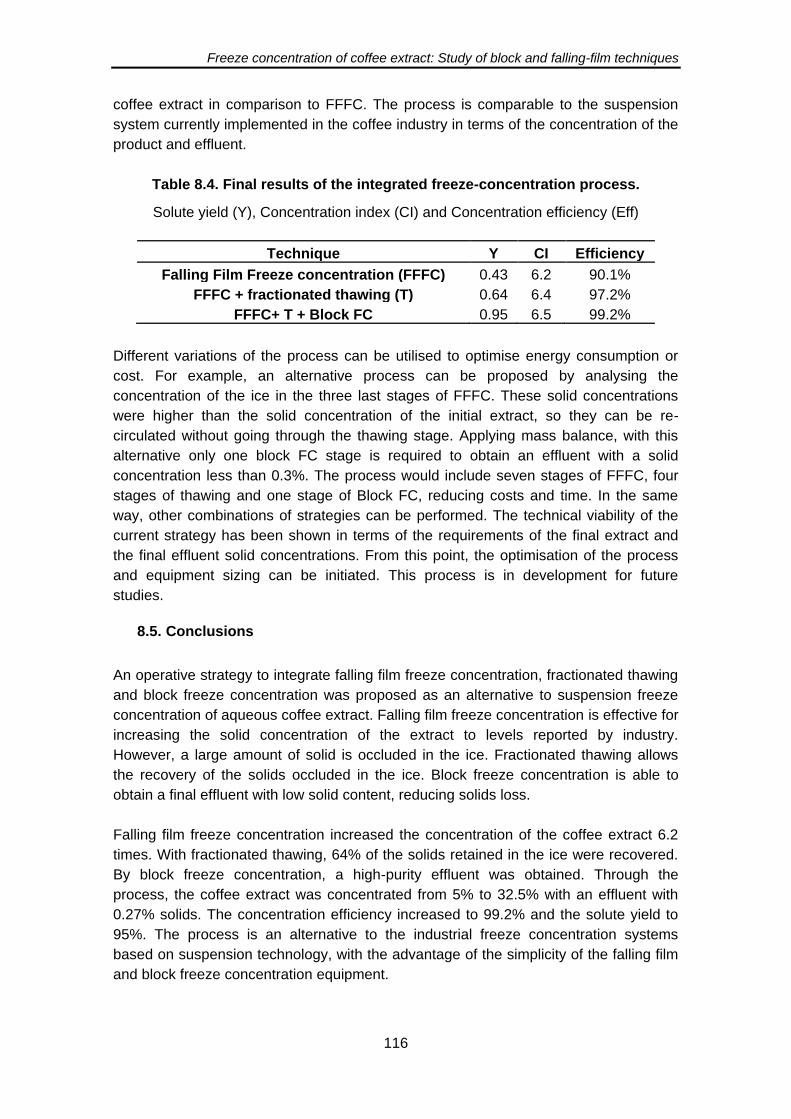
Freeze concentration of coffee extract: Study of block and falling-film techniques
116
coffee extract in comparison to FFFC. The process is comparable to the suspension
system currently implemented in the coffee industry in terms of the concentration of the
product and effluent.
Table 8.4. Final results of the integrated freeze-concentration process.
Solute yield (Y), Concentration index (CI) and Concentration efficiency (Eff)
Technique Y CI Efficiency
Falling Film Freeze concentration (FFFC) 0.43 6.2 90.1%
FFFC + fractionated thawing (T) 0.64 6.4 97.2%
FFFC+ T + Block FC 0.95 6.5 99.2%
Different variations of the process can be utilised to optimise energy consumption or
cost. For example, an alternative process can be proposed by analysing the
concentration of the ice in the three last stages of FFFC. These solid concentrations
were higher than the solid concentration of the initial extract, so they can be re-
circulated without going through the thawing stage. Applying mass balance, with this
alternative only one block FC stage is required to obtain an effluent with a solid
concentration less than 0.3%. The process would include seven stages of FFFC, four
stages of thawing and one stage of Block FC, reducing costs and time. In the same
way, other combinations of strategies can be performed. The technical viability of the
current strategy has been shown in terms of the requirements of the final extract and
the final effluent solid concentrations. From this point, the optimisation of the process
and equipment sizing can be initiated. This process is in development for future
studies.
8.5. Conclusions
An operative strategy to integrate falling film freeze concentration, fractionated thawing
and block freeze concentration was proposed as an alternative to suspension freeze
concentration of aqueous coffee extract. Falling film freeze concentration is effective for
increasing the solid concentration of the extract to levels reported by industry.
However, a large amount of solid is occluded in the ice. Fractionated thawing allows
the recovery of the solids occluded in the ice. Block freeze concentration is able to
obtain a final effluent with low solid content, reducing solids loss.
Falling film freeze concentration increased the concentration of the coffee extract 6.2
times. With fractionated thawing, 64% of the solids retained in the ice were recovered.
By block freeze concentration, a high-purity effluent was obtained. Through the
process, the coffee extract was concentrated from 5% to 32.5% with an effluent with
0.27% solids. The concentration efficiency increased to 99.2% and the solute yield to
95%. The process is an alternative to the industrial freeze concentration systems
based on suspension technology, with the advantage of the simplicity of the falling film
and block freeze concentration equipment.
Freeze concentration of coffee extract: Study of block and falling-film techniques
117
8.6. References
Aider, M., Ounis, W. B., 2012. Skim milk cryoconcentration as affected by the thawing
mode: gravitational vs. microwave-assisted. International Journal of Food
Science & Technology, 47(1), 195-202.
Aider, M., de Halleux, D., 2009. Cryoconcentration technology in the bio-food industry:
Principles and applications. LWT - Food Science and Technology, 42(3), 679-
685.
Aider, M., de Halleux, D., Melnikova, I., 2009. Skim acidic milk whey cryoconcentration
and assessment of its functional properties: Impact of processing conditions.
Innovative Food Science & Emerging Technologies, 10(3), 334-341.
Belén, F., Benedetti, S., Sánchez, J., Hernández, E., Auleda, J. M., Prudêncio, E. S.,
Petrus, J.C.C., et al., 2013. Behavior of functional compounds during freeze
concentration of tofu whey. Journal of Food Engineering, 116(3), 681-688.
Boaventura, B. C. B., Murakami, A. N. N., Prudêncio, E. S., Maraschin, M., Murakami,
F. S., Amante, E. R., Amboni, R. D. D. M. C. (2013). Enhancement of bioactive
compounds content and antioxidant activity of aqueous extract of mate (Ilex
paraguariensis A. St. Hil.) through freeze concentration technology. Food
Research International, 53(2), 686-692.
Boss, E.A., Filho, R.M., de Toledo, E.C.V., 2004. Freeze drying process: real time
model and optimization. Chemical Engineering and Processing: Process
Intensification, 43(12), 1475-1485.
Butler, M.F., 2002. Freeze Concentration of Solutes at the Ice solution Interface
Studied by Optical Interferometry. Crystal Growth & Design, 44(2), 541-548.
Chen, P., Chen, X.D., Free, K.W., 1998. Solute Inclusion in Ice Formed From Sucrose
Solutions on a Sub-cooled Surface-an Experimental Study. Journal of Food
Engineering, 38, 1-13.
Esquivel, P., Jiménez, V.M., 2012. Functional properties of coffee and coffee by-
products. Food Research International, 46(2), 488-495.
Flesland, O., 1995. Freeze concentration by layer crystallization. Drying technology,
13, 1713-1739.
Guardani, R., Neiro, S.M.S., Bu, H., & Ulrich, J., 2001. Experimental comparison and
simulation of static and dynamic solid layer melt crystallization. Chemical
Engineering Science, 56, 2371-2379.
Gulfo, R., Auleda, J.M., Moreno, F.L., Ruiz, Y., Hernández, E., Raventós, M., 2013.
Multi-plate freeze concentration: Recovery of solutes occluded in the ice and
determination of thawing time. Food science and technology international.
http://dx.doi.org/10.1177/1082013213489127
Hernández, E., Raventós, M., Auleda, J.M., Ibarz, A., 2009. Concentration of apple and
pear juices in a multi-plate freeze concentrator. Innovative Food Science &
Emerging Technologies, 10(3), 348-355.

Freeze concentration of coffee extract: Study of block and falling-film techniques
118
Hernández, E., Raventós, M., Auleda, J.M., Ibarz, A. 2010. Freeze concentration of
must in a pilot plant falling film cryoconcentrator. Innovative Food Science &
Emerging Technologies, 11(1), 130-136.
Jiang, X., Hou, B., He, G., Wang, J., 2013. Falling film melt crystallization (II): Model to
simulate the dynamic sweating using fractal porous media theory. Chemical
Engineering Science, 91, 111-121.
MacLeod, C. S., McKittrick, J.A, Hindmarsh, J.P., Johns, M.L., & Wilson, D.I., 2006.
Fundamentals of spray freezing of instant coffee. Journal of Food Engineering,
74(4), 451-461.
Miyawaki, O., Liu, L., Shirai, Y., Sakashita, S., Kagitani, K., 2005. Tubular ice system
for scale-up of progressive freeze-concentration. Journal of Food Engineering,
69, 107-113.
Miyawaki, O., Kato, S., Watabe, K., 2012. Yield improvement in progressive freeze-
concentration by partial melting of ice. Journal of Food Engineering, 108(3), 377-
382.
Moreno, F.L., Raventós, M., Hernández, E., Ruiz, Y., 2014. Block freeze-concentration
of coffee extract: effect of freezing and thawing stages on solute recovery and
bioactive compounds. Journal of Food Engineering, 120, 158-166.
Moreno, F. L.; Robles, C. M.; Sarmiento, Z.; Ruiz, Y. and Pardo, J. M. (2013). “Effect of
separation and thawing mode on block freeze-concentration of coffee brews”,
Food and Bioproducts Processing, 91 (4), 396-402.
Nakagawa, K., Maebashi, S., Maeda, K., 2009. Concentration of aqueous dye solution
by freezing and thawing. The Canadian Journal of Chemical Engineering, 87(5),
779-787.
Nakagawa, K., Maebashi, S., Maeda, K., 2010. Freeze-thawing as a path to
concentrate aqueous solution. Separation and Purification Technology, 73(3),
403-408.
Nakagawa, K., Nagahama, H., Maebashi, S., Maeda, K., 2010. Usefulness of solute
elution from frozen matrix for freeze-concentration technique. Chemical
Engineering Research and Design, 88(5-6), 718-724.
Petzold, G., Aguilera, J.M., 2009. Ice Morphology: Fundamentals and Technological
Applications in Foods. Food Biophysics, 4(4), 378-396.
Petzold, G., Aguilera, J.M., 2013. Centrifugal freeze concentration. Innovative Food
Science & Emerging Technologies. http://dx.doi.org/10.1016/j.ifset.2013.05.010
Qin, F.G.F., Premathilaka, S., Chen, X.D., & Free, K.W., 2007. The shaft torque
change in a laboratory scraped surface heat exchanger used for making ice
slurries. Technology, (September), 618-630.
Qin, F., Chen, X.D., Ramachandra, S., Free, K., 2006. Heat transfer and power
consumption in a scraped-surface heat exchanger while freezing aqueous
solutions. Separation and Purification Technology, 48(2), 150-158.
Freeze concentration of coffee extract: Study of block and falling-film techniques
119
Rahman, M. S., Ahmed, M., Chen, X. D. (2007). Freezing melting process and
desalination: review of present status and future prospects. International Journal
of Nuclear Desalination, 2(3), 253-264
Raventós, M., Hernández, E., Auleda, J.M., Ibarz, A., 2007. Concentration of aqueous
sugar solutions in a multi-plate cryoconcentrator. Journal of Food Engineering,
79(2), 577-585.
Rich, A., Mandri, Y., Bendaoud, N., Mangin, D., Abderafi, S., Bebon, C., Semlali, N.,
Klein, J.P., Bounahmidi, T., Bouhaouss, A., Veesler, S., 2010. Freezing
desalination of sea water in a static layer crystallizer. Desalination and Water
Treatment, 13(1-3), 120-127.
Scholz, R., Wangnick, K., & Ulrich, J., 1993. CrystaIIization processes. Journal of
physics. D: Applied Physics, 26, 156-161.
Sopelana, P., Pérez-Martínez, M., López-Galilea, I., de Peña, M.P., Cid, C., 2011.
Effect of ultra high temperature (UHT) treatment on coffee brew stability. Food
Research International.
Sánchez, J., Hernández, E., Auleda, J.M., Raventós, M., 2011a. Review: freeze
concentration technology applied to dairy products. Food science and technology
international, 17(1), 5-13.
Sánchez, J., Hernández, E., Auleda, J.M., Raventós, M., 2011b. Freeze concentration
of whey in a falling-film based pilot plant: Process and characterization. Journal of
Food Engineering, 103(2), 147-155.
Sánchez, J., Ruiz, Y., Auleda, J.M., Hernández, E., Raventós, M., 2009. Review.
Freeze Concentration in the Fruit Juices Industry. Food Science and Technology
International, 15(4), 303-315.
Sánchez, J., Ruiz, Y., Raventós, M., Auleda, J.M., Hernández, E., 2010. Progressive
freeze concentration of orange juice in a pilot plant falling film. Innovative Food
Science & Emerging Technologies, 11(4), 644-651.
Van Mil, P.J.J.M., Bouman, S., 1990. Freeze concentration of dairy products.
Netherland Milk and Dairy Journal, 44, 21-31.
Van Pelt, W.H.J.M., Bassoli, D.G. 1990. Freeze concentration: coffee-product and
economic analysis. Café, Cacao, Thé, 34(1), 37-45.
Yee, P.L., Wakisaka, M., Shirai, Y., Hassan, M.A., 2003. Effects of single food
components on freeze concentration by freezing and thawing technique.
Japanese Journal of food engineering, 4, 77-82.
Van der Ham, F., Seckler, M.M., Witkamp, G.J., 2004. Eutectic freeze crystallization in
a new apparatus: the cooled disk column crystallizer. Chemical Engineering and
Processing: Process Intensification, 43(2), 161-167.

Freeze concentration of coffee extract: Study of block and falling-film techniques
120
9. MAIN RESULTS OF THE THESIS
This final chapter presents a summary of the main results achieved in this dissertation.
From the main question of the research, what is the effect of the operational variables
of block and falling-film freeze concentration on separation efficiency and quality of
coffee extract, the most important results are highlighted.
The coffee mass fraction of the extract significantly affected the separation
achieved during block and falling-film freeze concentration.
Separation is more difficult when the concentration of coffee solids increases as a
result of the concentration process due to the combined effect of several phenomena.
First, the diffusion rate of solutes elution to the ice front decreases by cause of the
interactions between molecules. Second, viscosity of the coffee solution increases, and
consequently, liquid fraction movement is slower in the freezing and thawing stages. In
addition, the volume of water that can be frozen and separated is lower for higher
concentrations. Finally, increasing solute concentration decreases the freezing point
and produces the constitutional supercooling phenomenon, trapping more quantity of
solutes in the ice front. The combination of these effects explains why the efficiency of
separation decreases with solid concentration.
Controlling freezing direction was useful to recover solutes during block freeze-
concentration.
Commonly, the thawing of the ice block is achieved from the same front where it was
frozen. However, when the thawing direction was controlled in such a way that it was
opposite to the freezing direction, a higher amount of solutes were recovered. Solute
recovery was increased when the last frozen fractions were thawed first. Solute elution
to the freezing front was obtained; consequently, solutes were accumulated in the
fractions farthest from the cooling wall. Solute recovery was increased when these
fractions were thawed. This effect was dependent on initial coffee mass concentration.
The sweating phenomenon during the thawing stage increased solute recovery
The sweating phenomenon was observed during the thawing stage in block freeze-
concentration and during the fractionated thawing of the ice sheets in falling-film freeze
concentration. A highly concentrated liquid was recovered in the first fractions. Solutes
diffused from the concentrated liquid fractions to the droplet of water that had melted
during thawing. This phenomenon is highly important in solute recovery.
Freeze concentration of coffee extract: Study of block and falling-film techniques
121
The behaviour of block freeze-concentration was determined by response
variables such as solute recovery ratio and the area under the curve of solute
recovery.
The effect of the operational variables of freeze concentration on separation efficiency
was evaluated through response variables proposed in the present work. The
comparative analysis of block freeze-concentration is difficult because solute recovery
depends on the thawing fraction. The area under the curve of solute recovery and the
solute recovery ratio can be used for this purpose. In addition, these variables were
useful to determine the thawing fractions at which completion of the thawing stage was
convenient. These variables are a contribution to the state of the art of the research on
block freeze-concentration.
The implementation of microwave thawing and vacuum assisted separation
increased separation efficiency in block freeze-concentration.
Several aids can be used during the thawing and separation stages of block freeze-
concentration. Microwave energy accelerated thawing around the channels of
concentrated liquid trapped between ice crystals. These concentrated liquid fractions
absorbed the microwave energy before the ice. On the other hand, vacuum separation
increased the hydrodynamic movement of the concentrated liquid fraction between ice
crystals, increasing solute recovery. The aids had a synergic effect on the increase of
solute recovery. The viability of the use of these strategies depends on operational
costs and equipment requirements, and thus, thawing and separation aids should
continue to be studied.
The main physical properties of coffee extract were determined at temperatures
close to freezing.
Viscosity, density, freezing point, and coffee mass fraction of coffee extract were
determined as a function of temperature and solid concentration at temperatures close
to freezing. The properties were mathematically modelled within the typical intervals of
solid content and temperature of freeze concentration. The information forecasted with
the models is useful in freeze concentration modelling.
Average ice growth rate, fluid film velocity, and coffee mass fraction affected the
average distribution coefficient of the ice obtained in the falling-film freeze
concentrator.
Low ice growth rate, high fluid film velocity, and low coffee mass fraction decreased
solute occlusion in the ice during falling-film freeze concentration. These three
variables were related according to the Chen and Chen model. Parameters to estimate
the average distribution coefficient were obtained. A model to predict the concentration
index, the solute yield and the average distribution coefficient in successive stages of
falling-film freeze concentration was generated. This model can be used to identify the
number of stages required to obtain a specific concentration of the coffee extract.
Freeze concentration of coffee extract: Study of block and falling-film techniques
122
Block and falling-film freeze concentration preserved the content of bioactive
compounds and the antioxidant activity of the coffee extract.
The major bioactive compounds with functional interest in coffee extract, chlorogenic
acids and caffeine, were distributed proportionally in the ice and liquid fraction. A higher
concentration of the bioactive compounds was obtained in the liquid fraction due to the
higher total solid content in this fraction than in the ice. A significant correlation
between bioactive compounds and antioxidant activity was found. Results indicated
that freeze concentration preserves the functional quality of the beverage. These
results show the potential of freeze concentration to concentrate extracts with biological
activity in the biotechnology industry.
Block and falling-film freeze concentration preserved volatile compounds
concentration and sensory quality of the coffee extract.
Eight major volatile compounds were identified in the coffee extract. The same
compounds were present after freeze concentration in the liquid and ice fractions. In
general, the relative concentration of the volatile compounds was preserved when
using both techniques thanks to the low processing temperatures. Most of the coffee
extract attributes were preserved after block and falling-film freeze concentration. No
differences in sensory attributes between ice and liquid fractions were found. As a
general result, the sensory properties of the freeze-concentrated coffee extract were
preserved. These results show the convenience of both techniques to preserve the
sensory quality of the beverage.
Morphology of the ice crystals produced during freeze concentration affected
the amount of solutes retained in the ice
Ice crystals obtained using block and falling-film freeze concentration were
characterised through image analysis. The morphology of ice cells and freeze-
concentrated liquid channels was observed. The size of ice crystals decreased and
solute occlusion increased when the freezing rate increased. The relationship between
ice morphology, the operational variables of freeze concentration, and solute retention
is an interesting parameter of study aiming to increase separation efficiency. The
image analysis technique is a tool that can be used in ice crystal characterisation
during freeze concentration.
Falling-film freeze concentration was effective to increase coffee extract
concentration.
The concentration of the coffee extract was increased 6.2 times when using the falling-
film freeze concentration technique. This is a fast and flexible technique to obtain
extract concentrations comparable to industrial standards of the suspension technique.
Nevertheless, part of the solutes remains trapped in the ice sheets and need to be
subsequently recovered.
Freeze concentration of coffee extract: Study of block and falling-film techniques
123
Fractionated thawing was useful to recover the solutes retained in the ice
produced in a falling-film freeze concentrator.
Sixty-four percent of the solutes retained in the ice produced in a falling-film freeze
concentration were recovered through partial thawing. The sweating phenomenon
contributed to recovering a highly concentrated liquid in the first thawing fractions. This
technique is useful to increase solute yield in falling-film freeze concentration.
Block freeze-concentration was effective to produce a pure ice fraction with low
solid content in the final effluent.
The block technique as a final stage of freeze concentration efficiency produced a final
effluent with 0.3% solids. The solid content of this effluent is consistent with the
industrial requirements. Pure ice blocks were obtained thanks to the low freezing rate.
In addition, aids can be used in the thawing and separation stages to increase
separation efficiency in block freeze-concentration.
An operative strategy to integrate falling-film freeze concentration, fractionated
thawing, and block freeze-concentration fulfilled the industrial requirements on
the final concentration of coffee extract and effluent.
A process to concentrate coffee extract that takes advantage of each studied technique
was proposed. A final concentration of the extract and the effluent consistent with
industrial requirements can be obtained. Concentration efficiency was increased to
99.2%. This process is an alternative to the industrial freeze concentration systems
based on suspension technology, and it is an advance in the state of the art on the
development of new freeze concentration techniques.
Freeze concentration of coffee extract: Study of block and falling-film techniques
124
10. CONCLUSIONS AND SUGGESTIONS
The purpose of the current study was to determine the effect of the operational
variables of block and falling-film freeze concentration on separation efficiency and
quality of coffee extract. The following conclusions have been obtained.
This study has shown that the concentration of coffee extract can be incremented with
high freezing temperatures and a thawing direction opposite to the freezing direction in
block freeze-concentration. On the other hand, low solute occlusion in the ice and high
concentration efficiency can be obtained at low solid concentrations, low freezing rates,
and high falling fluid velocities for falling-film freeze concentration. The relevance of
extract solute concentration is clearly supported by the current findings. The study of
the operational variables of freeze concentration makes several contributions to the
current literature.
The equipment designed and built to study block and falling-film freeze concentration
showed to be efficient in controlling the main operational variables. This equipment
may be used to systematically study freeze concentration technology.
The behaviour of the average distribution coefficient in the ice produced in falling-film
freeze concentration can be predicted through the Chen and Chen model. The number
of stages needed to reach a specific concentration of coffee extract can be predicted
through the mathematical model proposed in the present study.
The results of this investigation show that solute yield in block freeze-concentration can
be mathematically described by the monomolecular model. In addition, the area under
the curve of solute yield can be used to compare the behaviour of block freeze-
concentration under different operational conditions.
This study has demonstrated, for the first time, that block and falling-film freeze
concentration techniques are effective in the preservation of the functional and sensory
quality of coffee extract. The major bioactive and volatile compounds are preserved in
the freeze-concentrated liquid using both techniques. Consequently, antioxidant activity
and most of the attributes of sensory quality are preserved with block and falling-film
freeze concentration.
The integration of block freeze-concentration, falling-film freeze concentration, and
fractionated thawing is an alternative to the current freeze concentration systems.
Falling-film freeze concentration is effective to increase the solute concentration of the
extract from 5% to 32%. With fractionated thawing, up to 64% of the solutes retained in
the ice sheet can be recovered. Block freeze-concentration has the ability to produce a
final pure effluent with 0.3% solids.
Freeze concentration of coffee extract: Study of block and falling-film techniques
125
The process proposed to freeze-concentrate coffee extract is a technically viable
alternative to obtain an extract and an effluent with a solute concentration according to
industrial requirements. The process is an alternative to the industrial freeze
concentration systems based on suspension technology, with the advantage of the
simplicity of the falling film and block freeze-concentration equipment.
Finally, the study has made some progress towards enhancing our understanding of
freeze concentration and contributing to the state of the art with five research papers
published in indexed journals and five participations in scientific events. Returning to
the research question, it is now possible to state that freeze concentration is an
applicable technology to concentrate coffee extract preserving the quality of the
beverage. This technology is an alternative to extract purification in the food and
biological industries.
This research has given rise to several suggestions in need of further
investigation:
Further research could explore the energetic optimization of the proposed process to
establish the viability of its industrial implementation. The technical viability was
demonstrated in terms of concentration requirements, but the economic viability of the
energetic, initial, and maintenance costs must be established in contrast to other
concentration systems.
Future work is needed to design and scale equipment required to implement the
integrated process of block and falling-film freeze concentration. This equipment needs
to keep the simplicity and flexibility of the techniques in order to ensure the
comparative advantages of other concentration techniques.
Further research on the role of ice crystals morphology on solute retention would be
interesting. More information on the influence of operational conditions on crystals
morphology would help increase the degree of separation achieved.
Another possible area of future research is to investigate mathematical models to
describe phenomena such as occlusion and sweating in the ice as a function of the
morphometric parameters of ice crystals.
Finally, it is suggested to research the application of freeze concentration to recover
components from extracts of biological materials in future studies in order to take
advantage of this technology.
Freeze concentration of coffee extract: Study of block and falling-film techniques
126
11. REFERENCES
1. Aguilera, J. M. (2007). Microstructure and food product engineering. Food
Technology, 54 (11), 56-65.
2. Aider, M. and de Halleux, D. (2008a), Passive and microwave-assisted thawing in
maple sap cryoconcentration technology. J Food Eng, 85: 65-72.
3. Aider, M., & de Halleux, D. (2008b). Production of concentrated cherry and apricot
juices by cryoconcentration technology. LWT - Food Science and Technology,
41(10), 1768–1775.
4. Aider, M., de Halleux, D. and Melnikova, I. (2008c), Gravitational and microwave-
assisted thawing during milk whey cryoconcentration. J Food Eng, 88, 373-380.
5. Aider, M., de Halleux, D., & Melnikova, I. (2009a). Skim acidic milk whey
cryoconcentration and assessment of its functional properties: Impact of
processing conditions. Innovative Food Science & Emerging Technologies, 10(3),
334–341.
6. Aider, M., & de Halleux, D. (2009b). Cryoconcentration technology in the bio-food
industry: Principles and applications. LWT - Food Science and Technology, 42(3),
679–685.
7. Aider, M., de Halleux, D., (2009c). Cryoconcentration technology in the bio-food
industry: Principles and applications. LWT - Food Science and Technology, 42(3),
679-685.
8. Aider, M., Ounis, W. B., (2012). Skim milk cryoconcentration as affected by the
thawing mode: gravitational vs. microwave-assisted. International Journal of Food
Science & Technology, 47(1), 195-202.
9. Akyurt, M., Zaki, G. and Habeebullah, B. (2002), Freezing phenomena in ice –
water systems. Energy Convers Manag, 43: 1773-1789.
10. Astolfi-Filho, Z. ; Telis, V. R. N. ; de Oliveira, E. B. ; Coimbra, J. S. D. R. and Telis-
Romero, J. (2011) “Rheology and fluid dynamics properties of sugarcane juice”,
Biochemical Engineering Journal, 53, 260-265.
11. Auleda, J. M.; Raventós, M. ; Sánchez, J. and Hernández, E. (2011) Estimation of
the freezing point of concentrated fruit juices for application in freeze
concentration, Journal of Food Engineering, , 105, 289-294.
12. Auleda, J.M., Raventós, M., Hernández, E. (2011). Calculation method for
designing a multi-plate freeze-concentrator for concentration of fruit juices. Journal
of Food Engineering, 107(1), 27-35.
13. Ayel, V., Lottin, O., Faucheux, M., Sallier, D., & Peerhossaini, H. (2006).
Crystallisation of undercooled aqueous solutions: Experimental study of free
dendritic growth in cylindrical geometry. International Journal of Heat and Mass
Transfer, 49(11-12), 1876–1884.
14. Ayel, V.; Lottin, O.; Popa, E. and Peerhossaini, H. “Using undercooling to measure
the freezing points of aqueous solutions”, International Journal of Thermal
Sciences, 2005, 44, 11-20.
Freeze concentration of coffee extract: Study of block and falling-film techniques
127
15. Bayindirli, L., Ungan, S. (1993). Mathematical Analysis of Freeze Concentration of
Apple Juice. Journal of Food Engineering, 19, 95-107.
16. Belén, F., Benedetti, S., Sánchez, J., Hernández, E., Auleda, J. M., Prudêncio, E.
S., Petrus, J. C. C., et al. (2013). Behavior of functional compounds during freeze
concentration of tofu whey. Journal of Food Engineering, 116(3), 681-688.
17. Belén, F., Sánchez, J., Hernández, E., Auleda, J. M., & Raventós, M. (2012). One
option for the management of wastewater from tofu production: Freeze
concentration in a falling-film system. Journal of Food Engineering, 110(3), 364-
373.
18. Blond, G., Simatos, D., Gilles, C., & Bernard, J. (1997). Modeling of the water-
sucrose state diagram below 0 ° C. Carbohydrate Research, 298, 139–145.
19. Boaventura, B. C. B., Murakami, A. N. N., Prudêncio, E. S., Maraschin, M.,
Murakami, F. S., Amante, E. R., Amboni, R. D. D. M. C. (2013). Enhancement of
bioactive compounds content and antioxidant activity of aqueous extract of mate
(Ilex paraguariensis A. St. Hil.) through freeze concentration technology. Food
Research International, 53(2), 686-692.
20. Boss, E. A., Filho, R. M., & de Toledo, E. C. V. (2004). Freeze drying process: real
time model and optimization. Chemical Engineering and Processing: Process
Intensification, 43(12), 1475–1485.
21. Budryn, G., Nebesny, E., Kula, J., Majda, T., & Krysiakk, W. (2011). HS-SPME /
GC / MS Profiles of Convectively and Microwave Roasted Ivory Coast Robusta
Coffee Brews. Czeck Journal of Food Science, 29(2), 151–160.
22. Burdo, O. G., Kovalenko, E. and Kharenko, D. 2008, Intensification of the
processes of low-temperature separation of food solutions. Appl Therm Eng, 28:
311-316.
23. Butler, M. F. (2001). Instability formation and directional dendritic growth of ice
studied by optical interferometry. Crystal Growth & Design, 1(3), 213–223.
24. Butler, M. F. (2002). Growth of Solutal Ice Dendrites Studied by Optical
Interferometry. Crystal Growth & Design, 2(1), 59–66.
25. Butler, M.F., 2002. Freeze Concentration of Solutes at the Ice solution Interface
Studied by Optical Interferometry. Crystal Growth & Design, 44(2), 541-548.
26. Caporaso, N., Genovese, A., Canela, M. D., Civitella, A., & Sacchi, R. (2014).
Neapolitan coffee brew chemical analysis in comparison to espresso, moka and
American brews. Food Research International, 1–9.
27. Caretta, O., Courtot, F., & Davies, T. (2006). Measurement of salt entrapment
during the directional solidification of brine under forced mass convection. Journal
of Crystal Growth, 294(2), 151-155.
28. Chen X. D. and Chen, P. “Freezing of aqueous solution in a simple apparatus
designed for measuring freezing point”, Food Research International, 1996,
29,723-729.
29. Chen, P., & Chen, X. D. (2000). A generalized correlation of solute inclusion in ice
formed from aqueous solutions and food liquids on sub-cooled surface. The
Canadian Journal of Chemical Engineering, 78, 312–319.
30. Chen, P., Chen, X. D., & Free, K. W. (1998). Solute Inclusion in Ice Formed From
Sucrose Solutions on a Sub-cooled Surface-an Experimental Study. Process
Engineering, 38(1), 1-13.
Freeze concentration of coffee extract: Study of block and falling-film techniques
128
31. Chen, P., Chen, X. D., & Free, K. W. (1999). An experimental study on the spatial
uniformity of solute inclusion in ice formed from falling film flows on a sub-cooled
surface. Journal of Food Engineering, 39, 101–105.
32. Chen, Y. H., Cao, E., & Cui, Z. F. (2001). An experimental study of freeze
concentration in biological media. Trans IChemE, 79, 35-40.
33. Cheong, M. W., Tong, K. H., Ong, J. J. M., Liu, S. Q., Curran, P., & Yu, B. (2013).
Volatile composition and antioxidant capacity of Arabica coffee. Food Research
International, 51(1), 388-396.
34. Chin, N. L.; Chan, S. M.; Yusof, Y.; Chuah, T. G. and Talib, R. Modelling of
rheological behaviour of pummelo juice concentrates using master-curve. Journal
of Food Engineering, 2009, 93, 134-140.
35. De Maria, C. A. B. D.; Trugo, L. C. ; Neto, F. R. A. ; Moreira, R. F. A. and Alviano,
C. S. “Composition of green coffee water-soluble fractions and identification of
volatiles formed during roasting”, Food Chemistry, 1996, 55, 203-207.
36. Delgado, P., Vignoli, J., Siika-aho, M., Franco, T. 2008. Sediments in coffee
extracts: Composition and control by enzymatic hydrolysis. Food Chemistry,
110(1), 168-176.
37. Díaz-Ocampo, R.; Sánchez, R. and Franco, J.M. “Rheology of commercial and
model borojo jam formulations”, International Journal of Food Properties, 2013, In
Press, DOI:10.1080/10942912.2012.665406.
38. Doyle, J. P., Giannouli, P., Martin, E. J., Brooks, M., & Morris, E. R. (2006). Effect
of sugars, galactose content and chainlength on freeze–thaw gelation of
galactomannans. Carbohydrate Polymers, 64(3), 391–401.
39. Esquivel P. and Jiménez, V. M. Functional properties of coffee and coffee by-
products. Food Research International, 2012, 46, 488-495.
40. Falguera, V. and Ibarz, A. “A new model to describe flow behaviour of
concentrated orange juice,” Food Biophisycs, 2010, 5, 114-119.
41. Falguera, V.; Vélez-Ruiz, J. F.; Alins, V. and Ibarz, A. “Rheological behaviour of
concentrated mandarin juice at low temperatures,” International Journal of Food
Science & Technology, 2010, 10, 2194-2200.
42. Farah, a, Monteiro, M., Calado, V., Franca, a, & Trugo, L. (2006). Correlation
between cup quality and chemical attributes of Brazilian coffee. Food Chemistry,
98(2), 373–380.
43. Ferruzzi, M. G. (2010). The influence of beverage composition on delivery of
phenolic compounds from coffee and tea. Physiology & behavior, 100(1), 33-41.
44. Fissore, D., Pisano, R., & Barresi, A. a. (2014). Applying quality-by-design to
develop a coffee freeze-drying process. Journal of Food Engineering, 123, 179–
187.
45. Flament I. Coffee flavor chemistry. John Wiley and Sons. England. 2002.
46. Flesland, O. (1995). Freeze cocentration by layer crystallization. Drying
technology, 13, 1713-1739.
47. Franca, A., Mendonça, J., & Oliveira, S. (2005). Composition of green and roasted
coffees of different cup qualities. LWT - Food Science and Technology, 38(7),
709–715.
48. Fujioka, K., & Shibamoto, T. (2008). Chlorogenic acid and caffeine contents in
various commercial brewed coffees. Food Chemistry, 106(1), 217-221.
Freeze concentration of coffee extract: Study of block and falling-film techniques
129
49. Gabriele, D.; Migliori, M.; Baldino, N.; Di Sanzo, R.; de Cindio B; and Vuozzo, D.
“Rheological Characterisation of Dairy Emulsions For Cold Foam Applications”
International Journal of Food Properties, 2011,14:4, 786-798.
50. Galmarini, M. V.; Baeza, R. ; Sanchez, V. ; Zamora, M. C. and Chirife, J. (2011).
“Comparison of the viscosity of trehalose and sucrose solutions at various
temperatures: Effect of guar gum addition”, LWT - Food Science and Technology,
44, 186-190..
51. Gao, W., Habib, M., & Smith, D. W. (2009). Removal of organic contaminants and
toxiciy from industrial effluents using freezing processes. Desalination, 245(1-3),
108–119.
52. Germain, J. C., & Aguilera, J. M. (2012). Identifying industrial food foam structures
by 2D surface image analysis and pattern recognition. Journal of Food
Engineering, 111(2), 440–448.
53. Guardani, R., Neiro, S.M.S., Bu, H., & Ulrich, J., 2001. Experimental comparison
and simulation of static and dynamic solid layer melt crystallization. Chemical
Engineering Science, 56, 2371-2379.
54. Gulfo, R., Auleda, J. M., Moreno, F. L., Ruiz, Y., Hernández, E., Raventós, M.
(2013). Multi-plate freeze concentration: Recovery of solutes occluded in the ice
and determination of thawing time. Food science and technology international.
doi:10.1177/1082013213489127
55. Gundurao, A.; Ramaswamy, H. and Ahmed, J. “Effect of Soluble Solids
Concentration and Temperature on Thermo-Physical and Rheological Properties
of Mango Puree”, International Journal of Food Properties. , 2011, 14:5, 1018-
1036
56. Habib, B. and Farid, M. 2006, Heat transfer and operating conditions for freeze
concentration in a liquid–solid fluidized bed heat exchanger. Chem Eng Process,
45: 698-710.
57. Hernández, E., Raventós, M., Auleda, J. M., & Ibarz, a. (2009). Concentration of
apple and pear juices in a multi-plate freeze concentrator. Innovative Food Science
& Emerging Technologies, 10(3), 348–355.
58. Hernández, E., Raventós, M., Auleda, J. M., Ibarz, A. (2010). Freeze concentration
of must in a pilot plant falling film cryoconcentrator. Innovative Food Science &
Emerging Technologies, 11(1), 130-136.
59. Hindmarsh, J. P., Russell, a. B., & Chen, X. D. (2005). Measuring dendritic growth
in undercooled sucrose solution droplets. Journal of Crystal Growth, 285(1-2), 236-
248.
60. Hottot, A., Vessot, S., & Andrieu, J. (2007). Freeze drying of pharmaceuticals in
vials: Influence of freezing protocol and sample configuration on ice morphology
and freeze-dried cake texture. Chemical Engineering and Processing: Process
Intensification, 46(7), 666–674.
61. Huige, N. J. J., & Thijssen, H. A. C. (1972). Production of large crystals by
continuous ripening in a stirrer tank. Journal of Crystal Growth, 483–487.
62. Ibarz, A.; Gonzalez, C.; Esplugas, S. and Vicente, M. Rheology of clarified fruit
juices. I: Peach juices. Journal of Food Engineering, 1992, 15, 49-61.

Freeze concentration of coffee extract: Study of block and falling-film techniques
130
63. Ibarz, R.; Falguera, V.; Garvín, A.; Garza, S.; Pagán, J. and Ibarz, A. (2009) “Flow
Behavior of clarified orange juice at low temperatures,” Journal of Texture Studies,
40, 445-456.
64. Icontec Standrad “Determination of extraction yield and soluble solids in coffee
beverage”, NTC 4602-1, Colombia, 2009.
65. Icontec.Standard (2000). Sensory evaluation, coffee. Method for quantitative
descriptive sensory evaluation of coffee. NTC-4883, Colombia, 2000.
66. Jiang, X., Hou, B., He, G., Wang, J., 2013. Falling film melt crystallization (II):
Model to simulate the dynamic sweating using fractal porous media theory.
Chemical Engineering Science, 91, 111-121.
67. Jie, W.; Lite, L. and Yang, D. “The correlation between freezing point and soluble
solids of fruits”, Journal of Food Engineering, 2003, 60,481-484.
68. Joët, T., Laffargue, A., Descroix, F., Doulbeau, S., Bertrand, B., Kochko, A. D., &
Dussert, S. (2010). Influence of environmental factors, wet processing and their
interactions on the biochemical composition of green Arabica coffee beans. Food
Chemistry, 118(3), 693-701.
69. Joët, T., Laffargue, A., Descroix, F., Doulbeau, S., Bertrand, B., Kochko, A. D. and
Dussert, S. 2010, Influence of environmental factors, wet processing and their
interactions on the biochemical composition of green Arabica coffee beans. Food
Chemistry, 118: 693-701.
70. Korhonová, M., Hron, K., Klimcíková, D., Müller, L., Bednár, P., & Barták, P.
(2009). Coffee aroma--statistical analysis of compositional data. Talanta, 80(2),
710–5.
71. Longinotti M. P. and Corti, H. R. Viscosity of concentrated sucrose and trehalose
aqueous solutions including the supercooled regime. Journal of Physical and
Chemical Reference Data, 2008, 37,1503-1515.
72. MacLeod, C. S., McKittrick, J. a., Hindmarsh, J. P., Johns, M. L., & Wilson, D. I.
(2006). Fundamentals of spray freezing of instant coffee. Journal of Food
Engineering, 74(4), 451–461.
73. Magerramov, M. A.; Abdulagatov, A. L.; Azizov, N. D. and Abdulagatov, I. M.
“Effect of temperature, concentration, and pressure on the viscosity of
pomegranate and pear juice concentrates”, Journal of Food Engineering, 2007, 80,
476-489.
74. Miyawaki, O., Kato, S., & Watabe, K. (2012). Yield improvement in progressive
freeze-concentration by partial melting of ice. Journal of Food Engineering, 108(3),
377–382.
75. Miyawaki, O., Liu L., Shirai, Y., Sakashita, S., Kagitani, K. (2005). Tubular ice
system for scale-up of progressive freeze-concentration. Journal of Food
Engineering, 69, 107-113.
76. Moreno F.L., Raventós M., Hernández E., Santamaría N., Acosta J., Pirachican
O., Torres L. and Ruiz Y. (2014c). Rheological behaviour, freezing curve and
density of coffee solutions at temperatures close to freezing. International Journal
of Food Properties. DOI: 10.1080/10942912.2013.833221.
77. Moreno, F. L.; Robles, C. M.; Sarmiento, Z.; Ruiz, Y. and Pardo, J. M. (2013).
“Effect of separation and thawing mode on block freeze-concentration of coffee
brews”, Food and Bioproducts Processing, 91 (4), 396-402.
Freeze concentration of coffee extract: Study of block and falling-film techniques
131
78. Moreno, F. L., Hernández, E., Raventós, M., Robles, C., & Ruiz, Y. (2014a). A
process to concentrate coffee extract by the integration of falling film and block
freeze-concentration. Journal of Food Engineering, 128, 88–95.
79. Moreno, F. L., Raventós, M., Hernández, E., & Ruiz, Y. (2014b). Behaviour of
falling-film freeze concentration of coffee extract. Journal of Food Engineering,
141, 20–26.
80. Moreno, F. L., Raventós, M., Hernández, E., & Ruiz, Y. (2014c). Block freeze-
concentration of coffee extract: effect of freezing and thawing stages on solute
recovery and bioactive compounds. Journal of Food Engineering, 120, 158–166.
81. Mullin, J. W. (2001). Crystallization (4th ed.). Oxford: Butterworth-Heinemann.
82. Nakagawa, K., Maebashi, S., & Maeda, K. (2009). Concentration of aqueous dye
solution by freezing and thawing. The Canadian Journal of Chemical Engineering,
87(5), 779–787. doi:10.1002/cjce.20213
83. Nakagawa, K., Maebashi, S., & Maeda, K. (2010a). Freeze-thawing as a path to
concentrate aqueous solution. Separation and Purification Technology, 73(3),
403–408.
84. Nakagawa, K., Nagahama, H., Maebashi, S. and Maeda, K. (2010b). Usefulness
of solute elution from frozen matrix for freeze-concentration technique. Chem Eng
Res Des, 88: 718-724.
85. Navarini, L.; Gilli, R.; Gombar, V.; Abatanangelo, A.; Bosco, M.; Toffanin, R. 1999.
Polysaccharides from hot water extracts of roasted Coffea arabica beans: isolation
and characterization. Carbohydrate polymers, 40, (1) 71-81
86. Nonthanum, P., Tansakul, A. (2008). Freeze concentration of lime juice. Maejo
International Journal of Science and Technology, 1, 27-37.
87. Nothnagl, M., Kosiba, A. and Larsen R. 2004, Predicting the effect of irradiance
and temperature on the flower diameter of greenhouse grown Chrysanthemum.
Sci Horti 99: 319–329.
88. Okawa, S., Ito, T. and Saito, A. 2009, Effect of crystal orientation on freeze
concentration of solutions. Int J Refrig, 32: 246-252.
89. Omran A.M. King J. (1974) Kinetics of ice crystallization in sugar solutions and fruit
juices. AIChemE Journal, 20, 795-803,
90. Owen, R. ., Haubner, R., Mier, W., Giacosa, a, Hull, W. ., Spiegelhalder, B., &
Bartsch, H. (2003). Isolation, structure elucidation and antioxidant potential of the
major phenolic and flavonoid compounds in brined olive drupes. Food and
Chemical Toxicology, 41(5), 703-717.
91. Pardo, J M, Suess, F., & Niranjan, K. (2002). An investigation into the relationship
between freezing rate and mean ice crystal size of coffee extarcts. Trans IChemE,
80, 176-182.
92. Perry, H.R., Green, D., Maloney, J.O., 1992. Perry’s Chemical Engineering
Handbook, 6th Edition. McGraw-Hill, New York, USA
93. Peters-erjawetz, S., Ulrich, J., Tiedtke, M., & Hartel, R. (1999). Milk Fat
Fractionation by Solid-Layer Melt Crystallization. Journal of the American Oil
Chemists’ Society, 76(5), 579–584.
94. Petzold, G., & Aguilera, J. M. (2009). Ice Morphology: Fundamentals and
Technological Applications in Foods. Food Biophysics, 4(4), 378-396.
Freeze concentration of coffee extract: Study of block and falling-film techniques
132
95. Petzold, G., & Aguilera, J. M. (2013). Centrifugal freeze concentration. Innovative
Food Science & Emerging Technologies. doi:10.1016/j.ifset.2013.05.010
96. Petzold, G., Niranjan, K., & Aguilera, J. M. (2013). Vacuum-assisted freeze
concentration of sucrose solutions. Journal of Food Engineering, 115(3), 357-361.
97. Piccino, S., Boulanger, R., Descroix, F., & Shum Cheong Sing, A. (2014). Aromatic
composition and potent odorants of the “specialty coffee” brew “Bourbon Pointu”
correlated to its three trade classifications. Food Research International, 61, 264–
271.
98. Qin, F. G. F., Chen, X. D., Premathilaka, S., & Free, K. (2008). Experimental study
of wash columns used for separating ice from ice-slurry. Desalination, 218(1-3),
223–228. doi:10.1016/j.desal.2007.02.017
99. Qin, F., Chen, X. D., Free, K. (2009). Freezing on subcooled surfaces,
phenomena, modeling and applications. International Journal of Heat and Mass
Transfer, 52(5-6), 1245-1253.
100. Qin, F., Chen, X. D., Ramachandra, S., Free, K. (2006). Heat transfer and
power consumption in a scraped-surface heat exchanger while freezing aqueous
solutions. Separation and Purification Technology, 48(2), 150-158.
101. Qin, F.G.F., Premathilaka, S., Chen, X.D., & Free, K.W., 2007. The shaft torque
change in a laboratory scraped surface heat exchanger used for making ice
slurries. Technology, (September), 618-630.
102. Rahman, M. S. State diagram of foods: Its potential use in food processing and
product stability. Trends in Food Science & Technology 2006, 17, 129-141.
103. Rahman, M. S., Ahmed, M., Chen, X. D. (2007). Freezing melting process and
desalination: review of present status and future prospects. International Journal of
Nuclear Desalination, 2(3), 253-264
104. Ramos, F. a., Delgado, J. L., Bautista, E., Morales, a. L., & Duque, C. (2005).
Changes in volatiles with the application of progressive freeze-concentration to
Andes berry (Rubus glaucus Benth). Journal of Food Engineering, 69(3), 291-297.
105. Rane, M. V., Jabade, S. K. (2005). Freeze concentration of sugarcane juice in a
jaggery making process. Applied Thermal Engineering, 25(14-15), 2122-2137.
106. Rane, M. V., Padiya, Y. S. (2011). Heat pump operated freeze concentration
system with tubular heat exchanger for seawater desalination. Energy for
Sustainable Development, 15(2), 184-191.
107. Rattanadecho, P. 2004, Theoretical and experimental investigation of
microwave thawing of frozen layer using a microwave oven (effects of layered
configurations and layer thickness). Int J Heat Mass Transf. 47: 937-945.
108. Raventós, M., Hernández, E., Auleda, J. M., & Ibarz, A. (2007). Concentration
of aqueous sugar solutions in a multi-plate cryoconcentrator. Journal of Food
Engineering, 79(2), 577–585.
109. Ribeiro, J. S., Teófilo, R. F., Augusto, F., & Ferreira, M. M. C. (2010).
Simultaneous optimization of the microextraction of coffee volatiles using response
surface methodology and principal component analysis. Chemometrics and
Intelligent Laboratory Systems, 102(1), 45–52.
110. Rich, A., Mandri, Y., Bendaoud, N., Mangin, D., Abderafi, S., Bebon, C.,
Semlali, N., Klein, J.P., Bounahmidi, T., Bouhaouss, A., Veesler, S., 2010.
Freeze concentration of coffee extract: Study of block and falling-film techniques
133
Freezing desalination of sea water in a static layer crystallizer. Desalination and
Water Treatment, 13(1-3), 120-127.
111. Rodrigues, M. A., Miller, M. A., Glass, M. A., Singh, S. K., & Johnston, K. P.
(2011). Effect of Freezing Rate and Dendritic Ice Formation on Concentration
Profiles of Proteins Frozen in Cylindrical Vessels. Pharmaceutical Research,
100(4), 1316–1329.
112. Roldán, D., González, F., & Salazár, M. (2003). La Cadena del Café en
Colombia. Observatorio Agrocadenas Colombia - MADR, (29).
113. Ruiz, Y., Sánchez, J., Hernández, E., Auleda, J. ., & Raventós, M. (2010).
Viscosidad de zumos comerciales de melocotón, manzana y pera a temperaturas
cercanas a la congelación. Afinidad, 114–118.
114. Ryyniinen, S. 1995, The Electromagnetic Properties of Food Materials : A
Review of the Basic Principles. J Food Eng, 26: 409-429.
115. Sánchez, J., Hernández, E., Auleda, J. M., & Raventós, M. (2011a). Freeze
concentration of whey in a falling-film based pilot plant: Process and
characterization. Journal of Food Engineering, 103(2), 147–155.
116. Sánchez, J., Hernández, E., Auleda, J. M., & Raventós, M. (2011b). Review:
freeze concentration technology applied to dairy products. Food Science and
Technology International, 17(1), 5–13.
117. Sánchez, J., Ruiz, Y., Auleda, J. M., Hernandez, E., & Raventos, M. (2009).
Review. Freeze Concentration in the Fruit Juices Industry. Food Science and
Technology International, 15(4), 303–315.
118. Sánchez, J., Ruiz, Y., Raventós, M., Auleda, J. M., & Hernández, E. (2010).
Progressive freeze concentration of orange juice in a pilot plant falling film.
Innovative Food Science & Emerging Technologies, 11(4), 644–651.
119. Sanz, C., Czerny, M., Cid, C., & Schieberle, P. (2002). Comparison of potent
odorants in a filtered coffee brew and in an instant coffee beverage by aroma
extract dilution analysis (AEDA). European Food Research and Technology,
214(4), 299–302.
120. Saravacos G. and Maroulis, Z. Food Process Engineering Operations, CRC
Press, Boca Raton, USA, 2011, p. 94.
121. Sarrazin, Â., & Que, J. Le. (2000). Representativeness of co € ee aroma
extracts : a comparison of di € erent extraction methods, 70.
122. Scholz, R., Wangnick, K., & Ulrich, J., 1993. CrystaIIization processes. Journal
of physics. D: Applied Physics, 26, 156-161.
123. Shirai, Y., Sugimoto, T., Hashimoto, M., Nakanishi, K., & Matsuno, R. (1987).
Mechanism of Ice Growth in a Batch Crystallizer for Freeze Concentration with an
External Cooler. Agricultural Biological Chemistry, 51(9), 2359–2366.
124. Shirai, Y., Wakisaka, M., Miyawak, O., & Sakashita, S. (1998). Conditions of
Producing an Ice Layer with High Purity for Freeze Wastewater treatment. Journal
of Food Engineering, 38, 297–308.
125. Sobolík, V.; Zitny, R.; Tovcigrecko, V.; Delgado, M. and Allaf, K. “Viscosity and
electrical conductivity of concentrated solutions of soluble coffee”, Journal of Food
Engineering, 2002, 51, 93-98.

Freeze concentration of coffee extract: Study of block and falling-film techniques
134
126. Sopelana, P., Pérez-Martínez, M., López-Galilea, I., de Peña, M. P., & Cid, C.
(2013). Effect of ultra high temperature (UHT) treatment on coffee brew stability.
Food Research International. 50(2), 682-690.
127. Sunarharum, W. B., Williams, D. J., & Smyth, H. E. (2014). Complexity of coffee
flavor: A compositional and sensory perspective. Food Research International, 62,
315–325.
128. Tavares, D.; Alcantara, M.; Tadini, C. and Telis-Romero, J. “Rheological
properties of frozen concentrated orange juice (FCOJ) as a function of
concentration and subzero temperatures” International Journal of Food Properties,
2007, 10,829-839.
129. Telis, V. R. N.; Telis-Romero, V; Mazzotti, H. B. and Gabas, L. “Viscosity of
Aqueous Carbohydrate Solutions at Different Temperatures and Concentrations,”
International Journal of Food Properties, 2007, 10, 185-195.
130. Telis-Romero, J.; Ferreira, R.; Gabas, A. and Niccoletti, V. “Rheological
properties and fluid dynamics of coffee extract”, Journal of Food Process
Engineering, 2001, 24, 217-230.
131. Telis-Romero, J.; Gabas, A. L.; Polizelli, M. A. and Telis, V. R. N. “Temperature
and water content influence on thermophysical properties of coffee extract”,
International Journal of Food Properties, 2000, 3:3, 375-384.
132. Thaler, H. (1978) “The chemistry of coffee extraction in relation to
polysaccharides”, Food Chemistry, 4,13-22.
133. Thijssen, H. A. C. “Freeze concentration of food liquids”, Food Manufacture,
1969, 44, 49-53.
134. Toci, A. T., & Farah, A. (2008). Volatile compounds as potential defective coffee
beans’ markers. Food Chemistry, 108(3), 1133–1141.
135. Van der Ham, F., Seckler, M. M., Witkamp, G. J. (2004). Eutectic freeze
crystallization in a new apparatus: the cooled disk column crystallizer. Chemical
Engineering and Processing: Process Intensification, 43(2), 161-167.
136. Van Mil, P.J.J.M., Bouman, S., 1990. Freeze concentration of dairy products.
Netherland Milk and Dairy Journal, 44, 21-31.
137. Van Pelt, W.H.J.M., Bassoli, D.G. 1990. Freeze concentration: coffee-product
and economic analysis. Café, Cacao, Thé, 34(1), 37-45.
138. Vignoli, J. A., Bassoli, D. G., & Benassi, M. T. (2011). Antioxidant activity ,
polyphenols , caffeine and melanoidins in soluble coffee : The influence of
processing conditions and raw material. Food Chemistry, 124(3), 863-868.
139. Wakisaka, M., Shirai, Y., & Sakashita, S. (2001). Ice crystallization in a pilot-
scale freeze wastewater treatment system. Change, 40, 201–208.
140. Wang, R., Zhang, M., Mujumdar, A. S. and Jiang, H. 2011, Effect of salt and
sucrose content on dielectric properties and microwave freeze drying behavior of
re-structured potato slices. J Food Eng, 106: 290-297.
141. Wu, H., Tao, Z., Chen, G., Deng, H., Xu, G. and Ding, S. 2004, Conjugate heat
and mass transfer process within porous media with dielectric cores in microwave
freeze drying. Chem Eng Sci, 59: 2921-2928.
142. Yee, P. L., Wakisaka, M., Shirai, Y., & Hassan, M. A. (2003). Effects of single
food components on freeze concentration by freezing and thawing technique.
Japanese Journal of food engineering, 4, 77-82.

Freeze concentration of coffee extract: Study of block and falling-film techniques
135
12. APPENDIXES
APPENDIX A: Published papers
Freeze concentration of coffee extract: Study of block and falling-film techniques
136
List of publications
1. Moreno, F.L., Raventós, M., Hernández, E., & Ruiz, Y. (2014). Block freeze-
concentration of coffee extract: effect of freezing and thawing stages on solute
recovery and bioactive compounds. Journal of Food Engineering, 120, 158-166
2. Moreno, F.L., Robles, C. M., Sarmiento, Z., Ruiz, Y., & Pardo, J. M. (2013). Effect
of separation and thawing mode on block freeze-concentration of coffee brews.
Food and Bioproducts Processing, 91(4), 396-402
3. Moreno, F.L., Hernández, E., Raventós, M., Robles, C., & Ruiz, Y. (2014). A
process to concentrate coffee extract by the integration of falling film and block
freeze-concentration. Journal of Food Engineering, 128, 88-95.
4. Moreno, F.L., Raventós, M., Hernández, E., Ruiz, Y. (2014). Behaviour of falling-
film freeze concentration of coffee extract. Journal of Food Engineering 141, 20-26.
5. Moreno F.L., Raventós M., Hernández E., Santamaría N., Acosta J., Pirachican O.,
Torres L. and Ruiz Y. (2014) Rheological behaviour, freezing curve and density of
coffee solutions at temperatures close to freezing. International Journal of Food
Properties. DOI: 10.1080/10942912.2013.833221
Freeze concentration of coffee extract: Study of block and falling-film techniques
137
List of works presented in scientific congresses
1. Moreno, F.L., Hernández, E., Raventós, M., Robles, C., & Ruiz, Y. (2012).
Mathematical modelling of rheological behaviour of coffee extract at temperatures
close to freezing. In: Congreso Español de Ingeniería de Alimentos CESIA VII.
Ciudad Real, España.
2. Ramírez, A. Moreno, F.L. Ruiz, Y. Block freeze concentration of coffee extract.
(2012). Revista Vitae 19, (1). In: I Congreso Internacional de investigación e
innovación en ciencia y tecnología de alimentos IICTA. Bogotá, Colombia.
3. Moreno, F. L., Raventós, M., Hernández E., Gulfo R., Ruiz, Y. (2014) Technical,
energetic and economic comparative of three concentration systems in a fruit juice
industry: Case of study. In: Congreso Iberoamericano de Ingeniería de Alimentos
CIBIA 9. Valencia, España.
4. Moreno, F. L., Raventós, M., Hernández E., Gulfo R., Robles, C., Ruiz, Y. (2014)
Integration of block and falling-film freeze concentration applied to concentrate
sucrose solutions. In: Congreso Iberoamericano de Ingeniería de Alimentos CIBIA
9. Valencia, España.
5. Moreno, F. L., Hernández A.J., Moreno Y., Ruiz, Y. (2014). Soluble solids and
sediments determination during block freeze concentration of coffee extract. In: II
Congreso Internacional de investigación e innovación en ciencia y tecnología de
alimentos IICTA. Medellín, Colombia.

ATENCIÓ ¡ Les pàgines 139 i següents de la tesi contenen els articles de
revista citats que es poden consultar a la web de l’editor
ATENCIÓN ¡
Las páginas 139 y siguientes de la tesis contienen los artículos de revista que pueden consultarse en el web del editor
ATTENTION ¡
Pages 139 and following of the thesis are availables at the editor’s web
http://dx.doi.org/10.1016/j.jfoodeng.2013.07.034
http://dx.doi.org/10.1016/j.fbp.2013.02.007
http://dx.doi.org/10.1016/j.jfoodeng.2013.12.022
http://dx.doi.org/10.1016/j.jfoodeng.2014.05.012
http://dx.doi.org/10.1080/10942912.2013.833221
(138)