freight rail in the houston region - gulf coast rail rail in the houston region study.pdf ·...
TRANSCRIPT

FREIGHT RAIL IN THE HOUSTON REGION:
INFLUENCES, VOLUMES, AND TRENDS
WORKING PARTNER STRATEGIC PLANNING & OUTREACH SOLUTIONS

1
TABLE OF CONTENTS
Introduction ………………………………………………………………..…2 Executive Summary .…………………………………………….……...........3 Railroad History and Its Impact on the Houston Region.....…..….…….….…4
Freight Volumes, Commodities, Origins and Destinations ….…………......11
Freight Volume Forecasts ..……..…………………….……………..……...21 Freight Rail Interest Groups……………………………………….……..….31
Conclusion ………………………………………………………………….37 Technical Addendum ……………………………………………………….38
ACKNOWLEDGEMENT The Port of Houston Authority gives sincere thanks to Ann Hamilton and Houston Endowment, whose support and generous grant made this research possible.

2
INTRODUCTION The Houston region has a remarkable network of railroad lines that weave in and around the region. Once a network that was boasted as an asset – as proclaimed in advertisements in the early 1900s noting the city as a place “where 17 railroads meet the sea” – today, this web of rail is viewed as a detriment to the communities that have grown up around it. Hazardous at-grade crossings, trains that block intersections for long periods of time causing considerable auto traffic congestion, and loud train whistles blowing at all hours of the night are only some of the difficulties experienced by the Houston community. While the negative impact of rail freight movements on the community must be addressed, the growing rail activity seen in the region is an indicator of a strong petrochemical industry and port, without which the Houston economy might not be as vibrant as it is today. Therefore when considering changes to the region’s rail network, a careful balance must be achieved between the needs of industry, the economy, and the community. Several studies of Houston’s rail infrastructure have been conducted and recommendations made for improvements that would reduce the number of at-grade crossings and improve the flow of rail freight in the region. To assist the newly-formed Gulf Coast Freight Rail District (GCFRD) in setting priorities, the following document offers information about:
• How the region’s infrastructure was developed and got to the condition in which it is in; • Current freight volumes, where freight comes from and goes to now, and the trends that
will influence future volumes; and • Who plays a part in moving freight in the region and what role they play in that
movement. As well as providing background and contextual information for the GCFRD Board, this information is intended to assist the Freight Rail District in making a case for the national significance of improvement projects that are selected.

3
EXECUTIVE SUMMARY As early as the mid-1880s, railroads were recognized as unrivaled means for developing areas that were previously considered inaccessible and bringing goods to market. Yet over the decades, the development of railroads in the United States has been a story of growth, decline and revitalization. Federal land grants, industry competition, and huge natural resources contributed to the early growth of the industry while subsequent federal regulation and competition from other modes of transport spurred the decline. Since the 1970s, with industry innovations, deregulation, and increasing world trade, railroads are in an era of dramatic revitalization. But challenges remain. After decades of downsizing, railroads face capacity shortages as rail freight demand has grown beyond their capacity. This is especially true for inter-modal rail freight which has grown at a remarkable pace since containerization improvements. While private investment in rail infrastructure has increased, with an estimated $8.3 billion in infrastructure improvements logged in 2006 - nearly double the level from 10 years ago, railroads continue to be unable to finance enough expansion to add the capacity needed. Houston’s experience with rail has closely mirrored the national experience. In the mid-to-late 1800s, Houston was the center of railroad development in Texas. By the early 1900s Houston had a remarkable web of railroad infrastructure such that the city proudly advertised itself as the place “where 17 railroads meet the sea.” As the railroad industry began to decline due to regulation and competition from other forms of transportation, so did Houston’s rail network. Little investment was made in Houston’s rail infrastructure after the 1950s and 1960s, and with the Port of Houston growing rapidly in size and capacity, other forms of transportation gave fierce competition to railroads. By the early 1960s, Houston’s Port was served by six railroads along with 38 trucking lines, 100 steamship lines, and 8 barge lines, among others. Since the 1980s, and especially the 1990s, just as the railroad industry has experienced revitalization with the growth of containerization and world trade, Houston - led by the petrochemical industry and an ever-growing Port - has seen its share of rail freight volumes grow as well. Union Pacific, the largest railroad in Houston, recently noted that its volumes carried in the 18 months from 2006 to mid-2007 have been at record levels. Today, just as the railroad industry faces challenges from deferred maintenance on infrastructure nationally, Houston’s rail infrastructure is hindered by similar problems. Outdated rail yards and inadequate infrastructure together with the demands of the petrochemical industry and growing volumes of containers are clogging Houston’s rail system, potentially diminishing the competitive position of the region. Forecasted external events, such as the expansion of the Panama Canal and further growth of container trade, hold out the potential to capture more market share. Yet without improvements to the region’s rail and inter-modal capacity, much of that potential trade could go to competing ports or come to Houston and be shipped out by truck. In the past, Houston’s leadership has anticipated opportunities and invested early so as to benefit when those opportunities arose. Today we face both a challenge and an opportunity: how can Houston improve the movement of freight traffic it currently has and prepare for future growth that could come to this region? The ‘can do’ spirit of Houston’s leadership is needed again today to make strategic investments in our freight infrastructure so as position Houston to remain competitive in the world economy.

4
RAILROAD HISTORY AND ITS IMPACT ON THE HOUSTON REGION
Railroads as vehicles for moving good and passengers long distances began to take hold in the United States in the mid-1800s. The first rail lines were built in the east in the early1830’s. By 1850, some 9,000 miles of railroad track were already in operation. Early on, it was clear that railroads presented an unrivaled means for bringing goods to market and developing areas that were previously considered inaccessible. In these early days, construction of railroads was hindered by the need for huge expanses of land. To spur railroad growth, between 1850 and 1871 the federal government offered land grants to railroads. The purpose of the grants was to encourage the construction of railroads through undeveloped territory to attract settlers in the government’s quest to strengthen and unify the nation.1 In Texas, state grants of sixteen sections of land, together with a loan of $6,000 per mile and superior condemnation authority, encouraged eleven companies to build more than 450 miles of tracks before 1860. Prior to 1900, Houston was the locus of most railroad development in Texas. The tracks that were built then continue to serve as the main trunk lines used today. The Buffalo Bayou, Brazos and Colorado Railroad laid the first railroad track in an effort to link the headwaters of Buffalo Bayou to the Brazos and Colorado valleys to the west. The first 20 miles of track were inaugurated in 1850 as the first train pulled into Stafford’s Point. By 1856, the City of Houston had built the Tap Railroad to Pierce Junction which lay seven miles south of central Houston. By 1860, Houston had five short rail lines and over 350 miles of track leading to the City. Over the next two decades - encouraged by the push for a transcontinental line made formal with Pacific Railroad Act signed by President Lincoln in 1862, and driven by competition between railroad companies to establish their territory and create lines to major areas – these short rail lines were extended, forming the main trunk lines that connected Houston to other parts of Texas and surrounding states:
• In 1856 construction began on The Galveston, Houston and Henderson line and by the time it was complete, it was the first rail line to touch the Texas Gulf Coast.
• In 1861 a line from Houston to Orange had been built and by 1881, that line had been extended to New Orleans.
• By 1861, the Houston and Texas Central Railroad had 80 miles of track extending from Houston to the northwest. By 1872 these rails reached Dallas. A branch line to Austin was completed in 1871.
• By 1877, the initial line of the Buffalo Bayou, Brazos and Colorado Railroad had reached San Antonio. By 1883, the San Antonio line was extended west until it met the Southern Pacific line, which was building east from San Francisco. With the connection of these two lines, the “Sunset Route” was established – the first railroad line to extend from San Franciso to New Orleans.
1 It is important to note that the land grants, while a great boost to the establishment of railroad lines, were only one source of income. Railroads were very much a business, relying on investment and revenues to build their large asset base. The tracks that were built with land grants make up only 8% of present railway mileage in the United States. Ninety-two per cent of the present rail mileage received no land grants from the government.

5
• A line from Rosenberg to Brownsville and on into Mexico was completed by 1882. • Between 1886 – 1888, the line between San Antonio and Corpus Christi was connected
north into Houston, and the Texas-Mexican line, which extended from Corpus Christi to Laredo and into Mexico was completed in 1881.
By 1880, Houston was the central rail hub in the state with nine railroads and 2,200 miles of track converging in the city and another 1,800 miles of track under construction. By 1900, Texas had more rail miles laid than any other state in the nation and the vast majority of the lines centered around Houston, which accounted for 90% of the state’s tracks. Nationally, railroads reached their peak of rail trackage by 1917, totaling 1,500 railroads operating some 254,000 miles of track.
Map of Southern Pacific Railway and Steamship Lines, ca. 1900 from “The Southern Pacific 1901-1985” by Don L. Hofsommer, Texas University Press, 1986. Railroad operations in Houston opened many opportunities for the public. Fruits and vegetables from the Brazos and Colorado valleys could now travel to Midwest markets on the north bound line. Timber and forest products were major commodities for transport, and with the completion of the Houston to New Orleans line passenger trains began offering service between the two cities. The District Navigation Company, established in 1866 to operate steamboats and barges on Buffalo Bayou and which later became the Port of Houston, had a means of transporting large bulk items across land as well. Indeed, rail had become such a prominent part of the city that by 1926, after additional lines were laid, Houston advertised itself as the city “Where 17 Railroads Meet the Sea” and the City of Houston crest was emblazoned with a locomotive.

6
Despite this auspicious beginning, railroads encountered significant challenges between the late 1880s and the early 1940s, the impacts of which are felt to some degree even today. The first and most influential challenge was the imposition of federal regulation on the industry in 1887 with the establishment of the Interstate Commerce Commission (ICC), the first regulatory commission in U.S. history. In the rush to build a network of rail lines across the U.S., two railroads came to dominate the landscape west of the Mississippi: Southern Pacific and Union Pacific. Complaints about rate discrimination between communities grew, particularly in the Western states, as did suspicions that railroads possessed economic power that they systematically abused. As a result, the ICC imposed regulations on rail rates and routes. Because the required rates and routes did not account for cost or demand, the regulations affected the industry’s ability to cover their operating expenses such that by 1918, the revenues of railroads failed to cover operating expenses by $14 million. A second challenge was the lack of investment in and maintenance of rail infrastructure during World War I and the years of the Depression. During World War I the federal government took over the railroads completely. While the railroads proved invaluable assets during the war, heavy usage took a toll on the lines, especially as no maintenance or improvements were made during the war. The railroads were turned over to railroad companies after the war, but with high operating costs and insufficient revenue to cover costs, investments in railroads began to decline. As railroads struggled to make ends meet, the Depression brought yet another blow to the industry. Revenues were cut by half – from $6.2 billion in 1928 to $3.1 billion in 1933. By 1937, 70,000 railroad miles (30% of all rail lines) were in receivership. World War II and the subsequent decade brought some relief to the railroads. Railroad service was a critical asset during the war and so all rail resources were reconditioned and services were restored. In Houston, from 1940 to 1945 war transportation needs put Houston’s rail network to the test by increasing tonnage by 128 percent. During 1945, Houston’s rail systems moved 43,280 freight trains in and out of the city, an average of 146 freight trains per day, and accommodated 33 scheduled passenger trains in and out daily. Post WWII, railroads benefited from a growing economy. During wartime, hundreds of industries had located along the rail lines, creating new economies and customers. After the war, additional improvements were made to rail track and the growth of specialized cars, especially refrigerated cars, allowed freight volumes to increase. Indeed, by 1956 freight volume transported by rail nationally exceeded wartime volumes at their peak in 1943. Passenger rail continued to grow and railroads created elaborate passenger cars and advertisement strategies to attract more passengers to their lines. From the 1950s through the ‘70s, new challenges to the industry appeared, primarily in the form of alternative means of transportation. The growth of commercial aviation, increased barge competition, and the growing use of pipelines in the oil industry all presented significant competition, but none as significant as the completion of the interstate highway system and the rise of overland truck operations. With alternative shipping options, manufacturers moved away from rail facilities and were served by trailer trucks. On the passenger side, inter-city bus services and the growing popularity of the family car made passenger rail less appealing. Constrained by federal regulations, railroads were unable to adjust with more cost-effective

7
services. As a result, throughout the 1950s and 1960s, the growing competition in freight transport and losses in passenger operations led to railroad bankruptcies, service and track abandonment, and deferred maintenance. Deteriorating industry conditions affected Houston’s networks of rail as well. In 1956, Houston’s business community and Navigation District sought funds to improve facilities and services. Houston’s World Trade Committee noted “the desperate position of the port relative to cargo-handling facilities” and the impact these conditions had in placing Houston’s port in an unfavorable position to compete with other domestic ports. At about the same time, Houston’s Traffic Committee sought the support of local interests to improve services and facilities at the Port Terminal Railroad, where conditions were described as “woefully inadequate.” Funds were secured and by 1963, Houston’s Ship Channel was generating considerable freight traffic. To handle the freight, the Port was served at this time by six railroads (which number had fallen due to bankruptcies and mergers) along with 38 trucking lines, 100 steamship lines, 35 freight-forwarders, 8 barge lines, and 19 stevedore outfits. By the late 1960s and 1970s, railroads were an industry that was essentially asset-rich, cash poor, with high labor costs. As regulations continued to constrain railroads’ ability to compete, the federal government stepped in to assist the ailing railroads. First, despite the attempts railroads made to lure more passenger business, passenger trains were a financial drain to railroad companies. Therefore in 1970 Congress passed the Rail Passenger Act, which established Amtrak to run what was left of the passenger train business. In 1973, Congress passed the Regional Rail Reorganization Act, which gave railroads some flexibility in setting rates. On their part, with an average rate of return on net investment below 3%, railroads worked to gain control of costs and improve competitiveness by terminating services and diversifying into other areas. As a result of cost-cutting, maintenance and upkeep of rail lines suffered such that by 1976, more than 46,000 miles of line had to be used at reduced speeds because of dangerous track conditions. Resulting delays reduced rail’s competitive position even more: by 1978, rail’s share of inter-city freight had fallen to 35% - down from 75% in the 1920s. Events that took place between the late 1970s to the mid-1990s created conditions for the revitalization of the railroad industry. Two events were arguably the most significant in this rebirth: the deregulation of railroads and innovations in containerization that opened the way for dramatic improvements to inter-modal transport. Given that regulation had constrained the success of railroads for so long, the passage of the Staggers Rail Act in 1980 presented a significant opportunity for railroads to improve their competitive position. Deregulation gave railroads new and nearly complete control of operations: railroads were allowed to determine their routes, the services to offer, and rates to charge. Still concerned for the potential of railroads to abuse their power, the ICC retained the authority to set maximum rates or take action if a railroad was determined to have “market dominance” or to have engaged in anti-competitive behavior. With regulations gone, railroads renewed efforts to strengthen their financial base. Key measures included reducing track mileage from 380,000 miles to 172,000 miles, reducing ‘rolling stock,’ downsizing the large employee base, and, importantly, consolidating through mergers.

8
In 1980 there were 40 Class I2 railroads and by 1999, only nine Class I railroads remained, with five of these accounting for 94% of railroad revenues. Today, seven railroads are classified as Class I, and together they account for 70 percent of system mileage and 93 percent of freight revenue. Despite the number of railroad mergers, competition between railroads has grown considerably with deregulation. Yet as railroads have consolidated, where they own trackage has resulted in certain railroads dominating particular areas of the U.S.: • East of the Mississippi, CSX Transportation (CSX) and the Norfolk Southern Railway (NS)
are the dominant players; • West of the Mississippi, it is BNSF Railway and UP (Union Pacific); • Kansas City Southern (KCS/KCSM) runs North-South from the mid-west to Mexico, and
forms part of the NAFTA railway; • Canadian National (CN/GTW) and Canadian Pacific Railroads (CP/SOO), own considerable
trackage in the U.S. and meet the revenue thresholds for Class I status.
Map courtesy of Karl Musser, cartographer
2 The classification of a railroad is determined by revenues. The revenue threshold for Class I status has changed over time, moving from $50 million in the 1980s to $250 million in the early 1990s. Redefining the revenue threshold during these years contributed in part to the declining number of Class I railroads. Currently the revenue threshold for a Class I railroad is $319.3 million per year.

9
Deregulation, together with other factors, has helped to improve the financial strength of the railroad industry. Rail market share (in ton-miles) increased to 40% nationally by 2005 and the financial performance of railroads went up, with a rate of return on investment at 7% between 1990 and 2005. Yet railroad’s response to deregulation has had both negative and positive impacts on service nationally and in Houston in particular. In 1995, the merger of Union Pacific and its long-time rival Southern Pacific created the largest railroad in the U.S. In Houston, the last round of mergers left the area being served primarily by Union Pacific (UP) and BNSF railroads, with UP in control of much of the area’s rail network. In 1997, in the process of implementing the merger, congestion on the UP lines spread to neighboring BNSF lines, creating serious rail service disruptions and lengthy shipment delays, especially in the Houston area. While UP took action to reduce train movements and manage traffic flows into congested areas, concerns have grown about a lack of competition for rail services and the deteriorating quality of rail service in Houston. Contributing to this concern has been railroad efforts to reduce their loads of less profitable traffic. As the economy produces more value-added products and less heavy manufactured goods, freight shipments have become lighter, less bulky, and higher in value, making them better suited for truck than rail. Aiming to increase their market share, railroads are minimizing their services to lower-profit carload and short-haul freight in favor of longer distance inter-modal and bulk traffic, which can be handled more cost-effectively and profitably in unit trains. While these strategies are based on the same economic principles used by successful businesses, which focus on maximizing return on investment and growing shareholder equity, these principles have at times come into conflict with the public’s interest. In Houston, where much of the freight cargo is heavy carloads, giving preference to lighter, less-bulky cargo is a disadvantage to local industry competitiveness. The second critical influence in the revitalization of railroads has been improvements to the design and standardization of containers for inter-modal transport. Shipping freight in containers placed on a railroad flatbed had been done as early as the 1930s. But in these early years, containers were different sizes and often incompatible with other modes of transport and even with other railroads between the US and other countries. As a result, the dominant process used for cargo shipped in containers was the ‘break bulk’ method, which would remove goods from the container, store them on a pier until the designated ship would arrive, and then load the goods onto the ship. This process took considerable time, and opportunities for damaging and losing goods through theft under this system were considerable. By the mid-1950s, Malcolm McLean, a trucker who was frustrated with the lengthy break bulk process, had designed a sturdy container and a ship design that would allow containers to be placed directly onto a ship for easy loading. What was new about his system was to use large containers that would never be opened in transit between the shipper and the destination, and which were transferable on an inter-modal basis, which is to say they could be loaded from truck to rail to ship to planes. His ship design was created by refitting a tanker ship which maximized space for containers. The efficiency of the system was remarkable and with the establishment of

10
international standards for size, fittings and reinforcement norms in the early 1970s, the volume of inter-modal freight transport grew steadily around the world. Containerization has been one of the most important innovations of 20th century logistics. Some have equated it to an industrial innovation as important as Henry Ford’s Model T assembly line was to making cars. Containers reduce cargo handling, reduce damages and loss, improve security and are faster to transport. Additionally, because they can be stacked on top of each other, containers reduce transportation costs through reduced crew and cargo handling expenses. As world trade has grown, containers have added significant new business to railroad shipping. Where historically bulk commodities were the main rail cargo, containerization has allowed rail to transport smaller items that might otherwise have been transported by truck. By 2005, approximately 18 million containers made over 200 million trips per year. Containerization has had a similarly dramatic impact on Houston’s port and freight volumes. With the largest U.S. port in terms of foreign tonnage and the extensive rail network connecting to state and regional markets, Houston has had the resources needed for the container industry to grow. In 1977, the Port of Houston anticipated the growth of containers and built Barbour’s Cut container facility. The Port’s share of container volumes subsequently grew. From 1987 to 1999 the annual volume of containers grew at a rate of 10% per year, growing from half a million TEUs (Twenty-foot Equivalent Units, the standard length of a container used for measuring volumes) a year to one million a year. In 2005, the Port’s container volume surpassed 1.5 million TEUs. As container volume has continued to grow, the Port has added additional container terminals to handle the increasing volumes. Another factor that has contributed to container growth in the Houston region has been the relocation of Wal Mart to nearby Chambers County. Wal Mart moved to the Houston region after the devastating longshoremen lock-out at the Los Angeles Port in 2001, which presented serious disadvantage to shippers. With Chambers County interested in attracting more ‘big box’ stores to the area, container growth could increase even more. With deregulation and containerization, rail as an industry has grown stronger, though there are still constraints on their ability to grow. Issues of distance to travel and handling costs will limit, to some extent, the amount of freight that will be carried by rail. When fuels costs are low, it is more cost-effective for a shipper to ship by truck if the freight needs to travel less than 200 miles. Additionally, to limit crew costs, shippers aim to minimize the number of times a container must be handled. Therefore rail and distribution infrastructure that affects how far a car must travel and the times a container must be handled will affect a shipper’s decision. In Houston, because the destination of much container freight is within 200 miles of Houston, the majority of containers leave the area by truck. How freight travels depends on several factors including the kind of commodity that is being shipped, the destination of the commodity, and the modes of transportation available. The following section looks at freight volumes, origins and destinations, and modes of transportation in the Houston region, and examines the implications of future trends on Houston’s rail freight.

11
FREIGHT VOLUMES, COMMODITIES, ORIGINS AND DESTINATIONS
OVERVIEW Houston is the energy capital of the world, and so not surprisingly, Houston’s petrochemical industry drives most of the freight that moves into, out of, and around the Houston region. In 2005, of all freight that traveled in the region, regardless of mode, more than 1 billion tons of freight was handled in the region. More than 40% of that freight was petroleum, petroleum products or basic chemicals. The vast majority of this freight traveled by pipeline (43%) or truck (37%). Only 10.5% of freight in the region traveled by rail. Of freight that travels by rail, the top origins and destinations of this freight are in the United States. For the most part, the region imports coal and basic chemicals from a few energy rich states – including Wyoming, Tennessee, and Kentucky – and exports large quantities of basic chemicals that go primarily to Texas, New Jersey, Illinois, Louisiana, and Michigan. The region produces more freight traffic than it receives, boasting a freight surplus of some 10 million tons. Assuming current trends, total freight in the region is expected to grow over 80% by 2035. No significant changes in our domestic trading partners are expected and foreign imports are expected to account for the majority of foreign trade. Given projected changes in commodity demand and production – specifically an expected decline in the importance of coal and petroleum products in the region and expected increases in ‘mixed freight’ including electronics – total rail freight volume is expected to increase. However, as a share of freight transport, rail’s share and pipeline’s share of freight are expected to decline. Conversely, trucking is expected to become even more integral to the region’s freight system, with its share of freight traffic expected to increase up to 49%. With growth expected to continue over the next 30 years, opportunities exist to enhance the strength of Houston’s economy by capturing a larger share of additional freight traffic. Two key opportunities stand out: the anticipated growth in container traffic and expansion to the Panama Canal expansion. Upgrades to rail infrastructure and improvements to the region’s inter-modal infrastructure that would make it more attractive to ship through Houston could be a significant economic engine for the city and region, potentially increasing marginal container freight by an additional 33.6 million tons, representing an additional $149 billion in goods handled in the region. DETAILED ANALYSIS Freight traveling in and around the Houston region can move by a variety of modes, including pipeline, water (barge), rail, and truck. Taking all these modes into consideration, in 2005 the Houston metropolitan region handled over 1 billion tons of freight. ALL FREIGHT Of the 1 billion tons of freight that moves around the region, nearly half of this total represents intra-region traffic, which is to say that the origin and destination lie within the eight counties of

12
the Houston region3. Of the remaining freight movements, two-thirds terminated in the Houston metropolitan region meaning, with Houston ‘importing’ more than 180,000 tons of freight than it ‘exports.’ The remaining freight traffic in the region is for ‘through traffic;’ freight that moves through the region without stopping.
• In 2005, the Houston metropolitan region processed over 1 billion tons of freight.4 This total includes shipments that originated in Houston, terminated in Houston, passed through Houston, or were moved within the Houston metropolitan region.
• 44% of all freight processed in the Houston metropolitan region consisted of “intra-region” trade shipments. Such freight had both its origination and destination within the Houston metropolitan region.
•
• Of all freight handled by the Port of Houston, 42% terminates in the Houston region.
• Just under 40% of freight is through traffic, or
traffic that moves through the Port as destined for areas outside of Houston.
Given the prevalence of petroleum and chemical industries in the region, it is not surprising that the leading commodities for transport include petroleum, petroleum products, gasoline, and basic chemicals, which represent 40% of all freight in the metropolitan Houston region. Other freight
3 Defined here as the region represented by Harris County and the seven adjacent counties including: Brazoria, Chambers, Fort Bend, Galveston, Liberty, Montgomery and Waller counties. 4 Houston region data is based on data for the Houston Metropolitan Statistical Area as defined by the U.S. Census Bureau, including Harris and the seven adjacent counties. For a complete list of areas included in the Houston metro, please refer to the technical addendum.
HOUSTON FREIGHT VOLUME BY GEOGRAPHY, 2005
168,797
350,817
445,260
47,153
0
250,000
500,000
Originating Terminating Intra-Region Through
Source: U.S. DOT, AE
HOUSTON METRO TRADE GEOGRAPHY
(Kilotons)
PORT OF HOUSTON TRADE GEOGRAPHYFREIGHT BREAKDOWN BY GEOGRAPHY, 2005
Source: U.S. DOT, AE Calculations
Originating, Terminating, and Through designations apply to the Houston metro
Originating, 20.4%
Terminating,
41.5%
Through Traffic,
38.2%
PORT OF HOUSTON TRADE GEOGRAPHYFREIGHT BREAKDOWN BY GEOGRAPHY, 2005
Source: U.S. DOT, AE Calculations
Originating, Terminating, and Through designations apply to the Houston metro
Originating, 20.4%
Terminating,
41.5%
Through Traffic,
38.2%
Originating, 20.4%
Terminating,
41.5%
Through Traffic,
38.2%

13
42.8%
Truck, 37.4%
Rail, 10.5%
Water, 8.3%
Other, 1.1%
TOTAL HOUSTON FREIGHT BY MODE, 2005
HOUSTON METRO MODE BREAKDOWN
Source: U.S. DOT, AE
Pipeline &
Unknown 42.8%
Truck, 37.4%
Rail, 10.5%
Water, 8.3%
Other, 1.1%
TOTAL HOUSTON FREIGHT BY MODE, 2005
HOUSTON METRO MODE BREAKDOWN
Source: U.S. DOT, AE
42.8%
Truck, 37.4%
Rail, 10.5%
Water, 8.3%
Other, 1.1%
TOTAL HOUSTON FREIGHT BY MODE, 2005
HOUSTON METRO MODE BREAKDOWN
Source: U.S. DOT, AE
TOTAL HOUSTON FREIGHT BY MODE, 2005
HOUSTON METRO MODE BREAKDOWN
Source: U.S. DOT, AE
Pipeline &
Unknown
commodities include dry and liquid bulk items including fuel oils, gravel, non-metal mining products, chemical products, natural sands, scrap, plastics and rubber, cereal grains, base metals, and other agricultural products.
• The top commodities traveling in and
through the Houston region by volume are almost exclusively dry and liquid bulk commodities.
• Crude petroleum is the leading commodity traded in the Houston metropolitan region, representing 20% of total freight trade. In 2005, trading of crude petroleum in the Houston metropolitan region topped 200 million tons.
• Four commodities represent an additional 40% of trade in the Houston metropolitan area; Coal & Petroleum products (159 million tons; 15.7%), Gasoline (148 million tons; 14.7%), and Basic chemicals (98 million tons; 9.7%).
In regards to how this freight is transported, given the vast amount of petroleum and petrochemical freight, in 2005 nearly 43% of all freight entering or leaving the metropolitan Houston region traveled via pipeline. Trucks were responsible for transporting the second-greatest share of goods, with over 37% of all freight traffic. Rail handled 10.5% of freight traffic moving in the region, representing the third most heavily used mode of transportation.
• In the Houston metropolitan region, pipelines process 42.8% of all freight, representing the greatest single share of all modes of transportation.
• Trucks handle 37.4% of all freight in the
metropolitan Houston region. • Rail accounts for 10.5% of all freight traffic in the
Houston region, a level slightly higher than the national average of 10.2%. In 2005, more than 100 million tons of goods were transported along the Houston region’s rail infrastructure.
• Freight transported via water, including barges,
totals 8.3% of all freight in the Houston metropolitan region.
DOMESTIC FREIGHT TRADE – ALL MODES OF TRANSPORT Of the 1 billion tons of freight that moved in the region, a total of 355 million tons of goods were traded with domestic partners in 2005. Houston’s top domestic trading partner: Texas.
34.0
98.2148.9
159.0202.3
18.8
81.749.9
27.830.2
9.0
14.614.4
18.518.7
0 100 200
Other Ag ProductsBase Metals
Unknow nCereal Grains
Plastics/RubberWaste/Scrap
Natural SandsChemical Products
Non-metal Min ProductsGrav el
Fuel OilsBasic Chemicals
GasolineCoal & Petroleum
Petroleum
TOTAL METRO HOUSTON COMMODITIES TOP TOTAL COMMODITY TRADE IN HOUSTON, 2005
(Million tons)
Source: U.S. DOT, AE

14
Texas is the largest recipient of freight originating in the metropolitan Houston region as well as the largest source of goods destined for the region. Texas receives over half of all trade originating in Houston. Similarly, the Lone Star state is responsible for nearly two-thirds of all freight destined for the metropolitan Houston region, with most of the freight originating from non-metropolitan areas within the state.
• The Houston metropolitan region traded a total of 355 million tons of goods with domestic partners in 2005.
• Nearly two-thirds of all domestic goods terminating in Houston originate in Texas. Notably, the Dallas, San Antonio, and Austin metropolitan areas represent only 20% of this group; the vast majority of the Texas freight destined for the Houston metropolitan region comes from non-metropolitan areas within the state.
• The leading originating states for freight destined for the Houston metropolitan region include Louisiana (9.2%), Wyoming (5.8%), Tennessee (2.6%), and Kentucky (1.5%). The remaining 45 states represent just over 15% of all domestic freight destined for the Houston region.
No other state comes close to the level of trade the metropolitan Houston region enjoys with the rest of Texas. Louisiana is the second largest trading partner, being both the second greatest source of goods destined for Houston as well as the second largest destination of goods leaving Houston. Even so, freight trade with Louisiana represents less than 10% of all traffic destined for or leaving the Houston metropolitan region.
• Texas is also the largest recipient of freight originating in the Houston region, comprising 52.4% of the total share. Much like freight destined for Houston, freight originating from the Houston region largely goes to non-metropolitan areas within the state. The Dallas, San Antonio, and Austin metropolitan areas represent only 20% of all freight originating in the Houston region bound for destinations within Texas.
• Among domestic destinations outside of Texas, Louisiana (10.3%), Michigan (8.6%), New Jersey (7.1%), and Illinois (2.3%) receive the largest share of freight originating from the Houston region. The remaining states represent fewer than 20% of all domestic freight originating from the Houston region.
Source: U.S. DOT, AE
Note: Includes Through Traffic
TOP FIVE DOMESTIC DESTINATIONS (BY VOLUME) FOR GOODS ORIGINATING FROM METRO HOUSTON, 2005
DOMESTIC DESTINATIONS
Texas, 52.4%
Other States, 19.4% Illinois, 2.3%
Louisiana, 10.3%
Michigan, 8.6%
New Jersey, 7.1%
Source: U.S. DOT, AE
Note: Includes Through Traffic
Source: U.S. DOT, AE
Note: Includes Through Traffic
TOP FIVE DOMESTIC DESTINATIONS (BY VOLUME) FOR GOODS ORIGINATING FROM METRO HOUSTON, 2005
DOMESTIC DESTINATIONS
Texas, 52.4%
Other States, 19.4% Illinois, 2.3%
Louisiana, 10.3%
Michigan, 8.6%
New Jersey, 7.1%
Source: U.S. DOT, AE
Note: Includes Through Traffic
TOP FIVE DOMESTIC ORIGINS (BY VOLUME) FOR GOODS DESTINED FOR METRO HOUSTON, 2005
DOMESTIC ORIGINATIONS
Texas, 63.2%
Other States, 15.7%
Tennessee, 2.6%
Louisiana, 9.2%
Kentucky, 1.5%
Wyoming, 5.8%
Source: U.S. DOT, AE
Note: Includes Through Traffic
Source: U.S. DOT, AE
Note: Includes Through Traffic
TOP FIVE DOMESTIC ORIGINS (BY VOLUME) FOR GOODS DESTINED FOR METRO HOUSTON, 2005
DOMESTIC ORIGINATIONS
Texas, 63.2%
Other States, 15.7%
Tennessee, 2.6%
Louisiana, 9.2%
Kentucky, 1.5%
Wyoming, 5.8%
TOP FIVE DOMESTIC ORIGINS (BY VOLUME) FOR GOODS DESTINED FOR METRO HOUSTON, 2005
DOMESTIC ORIGINATIONS
Texas, 63.2%
Other States, 15.7%
Tennessee, 2.6%
Louisiana, 9.2%
Kentucky, 1.5%
Wyoming, 5.8%
Texas, 63.2%
Other States, 15.7%
Tennessee, 2.6%
Louisiana, 9.2%
Kentucky, 1.5%
Wyoming, 5.8%

15
FOREIGN FREIGHT TRADE – ALL MODES OF TRANSPORT Of the 1 billion tons of freight that moved in the region, some 645 million tons of goods were traded with foreign partners. Houston’s top foreign trading partners include Mexico and Central and Latin America (henceforth, ‘the Americas.’) As top originators of freight destined for Houston, Mexico and the Americas provide approximately 50% of all international freight coming to the Houston region. As leading destinations for international freight originating from Houston, together Mexico and the Americas receive over 45% of all international freight leaving the metropolitan Houston region. Combining both originating and destination trade, Europe and Canada are Houston’s second largest trading partners. As destinations for freight originating in Houston, Europe and Canada combined account for over 27% of all international freight. As originators of freight destined for Houston, Europe and Canada account for less than 15% of all international freight.
• 25.3% of total goods imported into the Houston metropolitan region from foreign sources originate in Mexico. An additional 24% of goods imported into the Houston region originate in the Americas.
• Asia accounts for 18% of foreign goods shipped into the Houston region.
• Canada accounts for only 2.8% of total goods imported abroad into the Houston region.
• Notably, the Rest of the World—which primarily consists of African countries--accounts for 18.1% of all goods destined for the Houston region.
Asia is Houston’s third largest foreign trading partner. In 2005, Asia received 15.5% of all international freight originating from the Houston metropolitan area. Much like the national trade deficit, the metropolitan Houston region imports much more freight from Asia, which goods account for an additional 8% of foreign goods shipped into the Houston region.
TOP FOREIGN ORIGINS FOR GOODS DESTINED FOR METRO HOUSTON, 2005
FOREIGN ORIGINS
Source: U.S. DOT, AE
Mexico,25.3%
Americas,24.0%Rest of
World,18.1%
SW Asia,13.5%
Europe,11.8%
Asia E&S,4.5%
Canada,2.8%
16
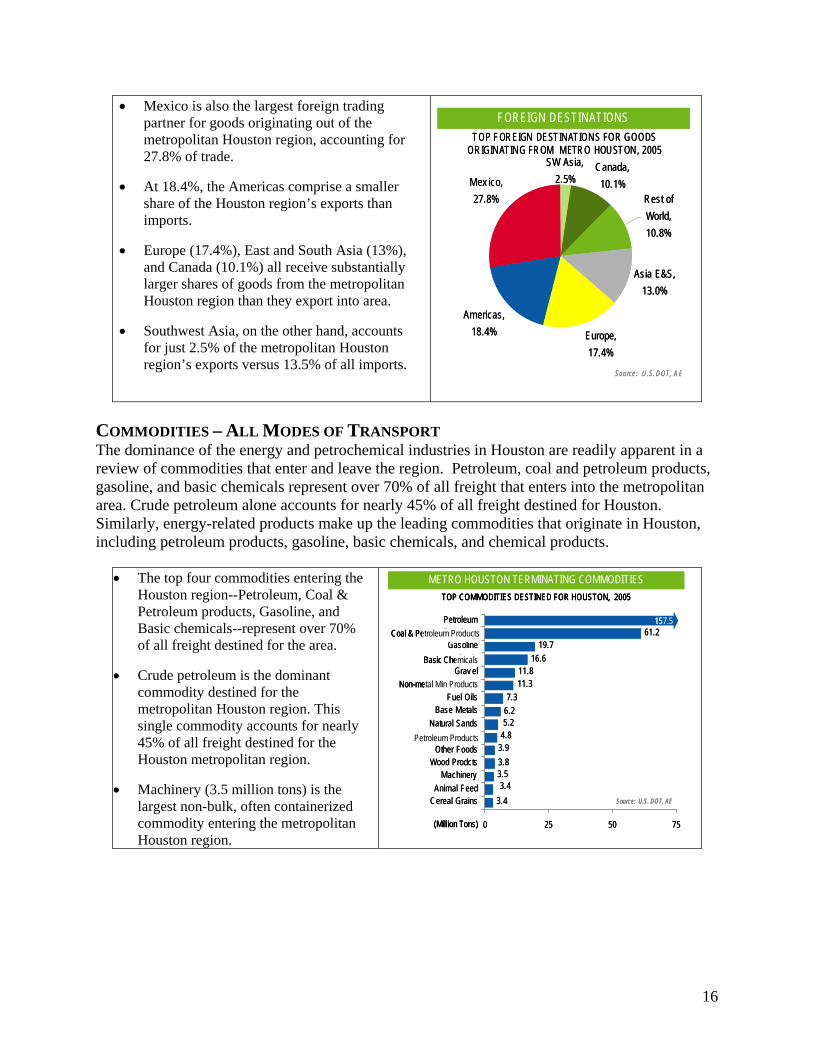
• Mexico is also the largest foreign trading partner for goods originating out of the metropolitan Houston region, accounting for 27.8% of trade.
• At 18.4%, the Americas comprise a smaller share of the Houston region’s exports than imports.
• Europe (17.4%), East and South Asia (13%), and Canada (10.1%) all receive substantially larger shares of goods from the metropolitan Houston region than they export into area.
• Southwest Asia, on the other hand, accounts for just 2.5% of the metropolitan Houston region’s exports versus 13.5% of all imports.
COMMODITIES – ALL MODES OF TRANSPORT The dominance of the energy and petrochemical industries in Houston are readily apparent in a review of commodities that enter and leave the region. Petroleum, coal and petroleum products, gasoline, and basic chemicals represent over 70% of all freight that enters into the metropolitan area. Crude petroleum alone accounts for nearly 45% of all freight destined for Houston. Similarly, energy-related products make up the leading commodities that originate in Houston, including petroleum products, gasoline, basic chemicals, and chemical products.
• The top four commodities entering the Houston region--Petroleum, Coal & Petroleum products, Gasoline, and Basic chemicals--represent over 70% of all freight destined for the area.
• Crude petroleum is the dominant
commodity destined for the metropolitan Houston region. This single commodity accounts for nearly 45% of all freight destined for the Houston metropolitan region.
• Machinery (3.5 million tons) is the
largest non-bulk, often containerized commodity entering the metropolitan Houston region.
7.3
16.619.7
61.2
3.93.8
3.43.5
3.4
6.25.2
11.311.8
4.8
0 25 50 75
Cereal GrainsAnimal Feed
MachineryWood Prodcts
Other FoodsChemical
Natural SandsBase Metals
Fuel OilsNon-metal
Grav elBasic
GasolinePetroleumPetroleum
TOP COMMODITIES DESTINED FOR HOUSTON, 2005
METRO HOUSTON TERMINATING COMMODITIES
Source: U.S. DOT, AE
(Million Tons)
157.5Coal & Petroleum Products
Non-metal Min Products
Petroleum Products
Basic Chemicals
TOP COMMODITIES DESTINED FOR HOUSTON, 2005
METRO HOUSTON TERMINATING COMMODITIES
Source: U.S. DOT, AE
(Million Tons)
157.5Coal & Petroleum Products
Non-metal Min Products
Petroleum Products
Basic Chemicals
Asia E&S, 13.0%
Europe, 17.4%
Americas, 18.4%
Mex ico, 27.8%
SW Asia, 2.5%
Canada, 10.1%
Rest of World, 10.8%
FOREIGN DESTINATIONSTOP FOREIGN DESTINATIONS FOR GOODS
ORIGINATING FROM METRO HOUSTON, 2005
Source: U.S. DOT, A E
Asia E&S, 13.0%
Europe, 17.4%
Americas, 18.4%
Mex ico, 27.8%
SW Asia, 2.5%
Canada, 10.1%
Rest of World, 10.8%
FOREIGN DESTINATIONSTOP FOREIGN DESTINATIONS FOR GOODS
ORIGINATING FROM METRO HOUSTON, 2005
Source: U.S. DOT, A E

17
• Coal & Petroleum products and gasoline are the top commodity originating in the Houston region.
• Coal & Petroleum products, Gasoline, Basic chemicals, and chemical products comprise over 50% of commodities originating in Houston.
• Mixed freight (including food, hardware, & office supplies) and electronics are small but growing containerized segments of Houston originating trade.
At the Port of Houston, the specific commodities handled closely mirror those of the metropolitan Houston region. The three leading commodities handled include petroleum, petroleum products, and chemical products. The majority of commodities that pass through the region are best suited for pipeline distribution.
• Commodity trade in the Port of Houston closely mirrors that of the metropolitan Houston region. In both geographies, for example, crude petroleum is the leading commodity as measured by volume.
• Chemical products, including paints, insecticides, and cleaning agents, represent the third most voluminous commodity traveling through the Port of Houston, with over 20 million tons handled in 2005. This differs from the metropolitan Houston region as a whole, for which chemical products rank as the eighth largest commodity. The Port of Houston accounts for over two-thirds of chemical product shipments handled in the metropolitan Houston region.
In recent years, the Port of Houston has looked toward container traffic as a potential avenue of growth. Over the past decade, this increased focus on containers has paid significant dividends. Since 1997, container traffic in the Port of Houston has nearly doubled, jumping from 6.2 million metric tons to 12.3 million metric tons. This increase outpaces some of the country’s leading ports, including Long Beach, New York, and Charleston. Only Savannah and Los Angeles have outpaced the Port of Houston’s container growth during this time period.
49.0
5.5
20.6
24.5
2.5
3.6
3.4
4.5
4.9
0 25 50
Metal Min Prdcts
Machinery
Other Ag Prdcts
Base Metals
Gasoline
Cereal Grains
Chemical Products
Petroleum Products
Petroleum
PORT OF HOUSTON COMMODITIESTOP COMMODITIES TRAVELING TO, FROM, & THROUGH PORT OF HOUSTON, 2005
(Megatons)
Source: U.S. DOT, AE
Coal & Petroleum Products
49.0
5.5
20.6
24.5
2.5
3.6
3.4
4.5
4.9
0 25 50
Metal Min Prdcts
Machinery
Other Ag Prdcts
Base Metals
Gasoline
Cereal Grains
Chemical Products
Petroleum Products
Petroleum
PORT OF HOUSTON COMMODITIESTOP COMMODITIES TRAVELING TO, FROM, & THROUGH PORT OF HOUSTON, 2005
(Megatons)
Source: U.S. DOT, AE
49.0
5.5
20.6
24.5
2.5
3.6
3.4
4.5
4.9
0 25 50
Metal Min Prdcts
Machinery
Other Ag Prdcts
Base Metals
Gasoline
Cereal Grains
Chemical Products
Petroleum Products
Petroleum
PORT OF HOUSTON COMMODITIESTOP COMMODITIES TRAVELING TO, FROM, & THROUGH PORT OF HOUSTON, 2005
(Megatons)
Source: U.S. DOT, AE
Coal & Petroleum Products
1.52.12.52.73.4
4.77.57.58.39.210.2
14.823.3
25.631.9
0 10 20 30
Natural SandsElectronics
Mix ed freightOther ag prods.
Base metalsNon-metal min. Products
Grav elCereal grains
Plastics/rubberFuel oils
Crude petroleumChemical Products
Basic chemicalsGasoline
Coal & Petroleum Products
METRO HOUSTON ORIGINATING COMMODITIESTOP COMMODITIES ORIGINATING IN HOUSTON, 2005
Source: U.S. DOT, AE
(Million Tons)

18
• With over 12 million metric tons handled in 2006, the Port of Houston is the fifth largest Port in the U.S. based on container volumes. Measured by TEU’s, the Port ranks 9th, behind the Ports of Oakland, Seattle, and Norfolk.
• Port of Houston’s container
volumes (metric tons) have grown over 90% since 1997, a more rapid increase than Long Beach (48.7%), New York (81.4%), and Charleston (38.0%), but slower than L.A. (113.7%) and Savannah (149.9%). Port of Houston TEU’s have grown 100% over this period.
RAIL FREIGHT Of freight that enters and leaves the Houston region on rail, the top destinations and origins for freight are all located within the United States. And while Houston receives a considerable amount of rail freight, the region ships out more rail freight traffic than it receives, having a rail freight surplus of more than 10 million tons.
• At 35.5%, originating traffic represents the greatest share of rail freight in the Houston metropolitan region.
• Terminating traffic totals 32.6% of all freight in the
Houston metropolitan region. • Rail is also used to carry a large volume of local
freight, defined as intra-region traffic (27.7%). • Through-traffic accounts for only 4.3% of total rail
freight in the Houston metropolitan region.
An analysis of rail freight again highlights the vital contributions the energy and petrochemical industries play in freight traffic. In short, the metropolitan Houston region imports massive amounts of coal and basic chemicals from a handful of energy rich states. In return, the metropolitan Houston region exports large quantities of basic chemicals. Rail freight destined for the Houston region is dominated by the raw materials necessary to fuel the energy and petrochemical industries. Coal, for example, accounts for 97% of all freight
12.3
6.2
05
1015
2025
3035
'97 '98 '99 '00 '01 '02 '03 '04 '05 '06
Los Angeles, CA
Long Beach, CA
New York, NY
Charleston, SC
Sav annah, GA
Houston, TX
CONTAINER TRAFFIC GROWTHCONTAINER TRAFFIC GROWTH, POH VS TOP U.S. PORTS, 1997-2005
(Millions of Metric Tons)
(Houston)
(Houston)
Source: USDOT MARAD
35.5%
32.6%
Through Traffic, 4.3%
Intra-Region, 27.7%
HOUSTON RAIL FREIGHTRAIL FREIGHT BY ORIGIN & DESTINATION, 2005
Source: U.S. DOT, AE
Originating Traffic
Terminating Traffic
35.5%
32.6%
Through Traffic, 4.3%
Intra-Region, 27.7%
HOUSTON RAIL FREIGHTRAIL FREIGHT BY ORIGIN & DESTINATION, 2005
Source: U.S. DOT, AE
35.5%
32.6%
Through Traffic, 4.3%
Intra-Region, 27.7%
HOUSTON RAIL FREIGHTRAIL FREIGHT BY ORIGIN & DESTINATION, 2005
Source: U.S. DOT, AE
Originating Traffic
Terminating Traffic

19
traffic from the three leading domestic trading partners to the Houston region: Wyoming, Tennessee, and Kentucky. In particular, Wyoming provides the Houston region with massive quantities of coal. In 2005, Wyoming sent 12.8 million tons of freight to the Houston metropolitan region, more than four times the amount of freight sent by any other state in the U.S. Outside of coal and petroleum products, basic chemicals are the top commodity destined for the Houston metropolitan region.
. Rail freight originating out of the Houston metropolitan region is slightly more diverse than rail freight destined for the region. Texas is the leading recipient of rail freight leaving the Houston region. Of the 4.6 million tons of rail freight shipped to Texas, coal and petroleum products represent approximately two-thirds of the traffic; the remaining freight is nearly equally split
Source: US DOT, AE
TOP TRADING PARTNERS FOR RAIL FREIGHT DESTINED FOR HOUSTON, 2005
WYOMING (12.8 MILLION TONS)
TENNESSEE (3.0 MILLION TONS)
KENTUCKY (2.8 MILLION TONS)
LOUISIANA (2.0 MILLION TONS)
TEXAS (2.0 MILLION TONS)
COAL & PETROLEUM PRODUCTS
PLASTIC & RUBBER BASIC CHEMICALS CEREAL GRAINSOTHER
LOUISIANAHOUSTON
TENNESSEE
WYOMING
KENTUCKY
TEXASMILLION TONS OF FREIGHT
15,0007,500
0
15100
15,0007,500
0
15,0007,500
0
15100

20
between plastic & rubber and basic chemicals. New Jersey, the second leading recipient of rail freight from Houston, is an anomaly compared to other leading trade partners; two-thirds of rail traffic destined for New Jersey is comprised of cereal grains. Among Houston’s other three leading trade partners, basic chemicals represent the bulk of rail traffic. While representing just under half of all rail freight destined for Illinois, basic chemicals comprise nearly 90% of all rail freight destined for Louisiana and 95% of all rail freight destined for Wisconsin.
Source: US DOT, AE
TOP TRADING PARTNERS FOR RAIL FREIGHT ORIGINATING OUT OF HOUSTON, 2005
COAL & PETROLEUM PRODUCTS
PLASTIC & RUBBER BASIC CHEMICALS CEREAL GRAINSOTHER
HOUSTON
ILLINOIS
WISCONSIN
NEW JERSEY
TEXAS
TEXAS (4.6 MILLION TONS)
NEW JERSEY (3.2 MILLION TONS)
ILLINOIS (1.7 MILLION TONS)
WISCONSIN (1.6 MILLION TONS)
LOUISIANA (1.7 MILLION TONS)
MILLIONS OF TONS15,0007,500
0
15,0007,500
0
15100LOUISIANA
Source: US DOT, AE
TOP TRADING PARTNERS FOR RAIL FREIGHT ORIGINATING OUT OF HOUSTON, 2005
COAL & PETROLEUM PRODUCTS
PLASTIC & RUBBER BASIC CHEMICALS CEREAL GRAINSOTHER
HOUSTON
ILLINOIS
WISCONSIN
NEW JERSEY
TEXAS
TEXAS (4.6 MILLION TONS)
NEW JERSEY (3.2 MILLION TONS)
ILLINOIS (1.7 MILLION TONS)
WISCONSIN (1.6 MILLION TONS)
LOUISIANA (1.7 MILLION TONS)
MILLIONS OF TONS15,0007,500
0
15,0007,500
0
15,0007,500
0
15100
15,0007,500
0
15,0007,500
0
15100LOUISIANA

21
RAIL FREIGHT FORECASTS STATIC FORECAST This section details the Houston region’s freight flows projected out over the next 3 decades, assuming current conditions. Data are categorized by commodity, geography, and mode to provide a nuanced picture of the state of Houston freight trade from 2010 to 2035 and to offer comparability with the 2005 data. A Note on Methodology: Forecast values presented in this section rely on a supply driven model based on long-term growth in potential output. Such supply factors as population and employment growth, labor force participation, investment, fiscal policy, and GDP growth are included in the analysis. The model assumes economic expansion will occur to its fullest long-term potential; calculations, however, do not take into account potential exogenous shocks. Assuming current trends, total freight trade in the Houston metropolitan region will grow over 80% by 2035, topping 1.86 billion tons. The shares of freight that originate, terminate, pass through or move intra-region will remain nearly constant over the next 30 years.
Given current conditions, total freight trade in the metropolitan Houston region will reach 1.86 billion tons by 2035, an increase of approximately 850 million tons over current levels. The shares of freight represented by intra-region, originating, terminating, and through traffic trade will remain nearly constant over the next 30 years.
Growth throughout the metropolitan
Houston region will maintain a steady increase over the next 30 years.
Total through traffic volumes5 will be
limited due to the presence of alternative shipping routes.
During this period, the Port of Houston will continue to handle 12% of all freight moving in, out, within, and through the metropolitan Houston region. 5 Includes “Through” category as well as portions of “Originating” and “Terminating”
445 526 551 577 618 688 806
197 210 230260
306
658594
351 417 457 497 54018716947
94
50
8273
6557
0
500
1,000
1,500
2,000
2005 2010 2015 2020 2025 2030 2035
Intra-Region TerminatingOriginating Through
METRO HOUSTON FUTURE FREIGHT GROWTHTOTAL FUTURE FREIGHT VOLUMES, 2005-2035
Source: U.S. DOT, AE
(Millions Of Tons) Originating, Terminating, Intra-Region and
Through designations apply to the Houston metro
METRO HOUSTON FUTURE FREIGHT GROWTHTOTAL FUTURE FREIGHT VOLUMES, 2005-2035
Source: U.S. DOT, AE
(Millions Of Tons)
METRO HOUSTON FUTURE FREIGHT GROWTHTOTAL FUTURE FREIGHT VOLUMES, 2005-2035
Source: U.S. DOT, AE
(Millions Of Tons) Originating, Terminating, Intra-Region and
Through designations apply to the Houston metro

22
By 2035, the share of the Port of Houston’s ‘through traffic’ freight -freight to or from areas beyond the Houston region, will increase substantially to 43.9% (from 38.2% in 2005). The share of the Port of Houston’s traffic that terminates in the Houston region will decrease from 41.5% to 35.6%.
In regards to our trading partners, Texas will continue to be the major trading partner for goods both originating and terminating in the Houston region. Goods that originate in the region will increase by more than 50 million tons and goods that terminate in Houston will increase by more than 150 million tons by 2035.
Growth outside of Texas will continue to
occur among most of the Houston region’s major trading partners—New Jersey is the only leading state expected to decline in traffic.
Trade with Louisiana will nearly double by
2035, increasing from 20 million tons to 35 million tons. Trade with Michigan will jump from 11 million tons to 17 million tons.
391114
70
132
2417 8
40
50
100
150
Tex as Louisiana Michigan New Jersey Illinois
2005 2035TOP DOMESTIC DESTINATIONS BY VOLUME, 2005 VS 2035
TOP DOMESTIC ORIGNS BY VOLUME, 2005 VS 2035
Source: U.S. DOT, AE
METRO HOUSTON DOMESTIC TRADE
(Million Tons)
(Million Tons)
461320
3524 16
70
50
100
150
Tex as Louisiana Wy oming Tennessee Oklahoma
2005 2035
140
299
Termntng35.6%
Origintng, 20.5%
Through Traffic, 43.9%
Source: U.S. DOT, AE CalculationsOriginating
TerminatingTermntng35.6%
Origintng, 20.5%
Through Traffic, 43.9%
Source: U.S. DOT, AE CalculationsOriginating
Terminating
PORT OF HOUSTON TRADE FREIGHTFREIGHT BREAKDOWN BY GEOGRAPHY, 2005
Originating, Terminating, and Through designations apply to the Houston metro
Termntng35.6%
Origintng, 20.5%
Through Traffic, 43.9%
Source: U.S. DOT, AE CalculationsOriginating
TerminatingTermntng35.6%
Origintng, 20.5%
Through Traffic, 43.9%
Source: U.S. DOT, AE CalculationsOriginating
TerminatingTermntng35.6%
Origintng, 20.5%
Through Traffic, 43.9%
Termntng35.6%
Origintng, 20.5%
Through Traffic, 43.9%
Source: U.S. DOT, AE CalculationsOriginating
TerminatingTermntng35.6%
Origintng, 20.5%
Through Traffic, 43.9%
Termntng35.6%
Origintng, 20.5%
Through Traffic, 43.9%
Source: U.S. DOT, AE CalculationsOriginating
Terminating
PORT OF HOUSTON TRADE FREIGHTFREIGHT BREAKDOWN BY GEOGRAPHY, 2005
Originating, Terminating, and Through designations apply to the Houston metro

23
Foreign imports will continue to account for the majority of foreign trade, with traffic increasing from 129 million tons to 169 million tons by 2035.
Foreign export trade (goods originating in
Houston) will grow at a rapid clip, increasing by more than 31 million tons (89%) by 2035.
Mexico and the Americas will remain the
top trading partners with the Houston region, increasing (imports and exports combined) approximately 22 million tons and 13 million tons, respectively, by 2035.
Substantial growth will also occur in the
European and East and South Asian markets; trade with the former will increase 68%, while trade with the latter will grow by over 95%.
STATIC FORECAST: RAIL FREIGHT Though rail freight volumes will increase overall, due to projected differentials in commodity production and demand, the share of freight transported by rail is expected to decline, dropping from its current level of 10.5% to 9.0% by 2035. This drop mirrors the projected decline of rail’s share of freight traffic throughout the country through 2035.
Rail mode share in the Houston region will decrease from 10.5% to 9.0% between 2005 and 2035; by way of contrast, rail share in the United States as a whole will decrease more modestly, from 10.2% in 2005 to 9.9% by 2035.
The most precipitous rail share
declines will occur over approximately the next five years, and between 2025 and 2035.
10.5%
9.0%
9.9%10.2%
7.5%8.0%8.5%9.0%9.5%
10.0%10.5%11.0%11.5%12.0%12.5%
2005 2010 2015 2020 2025 2030 2035
Houston U.S.
Source: U.S. DOT, AE
METRO HOUSTON FUTURE RAIL SHARE
RAIL SHARE OF TOTAL FREIGHT, U.S. VS HOUSTON, 2005-2035
10.5%
9.0%
9.9%10.2%
7.5%8.0%8.5%9.0%9.5%
10.0%10.5%11.0%11.5%12.0%12.5%
2005 2010 2015 2020 2025 2030 2035
Houston U.S.
Source: U.S. DOT, AE
METRO HOUSTON FUTURE RAIL SHARE
RAIL SHARE OF TOTAL FREIGHT, U.S. VS HOUSTON, 2005-2035
METRO HOUSTON FUTURE RAIL SHARE
RAIL SHARE OF TOTAL FREIGHT, U.S. VS HOUSTON, 2005-2035
31
18 15
610
2519
3940
0
10
20
30
40
50
Mex ico Americas SW Asia Europe Asia, E&S
2005 2035
4566
10
22
1211 10
5
0
5
10
15
20
25
Mex ico Americas Europe Asia, E&S Canada
2005 2035
TOP FOREIGN DESTINATIONS BY VOLUME, 2005 VS 2035
Source: U.S. DOT, AE
TOP FOREIGN ORGIINS BY VOLUME, 2005 VS 2035
Source: U.S. DOT, AE
METRO HOUSTON FOREIGN TRADE
(Million Tons)
(Million Tons)
32 31
18 15
610
2519
3940
0
10
20
30
40
50
Mex ico Americas SW Asia Europe Asia, E&S
2005 2035
4566
10
22
1211 10
5
0
5
10
15
20
25
Mex ico Americas Europe Asia, E&S Canada
2005 2035
TOP FOREIGN DESTINATIONS BY VOLUME, 2005 VS 2035
Source: U.S. DOT, AE
TOP FOREIGN ORGIINS BY VOLUME, 2005 VS 2035
Source: U.S. DOT, AE
METRO HOUSTON FOREIGN TRADE
(Million Tons)
(Million Tons)
32

24
During this time period pipeline is also anticipated to suffer a decline, though a more precipitous decline. Currently 42.8% of all freight handled in the metropolitan Houston area is transported via pipeline; by 2035, this share is expected to drop to 34.9%. In contrast to other modes of transportation, trucking is to become even more integral to the Houston metropolitan region’s freight system. In 2005, 37.4% of all freight in the Houston region was shipped via trucks; by 2035, this share is expected to reach 49%. These metropolitan-wide mode shifts are expected to similarly affect the Port of Houston.
While many products can be shipped via a variety of delivery systems, other products are most economically shipped via specific modes. For example, large-volume, bulk commodities such as grain are best shipped via rail. Small, high-end electronics destined for a few choice customers, on the other hand, will likely be shipped via truck.
While all modes of freight transport are expected to
increase over the next 30 years, projected changes in product demand will likely decrease rail’s share of freight traffic. Specifically, the demand for bulk commodities such as oil is not expected to keep pace with the growth rate of niche products such as precision instruments.
Under current conditions, substantial mode shifts will
occur in the metropolitan Houston region over time. The share of freight transported by truck will increase from 37.4% to 49%, while the share transported by pipeline will decrease from 42.8% to 34.9%.
Many of the modal shifts projected to occur throughout the Houston region over the next 30 years will be fueled by commodity changes in the area. Specifically:
• Coal and petroleum products will shrink in their relative importance to both the Houston region’s originating and terminating freight traffic. As a share of freight traffic originating from Houston, coal and petroleum products are projected to shrink from their current share of 18.9% to just 10.4% by 2035.
• As a share of freight traffic terminating in the metropolitan Houston region, coal and petroleum products are expected to drop to from the current level of nearly 50% to 32.6%.
Other, 1.2%
Water, 5.9%
Rail, 9.0%
Truck, 49.0%
HOUSTON FREIGHT BY MODE, 2035
METRO HOUSTON MODE BREAKDOWN
Source: U.S. DOT, AE
Pipeline & Unknown
34.9%
Other, 1.2%
Water, 5.9%
Rail, 9.0%
Truck, 49.0%
HOUSTON FREIGHT BY MODE, 2035
METRO HOUSTON MODE BREAKDOWN
Source: U.S. DOT, AE
Other, 1.2%
Water, 5.9%
Rail, 9.0%
Truck, 49.0%
HOUSTON FREIGHT BY MODE, 2035
METRO HOUSTON MODE BREAKDOWN
Source: U.S. DOT, AE
Pipeline & Unknown
34.9%

25
1.5% 1.2%
6.0%
5.5%
4.9%
13.8%
8.8%
24.3%
15.1%
18.9%
Gasoline Coal & Petroleum Products Chemical prodsBasic chemicals Mixed freight ElectronicsCrude petroleum Fuel oils Plastics/rubberOther
2005
19.7%
3.3%
5.0%
7.4%
11.2%13.9%
1.8%
12.1%
10.4%
15.3%
2035168.8 MILLION
TONS306.0 MILLION
TONS
METRO HOUSTON’S TOP ORIGINATING COMMODITIES – CURRENT AND PROJECTED FIGURES
* Primarily natural gas, coal, selected coal products, products of petroleum refining
Source: U.S. DOT, AE
* Primarily natural gas, coal, selected coal products, products of petroleum refining
Source: U.S. DOT, AE
Conversely, mixed freight will jump from 1.2% to 13.9% of traffic originating in the Houston region, making it the second highest volume traded commodity by 2035; electronics will also grow rapidly, from 1.5% to over 11% during the period.
• Basic chemicals, mineral products, fuel oils, gravel, and coal & petroleum products will stay at or slightly above current share levels.
• Precision instruments will move from a miniscule share to nearly 3% of freight destined for the metropolitan Houston region.
1.5% 1.2%
6.0%
5.5%
4.9%
13.8%
8.8%
24.3%
15.1%
18.9%
Gasoline Coal & Petroleum Products Chemical prodsBasic chemicals Mixed freight ElectronicsCrude petroleum Fuel oils Plastics/rubberOther
2005
19.7%
3.3%
5.0%
7.4%
11.2%13.9%
1.8%
12.1%
10.4%
15.3%
2035168.8 MILLION
TONS306.0 MILLION
TONS
METRO HOUSTON’S TOP ORIGINATING COMMODITIES – CURRENT AND PROJECTED FIGURES
* Primarily natural gas, coal, selected coal products, products of petroleum refining
Source: U.S. DOT, AE
* Primarily natural gas, coal, selected coal products, products of petroleum refining
Source: U.S. DOT, AE

26
Significant modal shifts will occur at the Port of Houston as well, also driven by changes in the composition of commodities. By 2035, 54.3% of freight will be transported by truck (compared with 38.6% currently), while only 25.1% will be transported via pipeline (compared with 34.6% currently). The share of goods transported by interior waterway will also decrease substantially, from 17.1% today to 10.4% in 2035.
The share of Port of Houston goods transported by rail
will increase slightly during this period, from 8.8% today to 9.3% by 2035.
Similar trends in commodity share will likely impact the Port of Houston as well. • The share of the Port of Houston’s traffic represented by crude petroleum will decline
from 39.7% to 25.1%. • Chemical products will see a large increase in share at the Port of Houston, growing from
16.7% to 33.6% of all freight by volume. • The second largest percentage increase will occur in machinery, which will grow from
2.8% to 5.3%.
Pipeline& Unkw n, 25.1%
Truck, 54.3%
Rail, 9.3%
Water, 10.4%
Other, 0.9%
Pipeline & UnknownPORT OF HOUSTON FREIGHT BY MODE, 2035
PORT OF HOUSTON FREIGHT
Source: U.S. DOT, A E
Pipeline& Unkw n, 25.1%
Truck, 54.3%
Rail, 9.3%
Water, 10.4%
Other, 0.9%
Pipeline & Unknown
Pipeline& Unkw n, 25.1%
Truck, 54.3%
Rail, 9.3%
Water, 10.4%
Other, 0.9%
Pipeline & UnknownPORT OF HOUSTON FREIGHT BY MODE, 2035
PORT OF HOUSTON FREIGHT
Source: U.S. DOT, A E
PORT OF HOUSTON FREIGHT BY MODE, 2035PORT OF HOUSTON FREIGHT
Source: U.S. DOT, A E
0.5%
2.9% 5.5% 4.0% 2.9%3.7%
16.7%
19.8%4.5%
39.7%
Gasoline Cereal Grains Crude PetroleumOther Ag Products Coal & Petroleum Products Chemical ProductsMixed Freight Bae Metals MachineryOther
2005
5.4%5.3%
3.7%0.7%
33.6%
16.6%
3.5%
25.1%
3.4%2.8%
2035
METRO HOUSTON’S TOP TERMINATING COMMODITIES – CURRENT AND PROJECTED FIGURES
* Primarily natural gas, coal, selected coal products, products of petroleum refining
Source: U.S. DOT, AE
* Primarily natural gas, coal, selected coal products, products of petroleum refining
Source: U.S. DOT, AE

27
RAIL FREIGHT: DYNAMIC FORECAST MODEL This section describes the projected marginal increase in freight flows to the Port of Houston and the Houston region, assuming the presence of adequate inter-modal rail capacity to efficiently handle increased traffic. Though it is impossible to predict what might happen in the future, possible futures can be considered when taking into consideration certain events that are expected to happen. In the case of Houston’s freight rail future, two events - the continued growth of containerization and the expansion of the Panama Canal - are likely to occur which would change the dynamics of rail freight in the region. Yet Houston must take steps to secure a competitive position in regards to other freight transportation, and particularly rail freight, in order to see the benefits of these events. COMPETITIVE POSITIONING Though growth will continue at the Port of Houston and throughout the region over the next 30 years, opportunities exist to capture additional freight traffic if investments are made in rail infrastructure. This opportunity will occur primarily in regards to container traffic, the largest growth market in shipping and a category that currently represents only 8.5% of total traffic (metric tons) handled at the Port of Houston. Exogenous shocks are occurring that will allow for increased container flows through the Port of Houston and the Houston region, but infrastructural capacity improvements will need to be made if these increased flows are to be capitalized upon. Currently, the competitive position of the Port of Houston as a container hub and the challenge to fully capture increased freight traffic is highlighted by data on container shipment times. Because of rail delays, the shipping time through the Houston region is a disincentive to shippers. For example, the time needed to ship a container through Houston to Kansas City significantly exceeds that to ship through Los Angles, due in large part to substantially longer time spent on rail; seven days versus three days. This circumstance will limit the Houston region’s ability to fully capture additional container traffic even as congestion and capacity issues mount in west coast ports.
$0
$1,000
$2,000
$3,000
$4,000
$5,000
$6,000
0 7 14 21 28
COSTSHIPPING TIME AND COST
APPROXIMATE TIME AND COST OF SHIPPING ONE 20-FOOT CONTAINER FROM HONG KONG TO KANSAS CITY VIA COMPETING PORTS
(Costs)
AVERAGE ARRIVAL DATE
Source: U.S. DOT, AE
(Days)
PORT OF HOUSTON
PORT OF LOS ANGELES
BOAT RAIL$0
$1,000
$2,000
$3,000
$4,000
$5,000
$6,000
0 7 14 21 28
COSTSHIPPING TIME AND COST
APPROXIMATE TIME AND COST OF SHIPPING ONE 20-FOOT CONTAINER FROM HONG KONG TO KANSAS CITY VIA COMPETING PORTS
(Costs)
AVERAGE ARRIVAL DATEAVERAGE ARRIVAL DATE
Source: U.S. DOT, AE
(Days)
PORT OF HOUSTON
PORT OF LOS ANGELES
BOAT RAILBOAT RAIL

28
GROWTH IN CONTAINERIZATION As noted earlier in this document, container transport has exploded as a viable, cost-efficient alternative for shippers. Whereas the cost to ship a product once exceeded 10% of total costs, making it economically difficult or unfeasible to ship many goods, today the cost of oceanic shipping is negligible. With the rise of globalization, the rapid expansion of many East Asian markets and U.S. demand for their goods, and the proliferation of free trade agreements such as NAFTA, containerized traffic today is growing at unprecedented levels. Since 1997, container trade at U.S. ports has experienced an average annual growth rate of over 8%. Over the past decade, the volume of container traffic handled at the Port of Houston has grown 98%. Strong growth is expected to continue in the future, as demand for high value/low weight goods in the U.S. increases, and many break-bulk goods continue to shift to containerization. Container trade is thus a tremendous growth market for the Port of Houston, which currently receives most of its traffic in the form of liquid bulk and dry bulk shipments. PANAMA CANAL EXPANSION On October 22, 2006 Panamanian voters approved a referendum for a $5.25 billion expansion of the Panama Canal that will dramatically increase the channel’s freight movement capacity. The Panama Canal is one of three key routes facilitating trade between Asia and the U.S. Due to increases in demand for consumer goods, congestion at West Coast ports, and inter-modal reliability issues in the U.S., volumes of freight shipped through the Canal have spiked in recent years as shipments to the Gulf and East Coast ports became an attractive alternative. Between 1999 and 2004 the Canal’s share of Asia-U.S. container trade jumped 27 percentage points, from 11% to 38%. The expansion project will be completed by 2015 and will allow the Panama Canal to accommodate continued growth in freight demand, particularly containerized
SHARE OF TOTAL U.S. CONTAINER TRAFFIC (METRIC TONS), TOP 5 U.S. PORTS, 200618.1%
13.5%15.4%
6.2% 5.7%
0%
5%
10%
15%
20%
Los Angeles,CA
Long Beach,CA
New York, NY Sav annah, GA Houston, TX
CONTAINER TRAFFIC SHARES
Source: USDOT MA RAD
SHARE OF TOTAL U.S. CONTAINER TRAFFIC (METRIC TONS), TOP 5 U.S. PORTS, 200618.1%
13.5%15.4%
6.2% 5.7%
0%
5%
10%
15%
20%
Los Angeles,CA
Long Beach,CA
New York, NY Sav annah, GA Houston, TX
CONTAINER TRAFFIC SHARES
Source: USDOT MA RAD
TOTAL PORT OF HOUST0N CONTAINER TRAFFIC, 1997 - 2006
12.3
6.2
5
10
15
1997 1998 1999 2000 2001 2002 2003 2004 2005 2006
PORT OF HOUSTON CONTAINER GROWTH
Source: USDOT MARAD
(Millions of Metric Tons)
TOTAL PORT OF HOUST0N CONTAINER TRAFFIC, 1997 - 2006
12.3
6.2
5
10
15
1997 1998 1999 2000 2001 2002 2003 2004 2005 2006
PORT OF HOUSTON CONTAINER GROWTH
Source: USDOT MARAD
(Millions of Metric Tons)

29
traffic. By 2025, 296 million tons of container freight will move through the expanded canal, an increase of 198 million tons from 2005. These factors, combined with the development of the new Bayport container terminal, leave the Port of Houston and the entire Houston region poised to capture substantial volumes of additional container traffic in the coming decades, if upgrades to the region’s inter-modal-rail infrastructure are sufficient to allow such increases and make it attractive to shippers to ship through the Houston region. If necessary improvements are made, marginal container freight will increase an additional 33.6 million tons by 2035. This constitutes a 156% increase over current container freight projections in the static mode. If necessary rail and inter-modal improvements are made, increased container freight flows will add an additional $149 billion in goods handled at the Port of Houston. In the years from 2015 and 2035, the value of container freight handled will jump by more than 100%.
Source: U.S. DOT, MARAD, AE
CONTAINER SHARE, GIVEN IMPROVEMENTS - 2005 V 2035
7.3%
92.7%
71.5%
28.5%
0.0%
25.0%
50.0%
75.0%
100.0%
2005 2035
Container Bulk, Break-Bulk, & Other
PORT OF HOUSTON - CONTAINER SHARE
Source: U.S. DOT, MARAD, AE
CONTAINER SHARE, GIVEN IMPROVEMENTS - 2005 V 2035
7.3%
92.7%
71.5%
28.5%
0.0%
25.0%
50.0%
75.0%
100.0%
2005 2035
Container Bulk, Break-Bulk, & Other
PORT OF HOUSTON - CONTAINER SHARECONTAINER SHARE, GIVEN IMPROVEMENTS - 2005 V 2035
7.3%
92.7%
71.5%
28.5%
0.0%
25.0%
50.0%
75.0%
100.0%
2005 2035
Container Bulk, Break-Bulk, & Other
PORT OF HOUSTON - CONTAINER SHARE
MARGINAL CONTAINER FREIGHT INCREASE, GIVEN IMPROVEMENTS 2010-2035
33.6
4.3
19.214.1
24.429.2
0
10
20
30
40
2010 2015 2020 2025 2030 2035
PORT OF HOUSTON - MARGINAL CONTAINER FREIGHT INCREASE
Source: U.S. DOT, MARAD, AE
(Megatons)MARGINAL CONTAINER FREIGHT INCREASE, GIVEN IMPROVEMENTS 2010-2035
33.6
4.3
19.214.1
24.429.2
0
10
20
30
40
2010 2015 2020 2025 2030 2035
PORT OF HOUSTON - MARGINAL CONTAINER FREIGHT INCREASE
Source: U.S. DOT, MARAD, AE
(Megatons)
$44.5 $53.3 $63.7 $77.3 $95.6
$36.6
$149.3
$15.5$52.4
$74.3$98.4
$123.6
0.0
50.0
100.0
150.0
200.0
250.0
2010 2015 2020 2025 2030 2035
Marginal Increase ValueExpected Value
PORT OF HOUSTON - MARGINAL CONTAINER VALUE INCREASEEXPECTED VALUE AND MARGINAL INCREASE VALUE GIVEN
IMPROVEMENTS, 2010-2035
Source: U.S. DOT, MARAD, AE
($Billions)
Note: Value of increased freight based value/tonnage ratios of expected freight
Projection Based on Current ConstraintsProjection With on No Constraints

30
Moreover, the maximization of container growth potential will lead to a strong increase in container share at the Port. Currently, containerized freight makes up only 7.3% of freight by volume, but will grow to nearly 29% by 2035 assuming adequate rail and inter-modal capacity exists. While the Houston region has plenty of opportunity to grow over the next 30 years, it will have to do so through a strategy of further diversification. Specifically, the Port of Houston and the Houston region as a whole must continue to capture additional container traffic. Doing so will require improvements to rail and inter-modal capacity that will increase the efficiency and speed at which freight moves in and out of the region. To make improvements in rail capacity will involve the interest and effort of the many interest groups involved in freight transportation. The following section describes the rail freight players in the Houston region and their role in moving freight in, out, and around the region.
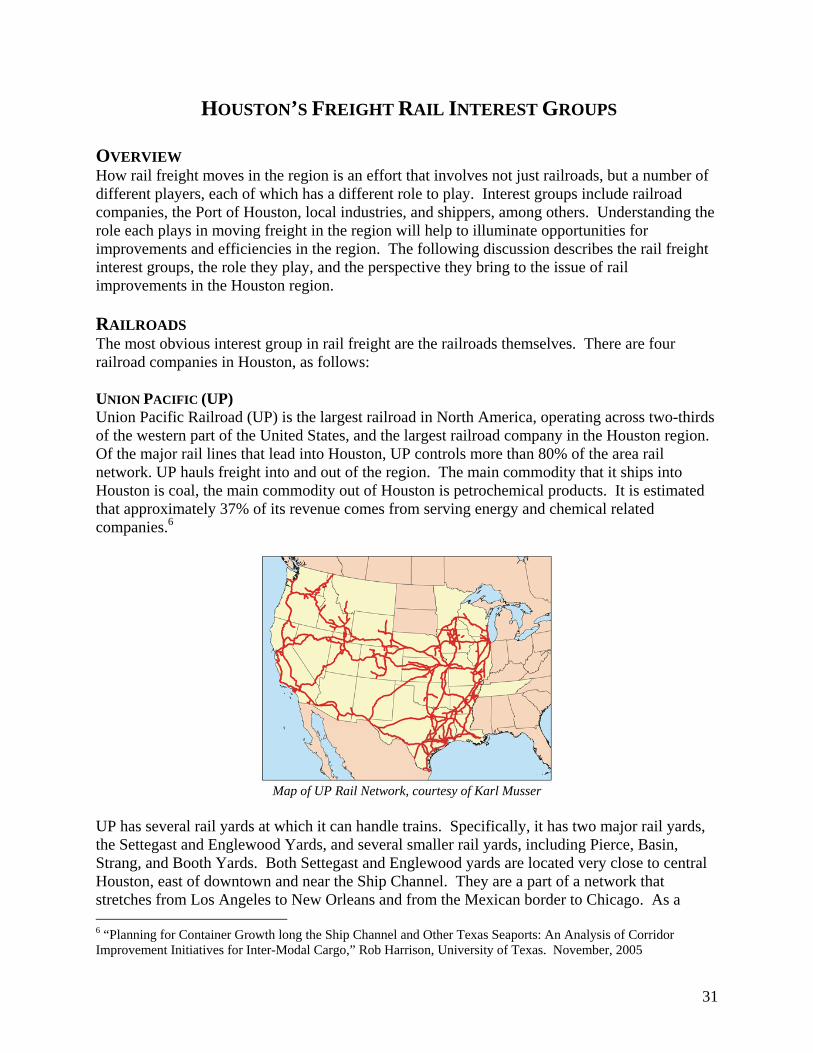
31
HOUSTON’S FREIGHT RAIL INTEREST GROUPS OVERVIEW How rail freight moves in the region is an effort that involves not just railroads, but a number of different players, each of which has a different role to play. Interest groups include railroad companies, the Port of Houston, local industries, and shippers, among others. Understanding the role each plays in moving freight in the region will help to illuminate opportunities for improvements and efficiencies in the region. The following discussion describes the rail freight interest groups, the role they play, and the perspective they bring to the issue of rail improvements in the Houston region. RAILROADS The most obvious interest group in rail freight are the railroads themselves. There are four railroad companies in Houston, as follows: UNION PACIFIC (UP) Union Pacific Railroad (UP) is the largest railroad in North America, operating across two-thirds of the western part of the United States, and the largest railroad company in the Houston region. Of the major rail lines that lead into Houston, UP controls more than 80% of the area rail network. UP hauls freight into and out of the region. The main commodity that it ships into Houston is coal, the main commodity out of Houston is petrochemical products. It is estimated that approximately 37% of its revenue comes from serving energy and chemical related companies.6
Map of UP Rail Network, courtesy of Karl Musser UP has several rail yards at which it can handle trains. Specifically, it has two major rail yards, the Settegast and Englewood Yards, and several smaller rail yards, including Pierce, Basin, Strang, and Booth Yards. Both Settegast and Englewood yards are located very close to central Houston, east of downtown and near the Ship Channel. They are a part of a network that stretches from Los Angeles to New Orleans and from the Mexican border to Chicago. As a 6 “Planning for Container Growth long the Ship Channel and Other Texas Seaports: An Analysis of Corridor Improvement Initiatives for Inter-Modal Cargo,” Rob Harrison, University of Texas. November, 2005
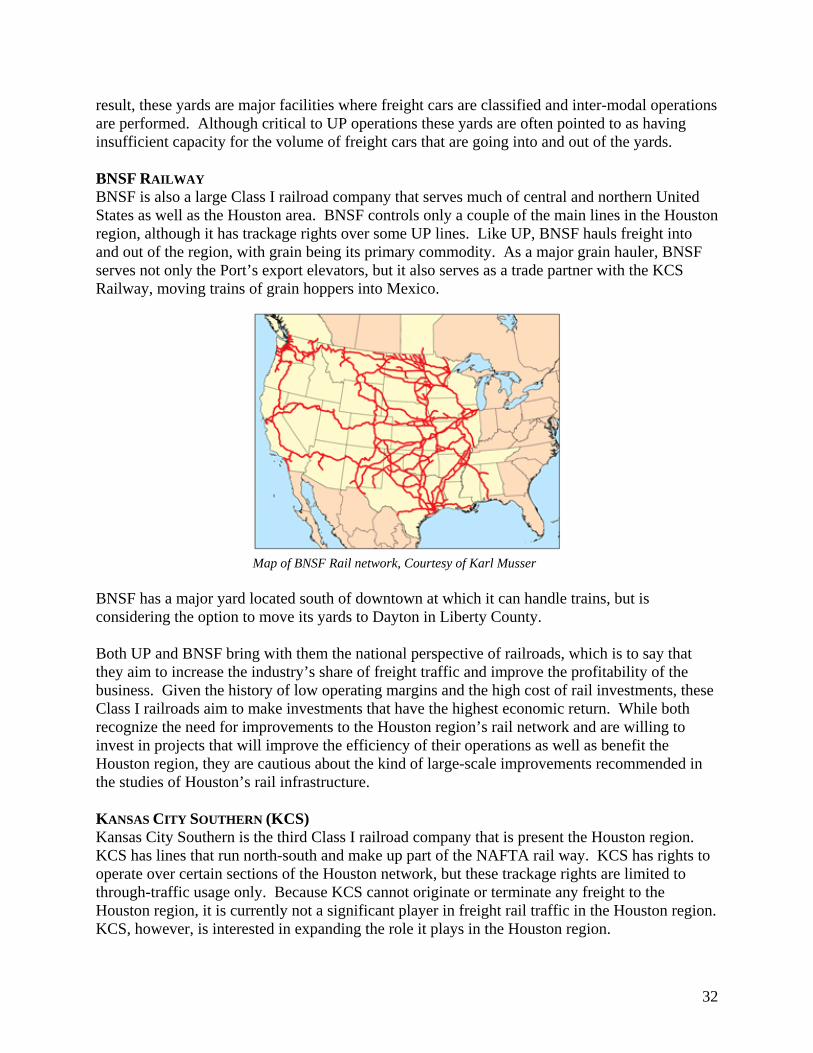
32
result, these yards are major facilities where freight cars are classified and inter-modal operations are performed. Although critical to UP operations these yards are often pointed to as having insufficient capacity for the volume of freight cars that are going into and out of the yards. BNSF RAILWAY BNSF is also a large Class I railroad company that serves much of central and northern United States as well as the Houston area. BNSF controls only a couple of the main lines in the Houston region, although it has trackage rights over some UP lines. Like UP, BNSF hauls freight into and out of the region, with grain being its primary commodity. As a major grain hauler, BNSF serves not only the Port’s export elevators, but it also serves as a trade partner with the KCS Railway, moving trains of grain hoppers into Mexico.
Map of BNSF Rail network, Courtesy of Karl Musser BNSF has a major yard located south of downtown at which it can handle trains, but is considering the option to move its yards to Dayton in Liberty County. Both UP and BNSF bring with them the national perspective of railroads, which is to say that they aim to increase the industry’s share of freight traffic and improve the profitability of the business. Given the history of low operating margins and the high cost of rail investments, these Class I railroads aim to make investments that have the highest economic return. While both recognize the need for improvements to the Houston region’s rail network and are willing to invest in projects that will improve the efficiency of their operations as well as benefit the Houston region, they are cautious about the kind of large-scale improvements recommended in the studies of Houston’s rail infrastructure. KANSAS CITY SOUTHERN (KCS) Kansas City Southern is the third Class I railroad company that is present the Houston region. KCS has lines that run north-south and make up part of the NAFTA rail way. KCS has rights to operate over certain sections of the Houston network, but these trackage rights are limited to through-traffic usage only. Because KCS cannot originate or terminate any freight to the Houston region, it is currently not a significant player in freight rail traffic in the Houston region. KCS, however, is interested in expanding the role it plays in the Houston region.

33
Map of KCS rail network, courtesy of Karl Musser PORT TERMINAL RAIL AUTHORITY (PTRA) Formed in 1924, the PTRA is an association of all the railroads serving the Houston area. It is a ‘short line’ railroad that exists to provide railroad companies shared access to the 155 industries that are located along its track, and are the heart of Houston’s rail freight customer base. PTRA rail tracks are owned by the Port of Houston while its Board of Directors is composed of representatives from all the major railroads (UP, BNSF, and KCS) and the Port of Houston. The operations of the PTRA are critical to rail freight operation in the Houston region and can play an important role in improving rail movements in the region. PTRA lines link Class I railroad cars to industry. An example of how rail freight moves in the region would be as follows: A freight car coming in on UP train, for example, would be hauled into one of UP’s rail yards. The UP would then put this cars together with other cars waiting to be delivered to industry and haul them to the PTRA yard. At the PTRA yard, cars that go to a specific industry plant would be put together and then hauled to the designated plant. The plant would unload the car and then call PTRA to pick up the empty car. PTRA picks up the empty freight car and takes it back to a PTRA yard where it is put together with other UP cars. Once enough cars are gathered, the UP would come to hauls the cars back to its rail yard. PTRA has two major yards from which it operates. The Pasadena Yard is located east-southeast of downtown Houston and is the major yard serving the industries along the south side of the Ship Channel. The North Yard is the PTRA’s largest yard, with trackage running north to south along the east side of Wayside Dr. south of I-10. The North Yard serves industries located along the north side of the Ship Channel and is the location of UP’s shops and locomotive maintenance facilities. PTRA’s yards are also considered to be insufficient to meet capacity. The main issue is that the rail yard capacity has not grown despite the fact that freight volume has. For example, the ‘fluid

34
capacity’ (capacity at which rail cars can be moved easily around) of the North Yard is 1,200 freight cars, but often there are more than 1,200 cars in the yard, leaving little empty track on which to switch freight cars. If Houston is to see considerable growth in rail freight volumes, then more capacity at PTRA yards will be critical to efficient and timely freight movement in the region. SURFACE TRANSPORTATION BOARD The Surface Transportation Board (STB), established by the Interstate Commerce Commission Termination Act of 1995, is the regulatory agency responsible for resolving railroad rate and service disputes and reviewing proposed railroad mergers. The STB is administratively affiliated with the U.S. Department of Transportation but is independent in its decision-making. The STB is intended to serve as both an adjudicatory and a regulatory body. The agency has jurisdiction over railroad issues, including rates, services, and rail restructuring transactions as well as certain trucking company, moving van, and ocean shipping matters; financial, and operational matters; and rates and services of certain pipelines not regulated by the Federal Energy Regulatory Commission. The STB has played some role in ensuring a level of competition in railroad service in the Houston region. In 1995, as a condition to approval of the Union Pacific and Southern Pacific merger, the STB required BNSF access to certain lines in order to preserve some rail competition in the Houston region. THE PORT OF HOUSTON AUTHORITY The Port of Houston is a major recipient and originator of freight that moves in and out of the region. The Port’s facilities provide the critical infrastructure for freight to move in the region and, as owner of PTRA land and facilities, the Port is a central player in facilitating freight movement in and out of the region. To date, container traffic at the Port has been mainly the domain of trucks, though that could change as container volumes increase and as the Port positions itself for more inter-modal traffic. To support inter-modal transportation, the Port Authority has built 12 miles of main line rail track and has expanded the Barbour’s Cut rail facility. Currently, direct trains are operated between Barbour’s Cut and Pier 400 at the Port of Los Angeles four times per week. The Port Authority is in preliminary engineering to build a new main line track to the Bayport container terminal and plans an inter-modal facility at Bayport in 2012. Class I railroad companies have expressed some doubt about the Houston region’s ability to capture significantly more share of container freight shipped by rail. From their perspective, to make shipping containers by rail more attractive, shippers need to be able to originate and terminate trains at the dock to minimize handling of containers. Yet they believe that the Port’s rail facilities will not be sufficient for increased volumes of direct long-distance travel by rail. Barbour’s Cut, for example, is designed primarily to move containers by truck.

35
HOUSTON INDUSTRIES Houston’s industries are often overlooked in the discussion about freight rail, and yet they are the most important driver of the freight traffic we have today. There are more than 150 petrochemical industries located along the Ship Channel and hundreds more located around the region that are served by the railroads. Besides producing freight to be sent out of the region and being importers of freight to the region, industries play an important role in determining how freight leaves the region: The decision to use truck or rail in shipping is determined by price and profitability. In general it is considered that hauls less than 450 miles are too costly to ship by train and so are given to trucks for hauling. In the next two decades, changes in the cost of fuel and the cost of long distance driving may combine with other factors to make short distances more attractive opportunities for rail inter-modal traffic. For Houston, where much of its market is currently within Texas and Louisiana, this has important implications for making changes to how freight will leave and arrive in the region. Industries also have a role to play in making freight movement in the region more efficient. For many plants along the Ship Channel, the product that is produced, such as plastic pellets, is loaded directly into rail cars for shipment. At times the product in the container may not be sold and in those instances, plant managers arrange with railroads to store the cars somewhere until they are ready to be shipped to a customer. Additionally, because plant managers want to keep plants running at top efficiency, they aim to keep empty cars in reserve nearby so that can have ready access to cars should they need them. Some industries have very large privately owned fleets of freight and specialty cars. The system is resulting in a ‘parking lot problem’ where loaded or empty freight cars are sitting on tracks and potentially causing disruptions in traffic movement. At one time this system worked for railroads because they had excess track on which they could store the extra cars. However, as freight volume has increased and railroads have less available track, they have begun to charge industry for storing cars or are requiring industry to store the cars on industry property. From an industry perspective, the freight rail situation in Houston is a serious competitive disadvantage. Most notable is the delay in getting shipments out of the region and to their destination. Besides the cost to industry for the delay in getting product to its destination, the delay also has implications for when a freight car will return to the industry to load again. The delay in returning empty cars creates more costs for industry, which must then either buy or lease more cars or build their own storage capacity so that they can keep plant production on schedule. Additionally, industry representatives have expressed an interest in being able to ship their product directly out of the region. Currently product from industries along the ship channel are hauled to PTRA and Class I rail yards near downtown Houston before they can be shipped east again. Because this causes delay and often results in hazardous materials sitting in rail yards close to residential neighborhoods, industry would like to find new routes for product that can leave the region more quickly.

36
The net result is a strained relationship between industry and railroads. Industry is believes that the lack of competition in the region is causing them to pay higher costs and leads to slow delivery times. SHIPPERS AND LOGISTICS COMPANIES Like industry, there are many shippers and logistic companies in the region that drive freight traffic in the region and as such are interested in a more efficient freight rail system. In the case of shippers of container freight, their top concern is on-time delivery. Unlike some bulk commodities, containers that carry retail merchandise must meet strict on-time delivery schedules. In the Houston region, processes that have are used to put a train together for delivery are not conducive to on-time delivery needs. In the works of one railroad operator: “In the past … we would hold the train until all the cars were delivered… It’s analogous to taking a flight to Toronto where the plane won’t take off until they fill up all the seats. It isn’t good customer service and it isn’t good asset utilization.”7
7 “Planning for Container Growth long the Ship Channel and Other Texas Seaports: An Analysis of Corridor Improvement Initiatives for Inter-Modal Cargo,” Rob Harrison, University of Texas. November, 2005

37
CONCLUSION The Houston region’s extensive rail network and vibrant industry and port have created a powerful economic engine for the region. With increasing world trade and the expansion of the Panama Canal, the Houston region will continue to be, and perhaps grow even more central to freight moving into and out of the United States. In light of this expected growth, improvements to infrastructure and the movement of freight must take place, both for industry and the port to remain competitive as well as for the general good of the community. To date, discussions about making improvements to the region’s rail infrastructure have focused largely on railroads. While railroads are obvious and important players in making rail improvements, they are not the only interest group that has a role to play. Other critical interest groups include petrochemical industries, as originators and destinations of freight; the Port of Houston Authority, as a major locus of freight movement; the Port Terminal Rail Authority, as the primary connection between railroads and industry; and the communities that are most directly affected by rail movements. When deciding upon improvements to make, it will be important to include every interest group that is affected so as to get an effective solution supported by all parties.

38
TECHNICAL ADDENDUM
Houston Region: The region represented by Brazoria, Chambers, Fort Bend, Galveston,
Harris, Liberty, Montgomery and Waller County.
Basic Chemicals: Sodium Hydroxide, Inorganic Chemicals, Cyclic Hydrocarbons, Phenols, Phenol-alcohols, Aldehydes, Cyclic Polymers of Aldehydes, Paraformaldehyde, Ketones, Quinones, Organic Acids, and Acyclic Alcohols, Organic Chemicals
Destination: One of the 121 Department of Transportation designated locations where
shipment ends movement.
Export: Any good prepared for shipment outside of Houston, including goods shipped to domestic locations.
Import: Any good prepared for import to Houston, including those received from
domestic locations
Intra-region: Freight both originating and terminating within a specified geography
Originating One of the 121 Department of Transportation designated locations where shipment begins movement
Petrochemical Chemical products made from raw materials of petroleum (hydrocarbons).
Industry
Petroleum Products Lubricating oils, refined petroleum oils, petroleum coke, and petroleum asphalt.
Rest of the World: Africa, Australia, Greenland, and Syria.
Through-Traffic: Freight neither originating nor terminating within a specified geography