fukuoka growth 2013-2014
TRANSCRIPT
0
INDEX
01 基本情報/Quick Facts··········································· 003
02 人口/Population ·················································· 019
03 経済活動/Economic Engine ·································· 027
04 生活の質/Quality of Life ······································· 041
05 人材・人流/Diversity ············································· 053
06 交通・物流/Traffic & Logistics ······························· 065
07 都市の吸引力/Attractive Force ······························ 079
08 自然/Nature ························································ 097
メッセージ/Message ··················································· 111
1
多くの自治体では、厳しい財政事情の中で、効率的で効果的な財政運営のために、政
策の選択と集中を図っています。地域の発展、成長のために本当に必要な政策は何か。
自治体にもマーケティングの発想が求められています。
データ収集・分析・提言に留まらず、戦略的な視点に立ち、政策立案者と対話を重ねる
参謀機能として、URC 内に「情報戦略室」が設置されました。
「情報戦略室」は、情報の収集・分析と、戦略の構築支援によって、福岡市の発展と経
済成長の実現に貢献していくことをミッションとしています。
公益財団法人 福岡アジア都市研究所 情報戦略室
Information & Strategy Office of Fukuoka Asian Urban Research Center
後藤 太一/Taichi GOTO
畠山 尚久/Naohisa HATAKEYAMA
山田 美里/Misato YAMADA
In severe financial conditions, many municipalities are attempting to focus on policies for efficient and effective financial operation. What is the necessary policy for social and economic development? Municipalities are also expected to engage in marketing. The ‘Information & Strategy Office’ was set up in URC (Fukuoka Asian Urban Research Center) as an advisory team serving Fukuoka, with a mission to contribute to the economic growth of the city. In daily operation, it collects and analyzes data and information, consults to city bureaus and the general public, builds up policy options, and recommends priorities to support the Mayor’s decision making.

2
データは、あらゆる計画の基礎となるものです。
自然科学は、実験データを蓄積しながら新たな発
見や進化を導き、ビジネスや政策の場面では、さまざ
まなデータをもとに次の戦略が練られます。
仮説や予測は、データに基づく論理的な根拠がな
ければ成り立ちません。
福岡市は、2014年3月、国の経済成長を牽引する
国家戦略特区に指定されました。
福岡市の未来を考えるために、さまざまな視点でデ
ータを分析し、事実と背景から見えてくるものをもとに、
より確かな成長の道筋を整えていくことが重要です。
福岡市の成長の可能性を示すさまざまなデータが
あります。
テーマに沿ったデータで、福岡の今を診断し、福岡
市とそこに暮らす人の未来を考えていきたいと思いま
す。
福岡に住むこと、学ぶこと、働くこと、投資すること、
ビジネスを始めること、多くの人と交わることなど、みなさ
んが福岡との関わりの中で、成功や成長を実現する
一助になれば幸いです。
データでみる「国家戦略特区・福岡市」の成長ポテンシャル
Growth Potential of Fukuoka City: The National Strategic Economic Growth Area
Data is the basis for planning. In natural science, accumulated experimental data leads to new discoveries and the evolution of knowledge. In business or policy making, a variety of data supports strategic planning. No reliable hypothesis or forecast can be established without logical grounds based on data analysis. Fukuoka City was designated as one of the National Strategic Economic Growth Areas in March 2014. To plan for the future of Fukuoka, it is important to analyze data from a variety of points of view and to prepare a more certain path for growth. This series is based on a data set indicating the growth potential of Fukuoka. In each issue we will diagnose and discuss the future of Fukuoka and its people by analyzing data relevant to a selected theme. We hope this series of reports will be informative for those who are considering to live, study, work, invest, or start a business in Fukuoka.
*「Fukuoka Growth2013-2014」は、(公財)福岡アジア都市研究所のホームページ上で 2013 年 6 月から 2014 年 3 月まで公開したものを再構成、編集してまとめたものです。掲載されているデータは、最新値に更新したものもありますが、公開時のまま最新値でないものも含まれます。 Note: This book "Fukuoka Growth2013-2014" contains reedited and rearranged contents of the “Fukuoka Growth” reports that we published on our website from June 2013 to March 2014. Not all data in this book has been updated since the original release.
3
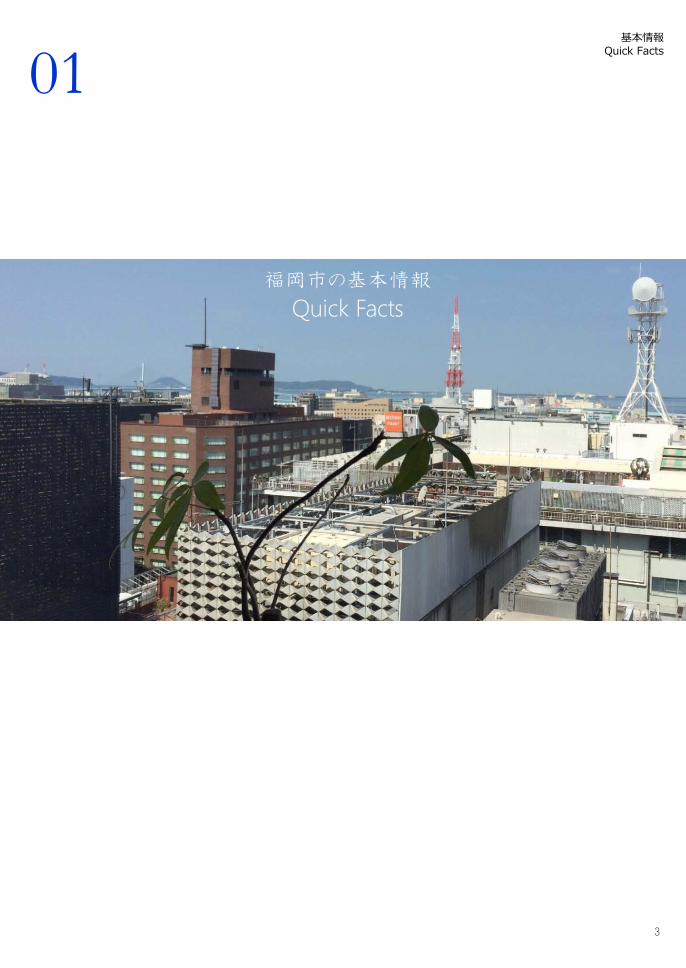
基本情報 Quick Facts
福岡市の基本情報
Quick Facts
01

4
人口・面積/Population and Land area
日本/Japan
127,298,000 人/persons(100%) 377,950k ㎡(100%) *337 人,persons/ k ㎡
九州/Kyushu Region 13,108,027 人/persons(10.3%) 39,600 k ㎡(10.5%) *331 人,persons/ k ㎡
福岡県/Fukuoka Prefecture 5,090,712 人/persons(4.0%) 4,847 k ㎡(1.3%) *1,050 人,persons/ k ㎡
福岡市/Fukuoka City 1,506,313 人/persons(1.2%) 341.7 k ㎡(0.09%) *4,408 人,persons/ k ㎡
福岡都市圏/Fukuoka Metropolitan 2,466,012 人/persons(1.9%) 1,170 k ㎡(0.3%) *2,108 人,persons/ k ㎡
世界/World 7,080,072,000 人/persons 148,940,000 k ㎡ 東アジア・東南アジア /Eastern Asia, South-Eastern Asia 2,223,383,000 人/persons 16,854,711 k ㎡
資料:国・県公表推計人口(平成25年10月現在)*福岡都市圏:福岡市、筑紫野市、春日市、大野城市、宗像市、太宰府市、古賀市、福津市、糸島市、筑紫郡那珂川町、糟屋郡宇美町、篠栗町、志免町、須恵町、新宮町、久山町、粕屋町面積…国土地理院「平成25年全国都道府県市区町村別面積調」(平成25年10月)、世界・アジアデータ…国際連合「World Population Prospects: The 2012 Revision」(2012 年) Sources: Population Estimates, City Statistics, October 2013, World Population & Land area; United Nations. World Population Prospects: The 2012 Revision (2012). *Fukuoka Metropolitan Area (9 cities and 8 towns in total) includes Fukuoka, Chikushino, Kasuga, Onojo, Munakata, Dazaifu, Koga, Fukutsu and Itoshima cities, and Nakagawa, Chikushi-gun; Umi, Kasuya-gun; Sasaguri, Shime, Sue, Shingu, Hisayama and Kasuya towns.
基本情報/Quick Facts
5
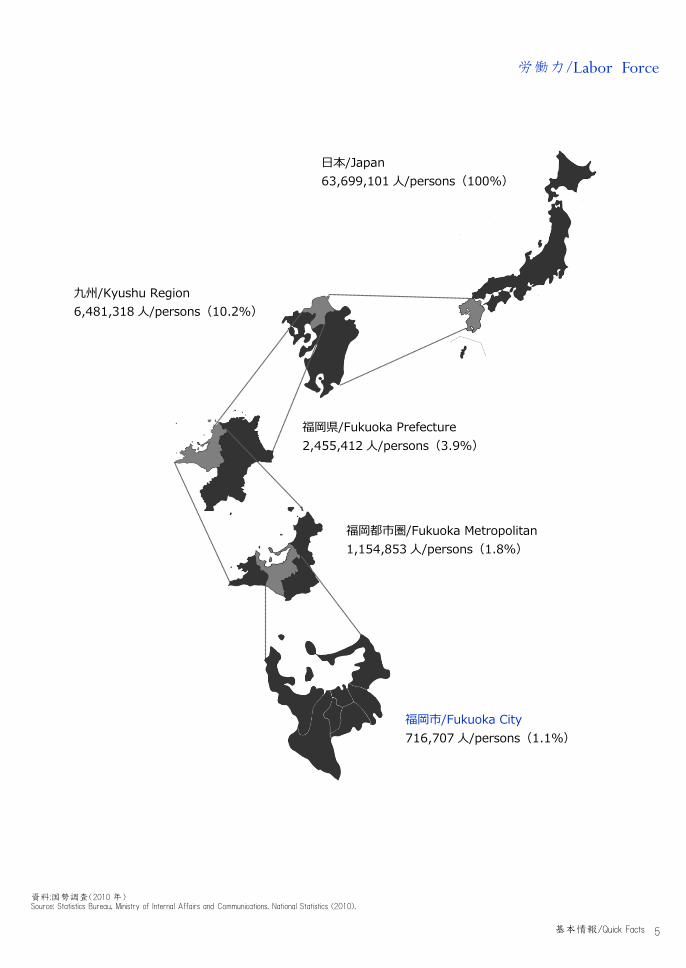
労働力/Labor Force
日本/Japan
63,699,101 人/persons(100%)
九州/Kyushu Region 6,481,318 人/persons(10.2%)
福岡県/Fukuoka Prefecture 2,455,412 人/persons(3.9%)
福岡市/Fukuoka City 716,707 人/persons(1.1%)
福岡都市圏/Fukuoka Metropolitan 1,154,853 人/persons(1.8%)
資料:国勢調査(2010 年) Source: Statistics Bureau, Ministry of Internal Affairs and Communications. National Statistics (2010).
基本情報/Quick Facts
6
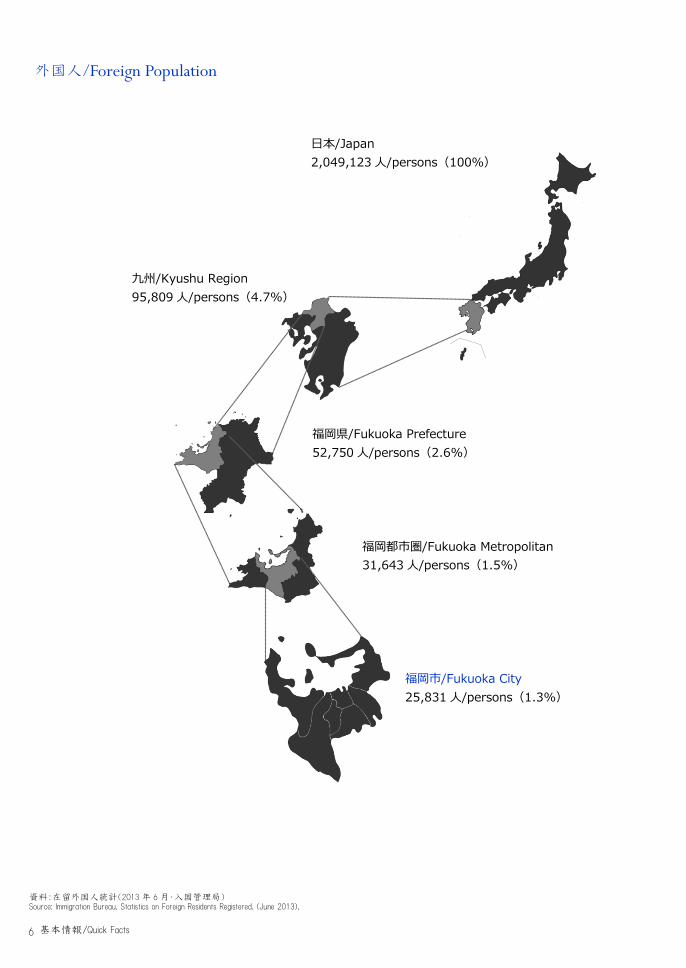
外国人/Foreign Population
日本/Japan 2,049,123 人/persons(100%)
九州/Kyushu Region 95,809 人/persons(4.7%)
福岡県/Fukuoka Prefecture 52,750 人/persons(2.6%)
福岡市/Fukuoka City 25,831 人/persons(1.3%)
福岡都市圏/Fukuoka Metropolitan 31,643 人/persons(1.5%)
資料:在留外国人統計(2013 年 6 月・入国管理局) Source: Immigration Bureau. Statistics on Foreign Residents Registered. (June 2013).
基本情報/Quick Facts

7
学生/Student Population
日本/Japan 大学生/University students:2,868,872 人/persons(100%) 大学院生/Graduate students:255,386 人/persons(100%) 専修学校生/Vocational school students:660,078 人/persons(100%) 短期大学生/Junior college students:138,260 人/persons(100%)
九州/Kyushu Region 大学生/University students:
222,853 人/persons(7.8%) 大学院生/Graduate students:
20,503 人/persons(8.0%) 専修学校生/Vocational school students:
82,478 人/persons(12.5%) 短期大学生/Junior college students:
16,566 人/persons(12.0%)
福岡県/Fukuoka Prefecture 大学生/University students:121,134 人/persons(4.2%) 大学院生/Graduate students:11,675 人/persons(4.6%) 専修学校生/Vocational school students:46,639 人/persons(6.8%) 短期大学生/Junior college students:8,322 人/persons(6.0%)
福岡市/Fukuoka City 大学生/University students:63,372 人/persons(2.2%) 大学院生/Graduate students:7,838 人/persons(3.1%) 専修学校生/Vocational school students:32,148 人/persons(4.9%) 短期大学生/Junior college students:4,713 人/persons(3.4%)
資料:平成 25 年度学校基本調査(文部科学省) Source: Ministry of Education, Culture, Sports, Science and Technology (MEXT). School Basic Survey (2013).
基本情報/Quick Facts
8
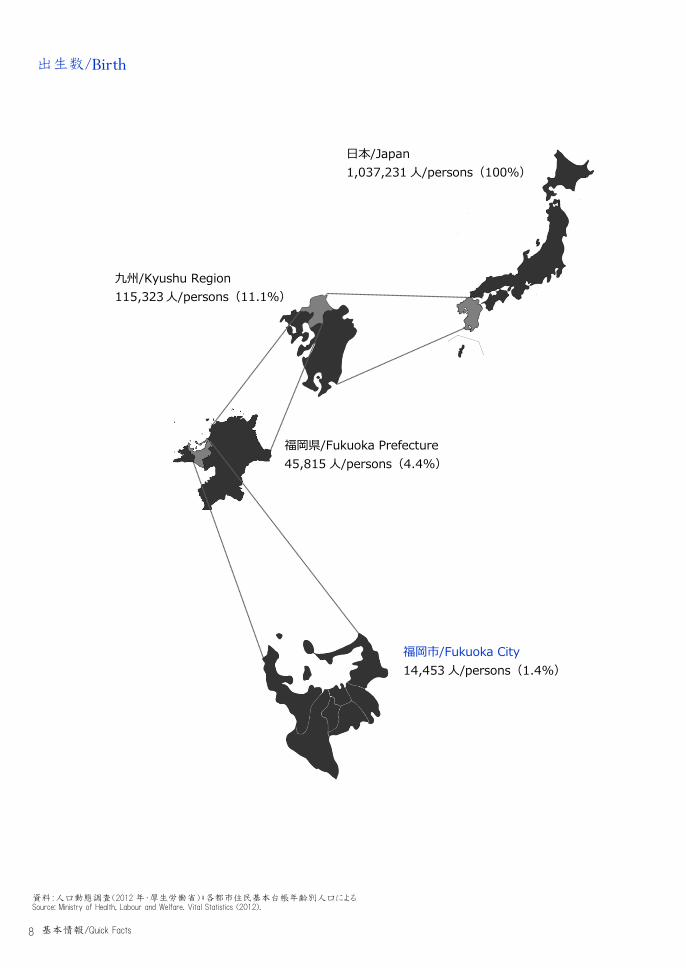
出生数/Birth
日本/Japan 1,037,231 人/persons(100%)
九州/Kyushu Region 115,323 人/persons(11.1%)
福岡県/Fukuoka Prefecture 45,815 人/persons(4.4%)
福岡市/Fukuoka City 14,453 人/persons(1.4%)
資料:人口動態調査(2012 年・厚生労働省)*各都市住民基本台帳年齢別人口による Source: Ministry of Health, Labour and Welfare. Vital Statistics (2012).
基本情報/Quick Facts

9
総生産/Gross Production
日本/Japan 495.6 兆円/trillion YEN(100%)
≒5.6trillion dollars
九州/Kyushu Region 44.1 兆円/trillion YEN(8.9%)
≒500.4billion dollars
福岡県/Fukuoka Prefecture 18.0 兆円/trillion YEN(3.6%)
≒204.8billion dollars
福岡都市圏/Fukuoka Metropolitan 9.6 兆円/trillion YEN(1.9%)
≒109.0billion dollars
福岡市/Fukuoka City 6.6 兆円/trillion YEN(1.3%)
≒74.5billion dollars 世界/World 64.08 兆 US ドル/billion dollars(≒5,645 兆円) 東アジア・東南アジア /Eastern Asia, South-Eastern Asia 14.54 兆 US ドル/billion dollars(≒1,281 兆円)
資料:内閣府「県民経済計算」(2010 年度),福岡県市町村民経済計算(2010 年度)*国内総生産は全都道府県合計値, 世界・アジアの GDP…世界銀行「World DataBank」(名目・2010 年) *US ドルの円換算レートは、1 ドル=88.09 円(2010 年平均) Note: $1=88.09YEN (Average 2010). Source for Japan, Kyushu Region, Fukuoka Prefecture and Fukuoka City: Economic and Social Research Institute, Cabinet Office, Government of Japan. Prefectural Economic Calculation (2010 F.Y.); Fukuoka Prefecture. Municipal Economic Calculation (2010 F.Y.). Source for World and Asia: The World Bank. World DataBank (Nominal, 2010).
基本情報/Quick Facts

10
日本/Japan 輸出/Export 69.8 兆円/trillion YEN(100%) ≒715.2billion dollars 輸入/Import 81.2 兆円/trillion YEN(100%) ≒832.7billion dollars
九州/Kyushu Region 輸出/Export 5.6 兆円/trillion YEN(8.1%) ≒57.6billion dollars 輸入/Import 6.6 兆円/trillion YEN(8.1%) ≒67.8billion dollars
福岡県/Fukuoka Prefecture 輸出/Export 4.2 兆円/trillion YEN(6.1%) ≒43.3billion dollars 輸入/Import 2.7 兆円/trillion YEN(3.3%) ≒27.7billion dollars
福岡市/Fukuoka City 輸出/Export 2.3 兆円/trillion YEN(3.3%) ≒23.4billion dollars 輸入/Import 1.3 兆円/trillion YEN(1.6%) ≒13.7billion dollars
貿易額/Amount of Trade
資料:貿易統計(財務省・2013 年)*1 ドル 97.56 円 (2013 年平均)で計算 Note: US$1=97.56YEN (Average 2013). Source: Ministry of Finance Japan. Trade Statistics of Japan (2013).
基本情報/Quick Facts

11
製造業出荷額/ Value of Manufacturing Shipments
日本/Japan 285.0 兆円/trillion YEN(100%)
≒2.9trillion dollars
九州/Kyushu Region 21.2 兆円/trillion YEN(7.4%)
≒217.5billion dollars
福岡県/Fukuoka Prefecture 8.1 兆円/trillion YEN(2.9%)
≒83.3billion dollars
福岡都市圏/Fukuoka Metropolitan 1.7 兆円/trillion YEN(0.6%)
≒17.2billion dollars
福岡市/Fukuoka City 663 十億円/billion YEN(0.2%)
≒6.8billion dollars
資料:平成 24 年経済センサス活動調査(2012 年)*2011 年実績, 1 ドル 79.97 円(2011 年平均)で計算 Note: Calculated by US$1=79.97YEN (Average 2011). Results from 2011. Source: Statistics Bureau, Ministry of Internal Affairs and Communications. Economic Census for Business Activity (2012).
基本情報/Quick Facts
12
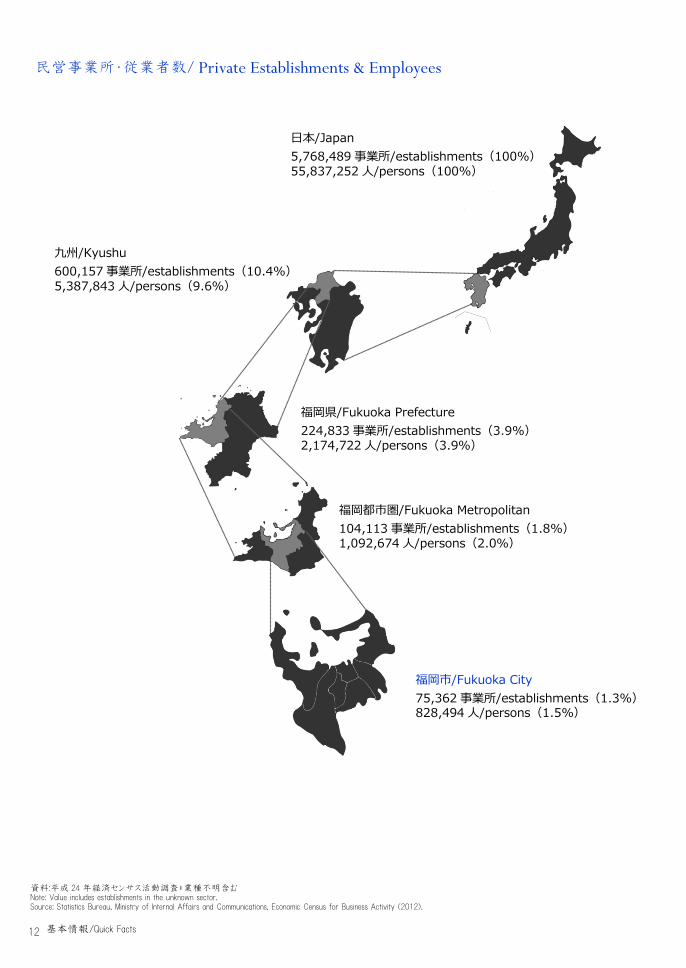
民営事業所・従業者数/ Private Establishments & Employees
日本/Japan 5,768,489 事業所/establishments(100%) 55,837,252 人/persons(100%)
九州/Kyushu 600,157 事業所/establishments(10.4%) 5,387,843 人/persons(9.6%)
福岡県/Fukuoka Prefecture 224,833 事業所/establishments(3.9%)2,174,722 人/persons(3.9%)
福岡都市圏/Fukuoka Metropolitan 104,113 事業所/establishments(1.8%)1,092,674 人/persons(2.0%)
福岡市/Fukuoka City 75,362 事業所/establishments(1.3%)828,494 人/persons(1.5%)
資料:平成 24 年経済センサス活動調査*業種不明含む Note: Value includes establishments in the unknown sector. Source: Statistics Bureau, Ministry of Internal Affairs and Communications. Economic Census for Business Activity (2012).
基本情報/Quick Facts

13
歳入・歳出/Revenue & Expenditure
日本/Japan 歳入/Revenue:107.8 兆円/trillion YEN
≒1.4trilion dollars 歳出/Expenditure:97.1 兆円/trillion YEN
≒1.2trillion dollars
九州/Kyushu 歳入/Revenue:5.6 兆円/trillion YEN ≒69.7billion dollars 歳出/Expenditure:5.4 兆円/trillion YEN ≒67.8billion dollars
福岡県/Fukuoka Prefecture 歳入/Revenue:1.7 兆円/trillion YEN ≒21.2billion dollars 歳出/Expenditure:1.6 兆円/trillion YEN ≒20.6billion dollars
福岡市/Fukuoka City 歳入/Revenue:764 十億円/billion YEN ≒9.6billion dollars 歳出/Expenditure:752 十億円/billion YEN ≒9.4billion dollars
資料:財務省、各県, 福岡市公表値*一般会計*1 ドル 79.80 円(2012 年平均)で計算 Note: General account. Calculated by US$1=79.80 (Average 2012). Sources: Ministry of Finance Japan; Prefectures; Fukuoka City.
基本情報/Quick Facts

14
CO2 排出量/CO2 Emission
日本/Japan
1,182,348 千 tCO2/k-tonnesCO2(100%)
九州/Kyushu 139,087 千 tCO2/k-tonnesCO2(11.8%)
福岡県/Fukuoka Prefecture 50,604 千 tCO2/k-tonnesCO2(4.3%)
福岡都市圏/Fukuoka Metropolitan 19,349 千 tCO2/k-tonnesCO2(1.6%)
福岡市 Fukuoka City 12,120千 tCO2/k-tonnesCO2(1.0%)
資料:部門別 CO2 排出量の現況推計(環境省・2011 年度) Source: Ministry of the Environment. Estimate of CO2 emissions (2011 F.Y.).
基本情報/Quick Facts
15
気候/Climate
7.5 7.8
12.3 14.7
20.3
23.7
30.0 30.0
25.2
20.7
13.4
8.16.6 7.4
10.4
15.119.4
23.027.2 28.1
24.4
19.213.8
8.9
1月/Jan.
2月/Feb.
3月/Mar.
4月/Apr.
5月/May
6月/Jun.
7月/Jul.
8月/Aug.
9月/Sep.
10月/Oct.
11月/Nov.
12月/Dec.
2013平年/Common year
(℃)
146.3 136.9
178.6
209.1
250.6
97.6
215.8246.2
209.0
172.2
112.1 104.8102.1121.0
149.8181.6 194.6 149.4 173.5
202.1
162.8
177.1
136.3116.7
1月/Jan.
2月/Feb.
3月/Mar.
4月/Apr.
5月/May
6月/Jun.
7月/Jul.
8月/Aug.
9月/Sep.
10月/Oct.
11月/Nov.
12月/Dec.
2,013平年/Common year
(時間/hrs)
57.5
81.5
56.5
108.0
37.0
268.5
134.0
501.5
133.0
227.5
119.577.068.0
71.5
112.5 116.6142.5
254.8
277.9
172.0
178.4
73.784.8
59.8
1月/Jan.
2月/Feb.
3月/Mar.
4月/Apr.
5月/May
6月/Jun.
7月/Jul.
8月/Aug.
9月/Sep.
10月/Oct.
11月/Nov.
12月/Dec.
2,013平年/Common year
(mm)
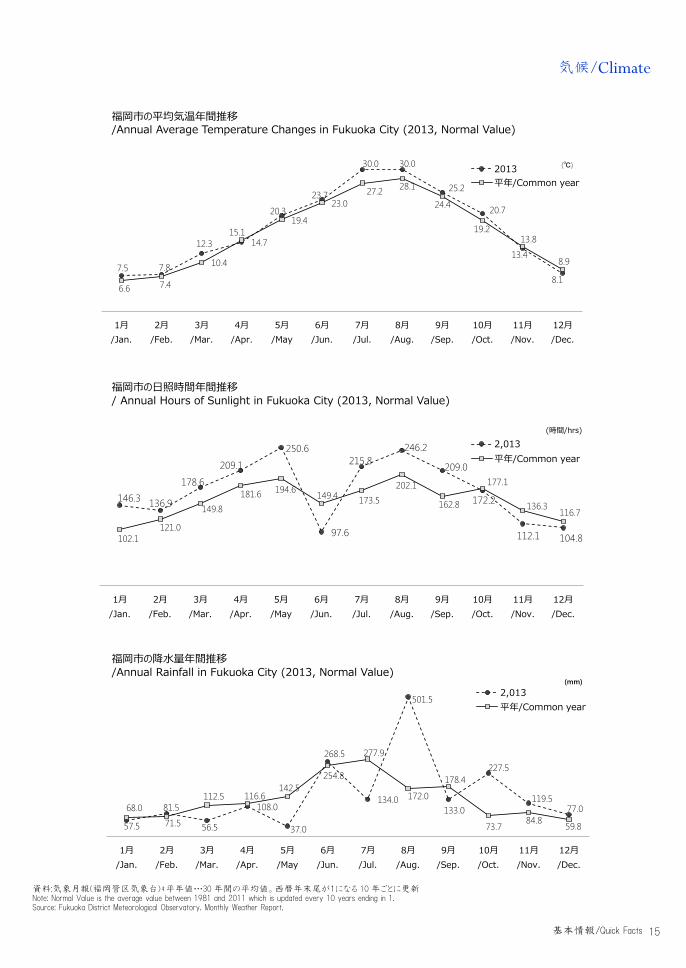
福岡市の平均気温年間推移 /Annual Average Temperature Changes in Fukuoka City (2013, Normal Value)
福岡市の日照時間年間推移 / Annual Hours of Sunlight in Fukuoka City (2013, Normal Value)
福岡市の降水量年間推移 /Annual Rainfall in Fukuoka City (2013, Normal Value)
資料:気象月報(福岡管区気象台)*平年値…30 年間の平均値。西暦年末尾が1になる 10 年ごとに更新 Note: Normal Value is the average value between 1981 and 2011 which is updated every 10 years ending in 1. Source: Fukuoka District Meteorological Observatory. Monthly Weather Report.
基本情報/Quick Facts
16
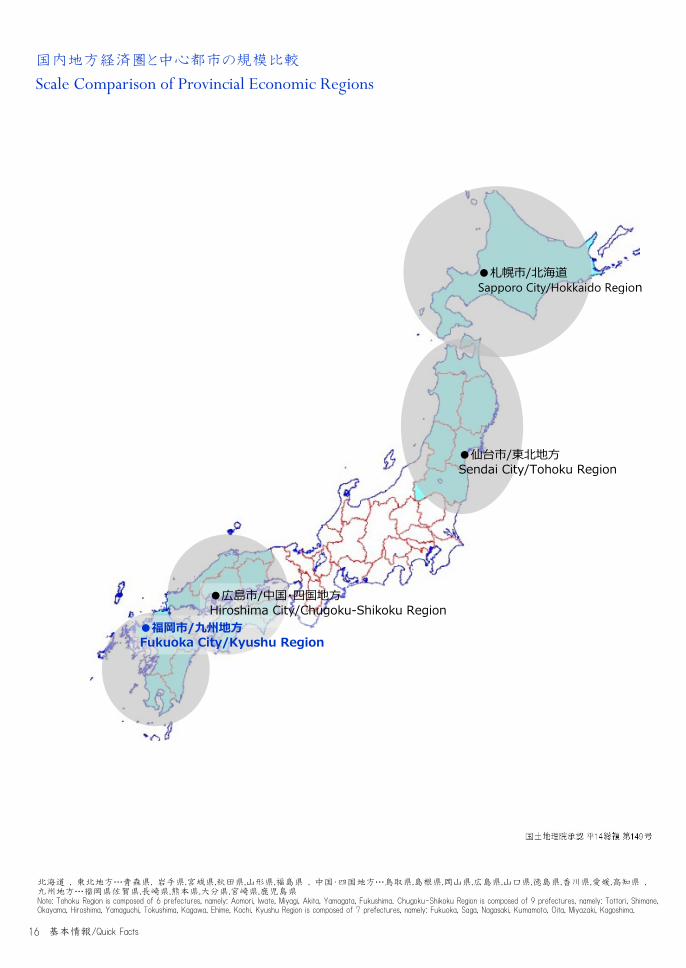
国内地方経済圏と中心都市の規模比較
Scale Comparison of Provincial Economic Regions
●札幌市/北海道 Sapporo City/Hokkaido Region
●広島市/中国・四国地方 Hiroshima City/Chugoku-Shikoku Region
●仙台市/東北地方 Sendai City/Tohoku Region
北海道 , 東北地方…青森県, 岩手県,宮城県,秋田県,山形県,福島県 , 中国・四国地方…鳥取県,島根県,岡山県,広島県,山口県,徳島県,香川県,愛媛,高知県 , 九州地方…福岡県佐賀県,長崎県,熊本県,大分県,宮崎県,鹿児島県 Note: Tohoku Region is composed of 6 prefectures, namely: Aomori, Iwate, Miyagi, Akita, Yamagata, Fukushima. Chugoku-Shikoku Region is composed of 9 prefectures, namely: Tottori, Shimane, Okayama, Hiroshima, Yamaguchi, Tokushima, Kagawa, Ehime, Kochi. Kyushu Region is composed of 7 prefectures, namely: Fukuoka, Saga, Nagasaki, Kumamoto, Oita, Miyazaki, Kagoshima.
●福岡市/九州地方 Fukuoka City/Kyushu Region
基本情報/Quick Facts
17
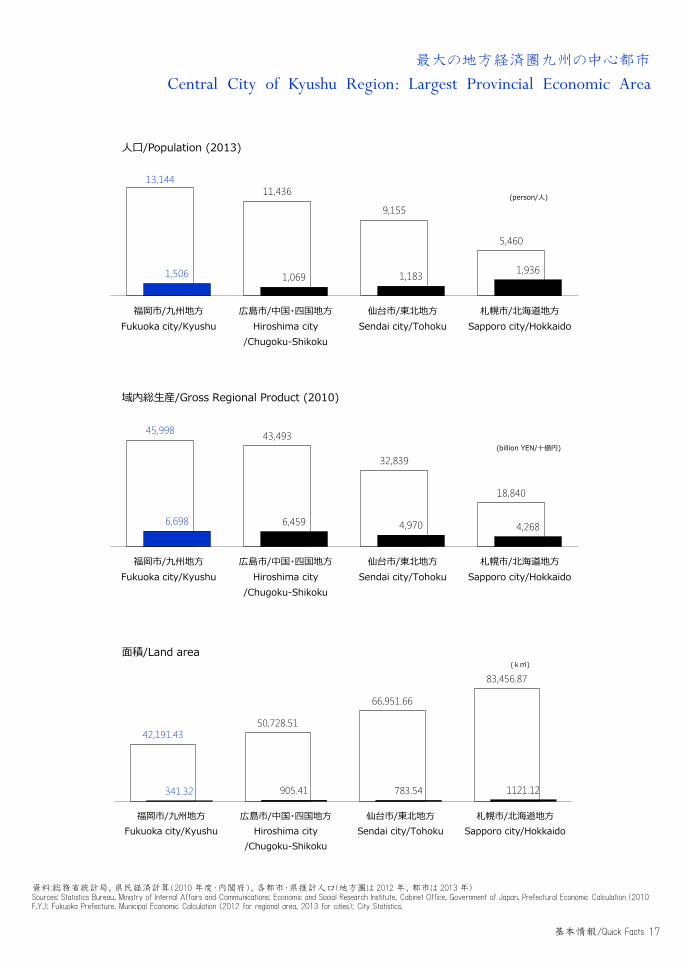
最大の地方経済圏九州の中心都市
Central City of Kyushu Region: Largest Provincial Economic Area
人口/Population (2013)
域内総生産/Gross Regional Product (2010)
13,14411,436
9,155
5,460
1,506 1,069 1,183 1,936
福岡市/九州地方Fukuoka city/Kyushu
広島市/中国・四国地方Hiroshima city
/Chugoku-Shikoku
仙台市/東北地方Sendai city/Tohoku
札幌市/北海道地方Sapporo city/Hokkaido
(person/人)
45,998 43,493
32,839
18,840
6,698 6,459 4,970 4,268
福岡市/九州地方Fukuoka city/Kyushu
広島市/中国・四国地方Hiroshima city
/Chugoku-Shikoku
仙台市/東北地方Sendai city/Tohoku
札幌市/北海道地方Sapporo city/Hokkaido
(billion YEN/十億円)
42,191.4350,728.51
66,951.66
83,456.87
341.32 905.41 783.54 1121.12
福岡市/九州地方Fukuoka city/Kyushu
広島市/中国・四国地方Hiroshima city
/Chugoku-Shikoku
仙台市/東北地方Sendai city/Tohoku
札幌市/北海道地方Sapporo city/Hokkaido
(k㎡)面積/Land area
資料:総務省統計局、県民経済計算(2010 年度・内閣府)、各都市・県推計人口(地方圏は 2012 年、都市は 2013 年) Sources: Statistics Bureau, Ministry of Internal Affairs and Communications; Economic and Social Research Institute, Cabinet Office, Government of Japan. Prefectural Economic Calculation (2010 F.Y.); Fukuoka Prefecture. Municipal Economic Calculation (2012 for regional area, 2013 for cities); City Statistics.
基本情報/Quick Facts

18
東アジアの中心・九州のコア
Core of Kyushu
九州は、オランダやデンマークと同じくらいの面積です。
福岡市の九州におけるシェアは、面積は 0.8%ですが、人口は 11.4%を占めます。 多くの
人々がコンパクトな福岡市の都市部に集まっています。 人口密度は 4,408 人/ k ㎡です。
福岡市は九州最大の都市圏で、西日本の主要な大都市圏の一つです。
北京
ソウル・インチョン
大阪 神戸 京都
東京 横浜
九州
大都市圏 人口
(千人)
広州 仏山
深圳 URBAN AREA POPULATION (thousands)
香港
上海
Fukuoka City is located in Kyushu Region in the western part of Japan. The area of Kyushu is as large as the Netherlands or Denmark. Fukuoka’s share of the Kyushu land area is only 0.8% but it is home to 11.4% of the regional population. Many people gather in its compact urban area. The population density in Fukuoka City is 4,397 persons/km2. The Fukuoka Metropolitan Area is the largest urban area in Kyushu Region.
九州人口:各県公表値(2013 年 10 月) Sources: Demographia. Demographia World Urban Areas 10th Annual Edition (March 2014); Prefecture statistics (October 2013) for population in Kyushu Region.
基本情報/Quick Facts
19
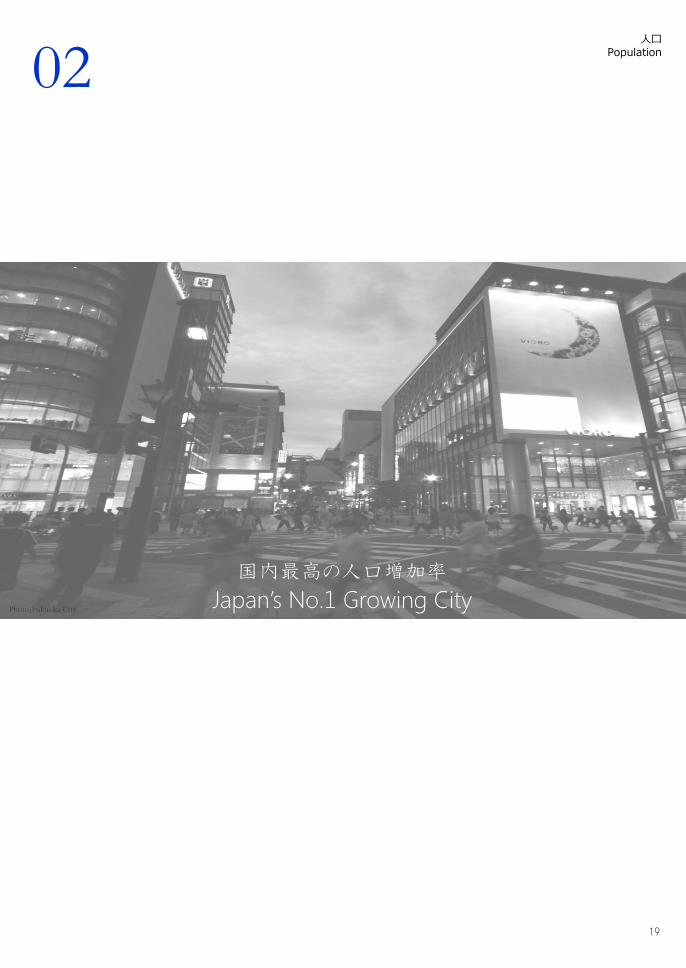
人口 Population
国内最高の人口増加率
Japan’s No.1 Growing City Photo;Fukuoka City
02
20
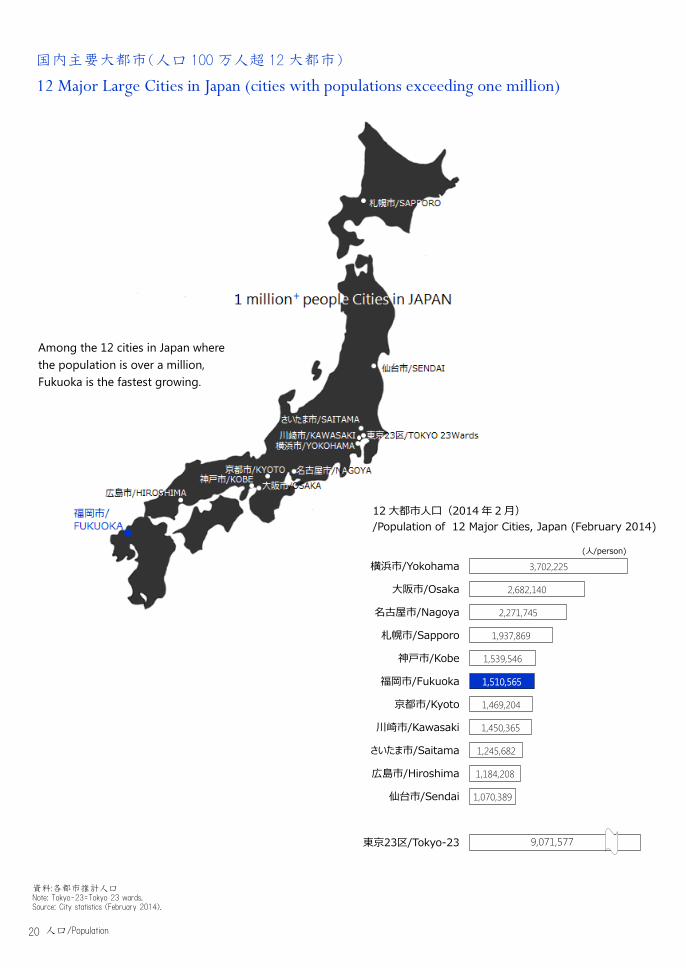
国内主要大都市(人口 100 万人超 12 大都市)
3,702,225
2,682,140
2,271,745
1,937,869
1,539,546
1,510,565
1,469,204
1,450,365
1,245,682
1,184,208
1,070,389
横浜市/Yokohama
大阪市/Osaka
名古屋市/Nagoya
札幌市/Sapporo
神戸市/Kobe
福岡市/Fukuoka
京都市/Kyoto
川崎市/Kawasaki
さいたま市/Saitama
広島市/Hiroshima
仙台市/Sendai
東京23区/Tokyo-23
(人/person)
9,071,577
12 Major Large Cities in Japan (cities with populations exceeding one million)
Among the 12 cities in Japan where the population is over a million, Fukuoka is the fastest growing.
12 大都市人口(2014 年 2 月) /Population of 12 Major Cities, Japan (February 2014)
資料:各都市推計人口 Note: Tokyo-23=Tokyo 23 wards. Source: City statistics (February 2014).
人口/Population

21
人口増加率国内第 1 位 際立つ高さ
Rapid Growth in a Short Period of Time
人口増加率 /Average Annual Growth Rate in Population, Major Cities (2010-2013)
人口増加数 /Growth in Population, Major Cities (2010-2013)
2.91
2.15
1.72
1.59
1.18
0.79
0.68
0.37
0.33
-0.22
-0.29
1.28
福岡市/Fukuoka
仙台市/Sendai
さいたま市/Saitama
川崎市/Kawasaki
札幌市/Sapporo
広島市/Hiroshima
大阪市/Osaka
横浜市/Yokohama
名古屋市/Nagoya
京都市/Kyoto
神戸市/Kobe
東京23区/Tokyo-23
(%)
42,570
22,684
22,644
22,525
21,002
18,173
13,778
9,313
7,486
-3,273
-4,449
114,208
福岡市/Fukuoka
川崎市/Kawasaki
札幌市/Sapporo
仙台市/Sendai
さいたま市/Saitama
大阪市/Osaka
横浜市/Yokohama
広島市/Hiroshima
名古屋市/Nagoya
京都市/Kyoto
神戸市/Kobe
東京23区/Tokyo-23
(人/persons)
資料:国勢調査(2010 年)、各都市推計人口(2013 年 10 月) Sources: Statistics Bureau, Ministry of Internal Affairs and Communications. National Statistics (2010); City Statistics (October 2013).
人口/Population
22
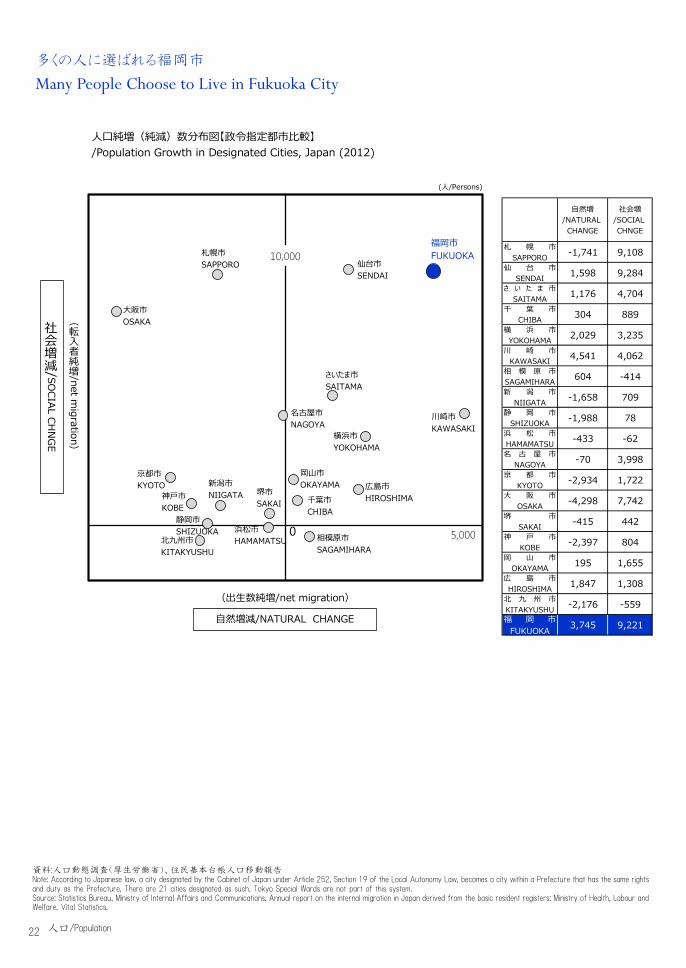
多くの人に選ばれる福岡市 Many People Choose to Live in Fukuoka City
10,000
(転入者純増/net m
igration
)
社会増減/ SO
CIAL CHN
GE
(出生数純増/net migration)
自然増減/NATURAL CHANGE
0 5,000
(人/Persons)
札幌市SAPPORO 仙台市
SENDAI
さいたま市SAITAMA
千葉市CHIBA
横浜市YOKOHAMA
川崎市KAWASAKI
相模原市SAGAMIHARA
新潟市NIIGATA
静岡市SHIZUOKA 浜松市
HAMAMATSU
名古屋市NAGOYA
京都市KYOTO
大阪市OSAKA
堺市SAKAI
神戸市KOBE
岡山市OKAYAMA 広島市
HIROSHIMA
北九州市KITAKYUSHU
福岡市FUKUOKA
人口純増(純減)数分布図【政令指定都市比較】 /Population Growth in Designated Cities, Japan (2012)
自然増/NATURAL CHANGE
社会増/SOCIAL CHNGE
札 幌 市SAPPORO -1,741 9,108
仙 台 市SENDAI 1,598 9,284
さ い た ま 市SAITAMA 1,176 4,704
千 葉 市CHIBA 304 889
横 浜 市YOKOHAMA 2,029 3,235
川 崎 市KAWASAKI 4,541 4,062
相 模 原 市SAGAMIHARA 604 -414新 潟 市
NIIGATA -1,658 709静 岡 市
SHIZUOKA -1,988 78浜 松 市HAMAMATSU -433 -62名 古 屋 市
NAGOYA -70 3,998京 都 市
KYOTO -2,934 1,722大 阪 市
OSAKA -4,298 7,742堺 市
SAKAI -415 442神 戸 市
KOBE -2,397 804岡 山 市
OKAYAMA 195 1,655広 島 市HIROSHIMA 1,847 1,308
北 九 州 市KITAKYUSHU -2,176 -559福 岡 市
FUKUOKA 3,745 9,221
資料:人口動態調査(厚生労働省)、住民基本台帳人口移動報告 Note: According to Japanese law, a city designated by the Cabinet of Japan under Article 252, Section 19 of the Local Autonomy Law, becomes a city within a Prefecture that has the same rights and duty as the Prefecture. There are 21 cities designated as such. Tokyo Special Wards are not part of this system. Source: Statistics Bureau, Ministry of Internal Affairs and Communications. Annual report on the internal migration in Japan derived from the basic resident registers; Ministry of Health, Labour and Welfare. Vital Statistics.
人口/Population
23
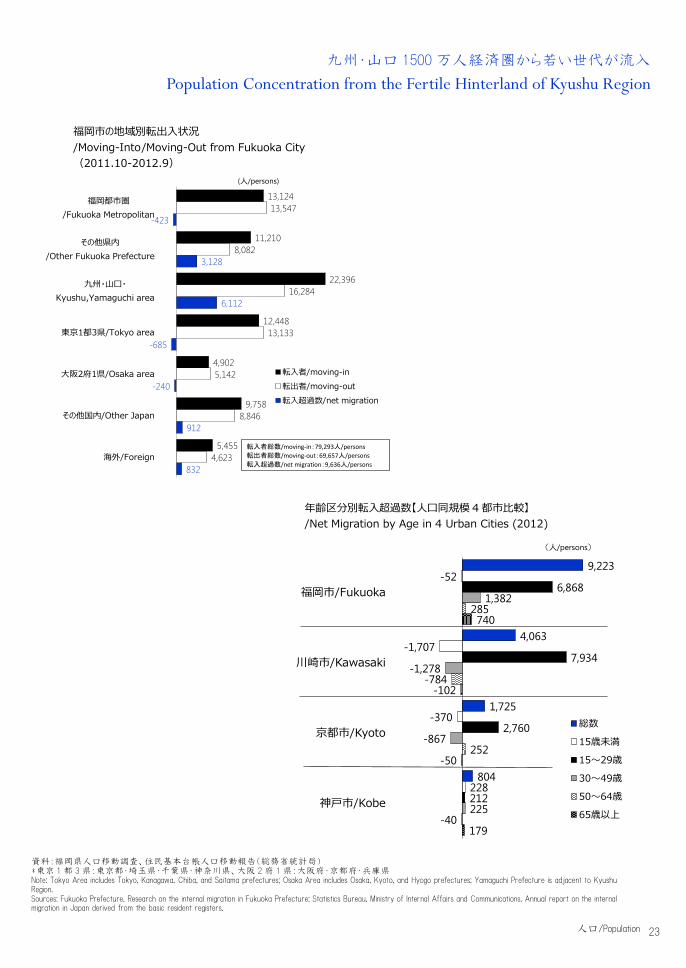
九州・山口 1500 万人経済圏から若い世代が流入
Population Concentration from the Fertile Hinterland of Kyushu Region
9,223
4,063
1,725
804
-52
-1,707
-370
228
6,868
7,934
2,760
212
1,382
-1,278
-867
225
285
-784
252
-40
740
-102
-50
179
福岡市/Fukuoka
川崎市/Kawasaki
京都市/Kyoto
神戸市/Kobe
総数
15歳未満
15~29歳
30~49歳
50~64歳
65歳以上
(人/persons)
13,124
11,210
22,396
12,448
4,902
9,758
5,455
13,547
8,082
16,284
13,133
5,142
8,846
4,623
-423
3,128
6,112
-685
-240
912
832
福岡都市圏/Fukuoka Metropolitan
その他県内/Other Fukuoka Prefecture
九州・山口・Kyushu,Yamaguchi area
東京1都3県/Tokyo area
大阪2府1県/Osaka area
その他国内/Other Japan
海外/Foreign
転入者/moving-in転出者/moving-out転入超過数/net migration
転入者総数/moving-in:79,293人/persons転出者総数/moving-out:69,657人/persons転入超過数/net migration:9,636人/persons
(人/persons)
福岡市の地域別転出入状況 /Moving-Into/Moving-Out from Fukuoka City (2011.10-2012.9)
年齢区分別転入超過数【人口同規模 4 都市比較】 /Net Migration by Age in 4 Urban Cities (2012)
資料:福岡県人口移動調査、住民基本台帳人口移動報告(総務省統計局) *東京 1 都 3 県:東京都・埼玉県・千葉県・神奈川県、大阪 2 府 1 県:大阪府・京都府・兵庫県 Note: Tokyo Area includes Tokyo, Kanagawa, Chiba, and Saitama prefectures; Osaka Area includes Osaka, Kyoto, and Hyogo prefectures; Yamaguchi Prefecture is adjacent to Kyushu Region. Sources: Fukuoka Prefecture. Research on the internal migration in Fukuoka Prefecture; Statistics Bureau, Ministry of Internal Affairs and Communications. Annual report on the internal migration in Japan derived from the basic resident registers.
人口/Population
24
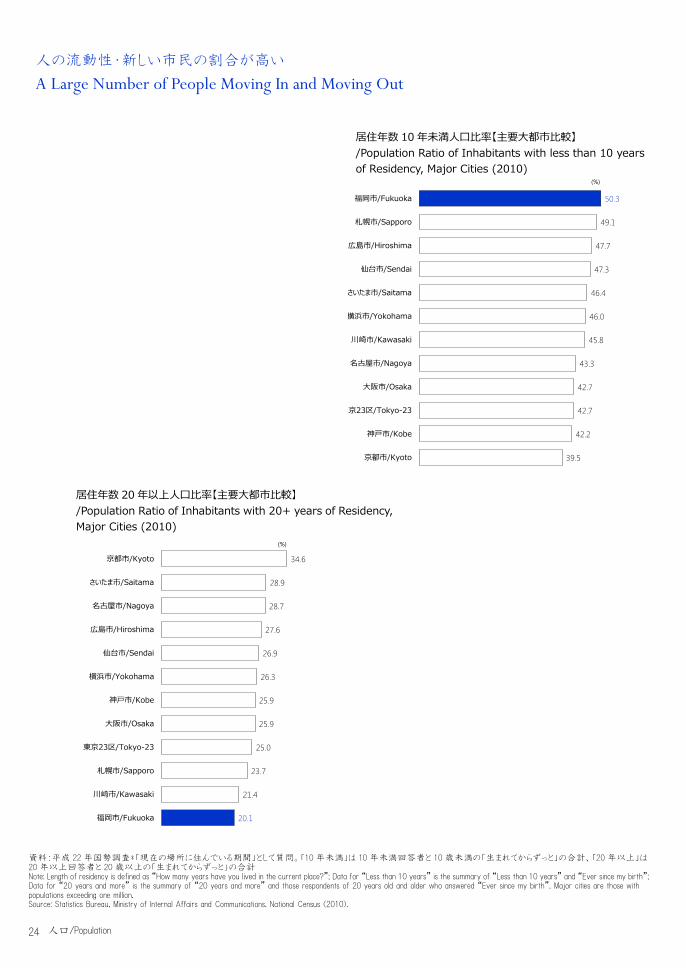
人の流動性・新しい市民の割合が高い
A Large Number of People Moving In and Moving Out
50.3
49.1
47.7
47.3
46.4
46.0
45.8
43.3
42.7
42.7
42.2
39.5
福岡市/Fukuoka
札幌市/Sapporo
広島市/Hiroshima
仙台市/Sendai
さいたま市/Saitama
横浜市/Yokohama
川崎市/Kawasaki
名古屋市/Nagoya
大阪市/Osaka
東京23区/Tokyo-23
神戸市/Kobe
京都市/Kyoto
(%)
34.6
28.9
28.7
27.6
26.9
26.3
25.9
25.9
25.0
23.7
21.4
20.1
京都市/Kyoto
さいたま市/Saitama
名古屋市/Nagoya
広島市/Hiroshima
仙台市/Sendai
横浜市/Yokohama
神戸市/Kobe
大阪市/Osaka
東京23区/Tokyo-23
札幌市/Sapporo
川崎市/Kawasaki
福岡市/Fukuoka
(%)
居住年数 10 年未満人口比率【主要大都市比較】 /Population Ratio of Inhabitants with less than 10 years of Residency, Major Cities (2010)
居住年数 20 年以上人口比率【主要大都市比較】 /Population Ratio of Inhabitants with 20+ years of Residency, Major Cities (2010)
資料:平成 22 年国勢調査*「現在の場所に住んでいる期間」として質問。「10 年未満」は 10 年未満回答者と 10 歳未満の「生まれてからずっと」の合計、「20 年以上」は20 年以上回答者と 20 歳以上の「生まれてからずっと」の合計 Note: Length of residency is defined as “How many years have you lived in the current place?”; Data for “Less than 10 years” is the summary of “Less than 10 years” and “Ever since my birth”; Data for “20 years and more” is the summary of “20 years and more” and those respondents of 20 years old and older who answered “Ever since my birth”. Major cities are those with populations exceeding one million. Source: Statistics Bureau, Ministry of Internal Affairs and Communications. National Census (2010).
人口/Population
25
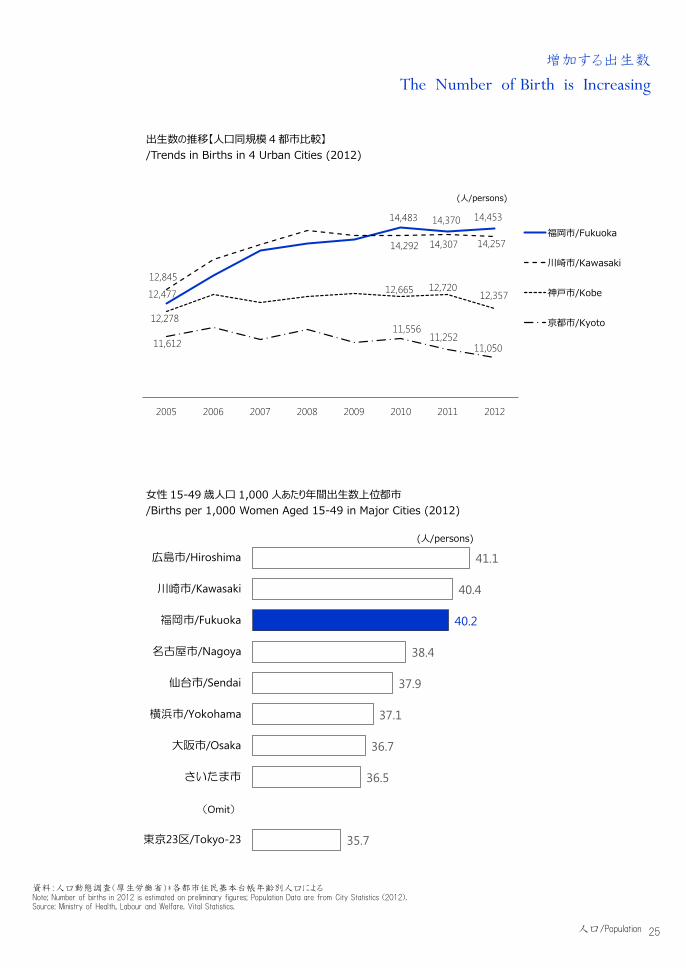
増加する出生数
The Number of Birth is Increasing
出生数の推移【人口同規模 4 都市比較】 /Trends in Births in 4 Urban Cities (2012)
41.1
40.4
40.2
38.4
37.9
37.1
36.7
36.5
35.7
広島市/Hiroshima
川崎市/Kawasaki
福岡市/Fukuoka
名古屋市/Nagoya
仙台市/Sendai
横浜市/Yokohama
大阪市/Osaka
さいたま市
東京23区/Tokyo-23
(人/persons)
(Omit)
12,477
14,483 14,370 14,453
12,845
14,292 14,307 14,257
12,278
12,665 12,72012,357
11,61211,556
11,25211,050
2005 2006 2007 2008 2009 2010 2011 2012
福岡市/Fukuoka
川崎市/Kawasaki
神戸市/Kobe
京都市/Kyoto
(人/persons)
女性 15-49 歳人口 1,000 人あたり年間出生数上位都市 /Births per 1,000 Women Aged 15-49 in Major Cities (2012)
資料:人口動態調査(厚生労働省)*各都市住民基本台帳年齢別人口による Note; Number of births in 2012 is estimated on preliminary figures; Population Data are from City Statistics (2012). Source: Ministry of Health, Labour and Welfare. Vital Statistics.
人口/Population

26
今後 20 年は人口増加が続く稀有な都市 Projected Growth in Population over the Next 20 Years
<15 yo 176
15-64 yo 975
65- yo454
1,401 1,4641,525 1,568 1,592 1,604 1,606
Fukuoka CITY, 114.6
Fukuoka METRO, 108.7
Fukuoka PREF, 92.1
Kyushu, 83.3
Tokyo, 105.0
Japan, 64.2
Korea, 111.5China, 109.9
100
World, 134.2
2005 2010 2015 2020 2025 2030 2035
実績/Actuals 将来推計/Projection
(千人/thousand persons)
福岡市の将来推計人口と人口の伸び比較 /Population Projections for Fukuoka City & Population Growth Comparison with Selected Cities and Countries
資料:国勢調査、将来推計人口(福岡市)*人口の伸びは 2005 年を 100 とした数値 *九州及び福岡県推計は九州経済調査協会、都市圏推計は九州経済調査協会予測と福岡市推計と合算、東京 23 区は東京都推計、日本推計は国立社会保障・人口問題研究所、世界及び各国推計は国際連合 *Population growth rate is based on the amount in 2005 set as 100; Data for Kyushu and Fukuoka Prefecture are estimated data from Kyushu Economic Research Center; Data for Fukuoka Metropolitan Area are added data of projected data from Kyushu Economic Research Center and estimated data from Fukuoka city; Data for Tokyo 23 wards are estimated data from Tokyo Metropolitan; Data for Japan are from National Institute of Population and Social Security Research; Data for World and other countries are from estimated data from the United Nations. World Population Prospects. The 2012 Revision; Sources: United Nations; Statistics Bureau, Ministry of Internal Affairs and Communications. National Census; Fukuoka City. Population Forecast.
人口/Population

27
経済活動 Economic Engine
高まる地域経済の拠点性
Engine of the Regional Economy
03

28
福岡市は、今後 20 年は人口増加が続く見通しであり、全国的にみても人口の集中が顕著です。
都市が世界経済を牽引する中、先進国では例外的に首都圏への一極集中が依然として続いている
日本では、経済のしなやかな強さ(レジリアンス)を高めていくために、それぞれの都市圏が創意工夫により
自律的な経済成長をし、世界の中で存在感を高めていく必要があります。そして、その拠点となる都市にお
いては、高いハブ機能、司令塔機能を持って、周辺を牽引する役割を担っていくことが求められます。
九州は、他の地方経済圏と比較すると、経済の規模や産業の集積、多様性は優位性を持っていま
す。これらの経済活動や基盤があればこそ、福岡市のサービス業を中心とした経済活動が盛んになってい
るとみることもできます。
今後も、九州経済圏の発展とともに、その拠点都市として、世界の中での存在感を高め、人や投資を
集める求心力を発揮していくことが期待されます。
福岡市は、事業所数も増加傾向にあります。増え続ける市民らを対象とした商業や飲食サービスなどが
盛んな都市となっていますが、特に、近年は商業や飲食以外の、高い付加価値を生み出すサービス業が
増加しています。
福岡市に限らず、全国的に中小企業が地域の経済を支えていますが、福岡市は、大企業の支社や
支店も多く、雇用面で大きく貢献しているほか、九州における司令塔機能や、アジアへの玄関口としての拠
点機能など、福岡市に事業所を置く優位性が、多くの企業等に認識されているものと考えられます。
The population of Fukuoka City is projected to grow for the next 20 years, which is nationally remarkable as the total population in Japan will greatly decline during that period. However, although total population will decline in the Kyushu Region as a whole, the concentration in Fukuoka is expected to accelerate. While cities are driving the world economy, monopolar concentration into the capital city still continues in Japan, exceptionally among the developed countries. In order to enhance the sustainability and resilience of the national economy, each metropolitan area in Japan needs to drive economic growth autonomously in original and creative ways, and as a result position itself in the global economy. Also, the core city of the metropolitan area is expected to undertake the role of leading the surrounding area with a strong hub function and a control function. Compared with the Hokkaido Region, which is a provincial economic area located in the north of Japan, Kyushu has a larger economy, a higher accumulation of industry, and a more diversified industrial portfolio. With these economic activities and foundation, Fukuoka’s economic activity majoring in the service industry seems to be prospering. Fukuoka is expected to attract more people and investments by raising its presence in the world as a core city of the Kyushu economic region. Fukuoka is thus nationally outstanding, and the number of businesses has steadily increased. Businesses that are targeting the increasing number of citizens such as retail and food services are flourishing, and services that create higher added values have also increased recently. Small and Medium Enterprises (SMEs) support the local economy in Fukuoka as well as in most cities of Japan. Besides the SMEs, many large enterprises have branch offices and branch stores in Fukuoka, which greatly contribute to the city in terms of employment. Many enterprises also recognize the advantage of having offices in Fukuoka as a result of its function as a regional headquarters in Kyushu, as well as being an operational base in Asia.
経済活動/Economic Engine

29
都市圏で約 9.4 兆円の総生産
The Fukuoka Metropolitan Area Produces Approximately 9.4 Trillion YEN of Gross Regional Product
福岡市/Fukuoka City
6,698
福岡都市圏Fukuoka Metropolitan
8,9359,581 9,656 9,516 9,288 9,401
2001 2002 2003 2004 2005 2006 2007 2008 2009 2010
(billion YEN/十億円)
500-シカゴ/Chicagoロンドン/Londonパリ/Paris
東京/Tokyoニューヨーク/New Yorkロスアンゼルス/Los Angeles
300-<500
ワシントン/Washington DCボストン/Bostonダラス・フォートワース/Dallas/Fort Worthアトランタ/Atlantaサンフランシスコ・オークランド/San Francisco/Oakland
フィラデルフィア/Philadelphia香港/Hong Kong
大阪・神戸/Osaka-Kobeメキシコ・シティ/Mexico Cityサンパウロ/Sao Pauloブエノスアイレス/Buenos Airesモスクワ/Moscow
<300
ヒューストン/Houstonデトロイト/Detroitシアトル/Seattleシンガポール/Singaporeシドニー/Sydney福岡都市圏/Fukuoka Metropolitan Area
マイアミ/Miamiソウル/Seoulトロント/Torontoマドリッド/Madrid福岡県/Fukuoka Prefecture
上海/Shanghaiムンバイ(ボンベイ)/Mumbai (Bombay)リオデジャネイロ/Rio de Janeiro
2-<5 5-<10 10-
域内総生産(2008年購買力平価)/Estimated GRP in 2008
($bn at PPPs)
人口(百万円)/Population (millions)
福岡市・福岡都市圏の域内総生産額推移 /Real Gross Regional Product in Fukuoka City and the Fukuoka Metropolitan Area
世界の主要都市・地域の域内総生産と人口規模比較 /World Major Cities GRP & Population Comparison (2008)
GRP=Gross Regional Product.(域内総生産) 資料:市町村民経済計算(福岡県)、福岡市経済計算(2010 年)*都市圏値は名目値からの推計 *域内総生産世界比較は Global city GDP rankings 2008-2025(Pricewaterhouse Coopers*都市圏域単位の区分)に九州、福岡県の 2008 年データを加えて比較を試みたもの。県民経済計算(内閣府・2008 年名目値)、2008 年の購買力平価 1 ドル 116.8 円で計算 *購買力平価:国家間の物価水準の差を排し、異なる通貨の購買力を等しくするもの。短期的なレート変動の影響を受けず客観的に比較できる Note: Data for Fukuoka Metropolitan Area is estimated from nominal amount 1 US dollar=100 Yen. Sources: Fukuoka Prefecture. Economic Calculation; Fukuoka City. Economic Calculation (2010). Note: Data of Kyushu and Fukuoka Prefecture (2008) are added to data from PricewaterhouseCoopers, “Global city GDP rankings 2008-2025” and compared. 1 Yen=116.8458138 US dollars by OECD Purchasing Power Parities for GDP (2008). As a reference, the ratio of GRP: Population for Fukuoka is 58:1.43, and that for the Fukuoka Metropolitan Area is 79:2.37. PPPs=Purchasing Power Parities. Sources: PricewaterhouseCoopers. Global city GDP rankings 2008-2025; UK Economic Outlook (November 2009); Cabinet Office, Government of Japan. Economic Calculation (Nominal 2008).
経済活動/Economic Engine
30
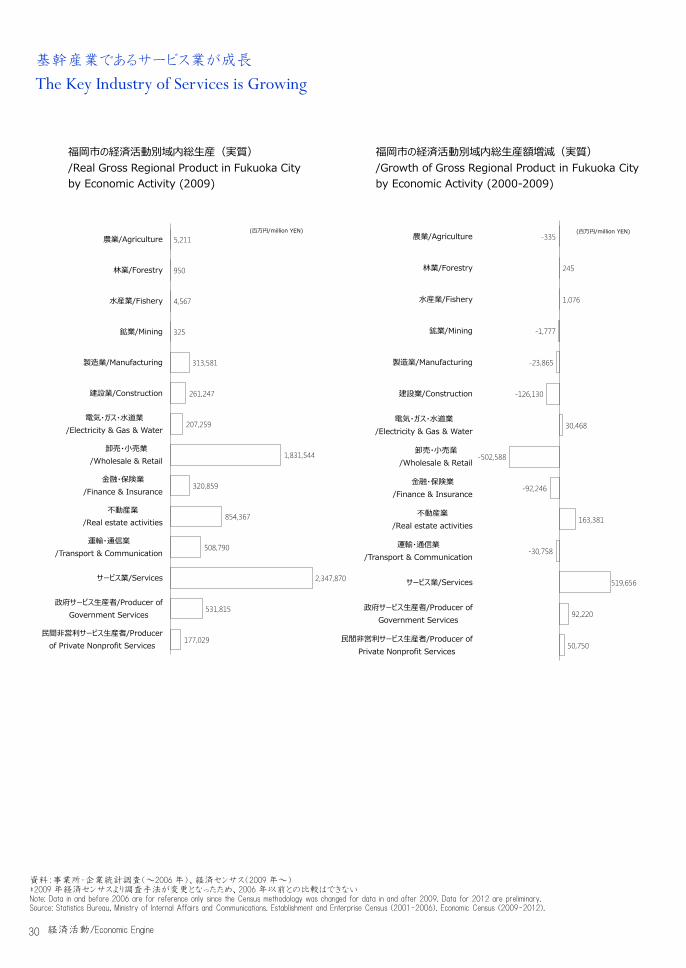
基幹産業であるサービス業が成長 The Key Industry of Services is Growing
福岡市の経済活動別域内総生産(実質) /Real Gross Regional Product in Fukuoka City by Economic Activity (2009)
福岡市の経済活動別域内総生産額増減(実質) /Growth of Gross Regional Product in Fukuoka City by Economic Activity (2000-2009)
資料:事業所・企業統計調査(~2006 年)、経済センサス(2009 年~) *2009 年経済センサスより調査手法が変更となったため、2006 年以前との比較はできない Note: Data in and before 2006 are for reference only since the Census methodology was changed for data in and after 2009. Data for 2012 are preliminary. Source: Statistics Bureau, Ministry of Internal Affairs and Communications. Establishment and Enterprise Census (2001-2006). Economic Census (2009-2012).
5,211
950
4,567
325
313,581
261,247
207,259
1,831,544
320,859
854,367
508,790
2,347,870
531,815
177,029
農業/Agriculture
林業/Forestry
水産業/Fishery
鉱業/Mining
製造業/Manufacturing
建設業/Construction
電気・ガス・水道業/Electricity & Gas & Water
卸売・小売業/Wholesale & Retail
金融・保険業/Finance & Insurance
不動産業/Real estate activities
運輸・通信業/Transport & Communication
サービス業/Services
政府サービス生産者/Producer of Government Services
民間非営利サービス生産者/Producer of Private Nonprofit Services
(百万円/million YEN)-335
245
1,076
-1,777
-23,865
-126,130
30,468
-502,588
-92,246
163,381
-30,758
519,656
92,220
50,750
農業/Agriculture
林業/Forestry
水産業/Fishery
鉱業/Mining
製造業/Manufacturing
建設業/Construction
電気・ガス・水道業/Electricity & Gas & Water
卸売・小売業/Wholesale & Retail
金融・保険業/Finance & Insurance
不動産業/Real estate activities
運輸・通信業/Transport & Communication
サービス業/Services
政府サービス生産者/Producer of Government Services
民間非営利サービス生産者/Producer of Private Nonprofit Services
(百万円/million YEN)
経済活動/Economic Engine
31
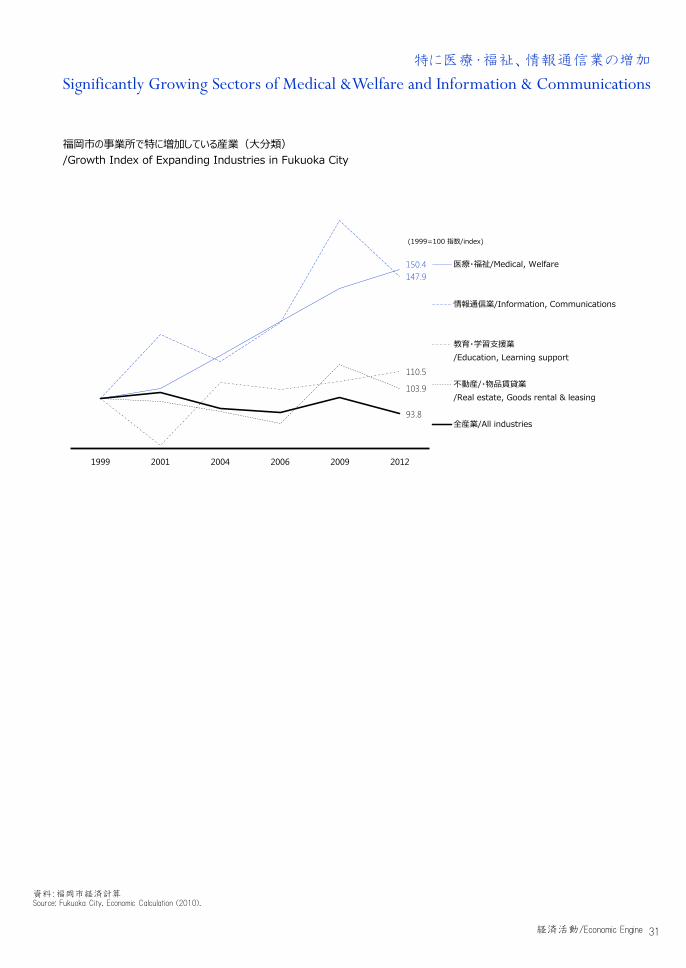
特に医療・福祉、情報通信業の増加
Significantly Growing Sectors of Medical &Welfare and Information & Communications
150.4147.9
110.5
103.9
93.8
1999 2001 2004 2006 2009 2012
医療・福祉/Medical, Welfare
情報通信業/Information, Communications
教育・学習支援業/Education, Learning support
不動産/・物品賃貸業/Real estate, Goods rental & leasing
全産業/All industries
(1999=100 指数/index)
福岡市の事業所で特に増加している産業(大分類) /Growth Index of Expanding Industries in Fukuoka City
資料:福岡市経済計算 Source: Fukuoka City. Economic Calculation (2010).
経済活動/Economic Engine
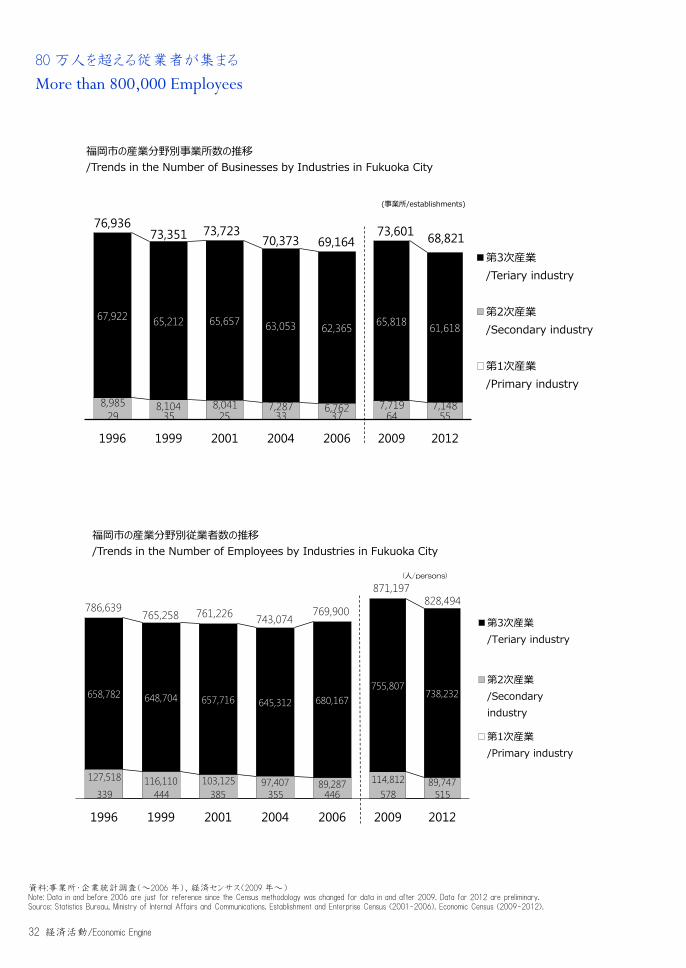
32
More than 800,000 Employees 80 万人を超える従業者が集まる
339 444 385 355 446
127,518 116,110 103,125 97,407 89,287
658,782 648,704 657,716 645,312 680,167
786,639765,258 761,226 743,074
769,900
1996 1999 2001 2004 2006
578 515114,812 89,747
755,807738,232
871,197828,494
2009 2012
第3次産業/Teriary industry
第2次産業/Secondary industry
第1次産業/Primary industry
(人/persons)
29 35 25 33 378,985 8,104 8,041 7,287 6,762
67,922 65,212 65,657 63,053 62,365
76,93673,351 73,723
70,373 69,164
1996 1999 2001 2004 2006
64 557,719 7,148
65,818 61,618
73,601 68,821
2009 2012
第3次産業/Teriary industry
第2次産業/Secondary industry
第1次産業/Primary industry
(事業所/establishments)
福岡市の産業分野別事業所数の推移 /Trends in the Number of Businesses by Industries in Fukuoka City
福岡市の産業分野別従業者数の推移 /Trends in the Number of Employees by Industries in Fukuoka City
資料:事業所・企業統計調査(~2006 年)、経済センサス(2009 年~) Note: Data in and before 2006 are just for reference since the Census methodology was changed for data in and after 2009. Data for 2012 are preliminary. Source: Statistics Bureau, Ministry of Internal Affairs and Communications. Establishment and Enterprise Census (2001-2006). Economic Census (2009-2012).
経済活動/Economic Engine
33
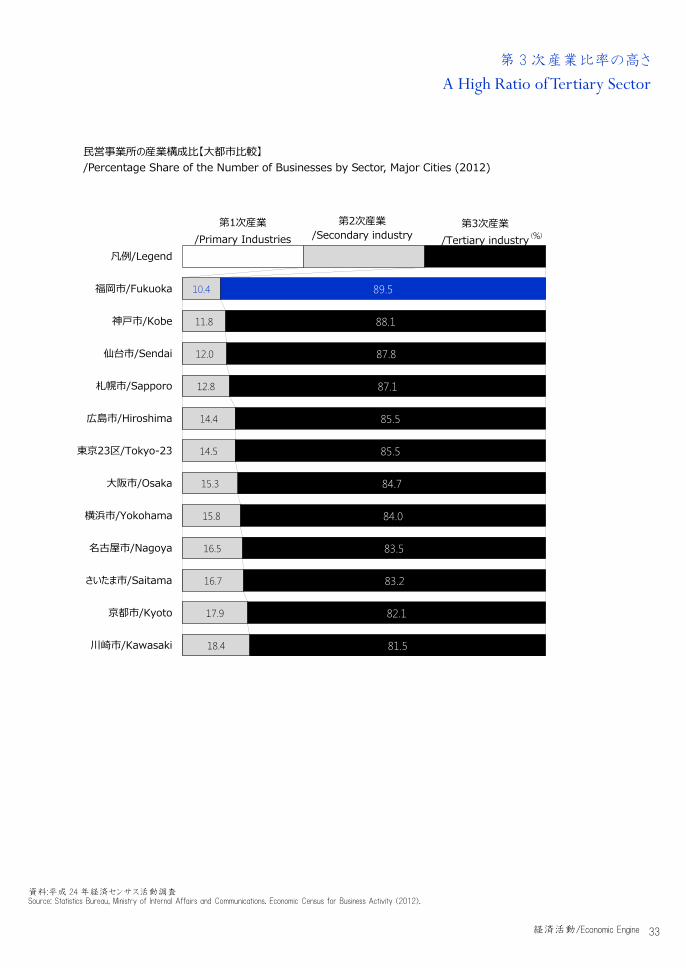
A High Ratio of Tertiary Sector 第 3 次産業比率の高さ
第1次産業/Primary Industries
10.4
11.8
12.0
12.8
14.4
14.5
15.3
15.8
16.5
16.7
17.9
18.4
第3次産業/Tertiary industry
89.5
88.1
87.8
87.1
85.5
85.5
84.7
84.0
83.5
83.2
82.1
81.5
凡例/Legend
福岡市/Fukuoka
神戸市/Kobe
仙台市/Sendai
札幌市/Sapporo
広島市/Hiroshima
東京23区/Tokyo-23
大阪市/Osaka
横浜市/Yokohama
名古屋市/Nagoya
さいたま市/Saitama
京都市/Kyoto
川崎市/Kawasaki
(%)
第2次産業/Secondary industry
民営事業所の産業構成比【大都市比較】 /Percentage Share of the Number of Businesses by Sector, Major Cities (2012)
資料:平成 24 年経済センサス活動調査 Source: Statistics Bureau, Ministry of Internal Affairs and Communications. Economic Census for Business Activity (2012).
経済活動/Economic Engine

34
385
63,320
39,805
79,580
229,251
83,307
265,578
355
57,88539,522
77,563
210,872
79,551
277,326
446
89,287
34,471
86,380
208,937
79,912
299,467
578
77,531
37,281
102,732
211,268
96,306
345,501
515
54,65835,089
101,687
196,895
90,451
349,199
農林漁業/Agriculture, Forestry &
Fisheries
建設業/Construction
製造業・鉱業/Manufacturing, Mining
運輸通信業/Transport,
Communications
卸売・小売業/Commerce
宿泊,飲食サービス業/Hotels, Restaurants
services
その他サービス業/Miscellaneous services
2001 2004 2006 2009 2012
(人/persons)
サービス業の多様化 Diversified Services
26
5,232
2,686 3,178
24,257
11,899
26,445
33
4,871
2,416 2,964
22,372
11,512
26,205
37
4,617
2,1453,120
22,109
10,798
26,338
64
5,312
2,4073,707
21,933
10,990
29,188
55
4,967
2,1813,362
20,380
10,070
27,806
農林漁業/Agriculture, Forestry &
Fisheries
建設業/Construction
製造業・鉱業/Manufacturing, Mining
運輸通信業/Transport,
Communications
卸売・小売業/Commerce
宿泊,飲食サービス業/Hotels, Restaurants
services
その他サービス業/Miscellaneous services
2001 2004 2006 2009 2012
(事業所/establishments)
福岡市の産業分野別事業所数の推移 /Trends in the Number of Businesses by Industry in Fukuoka City
福岡市の産業分野別従業者数の推移 /Trends in the Number of Employees by Industry in Fukuoka City
資料:事業所・企業統計調査(~2006 年)、経済センサス(2009 年~) Note: Data in and before 2006 are just for reference since the Census methodology was changed for data in and after 2009. Data for 2012 are preliminary. Source: Statistics Bureau, Ministry of Internal Affairs and Communications. Establishment and Enterprise Census (2001-2006). Economic Census (2009-2012).
経済活動/Economic Engine
35
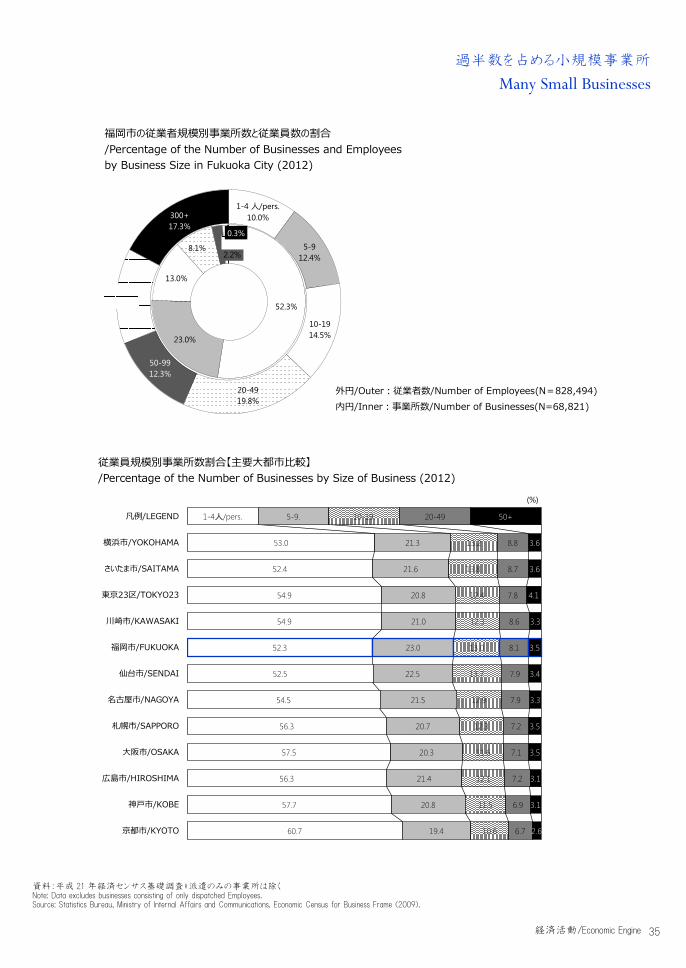
過半数を占める小規模事業所 Many Small Businesses
外円/Outer:従業者数/Number of Employees(N=828,494) 内円/Inner:事業所数/Number of Businesses(N=68,821)
1-4 人/pers.10.0%
5-912.4%
10-1914.5%
20-4919.8%
50-9912.3%
100-29913.8%
300+17.3%
52.3%
23.0%
13.0%
8.1%2.2%1.0%0.3%
1-4人/pers.
53.0
52.4
54.9
54.9
52.3
52.5
54.5
56.3
57.5
56.3
57.7
60.7
5-9.
21.3
21.6
20.8
21.0
23.0
22.5
21.5
20.7
20.3
21.4
20.8
19.4
10-19.
13.2
13.8
12.4
12.3
13.0
13.7
12.9
12.3
11.6
12.1
11.5
10.6
20-49
8.8
8.7
7.8
8.6
8.1
7.9
7.9
7.2
7.1
7.2
6.9
6.7
50+
3.6
3.6
4.1
3.3
3.5
3.4
3.3
3.5
3.5
3.1
3.1
2.6
凡例/LEGEND
横浜市/YOKOHAMA
さいたま市/SAITAMA
東京23区/TOKYO23
川崎市/KAWASAKI
福岡市/FUKUOKA
仙台市/SENDAI
名古屋市/NAGOYA
札幌市/SAPPORO
大阪市/OSAKA
広島市/HIROSHIMA
神戸市/KOBE
京都市/KYOTO
(%)
福岡市の従業者規模別事業所数と従業員数の割合 /Percentage of the Number of Businesses and Employees by Business Size in Fukuoka City (2012)
従業員規模別事業所数割合【主要大都市比較】 /Percentage of the Number of Businesses by Size of Business (2012)
資料:平成 21 年経済センサス基礎調査*派遣のみの事業所は除く Note: Data excludes businesses consisting of only dispatched Employees. Source: Statistics Bureau, Ministry of Internal Affairs and Communications. Economic Census for Business Frame (2009).
経済活動/Economic Engine
36
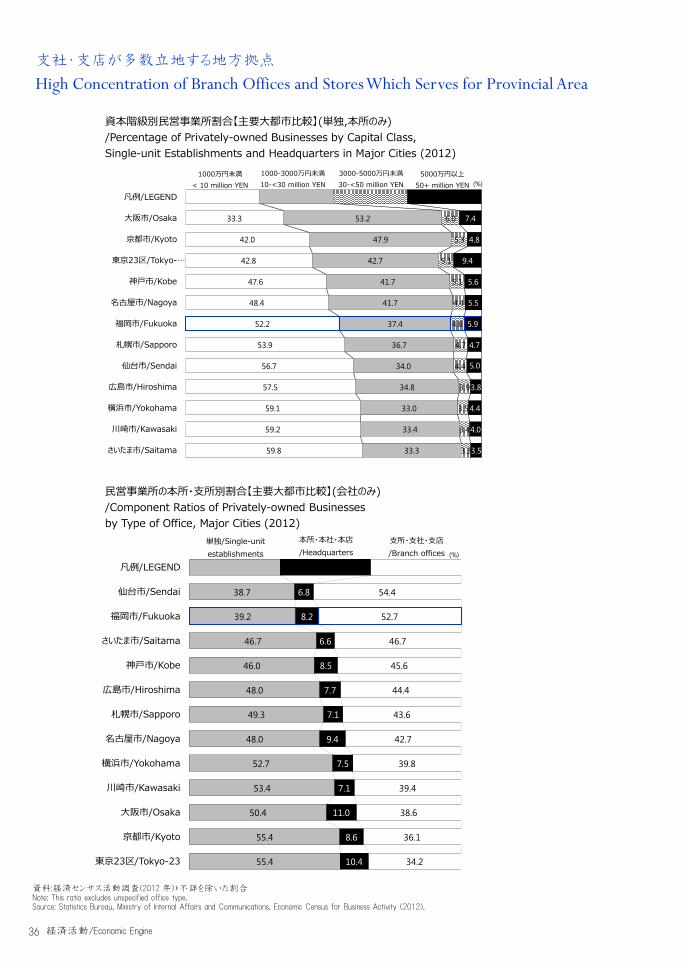
支社・支店が多数立地する地方拠点
High Concentration of Branch Offices and Stores Which Serves for Provincial Area
単独/Single-unit establishments
38.7
39.2
46.7
46.0
48.0
49.3
48.0
52.7
53.4
50.4
55.4
55.4
本所・本社・本店/Headquarters
6.8
8.2
6.6
8.5
7.7
7.1
9.4
7.5
7.1
11.0
8.6
10.4
支所・支社・支店/Branch offices
54.4
52.7
46.7
45.6
44.4
43.6
42.7
39.8
39.4
38.6
36.1
34.2
凡例/LEGEND
仙台市/Sendai
福岡市/Fukuoka
さいたま市/Saitama
神戸市/Kobe
広島市/Hiroshima
札幌市/Sapporo
名古屋市/Nagoya
横浜市/Yokohama
川崎市/Kawasaki
大阪市/Osaka
京都市/Kyoto
東京23区/Tokyo-23
(%)
1000万円未満< 10 million YEN
33.3
42.0
42.8
47.6
48.4
52.2
53.9
56.7
57.5
59.1
59.2
59.8
1000-3000万円未満10-<30 million YEN
53.2
47.9
42.7
41.7
41.7
37.4
36.7
34.0
34.8
33.0
33.4
33.3
3000-5000万円未満30-<50 million YEN
6.0
5.3
5.1
5.1
4.4
4.6
4.7
4.4
3.9
3.5
3.4
3.3
5000万円以上50+ million YEN
7.4
4.8
9.4
5.6
5.5
5.9
4.7
5.0
3.8
4.4
4.0
3.5
凡例/LEGEND
大阪市/Osaka
京都市/Kyoto
東京23区/Tokyo-…
神戸市/Kobe
名古屋市/Nagoya
福岡市/Fukuoka
札幌市/Sapporo
仙台市/Sendai
広島市/Hiroshima
横浜市/Yokohama
川崎市/Kawasaki
さいたま市/Saitama
(%)
資本階級別民営事業所割合【主要大都市比較】(単独,本所のみ) /Percentage of Privately-owned Businesses by Capital Class, Single-unit Establishments and Headquarters in Major Cities (2012)
民営事業所の本所・支所別割合【主要大都市比較】(会社のみ) /Component Ratios of Privately-owned Businesses by Type of Office, Major Cities (2012)
資料:経済センサス活動調査(2012 年)*不詳を除いた割合 Note: This ratio excludes unspecified office type. Source: Statistics Bureau, Ministry of Internal Affairs and Communications, Economic Census for Business Activity (2012).
経済活動/Economic Engine
37
MUNAKATA
FUKUTSU
KOGA
KASUYA
SHINGU
HISAYAMA
SASAGURISUE
SHIMEUMI
DAZAIFU
CHIKUSHINO
DAZAIFU
ONOJO
KASUGA
NAKAGAWA
FUKUOKA
ITOSHIMA
MIYAWAKA
TACHIARAI
CHIKUZEN
OGOORI
KURUME
OKAGAKI
IIZUKA
KEISEN
TOSU
KIYAMA
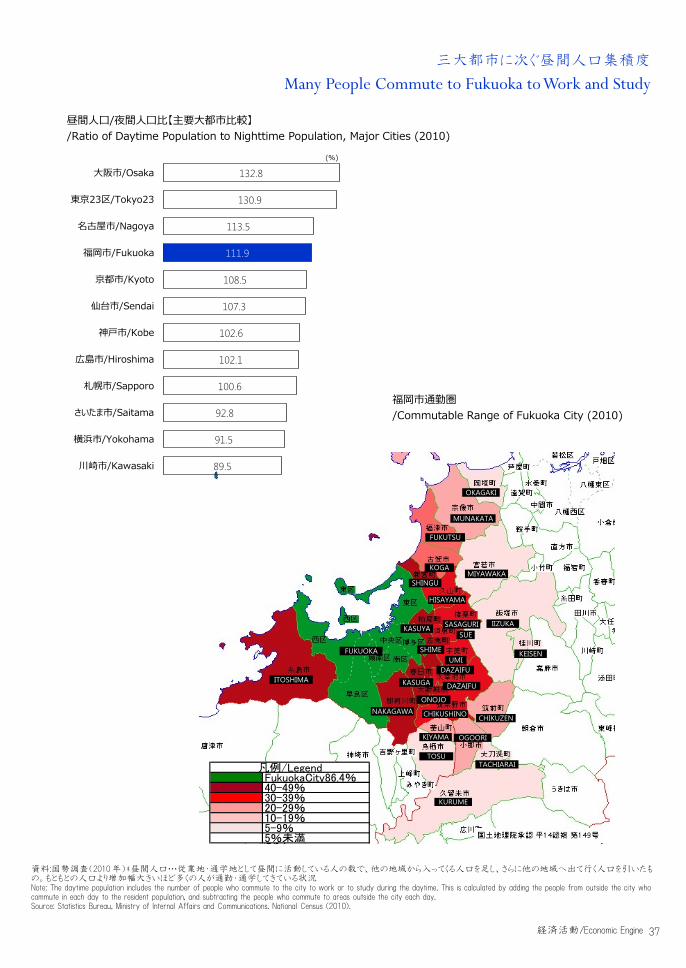
三大都市に次ぐ昼間人口集積度
Many People Commute to Fukuoka to Work and Study
132.8
130.9
113.5
111.9
108.5
107.3
102.6
102.1
100.6
92.8
91.5
89.5
大阪市/Osaka
東京23区/Tokyo23
名古屋市/Nagoya
福岡市/Fukuoka
京都市/Kyoto
仙台市/Sendai
神戸市/Kobe
広島市/Hiroshima
札幌市/Sapporo
さいたま市/Saitama
横浜市/Yokohama
川崎市/Kawasaki
(%)
凡例/LegendFukuokaCity86.4%40-49%30-39%20-29%10-19%5-9%5%未満
昼間人口/夜間人口比【主要大都市比較】 /Ratio of Daytime Population to Nighttime Population, Major Cities (2010)
福岡市通勤圏 /Commutable Range of Fukuoka City (2010)
資料:国勢調査(2010 年)*昼間人口…従業地・通学地として昼間に活動している人の数で、他の地域から入ってくる人口を足し、さらに他の地域へ出て行く人口を引いたもの。もともとの人口より増加幅大きいほど多くの人が通勤・通学してきている状況 Note: The daytime population includes the number of people who commute to the city to work or to study during the daytime. This is calculated by adding the people from outside the city who commute in each day to the resident population, and subtracting the people who commute to areas outside the city each day. Source: Statistics Bureau, Ministry of Internal Affairs and Communications. National Census (2010).
経済活動/Economic Engine
38
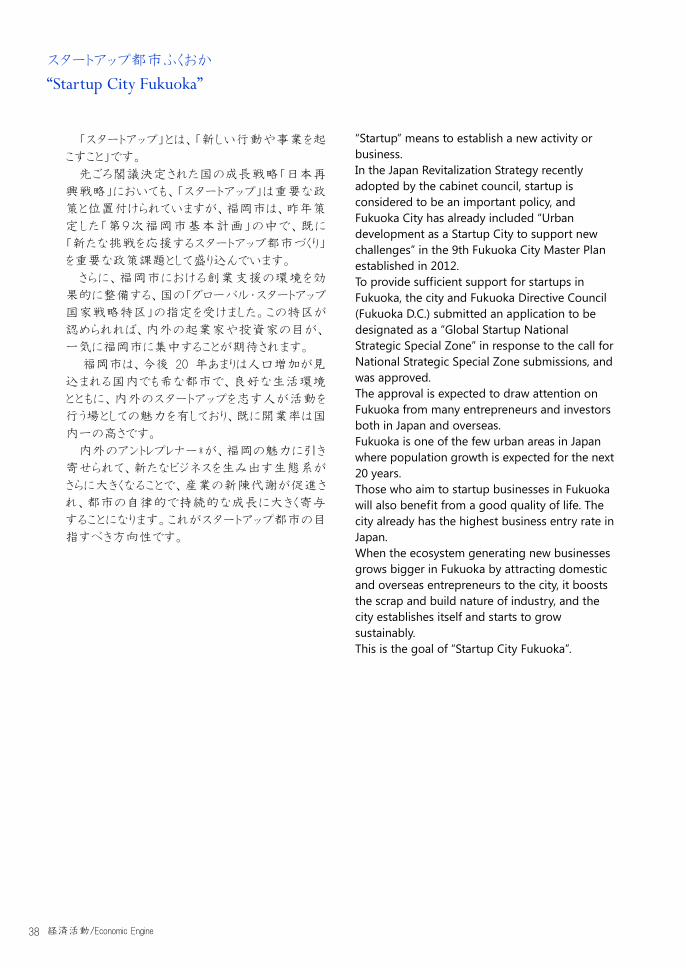
スタートアップ都市ふくおか
“Startup City Fukuoka”
「スタートアップ」とは、「新しい行動や事業を起
こすこと」です。
先ごろ閣議決定された国の成長戦略「日本再
興戦略」においても、「スタートアップ」は重要な政
策と位置付けられていますが、福岡市は、昨年策
定した「第9次福岡市基本計画」の中で、既に
「新たな挑戦を応援するスタートアップ都市づくり」
を重要な政策課題として盛り込んでいます。
さらに、福岡市における創業支援の環境を効
果的に整備する、国の「グローバル・スタートアップ
国家戦略特区」の指定を受けました。この特区が
認められれば、内外の起業家や投資家の目が、
一気に福岡市に集中することが期待されます。
福岡市は、今後 20 年あまりは人口増加が見
込まれる国内でも希な都市で、良好な生活環境
とともに、内外のスタートアップを志す人が活動を
行う場としての魅力を有しており、既に開業率は国
内一の高さです。
内外のアントレプレナー*が、福岡の魅力に引き
寄せられて、新たなビジネスを生み出す生態系が
さらに大きくなることで、産業の新陳代謝が促進さ
れ、都市の自律的で持続的な成長に大きく寄与
することになります。これがスタートアップ都市の目
指すべき方向性です。
“Startup” means to establish a new activity or business. In the Japan Revitalization Strategy recently adopted by the cabinet council, startup is considered to be an important policy, and Fukuoka City has already included “Urban development as a Startup City to support new challenges” in the 9th Fukuoka City Master Plan established in 2012. To provide sufficient support for startups in Fukuoka, the city and Fukuoka Directive Council (Fukuoka D.C.) submitted an application to be designated as a “Global Startup National Strategic Special Zone” in response to the call for National Strategic Special Zone submissions, and was approved. The approval is expected to draw attention on Fukuoka from many entrepreneurs and investors both in Japan and overseas. Fukuoka is one of the few urban areas in Japan where population growth is expected for the next 20 years. Those who aim to startup businesses in Fukuoka will also benefit from a good quality of life. The city already has the highest business entry rate in Japan. When the ecosystem generating new businesses grows bigger in Fukuoka by attracting domestic and overseas entrepreneurs to the city, it boosts the scrap and build nature of industry, and the city establishes itself and starts to grow sustainably. This is the goal of “Startup City Fukuoka”.
経済活動/Economic Engine
39
4.1
3.9
3.6
3.6
3.3
3.3
3.1
3.0
3.0
2.8
2.7
2.3
福岡市/Fukuoka
札幌市/Sapporo
横浜市/Yokohama
仙台市/Sendai
広島市/Hiroshima
神戸市/Kobe
大阪市/Osaka
川崎市/Kawasaki
名古屋市/Nagoya
さいたま市/Saitama
京都市/Kyoto
東京23区/Tokyo-23
(%)
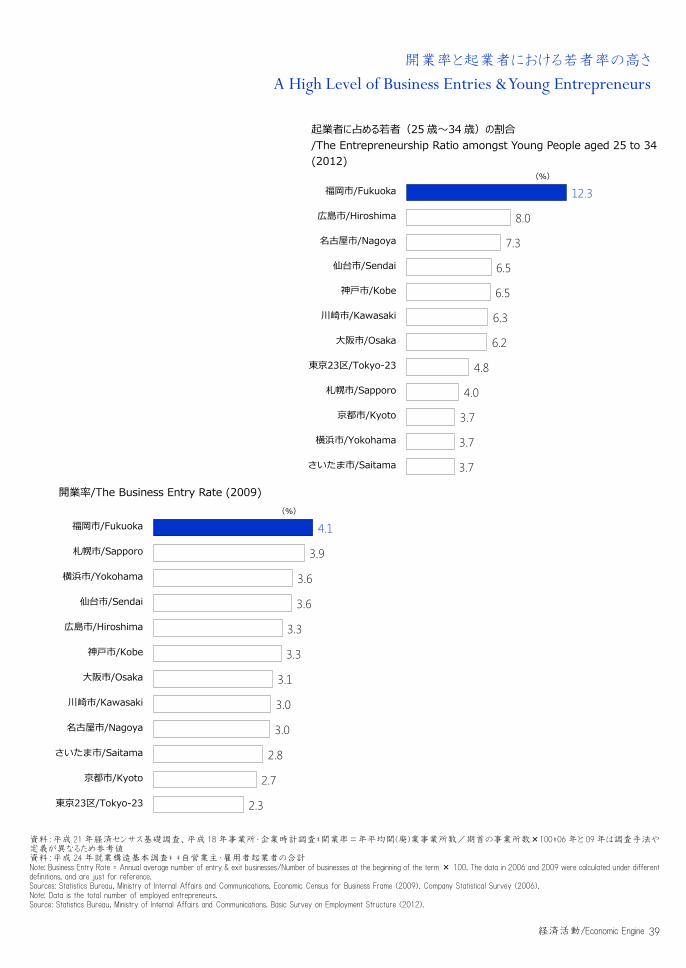
開業率と起業者における若者率の高さ A High Level of Business Entries & Young Entrepreneurs
12.3
8.0
7.3
6.5
6.5
6.3
6.2
4.8
4.0
3.7
3.7
3.7
福岡市/Fukuoka
広島市/Hiroshima
名古屋市/Nagoya
仙台市/Sendai
神戸市/Kobe
川崎市/Kawasaki
大阪市/Osaka
東京23区/Tokyo-23
札幌市/Sapporo
京都市/Kyoto
横浜市/Yokohama
さいたま市/Saitama
(%)
起業者に占める若者(25 歳~34 歳)の割合 /The Entrepreneurship Ratio amongst Young People aged 25 to 34 (2012)
開業率/The Business Entry Rate (2009)
資料:平成 21 年経済センサス基礎調査、平成 18 年事業所・企業時計調査*開業率=年平均開(廃)業事業所数/期首の事業所数×100*06 年と 09 年は調査手法や定義が異なるため参考値 資料:平成 24 年就業構造基本調査* *自営業主・雇用者起業者の合計 Note: Business Entry Rate = Annual average number of entry & exit businesses/Number of businesses at the beginning of the term × 100. The data in 2006 and 2009 were calculated under different definitions, and are just for reference. Sources: Statistics Bureau, Ministry of Internal Affairs and Communications. Economic Census for Business Frame (2009). Company Statistical Survey (2006). Note: Data is the total number of employed entrepreneurs. Source: Statistics Bureau, Ministry of Internal Affairs and Communications. Basic Survey on Employment Structure (2012).
経済活動/Economic Engine

40
「学術研究,専門・技術サービス業」などの起業者が多い
A High Ratio of Entrepreneurs in the Scientific Research and Technical Service Sectors
福岡市の自営業主・起業者の業種上位 /The Top Sectors of Self-Employers & Entrepreneurs in Fukuoka City (2012)
有業者・転職希望者のうち起業希望者割合 /The Ratio of Workers Wishing to Start Businesses among Those Who are Wishing to Change Jobs
無業者・就職希望者のうち起業希望者割合 /The Ratio of Persons Wishing to Start Businesses among Those Who are Looking for a Job
資料:平成 24 年就業構造基本調査 Source: Statistics Bureau, Ministry of Internal Affairs and Communications. Basic Survey on Employment Structure (2012).
11.5
10.6
9.3
8.9
8.4
7.3
6.9
6.8
6.7
6.7
6.6
6.2
大阪市/Osaka
さいたま市/Saitama
福岡市/Fukuoka
京都市/Kyoto
東京23区/Tokyo-23
神戸市/Kobe
川崎市/Kawasaki
名古屋市/Nagoya
広島市/Hiroshima
仙台市/Sendai
札幌市/Sapporo
横浜市/Yokohama
(%)
6.7
5.6
5.4
5.1
5.1
4.7
4.3
4.2
3.8
3.6
3.0
2.5
川崎市/Kawasaki
福岡市/Fukuoka
大阪市/Osaka
京都市/Kyoto
東京23区/Tokyo-23
仙台市/Sendai
横浜市/Yokohama
さいたま市/Saitama
広島市/Hiroshima
神戸市/Kobe
札幌市/Sapporo
名古屋市/Nagoya
(%)
経済活動/Economic Engine

41
生活の質 QOL
生活の質で成長する都市
Quality of Life
04
42
遠近両用の観察眼
都市を捉えるには遠近両用のズームレンズのような目を持つことが理想です。
俯瞰的な視点から、世界地図における福岡の位置はどこか、を捉えるマクロな目。
生活者の視点から、日常生活における福岡の魅力は何か、を捉えるミクロな目。
しばしば「鳥の目、虫の目、魚の目」という表現もされますが、都市は生き物のように日々変化し続けるから
こそ、目線を動かしながら多角的に捉えることが必要です。
都市が個性化を競う時代
宇宙から見れば全ての都市は似たような色に見えます。
しかし、実際に訪れてみると、あらゆる都市には個性があります。
欧州の古い街並み、米国の近代ビジネス街、アジアの混沌とした大都市、アラブの伝統集落など、独
特の景色を連想される方も多いでしょう。
大量生産によって量や規模を追求した時代が変わり、質に注目が集まる時代になりました。
そして、グローバル化が進展した結果、他と異なる魅力を伸ばそうとする都市づくりが盛んになっています。
福岡ならではの「質」
福岡ならではの個性とは何でしょうか?
ミクロな目で、福岡ならではの「質」を、丁寧に紹介して参ります。
福岡が世界に誇る「暮らしの質」です。
Bifocal Eyes to Look at a City It is ideal to have bifocal eyes like a zoom lens to comprehend a city. Such eyes would help understand the position of Fukuoka on the world map from a comprehensive point of view. Such eyes would help capture the charms of Fukuoka from an ordinary resident’s point of view. These views are often described as “bird’s-eye view, fish’s-eye view, worm’s-eye view”. Because a city continues to change day by day like a living creature, it is necessary to look at a city from diversified points of view.
Competition for Uniqueness Every city looks the same from outside. However, when visiting a city, each city has its own charms and characteristics. Examples would include an old townscape in Europe, a modern business street in the United States, a chaotic large city in Asia, and a traditional colony in an Arab state. The era of pursuing quantity and scale through mass production has shifted to an era focusing on quality of life. As a result of globalization, urban planning designed to enhance the unique charm and context of a city has become popular.
The Uniqueness of Fukuoka What is the uniqueness of Fukuoka? Switching to the micro-eye view, the unique “Quality” of Fukuoka is going to be thoroughly introduced in this report. The theme is Fukuoka’s world-class “Quality of Life”.
生活の質/Quality of Life
43
はい/Yes95.3%
いいえ/No1.7%
不明/NA3.0%
はい/Yes96.3%
いいえ/No1.8%
不明/NA1.9%
はい/Yes92.1%
いいえ/No3.3%
不明/NA4.7%
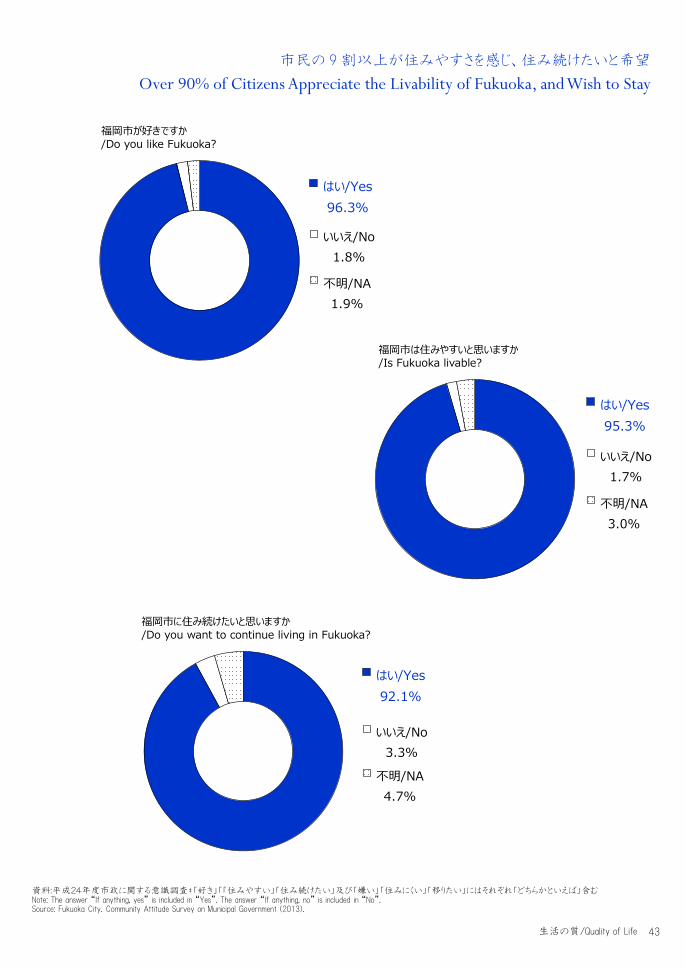
市民の 9 割以上が住みやすさを感じ、住み続けたいと希望 Over 90% of Citizens Appreciate the Livability of Fukuoka, and Wish to Stay
福岡市が好きですか /Do you like Fukuoka?
福岡市は住みやすいと思いますか /Is Fukuoka livable?
福岡市に住み続けたいと思いますか /Do you want to continue living in Fukuoka?
資料:平成24年度市政に関する意識調査*「好き」「「住みやすい」「住み続けたい」及び「嫌い」「住みにくい」「移りたい」にはそれぞれ「どちらかといえば」含む Note: The answer “If anything, yes” is included in “Yes”. The answer “If anything, no” is included in “No”. Source: Fukuoka City. Community Attitude Survey on Municipal Government (2013).
生活の質/Quality of Life
44
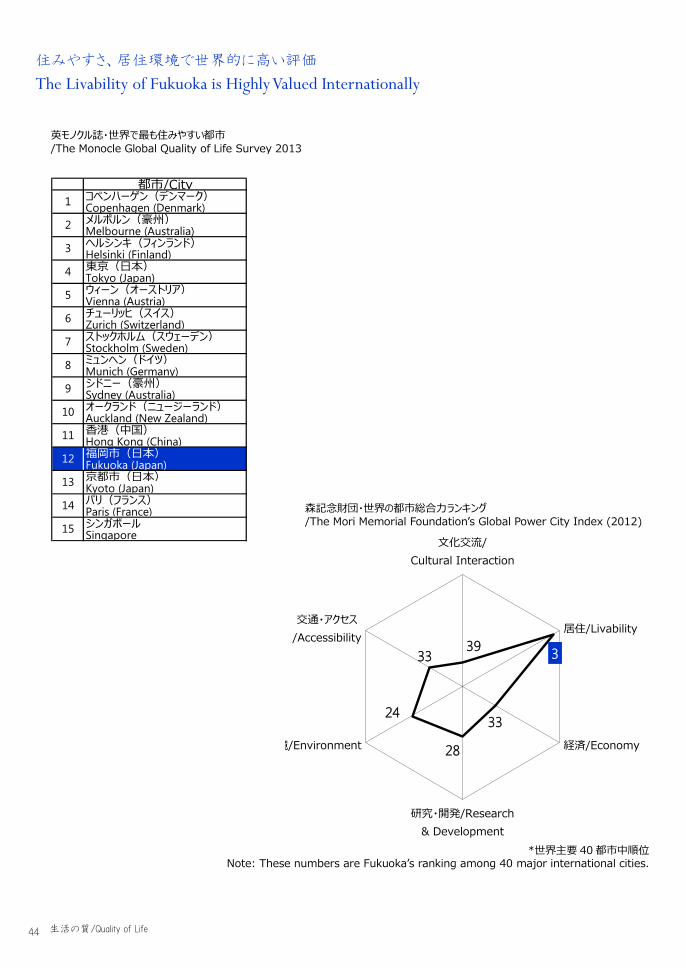
39 3
33
28
24
33
文化交流/Cultural Interaction
居住/Livability
経済/Economy
研究・開発/Research & Development
境/Environment
交通・アクセス/Accessibility
住みやすさ、居住環境で世界的に高い評価
The Livability of Fukuoka is Highly Valued Internationally
都市/Cityコペンハーゲン(デンマーク)Copenhagen (Denmark)メルボルン(豪州)Melbourne (Australia)ヘルシンキ(フィンランド)Helsinki (Finland)東京(日本)Tokyo (Japan)ウィーン(オーストリア)Vienna (Austria)チューリッヒ(スイス)Zurich (Switzerland)ストックホルム(スウェーデン)Stockholm (Sweden)ミュンヘン(ドイツ)Munich (Germany)シドニー(豪州)Sydney (Australia)オークランド(ニュージーランド)Auckland (New Zealand)香港(中国)Hong Kong (China)福岡市(日本)Fukuoka (Japan)京都市(日本)Kyoto (Japan)パリ(フランス)Paris (France)シンガポールSingapore
12
13
14
15
6
7
8
9
10
11
1
2
3
4
5
英モノクル誌・世界で最も住みやすい都市 /The Monocle Global Quality of Life Survey 2013
森記念財団・世界の都市総合力ランキング /The Mori Memorial Foundation’s Global Power City Index (2012)
*世界主要 40 都市中順位 Note: These numbers are Fukuoka’s ranking among 40 major international cities.
生活の質/Quality of Life

45
コンパクトな市街地の暮らしやすい都市の規模
The Livable Size of a City with a Compact Urban Area
福岡市/Fukuoka City 東京 23 区/Tokyo-23 大阪市/Osaka
名古屋市/Nagoya 札幌市/Sapporo
仙台市/Sendai 広島市/Hiroshima
都市/City 面積/Aea(k㎡)
札幌市/Sapporo 1,121.12仙台市/Sendai 783.54東京23区/Tokyo-23 621.83名古屋市/Nagoya 326.43大阪市/Osaka 222.47広島市/Hiroshima 905.41福岡市/Fukuoka 341.32国勢調査/National Statistics(2010)
大都市の市街地域の規模比較 /Size Comparisons off Central Business Districts in Selected Large Cities, Japan
生活の質/Quality of Life
46
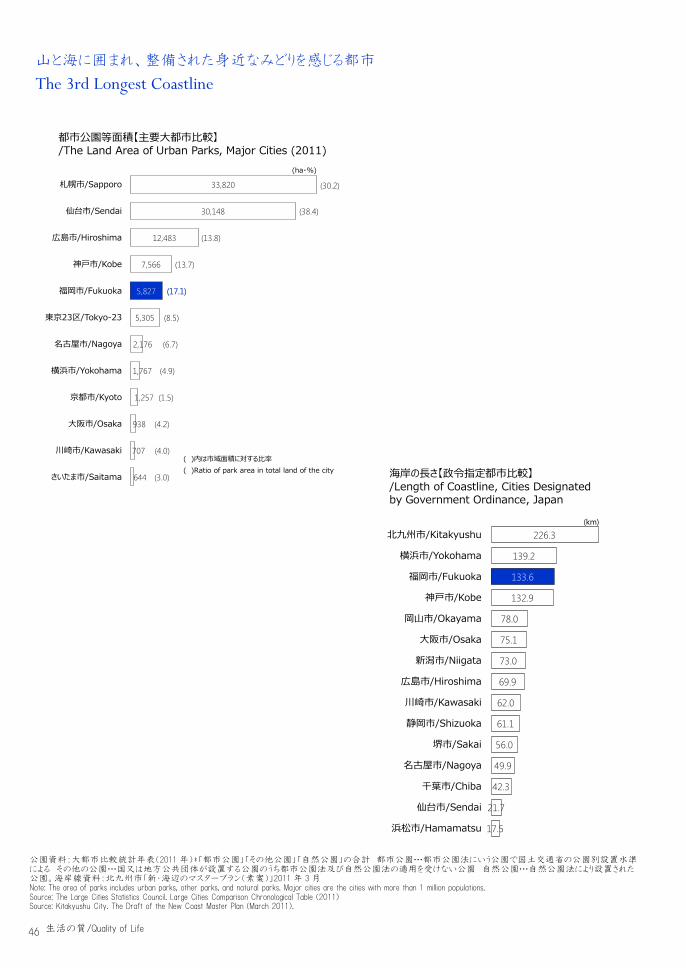
山と海に囲まれ、整備された身近なみどりを感じる都市
The 3rd Longest Coastline
33,820
30,148
12,483
7,566
5,827
5,305
2,176
1,767
1,257
938
707
644
(30.2)
(38.4)
(13.8)
(13.7)
(17.1)
(8.5)
(6.7)
(4.9)
(1.5)
(4.2)
(4.0)
(3.0)
札幌市/Sapporo
仙台市/Sendai
広島市/Hiroshima
神戸市/Kobe
福岡市/Fukuoka
東京23区/Tokyo-23
名古屋市/Nagoya
横浜市/Yokohama
京都市/Kyoto
大阪市/Osaka
川崎市/Kawasaki
さいたま市/Saitama
(ha・%)
( )内は市域面積に対する比率( )Ratio of park area in total land of the city
226.3
139.2
133.6
132.9
78.0
75.1
73.0
69.9
62.0
61.1
56.0
49.9
42.3
21.7
17.5
北九州市/Kitakyushu
横浜市/Yokohama
福岡市/Fukuoka
神戸市/Kobe
岡山市/Okayama
大阪市/Osaka
新潟市/Niigata
広島市/Hiroshima
川崎市/Kawasaki
静岡市/Shizuoka
堺市/Sakai
名古屋市/Nagoya
千葉市/Chiba
仙台市/Sendai
浜松市/Hamamatsu
(km)
都市公園等面積【主要大都市比較】 /The Land Area of Urban Parks, Major Cities (2011)
海岸の長さ【政令指定都市比較】 /Length of Coastline, Cities Designated by Government Ordinance, Japan
公園資料:大都市比較統計年表(2011 年)*「都市公園」「その他公園」「自然公園」の合計 都市公園…都市公園法にいう公園で国土交通省の公園別設置水準による その他の公園…国又は地方公共団体が設置する公園のうち都市公園法及び自然公園法の適用を受けない公園 自然公園…自然公園法により設置された公園。海岸線資料:北九州市「新・海辺のマスタープラン(素案)」2011 年 3 月 Note: The area of parks includes urban parks, other parks, and natural parks. Major cities are the cities with more than 1 million populations. Source: The Large Cities Statistics Council. Large Cities Comparison Chronological Table (2011) Source: Kitakyushu City. The Draft of the New Coast Master Plan (March 2011).
生活の質/Quality of Life

47
職住接近のメリットでスポーツやコミュニケーションなど余暇充実
Short Commuting Times, and Long Hours for the 3rd Activities
147
168
150
147
144
142
129
128
全国平均/National Average
北九州・福岡大都市圏/Kitakyushu & Fukuoka M.
中京大都市圏/Chukyo METRO(Nagoya)
広島大都市圏/Hiroshima METRO
関東大都市圏/Kanto METRO(Tokyo)
近畿大都市圏/Kinki METRO(Osaka)
札幌大都市圏/Sapporo METRO
仙台大都市圏/Sendai Metro
スポーツ【日曜】/Sports 【Sunday】
(minute / day)
164
174
167
165
164
157
156
145
全国平均/National Average
関東大都市圏/Kanto METRO(Tokyo)
北九州・福岡大都市圏/Kitakyushu & Fukuoka M.
近畿大都市圏/Kinki METRO(Osaka)
札幌大都市圏/Sapporo METRO
中京大都市圏/Chukyo METRO(Nagoya)
広島大都市圏/Hiroshima METRO
仙台大都市圏/Sendai Metro
交際・付き合い【全日】/Social 【All Day】
(minute / day)
387
419
395
391
389
382
378
374
全国平均/National Average
札幌大都市圏/Sapporo METRO
北九州・福岡大都市圏/Kitakyushu & Fukuoka M.
近畿大都市圏/Kinki METRO(Osaka)
中京大都市圏/Chukyo METRO(Nagoya)
関東大都市圏/Kanto METRO(Tokyo)
広島大都市圏/Hiroshima METRO
仙台大都市圏/Sendai Metro
3次活動【全日】/3rd activities 【All Day】
(minute / day)
39
35
35
36
36
37
42
49
全国平均/National Average
北九州・福岡大都市圏/Kitakyushu & Fukuoka M.
札幌大都市圏/Sapporo METRO
広島大都市圏/Hiroshima METRO
仙台大都市圏/Sendai Metro
中京大都市圏/Chukyo METRO(Nagoya)
近畿大都市圏/Kinki METRO(Osaka)
関東大都市圏/Kanto METRO(Tokyo)
通勤・通学【平日・片道換算】/Commuting【Weekday/Oneway】
(minute / day)
459
464
463
463
459
455
455
452
全国平均/National Average
仙台大都市圏/Sendai Metro
北九州・福岡大都市圏/Kitakyushu & Fukuoka M.
札幌大都市圏/Sapporo METRO
中京大都市圏/Chukyo METRO(Nagoya)
近畿大都市圏/Kinki METRO(Osaka)
広島大都市圏/Hiroshima METRO
関東大都市圏/Kanto METRO(Tokyo)
睡眠【全日】/Sleep【All Day】
(minute / day)(minute / day)
499
510
507
502
500
499
496
494
全国平均/National Average
関東大都市圏/Kanto METRO(Tokyo)
札幌大都市圏/Sapporo METRO
北九州・福岡大都市圏/Kitakyushu & Fukuoka M.
中京大都市圏/Chukyo METRO(Nagoya)
仙台大都市圏/Sendai Metro
広島大都市圏/Hiroshima METRO
近畿大都市圏/Kinki METRO(Osaka)
仕事【平日】/Work【Weekday】
(minute / day)
生活時間(平均)【大都市圏比較】 /How many minutes per day do you spend for the activity on average? (Comparison with Metropolitan Areas, Japan)
資料:社会生活基本調査(2011 年)*3次活動 ; 自由に使える時間における活動(食事や睡眠などの生理的な活動及び仕事、学校などの社会活動を除いた時間)Note: 3rd activities are those carried out in a person’s spare time other than the time used for dining, sleeping, other physical activities, and working, schooling, and other social activities. Source: Statistics Bureau, Ministry of Internal Affairs and Communications, Social Life Basic Survey (2011).
生活の質/Quality of Life
48
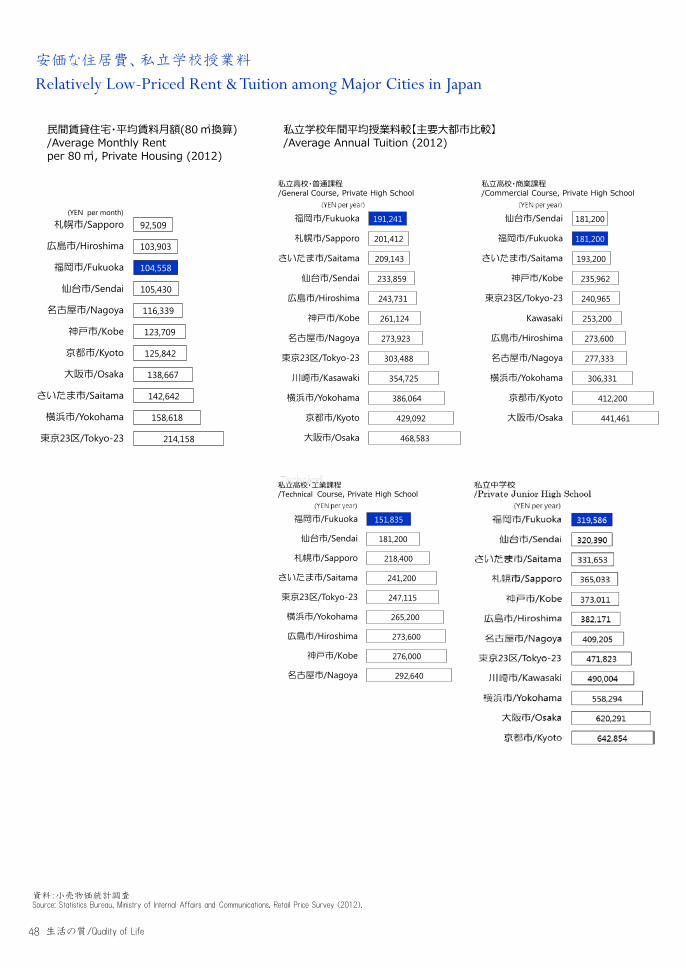
安価な住居費、私立学校授業料
Relatively Low-Priced Rent & Tuition among Major Cities in Japan
92,509
103,903
104,558
105,430
116,339
123,709
125,842
138,667
142,642
158,618
214,158
札幌市/Sapporo
広島市/Hiroshima
福岡市/Fukuoka
仙台市/Sendai
名古屋市/Nagoya
神戸市/Kobe
京都市/Kyoto
大阪市/Osaka
さいたま市/Saitama
横浜市/Yokohama
東京23区/Tokyo-23
(YEN per month)
191,241
201,412
209,143
233,859
243,731
261,124
273,923
303,488
354,725
386,064
429,092
468,583
福岡市/Fukuoka
札幌市/Sapporo
さいたま市/Saitama
仙台市/Sendai
広島市/Hiroshima
神戸市/Kobe
名古屋市/Nagoya
東京23区/Tokyo-23
川崎市/Kasawaki
横浜市/Yokohama
京都市/Kyoto
大阪市/Osaka
私立高校・普通課程/General Course, Private High School
181,200
181,200
193,200
235,962
240,965
253,200
273,600
277,333
306,331
412,200
441,461
仙台市/Sendai
福岡市/Fukuoka
さいたま市/Saitama
神戸市/Kobe
東京23区/Tokyo-23
Kawasaki
広島市/Hiroshima
名古屋市/Nagoya
横浜市/Yokohama
京都市/Kyoto
大阪市/Osaka
私立高校・商業課程/Commercial Course, Private High School
151,835
181,200
218,400
241,200
247,115
265,200
273,600
276,000
292,640
福岡市/Fukuoka
仙台市/Sendai
札幌市/Sapporo
さいたま市/Saitama
東京23区/Tokyo-23
横浜市/Yokohama
広島市/Hiroshima
神戸市/Kobe
名古屋市/Nagoya
私立高校・工業課程/Technical Course, Private High School
私立学校年間平均授業料較【主要大都市比較】 /Average Annual Tuition (2012)
民間賃貸住宅・平均賃料月額(80 ㎡換算) /Average Monthly Rent per 80 ㎡, Private Housing (2012)
資料:小売物価統計調査 Source: Statistics Bureau, Ministry of Internal Affairs and Communications, Retail Price Survey (2012).
生活の質/Quality of Life
49
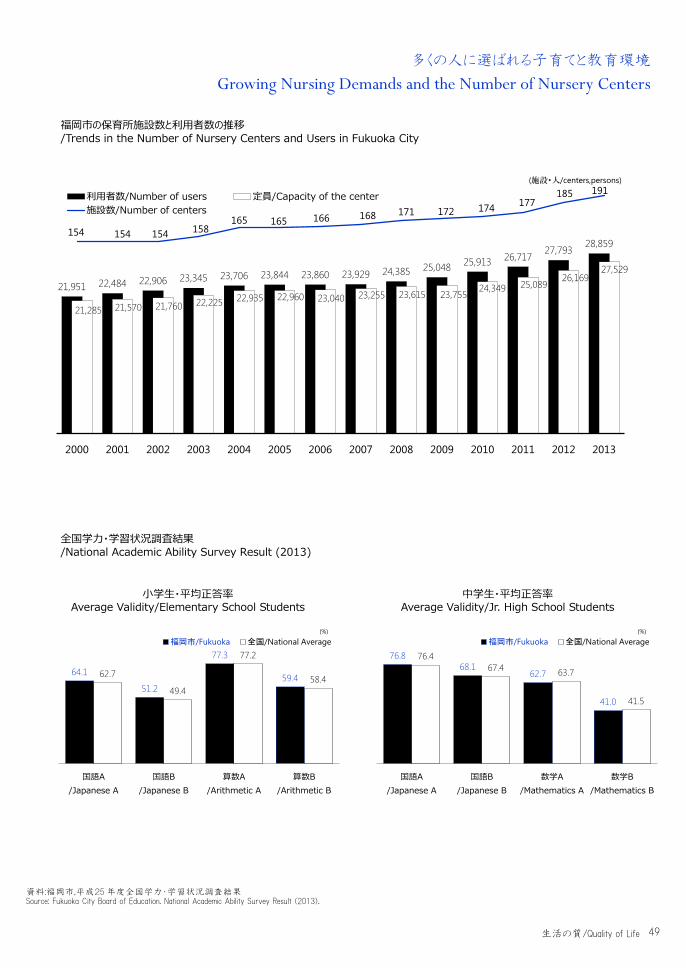
多くの人に選ばれる子育てと教育環境 Growing Nursing Demands and the Number of Nursery Centers
21,951 22,484 22,906 23,345 23,706 23,844 23,860 23,929 24,385 25,048 25,913 26,71727,793
28,859
21,285 21,570 21,760 22,225 22,935 22,960 23,040 23,255 23,615 23,75524,349 25,089
26,16927,529
154 154 154 158165 165 166 168 171 172 174 177
185 191
0
00
2000 2001 2002 2003 2004 2005 2006 2007 2008 2009 2010 2011 2012 2013
利用者数/Number of users 定員/Capacity of the center施設数/Number of centers
(施設・人/centers,persons)
小学生・平均正答率 Average Validity/Elementary School Students
中学生・平均正答率 Average Validity/Jr. High School Students
64.1
51.2
77.3
59.462.7
49.4
77.2
58.4
国語A/Japanese A
国語B/Japanese B
算数A/Arithmetic A
算数B/Arithmetic B
福岡市/Fukuoka 全国/National Average(%)
76.868.1
62.7
41.0
76.467.4 63.7
41.5
国語A/Japanese A
国語B/Japanese B
数学A/Mathematics A
数学B/Mathematics B
福岡市/Fukuoka 全国/National Average(%)
福岡市の保育所施設数と利用者数の推移 /Trends in the Number of Nursery Centers and Users in Fukuoka City
全国学力・学習状況調査結果 /National Academic Ability Survey Result (2013)
資料:福岡市,平成25 年度全国学力・学習状況調査結果 Source: Fukuoka City Board of Education. National Academic Ability Survey Result (2013).
生活の質/Quality of Life
50
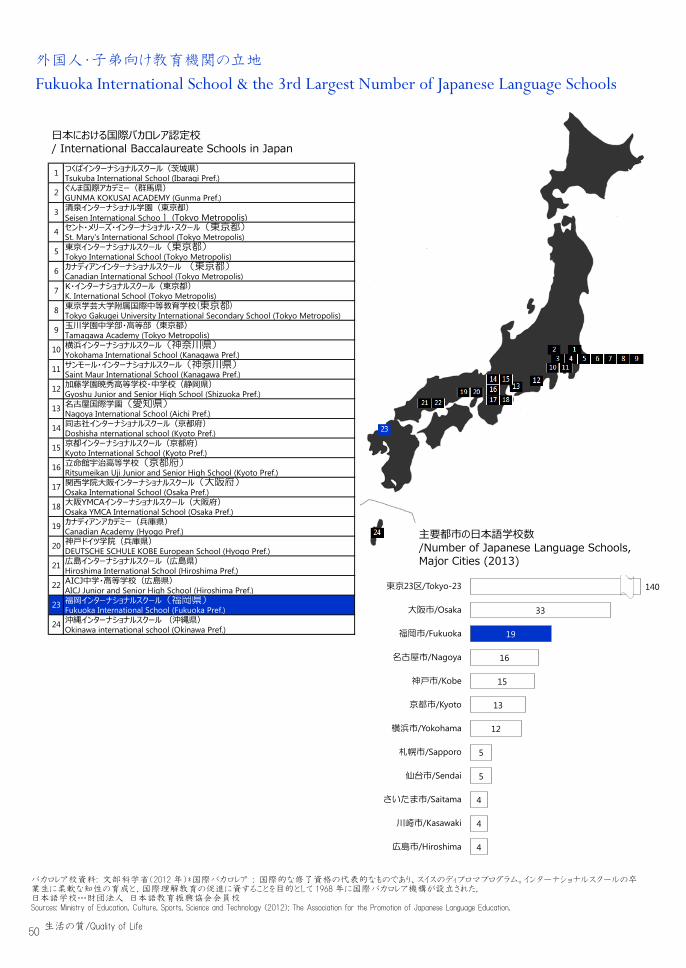
外国人・子弟向け教育機関の立地
Fukuoka International School & the 3rd Largest Number of Japanese Language Schools
140
33
19
16
15
13
12
5
5
4
4
4
東京23区/Tokyo-23
大阪市/Osaka
福岡市/Fukuoka
名古屋市/Nagoya
神戸市/Kobe
京都市/Kyoto
横浜市/Yokohama
札幌市/Sapporo
仙台市/Sendai
さいたま市/Saitama
川崎市/Kasawaki
広島市/Hiroshima
(school)
つくばインターナショナルスクール(茨城県)Tsukuba International School (Ibaragi Pref.)ぐんま国際アカデミー(群馬県)GUNMA KOKUSAI ACADEMY (Gunma Pref.)清泉インターナショナル学園(東京都)Seisen International School (Tokyo Metropolis)セント・メリーズ・インターナショナル・スクール(東京都)St. Mary's International School (Tokyo Metropolis)東京インターナショナルスクール(東京都)Tokyo International School (Tokyo Metropolis)カナディアンインターナショナルスクール (東京都)Canadian International School (Tokyo Metropolis)K・インターナショナルスクール(東京都)K. International School (Tokyo Metropolis)東京学芸大学附属国際中等教育学校(東京都)Tokyo Gakugei University International Secondary School (Tokyo Metropolis)玉川学園中学部・高等部(東京都)Tamagawa Academy (Tokyo Metropolis)横浜インターナショナルスクール(神奈川県)Yokohama International School (Kanagawa Pref.)サンモール・インターナショナルスクール(神奈川県)Saint Maur International School (Kanagawa Pref.)加藤学園暁秀高等学校・中学校(静岡県)Gyoshu Junior and Senior High School (Shizuoka Pref.)名古屋国際学園(愛知県)Nagoya International School (Aichi Pref.)同志社インターナショナルスクール(京都府)Doshisha nternational school (Kyoto Pref.)京都インターナショナルスクール(京都府)Kyoto International School (Kyoto Pref.)立命館宇治高等学校(京都府)Ritsumeikan Uji Junior and Senior High School (Kyoto Pref.)関西学院大阪インターナショナルスクール(大阪府)Osaka International School (Osaka Pref.)大阪YMCAインターナショナルスクール(大阪府)Osaka YMCA International School (Osaka Pref.)カナディアンアカデミー(兵庫県)Canadian Academy (Hyogo Pref.)神戸ドイツ学院(兵庫県)DEUTSCHE SCHULE KOBE European School (Hyogo Pref.)広島インターナショナルスクール(広島県)Hiroshima International School (Hiroshima Pref.)AICJ中学・高等学校(広島県)AICJ Junior and Senior High School (Hiroshima Pref.)福岡インターナショナルスクール(福岡県)Fukuoka International School (Fukuoka Pref.)沖縄インターナショナルスクール (沖縄県)Okinawa international school (Okinawa Pref.)
1
2
3
4
5
6
7
8
9
10
11
12
13
14
15
16
17
24
18
19
20
21
22
23
主要都市の日本語学校数 /Number of Japanese Language Schools, Major Cities (2013)
日本における国際バカロレア認定校 / International Baccalaureate Schools in Japan
バカロレア校資料: 文部科学省(2012 年)*国際バカロレア ; 国際的な修了資格の代表的なものであり、スイスのディプロマプログラム。インターナショナルスクールの卒業生に柔軟な知性の育成と,国際理解教育の促進に資することを目的として 1968 年に国際バカロレア機構が設立された, 日本語学校…財団法人 日本語教育振興協会会員校 Sources: Ministry of Education, Culture, Sports, Science and Technology (2012); The Association for the Promotion of Japanese Language Education.
生活の質/Quality of Life
51
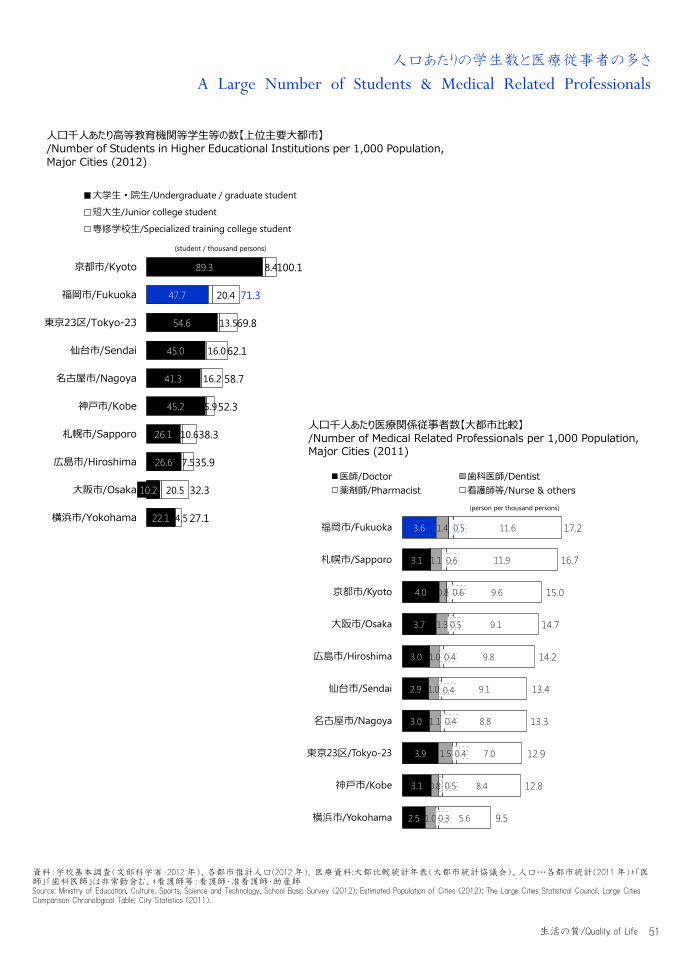
人口あたりの学生数と医療従事者の多さ
A Large Number of Students & Medical Related Professionals
3.6
3.1
4.0
3.7
3.0
2.9
3.0
3.9
3.1
2.5
1.4
1.1
0.8
1.3
1.0
1.0
1.1
1.5
0.8
1.0
0.5
0.6
0.6
0.5
0.4
0.4
0.4
0.4
0.5
0.3
11.6
11.9
9.6
9.1
9.8
9.1
8.8
7.0
8.4
5.6
17.2
16.7
15.0
14.7
14.2
13.4
13.3
12.9
12.8
9.5
福岡市/Fukuoka
札幌市/Sapporo
京都市/Kyoto
大阪市/Osaka
広島市/Hiroshima
仙台市/Sendai
名古屋市/Nagoya
東京23区/Tokyo-23
神戸市/Kobe
横浜市/Yokohama
医師/Doctor 歯科医師/Dentist薬剤師/Pharmacist 看護師等/Nurse & others
(person per thousand persons)
89.3
47.7
54.6
45.0
41.3
45.2
26.1
26.6
10.2
22.1
8.4
20.4
13.5
16.0
16.2
5.9
10.6
7.5
20.5
4.5
100.1
71.3
69.8
62.1
58.7
52.3
38.3
35.9
32.3
27.1
京都市/Kyoto
福岡市/Fukuoka
東京23区/Tokyo-23
仙台市/Sendai
名古屋市/Nagoya
神戸市/Kobe
札幌市/Sapporo
広島市/Hiroshima
大阪市/Osaka
横浜市/Yokohama
大学生・院生/Undergraduate / graduate student
短大生/Junior college student
専修学校生/Specialized training college student
(student / thousand persons)
人口千人あたり高等教育機関等学生等の数【上位主要大都市】 /Number of Students in Higher Educational Institutions per 1,000 Population, Major Cities (2012)
人口千人あたり医療関係従事者数【大都市比較】 /Number of Medical Related Professionals per 1,000 Population, Major Cities (2011)
資料:学校基本調査(文部科学省・2012 年)、各都市推計人口(2012 年), 医療資料:大都比較統計年表(大都市統計協議会)、人口…各都市統計(2011 年)*「医師」「歯科医師」は非常勤含む、*看護師等:看護師・准看護師・助産師 Source: Ministry of Education, Culture, Sports, Science and Technology, School Basic Survey (2012); Estimated Population of Cities (2012); The Large Cities Statistical Council. Large Cities Comparison Chronological Table; City Statistics (2011).
生活の質/Quality of Life
52
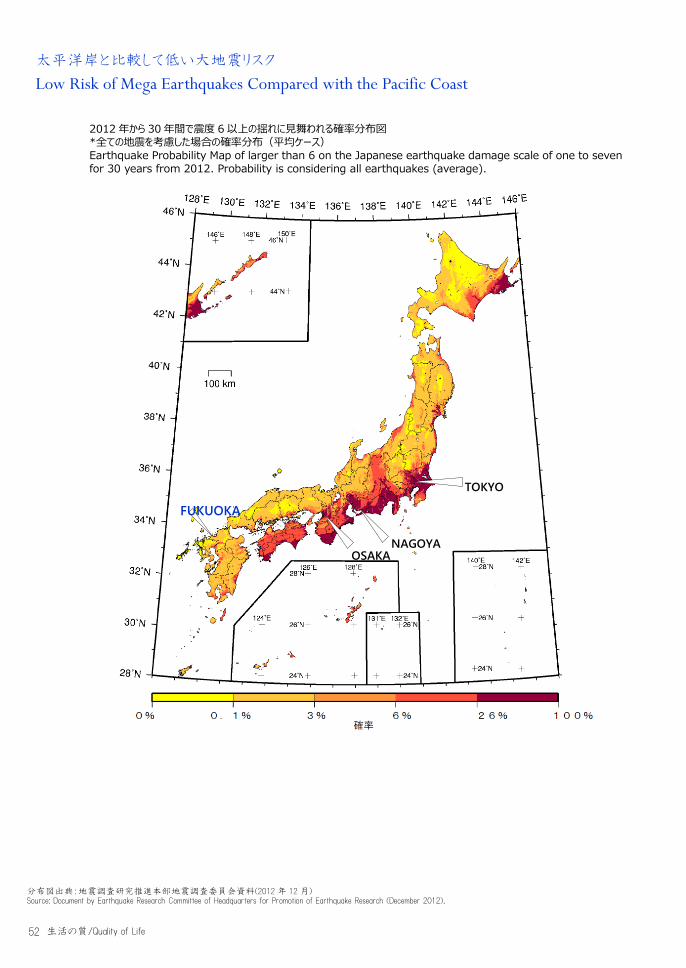
太平洋岸と比較して低い大地震リスク
Low Risk of Mega Earthquakes Compared with the Pacific Coast
TOKYO
NAGOYA
OSAKA
FUKUOKA
2012 年から 30 年間で震度 6 以上の揺れに見舞われる確率分布図 *全ての地震を考慮した場合の確率分布(平均ケース) Earthquake Probability Map of larger than 6 on the Japanese earthquake damage scale of one to seven for 30 years from 2012. Probability is considering all earthquakes (average).
分布図出典:地震調査研究推進本部地震調査委員会資料(2012 年 12 月) Source: Document by Earthquake Research Committee of Headquarters for Promotion of Earthquake Research (December 2012).
生活の質/Quality of Life
53
人材・人流 Diversity
多様・多彩な人材のクロスロード
Crossroads of Diversif ied Talent and Workforce
05

54
福岡市には多くの「働く人」が集まっています。
福岡市には多くの「働く場」があり、多様な職業の
人が暮らしています。
市民はもとより、福岡都市圏など周辺地域に住
む多くの人が、福岡市で働き、多くの価値を生み出
しています。
福岡市は、毎年 10 万人を超える人が転入・転
出し、全国的にみても、住民の入れ替わりが多いの
が特徴です。多くの人を受け入れる土壌があること
は、多様・多彩な人材を集めるポテンシャルを有して
いると言えます。
福岡市には、専門的な知識や技術を有する「ク
リエイティブクラス」とも呼べる職業の人も多く住んで
いますが、多彩な人材の能力をさらにいかすことが
できれば、より大きな付加価値を生み出す余力を備
えています。
毎年多くの人が出会い交流する「人流のクロス
ロード」として、異なる価値が交わることで生まれる
発見や可能性を、新たな価値創造に結びつけ、新
陳代謝が活発な福岡市ならではの発展のチカラと
していくことが期待されます。
A lot of workers gather in Fukuoka City. Fukuoka has many workplaces and diversified employees. Not only Fukuoka citizens but also the people who live in the surrounding Fukuoka Metropolitan Area work in Fukuoka and produce value. Every year, more than 100 thousand people move into and move out from Fukuoka, which explains the national distinctiveness of the city. The city attracts many people, in particular the younger generations. These trends also give us a glimpse of circumstances where the talents and skills of married women are not adopted sufficiently. In Fukuoka, there are a relatively large number of people who are engaged in jobs which can be sorted as being in a “Creative Class” with professional knowledge and skills. If these diversified talents could be adopted fully, Fukuoka could generate even more added value. As a “Crossroads of People” where many people meet and communicate every year, Fukuoka is expected to capitalize on the potentials generated by merging diversified values, which leads the city to have the power of growth with active regeneration.
人材・人流/Diversity
55
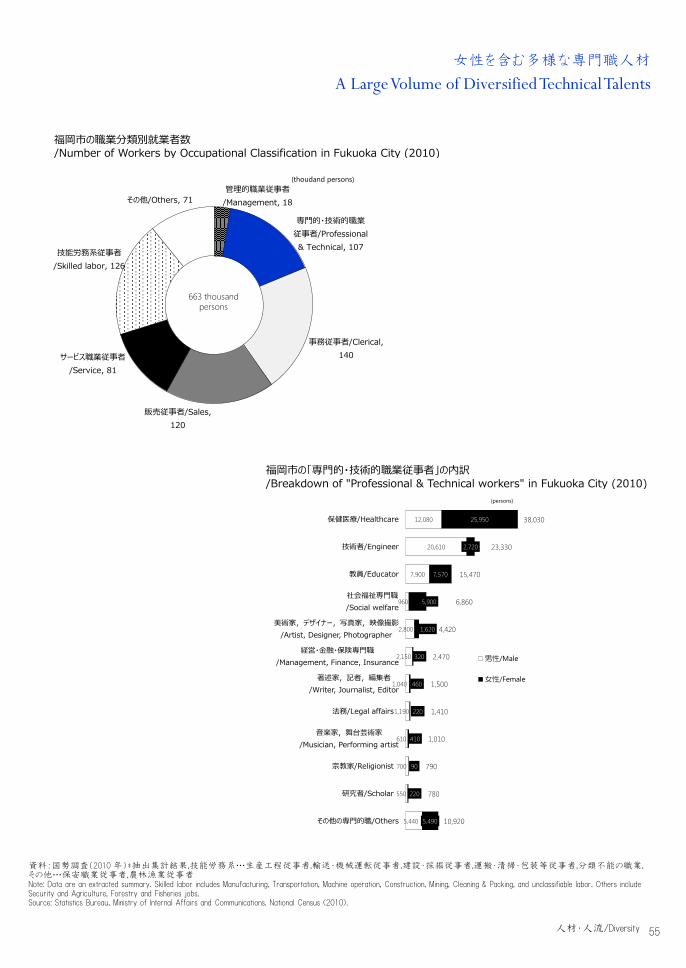
女性を含む多様な専門職人材
A Large Volume of Diversified Technical Talents
12,080
20,610
7,900
960
2,800
2,150
1,040
1,190
610
700
550
5,440
25,950
2,720
7,570
5,900
1,620
320
460
220
410
90
220
5,490
38,030
23,330
15,470
6,860
4,420
2,470
1,500
1,410
1,010
790
780
10,920
保健医療/Healthcare
技術者/Engineer
教員/Educator
社会福祉専門職/Social welfare
美術家,デザイナー,写真家,映像撮影/Artist, Designer, Photographer
経営・金融・保険専門職/Management, Finance, Insurance
著述家,記者,編集者/Writer, Journalist, Editor
法務/Legal affairs
音楽家,舞台芸術家/Musician, Performing artist
宗教家/Religionist
研究者/Scholar
その他の専門的職/Others
男性/Male
女性/Female
(persons)
管理的職業従事者/Management, 18
専門的・技術的職業従事者/Professional & Technical, 107
事務従事者/Clerical, 140
販売従事者/Sales, 120
サービス職業従事者/Service, 81
技能労務系従事者/Skilled labor, 126
その他/Others, 71
(thoudand persons)
663 thousand persons
福岡市の職業分類別就業者数 /Number of Workers by Occupational Classification in Fukuoka City (2010)
福岡市の「専門的・技術的職業従事者」の内訳 /Breakdown of "Professional & Technical workers" in Fukuoka City (2010)
資料:国勢調査(2010 年)*抽出集計結果,技能労務系…生産工程従事者,輸送・機械運転従事者,建設・採掘従事者,運搬・清掃・包装等従事者,分類不能の職業, その他…保安職業従事者,農林漁業従事者 Note: Data are an extracted summary. Skilled labor includes Manufacturing, Transportation, Machine operation, Construction, Mining, Cleaning & Packing, and unclassifiable labor. Others include Security and Agriculture, Forestry and Fisheries jobs. Source: Statistics Bureau, Ministry of Internal Affairs and Communications. National Census (2010).
人材・人流/Diversity

56
専門教育を学ぶ次世代人材の豊富さ
University Students in Diversified Fields
商学・経済・経営学関係/Economics,
Business & Commercial
Science, 20,782
理工学/Science & Engineering,
12,906
情報工学関係/Computer Science,
4,344医歯薬学/Medicine,
Dentistry & Pharmacology,
8,440
教育・保育関係/Pedagogy &
Preschool Education, 5,732
法学/Law, 5,401
人文科学関係/Social Sciences, 7,044
文学・語学/Literature & Linguistics, 3,693
国際文化関係/Intercultural
Communication, 3,381
食物・栄養関係/Food Science & Nutrition,
1,589
芸術関係/Art, 2,338その他/Others, 5,186 (人/persons)
大学生専攻分野University Students80,836人/persons
(福岡都市圏/Fukuoka METRO)
商業実務関係/Business Practice,
4,975
工業関係/Industrial, 3,408
医療関係/Medical, 8,134
衛生関係/Hygiene, 3,444
教育・社会福祉関係/Pedagogy & Social
Welfare, 897
文化・教養関係/Culture & Liberal
Arts, 9,337
服飾・家政関係/Fashion &
Domestic Science, 243
農業関係/Agriculture, 34
分野別専修学校生Training School
Students30,472人/persons
(福岡市/Fukuoka City)
(人/persons)
福岡市都市圏大学・短期大学の専攻分野別学生数 /Number of College and University Students by Major Field in Fukuoka Metropolitan Area (2012)
福岡市の専修学校分野別生徒数 /Number of Training School Students by Major Field in Fukuoka City (2012)
資料:大学…福岡県平成24年度教育便覧をもとに URC において集計,専修学校…福岡市統計書,高等教育機関学生数…学校基本調査(文部科学省・2012 年)Sources: University Students data compiled by URC using Educational Handbook Data (2012 fiscal year) by Fukuoka Prefecture; Training School Students data from Fukuoka City; Ministry of Education, Culture, Sports, Science and Technology, School Basic Survey (2012).
人材・人流/Diversity

57
若い人材の多さ
A Large Number of Young Personnel
154,588
133,917
107,557
100,708
88,143
80,402
73,522
65,607
42,454
東京23区/Tokyo-23
京都市/Kyoto
名古屋市/Nagoya
福岡市/Fukuoka
横浜市/Yokohama
大阪市/Osaka
神戸市/Kobe
札幌市/Sapporo
仙台市/Sendai
広島市/Hiroshima
638,799
(人/persons)
19.5
19.3
18.5
18.4
17.5
17.1
17.0
16.9
16.6
16.1
16.1
16.0
10.0
9.7
9.3
8.7
8.6
8.8
8.6
8.3
8.0
7.7
8.1
8.2
福岡市/Fukuoka
仙台市/Sendai
京都市/Kyoto
川崎市/Kawasaki
東京23区/Tokyo-23
札幌市/Sapporo
大阪市/Osaka
名古屋市/Nagoya
さいたま市/Saitama
横浜市/Yokohama
広島市/Hiroshima
神戸市/Kobe
(%)
女性若者率/Female youth rate
若者率youth rate
高等教育機関等学生等の数【主要大都市比較】 /Number of Students in Higher Educational Institutions, Major Cities (2013)
若者率(15 歳~29 歳人口割合) Ratio of Young Population aged 15 to 29, Major Cities (2010)
資料:学校基本調査(文部科学省・2012 年)*大学生・院生,短大生,専修学校生合計,若者率…国勢調査(2010 年)構成の算出にあたっては総数から年齢不詳を除外している Note: Data excludes person whose age is unknown. Total Number of Undergraduate/graduate students /Junior college students/Specialized training college students. Source: Ministry of Education, Culture, Sports, Science and Technology, School Basic Survey (2012); Statistics Bureau, Ministry of Internal Affairs and Communications. National Census (2010).
人材・人流/Diversity

58
中学以下/Junior high
school or less
10.6
11.1
10.3
10.5
10.4
13.2
16.5
14.9
11.0
10.9
18.2
13.8
高校/High school
35.9
34.9
37.7
39.1
42.4
43.2
40.2
42.0
43.8
48.4
45.1
45.8
短大・高専/Junior college,
Technical college
17.7
18.7
18.6
18.9
19.2
15.8
16.4
16.2
19.1
16.6
15.4
20.1
大学・大学院/Undergraduate,
Graduate
35.8
35.3
33.4
31.6
28.1
27.7
27.0
26.9
26.2
24.2
21.3
20.2
凡例/Legend
東京23区/Tokyo-23
川崎市/Kawasaki
横浜市/Yokohama
さいたま市/Saitama
福岡市/Fukuoka
神戸市/Kobe
名古屋市/Nagoya
京都市/Kyoto
広島市/Hiroshima
仙台市/Sendai
大阪市/Osaka
札幌市/Sapporo
(%)
首都圏に次ぐ大学・大学院卒業者割合
A High Ratio of Graduates of Universities and Graduate Schools
15 歳以上最終卒業学校種類別人口割合 /Educational Level of the Population Aged 15 and Over, by Type of Final Academic Background, Major Cities (2010)
資料:国勢調査(2010 年). Source: Statistics Bureau, Ministry of Internal Affairs and Communications. National Census (2010).
人材・人流/Diversity

59
大学・大学院卒業者の就業先は商業、教育、医療、研究分野など
The Top Places of Employment of University are the Commerce, Education, Medical, and Research Sectors
(%)福岡市/Fukuoka 札幌市/Sapporo 仙台市/Sendai
卸売業,小売業/Commerce 21.6 卸売業,小売業/Commerce 19.3 卸売業,小売業/Commerce 19.6教育,学習支援業/Education, Learning support 10.5 教育,学習支援業
/Education, Learning support 12.4 教育,学習支援業/Education, Learning support 14.4
医療,福祉/Medical, Welfare 10.2 医療,福祉/Medical, Welfare 11.5 医療,福祉/Medical, Welfare 10.6情報通信業/Information, Communications 7.2 学術研究,専門・技術サービス業
/Scientific research 7.1 建設業/Construction 6.7学術研究,専門・技術サービス業/Scientific research 7.0 公務/Public service 6.8 学術研究,専門・技術サービス業
/Scientific research 6.7
東京23区/Tokyo-23 名古屋市/Nagoya 京都市/Kyoto卸売業,小売業/Commerce 15.7 卸売業,小売業/Commerce 20.4 卸売業,小売業/Commerce 17.7情報通信業/Information, Communications 13.6 製造業/Manufacturing 15.8 製造業/Manufacturing 14.5
製造業 10.5 教育,学習支援業/Education, Learning support 9.9 教育,学習支援業
/Education, Learning support 14.1学術研究,専門・技術サービス業/Scientific research 10.0 医療,福祉/Medical, Welfare 8.7 医療,福祉/Medical, Welfare 11.1教育,学習支援業/Education, Learning support 7.2 学術研究,専門・技術サービス業
/Scientific research 6.7 学術研究,専門・技術サービス業/Scientific research 6.6
大阪市/Osaka 広島市/Hiroshima 九州/Kyushu卸売業,小売業/Commerce 20.5 卸売業,小売業/Commerce 20.0 卸売業,小売業/Commerce 17.1
製造業/Manufacturing 14.5 製造業/Manufacturing 11.9 教育,学習支援業/Education, Learning support 14.9
医療,福祉/Medical, Welfare 8.9 教育,学習支援業/Education, Learning support 10.6 医療,福祉/Medical, Welfare 12.5
教育,学習支援業/Education, Learning support 8.3 医療,福祉/Medical, Welfare 9.8 製造業/Manufacturing 9.2学術研究,専門・技術サービス業/Scientific research 7.0 建設業/Construction 6.5 公務/Public service 8.8
大学・大学院卒業者の就業先上位業種【主要大都市比較】 /The top 5 Sectors of Employment of University and Graduate School Graduates, Major Cities (2010)
資料:国勢調査(2010 年). Source: Statistics Bureau, Ministry of Internal Affairs and Communications. National Census (2010).
人材・人流/Diversity
60
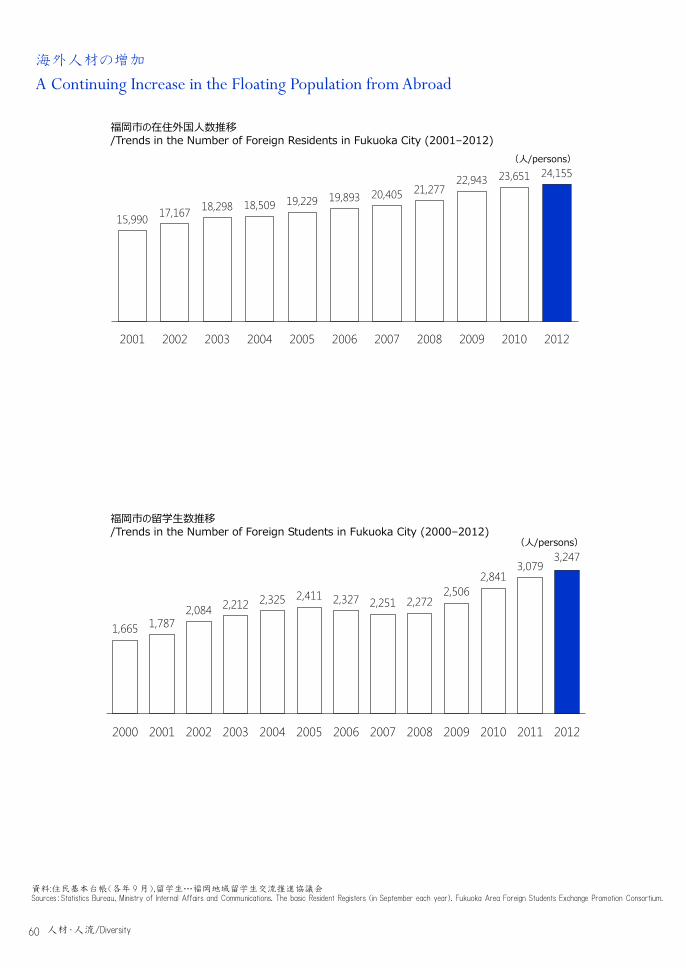
1,665 1,7872,084 2,212 2,325 2,411 2,327 2,251 2,272
2,5062,841
3,0793,247
2000 2001 2002 2003 2004 2005 2006 2007 2008 2009 2010 2011 2012
(人/persons)
15,990 17,167 18,298 18,509 19,229 19,893 20,405 21,27722,943 23,651 24,155
2001 2002 2003 2004 2005 2006 2007 2008 2009 2010 2012
(人/persons)
海外人材の増加
A Continuing Increase in the Floating Population from Abroad
福岡市の在住外国人数推移 /Trends in the Number of Foreign Residents in Fukuoka City (2001–2012)
福岡市の留学生数推移 /Trends in the Number of Foreign Students in Fukuoka City (2000–2012)
資料:住民基本台帳(各年 9 月),留学生…福岡地域留学生交流推進協議会 Sources:Statistics Bureau, Ministry of Internal Affairs and Communications. The basic Resident Registers (in September each year). Fukuoka Area Foreign Students Exchange Promotion Consortium.
人材・人流/Diversity

61
教師 1 人あたり児童・生徒数が減少し細かな教育
Well Resourced Education Shown by Decreases in the Number of Students per Teacher
74,923 74,619 74,757 75,189 75,385 75,719 76,450 76,638 77,215 77,398 77,567 77,517 77,326
22.6 22.3 22.2 22.0 21.5 21.0 20.7 20.7 20.7 20.5 19.9 19.3 19.0
2000 2001 2002 2003 2004 2005 2006 2007 2008 2009 2010 2011 2012
児童数 教師1人あたり児童数 (人/persons)
42,393 41,247 39,861 38,994 38,465 38,356 38,446 38,787 38,924 39,229 39,097 39,393 39,508
16.7 16.6 16.1 15.8 15.5 15.4 15.2 14.9 14.9 15.0 15.0 14.9 14.8
2000 2001 2002 2003 2004 2005 2006 2007 2008 2009 2010 2011 2012
生徒数 教師1人あたり生徒数 (人/persons)
52,116 51,044 49,774 47,892 46,605 45,333 44,230 43,215 42,638 42,472 42,628 42,713 42,689
16.2 15.8 15.6 15.2 15.1 14.8 14.4 14.3 14.2 14.0 14.0 13.8 13.7
2000 2001 2002 2003 2004 2005 2006 2007 2008 2009 2010 2011 2012
生徒数 教師1人あたり生徒数 (人/persons)
福岡市の小学生児童数推移 /Trends in the Number of Elementary School Students in Fukuoka City (2000–2012)
福岡市の中学生徒数推移 /Trends in the Number of Junior High School Students in Fukuoka City (2000–2012)
福岡市の高校生徒数推移 /Trends in Number of High School Students in Fukuoka City (2000~2012)
資料:福岡市 Source: Fukuoka City.
人材・人流/Diversity

62
クリエイティブな価値は、さまざまな関わりによっ
て、より大きなポテンシャルを発揮します。画一化さ
れたものづくりやサービスにも、創造性を加味するこ
とで、差別化や、価格競争とは一線を画する高
付加価値化を実現します。伝統産業に現代的な
価値を付加することで、新たな需要を開拓するな
ど、既存産業との融合による産業の活性化にも
寄与するものです。日本のクリエイティブな評価が
高いのも、創造性と伝統性、文化、そして技術力
を総合的に評価してのものでしょう。
クリエイティブな価値は、人の感性や創造性に
よる部分が大きいことから、取り組み次第では応
用性や汎用性が高く、経済的な波及効果を発揮
するほか、新しい「文化」として国や地域自体の魅
力にもなり得るものです。
国が、「クールジャパン」として、日本のさまざま
なコンテンツを世界に広げようとしていますが、これ
は、クリエイティブな価値が、資源小国と言われる
日本の貴重な輸出資源で、大きな経済波及効
果が期待されるからにほかなりません。
「クールジャパン」は、もともと日本で生まれたア
ニメなどのコンテンツを日本人が楽しんでいたもの
が、インターネット等を通じて世界の目に触れ、評
価されるようになり、改めて、資源としていかそうとす
るものです。日本でその価値を認める「文化」が根
付いていたからこそ、続々生まれる日本独特の文
化を、世界に紹介することができるのです。
才能あるクリエイターがいて、その価値を認める
人が多数いることが「文化」として成立する要件で
す。クリエイティブな産業が集まる福岡市でも、一
部のクリエイターの活動にとどまらず、さまざまな産
業や、多くの市民との関わりによって、「福岡の価
値」として世界に発信することを、市民とともにバッ
クアップするような「地域の文化」を熟成させていく
ことが重要です。
クリエイティブ人材による価値の増幅
Evolution of Industry with Creativity
Creative value could generate a larger economic potential by collaboration with other skills and services. Adding creativity to the standardized manufacturing and service outputs will produce high added value which is clearly different from price competition. Adding modern value to traditional industry will develop new markets, and also contribute to a boost for industry by collaborating with existing firms. The reason why Japanese creativity is highly valued might be the result of a comprehensive evaluation of Japan’s creativity, traditional value, cultural value and technical skills. Human sensitivity and creativity have a lot to do with creative value, which means that it has high applicability and versatility depending on the approach taken. It could generate economic ripple effects, and become an attractive feature of the country or the community as a new “culture”. The Japanese government is trying to promote diversified Japanese media content to the world under the concept of “Cool Japan”. This also indicates that the government is expecting a large economic ripple effect from the creative value which could become a precious export resource of Japan, a country considered small in trade. “Cool Japan” is an attempt to promote media content such as Japanese animation, which was originally enjoyed by Japanese people and later spread around the world through the Internet. Because these kinds of content were already established as a “culture” that people appreciate in Japan, they can be introduced throughout the world as part of a Japanese unique culture. One of the requirements for a “culture” to be established is that there are talented creators as well as many people who appreciate the value of the products that are created. In Fukuoka, where creative industries are accumulating, it is also important for creative resources to collaborate with other industries and diversified people as a “value of Fukuoka”, which can then be matured into a local culture that can be promoted to the world.
人材・人流/Diversity

63
4 万人を超える地方都市最大のクリエイティブ関連産業従事人材
A Large Ratio of Creative Businesses
Business Employees
68,821 828,4942,341 42,048
3.4 5.1繊維工業/Textile 138 1,208楽器製造業/Musical Instrument Manufacturing 1 3放送業/Broadcasting 35 1,494ソフトウェア業/Software 832 20,756情報処理・提供サービス業/Provision of Information,Data Processing and Information Services 240 6,404インターネット附随サービス業/Internet Based Services 106 1,370映像・音声・文字情報制作業/Video, Music, Text Information Production 397 5,346デザイン業/Design 201 858著述・芸術家業/Writing・Art 9 12広告業/Advertising 320 3,439映画館/Film (Cinema) 8 195興行場,興行団/Entertainment Facility (*), Performing Group 54 963
全産業/All Sectorsクリエイティブ関連計/Total of Creative Sectors
比率/Ratio
福岡市のクリエイティブ関連産業(民営)事業所数と従業者数 /Number of Private Businesses & Employees in Creative Industries, Fukuoka City (2012)
クリエイティブ関連「事業所」の 全事業所に占める割合【主要大都市比較】 /Ratio of Creative "Businesses" to All Businesses, Major Cities (2012)
クリエイティブ関連「従業者」の 全事業所に占める割合【主要大都市比較】 /Ratio of Creative "Employees" to All Employees, Major Cities (2012)
資料:平成 24 年経済センサス活動調査 Source: Statistics Bureau, Ministry of Internal Affairs and Communications. Economic Census for Business Activity (2012).
5.8
5.7
4.6
3.4
3.2
2.7
2.5
2.4
2.2
2.1
1.8
1.6
東京23区/Tokyo-23
京都市/Kyoto
大阪市/Osaka
福岡市/Fukuoka
名古屋市/Nagoya
札幌市/Sapporo
仙台市/Sendai
横浜市/Yokohama
広島市/Hiroshima
川崎市/Kawasaki
さいたま市/Saitama
神戸市/Kobe
(%)
(%)
11.0
6.6
6.5
5.1
4.7
4.6
4.3
3.9
3.8
3.3
2.2
2.2
東京23区/Tokyo-23
川崎市/Kawasaki
大阪市/Osaka
福岡市/Fukuoka
名古屋市/Nagoya
横浜市/Yokohama
京都市/Kyoto
札幌市/Sapporo
仙台市/Sendai
広島市/Hiroshima
さいたま市/Saitama
神戸市/Kobe
(%)
人材・人流/Diversity

64
クリエイティブな人材集積と情報発信
Accumulation and Promotion of Creative Talents
fukuoka-game.com
creative-fukuoka.jp/
cl-fuk.jp/
facebook.com/myojowaraku
クリエイティブ・ラボ・フクオカ/Creative Lab Fukuoka
ゲーム・アニメ・映画・音楽・ファッション・デザインなどのクリエイティブ関連産業において、異業種間の交流・連携を通じ、ビジネスの拡大、各業界の垣根を越えた新しいビジネスの創出、国内・海外からの企業進出を促進するなど、クリエイティブ産業を牽引し、地域経済の発展を目指すCreative Lab FukuokaCreative Lab Fukuoka aims the local economic growth in the creative industries, such as game,animation, movies, music, fashion and design, by promoting business expansion and new business development throughcommunication and collaboration among different industries.
福岡ゲーム産業振興機構/Fukuoka GameIndustry PromotionAgency
成長著しい福岡のゲーム制作会社3社による任意の団体GFFが発足(現在11社)。その後九州大学の連携がスタートし、2006年には“九州・福岡を世界が目指すゲーム産業都市にする”を合言葉に、福岡市を加えた三者が連携した「福岡ゲーム産業振興機構」が誕生。日本ゲーム業界史上初の「産・学・官」の連携機構は、全国からも大きな注目を集めているFukuoka Game Industry Promotion AgencyThree fast-growing video game development companies in Fukuoka Cityestablished a voluntary association called Game Factory's Friendship (GFF), currently of 11 member companies. Later, acollaboration between GFF and Kyushu University has started, then in 2006 Fukuoka Game Industry Promotion Agency,a collaborattion of three bodies including Fukuoka City was established with a slogan of "Make Fukuoka, Kyushu be aglobal game industry city." The first collabolation of industry, academia and government in Japanese game industry isnationally remarkable.
クリエイティブ都市・福岡/Creative CityFukuoka
「若い人材が豊かで活気のあるクリエイティブなまち、福岡」から世界中のクリエイターに向けて、「クリエイティブ」をキーワードに、"福岡""日本"そして"世界"のさまざまな情報を発信するキュレーションサイトCreative City FukuokaFrom “Creative city Fukuoka”, a vibrant city with a wealth of young human resources, this curatedwebsite provides creators around the world with a great deal of information about ever-changing creative industry ofFukuoka, Japan and world in accordance with the key word of “creative”.
明星和楽/Myojo Waraku
音楽・動画・ゲーム・インタラクティブなど、あらゆるジャンルから「クリエイティブ」をキーワードに プロ、アマを問わず一同に介し、「掛け合わさることにより新しい価値を生み出すお祭り」。既に京都、台湾でも開催されたMyojo WarakuAt a technology and creative festival, called Myojo Waraku, a variety of professional and non-professionalpresenters and performers from music, video, game and interactive sectors creates scenes to generate new valuecaused by mixing different contents. It has been held in Kyoto and Taiwan as well as in Fukuoka.
福岡市の主なクリエイティブ関連の取り組み /Major Initiatives in the Creative Sector by Fukuoka City
資料:各団体サイト Source: Cited from each website. URC translated when necessary.
人材・人流/Diversity

65
交通・物流 Traffic&Logistics
人とモノのゲートウェイ
Gateway for People and Products
06
66
福岡市には航路、空路、鉄道全てのターミナルが揃い、いずれも都心から近い位置にあります。
また、都市高速道路が都心から広域道路ネットワークにダイレクトにアクセスしています。
コンパクトなエリアに集中するターミナルは、目的地への移動や待ち時間のストレスを軽減し、ビジネス
や観光など、効率的で充実した滞在時間を可能とします。
アジアやヨーロッパの巨大なハブ空港、港湾と直通路線があり、福岡市は、日本と世界の価値を結
びつける窓口として、重要な役割を担っています。
博多港が 1200 年以上の「国際港」としての歴史を持つことは、福岡市が国際的な人流、物流の拠点
として最適な場所であることの証左です。
アジアが急速に成長する今、日本、ヨーロッパとアジアをつなぐ戦略的な拠点として、福岡市は国内で
最適な立地です。
世界へのゲートウェイとして、異なる文化や価値をダイレクトに結びつけ、九州、日本の新しい可能性を
切り開いていきます。
The terminals of major sea, air, and rail routes are located in or near the center of Fukuoka City. Additionally, the Fukuoka Expressway directly connects the city center to the wider regional and national road networks. The terminals located in this compact area relieve people from the stress of transport to or from their destinations, and lets them benefit from a time-efficient stay in the city for both business and leisure. Fukuoka has direct connections to large hub airports in Asia and Europe, and plays an important role as a gateway connecting Japan and the world. Hakata Port has been an International Port for more than 1,200 years. These facilities mean that Fukuoka is the best place as a hub to connect international person trips and logistics. The current rapid growth of the Asian economy also means that Fukuoka is the best location in Japan for a strategic base connecting Japan and Europe and Asia. As a gateway to the world, Fukuoka can also develop new value potential in Kyushu and Japan by directly connecting diversified culture and economic value.
交通・物流/Traffic&Logistics

67
コンパクトなエリアに集中するアクセス拠点 Accessibility to Wider-Area Transportation
福岡市は、国際空港、国際港湾を有し、アジア各地をはじめとした世界とつながり、新幹線や鉄道網、高
速道路網で、九州や国内各地と直接結び付いています。
これらの広域交通結節点は、都心部から間近にあり、広域交通網と域内交通網がスムーズにつながり、域
外から訪れる人にとっても、ストレスのないアクセシビリティを誇ります。
世界とのアクセシビリティに優れることは、国際的な人流の流動性を高め、グローバル経済社会における大き
なアドバンテージとなります。
福岡市は、内外から多くの人が訪れており、こうした人と人の交流が生み出す活力は、都市の成長に大い
に寄与しています。
半径5km圏内の交通ターミナル /Transportation System within a Radius of 5 kilometers
資料:福岡市 Source: Fukuoka City.
Fukuoka has an international airport and port that connect the city to the world, including Asian cities, as well as Shinkansen (bullet trains), a rail network and an expressway network that directly connect the city to other cities in the Kyushu Region and throughout Japan. Nodal points of these wide-area transportation networks are located close to the city center, which enable not only citizens but also visitors to transit smoothly between the wide-area transportation network and the inner city network. The city provides stress-free accessibility. Having good accessibility to the world can improve global people flows, which could be a large advantage for the city in the developing global economic society. A lot of people visit the city, and the vitality generated by the communication among these visitors contributes strongly to the growth of the urban area.
交通・物流/Traffic&Logistics

68
世界に広がるネットワーク Network Expanding Worldwide
Busan
DalianBeijing
ShanghaiWuhan
HonoluluBangkok
Singapore
Guam
HanoiTaipei
QingdaoTianjin
Ho Chi Minh
Manila
Amsterdam
Seoul
区分 行先 1日便数 所要時間Category Destination # of round-trip
ships per dayDuration
(minimum)7 JFs 2:55
1 5:30国際航路
International Route 釜山/Busan
福岡空港の国際航空路線と 1 週間あたり便数 /International Flight Routes from Fukuoka Airport and the Number of Flights per Week
博多港国際航路 /Daily Passenger Ships on the Hakata Port International Route (Hakata, Japan – Busan, Korea)
資料:福岡県空港計画課(2013 年 6 月)*片道 1 便で計算,□は毎日運行路線, 福岡市港湾局(2013 年 8 月)*便数 JF は Jetfoil,所要時間は最短 Note: Counted one way as one flight. Cities surrounded with a blue square are daily flight routes. JF = Jetfoil (a passenger-carrying hydrofoil). Source: Office of Airport Planning and Programming, Fukuoka Prefecture (June 2013); Port & Harbor Bureau, Fukuoka City (August 2013).
交通・物流/Traffic&Logistics
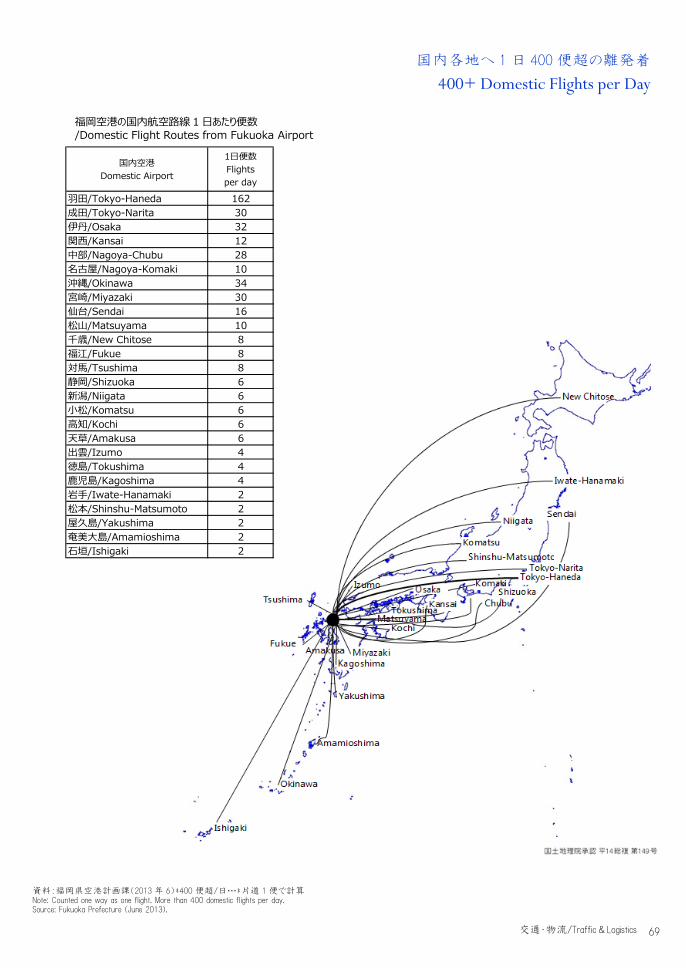
69
国内各地へ 1 日 400 便超の離発着
400+ Domestic Flights per Day
国内空港Domestic Airport
1日便数Flightsper day
羽田/Tokyo-Haneda 162成田/Tokyo-Narita 30伊丹/Osaka 32関西/Kansai 12中部/Nagoya-Chubu 28名古屋/Nagoya-Komaki 10沖縄/Okinawa 34宮崎/Miyazaki 30仙台/Sendai 16松山/Matsuyama 10千歳/New Chitose 8福江/Fukue 8対馬/Tsushima 8静岡/Shizuoka 6新潟/Niigata 6小松/Komatsu 6高知/Kochi 6天草/Amakusa 6出雲/Izumo 4徳島/Tokushima 4鹿児島/Kagoshima 4岩手/Iwate-Hanamaki 2松本/Shinshu-Matsumoto 2屋久島/Yakushima 2奄美大島/Amamioshima 2石垣/Ishigaki 2
福岡空港の国内航空路線 1 日あたり便数 /Domestic Flight Routes from Fukuoka Airport
資料:福岡県空港計画課(2013 年 6)*400 便超/日…*片道 1 便で計算 Note: Counted one way as one flight. More than 400 domestic flights per day. Source: Fukuoka Prefecture (June 2013).
交通・物流/Traffic&Logistics
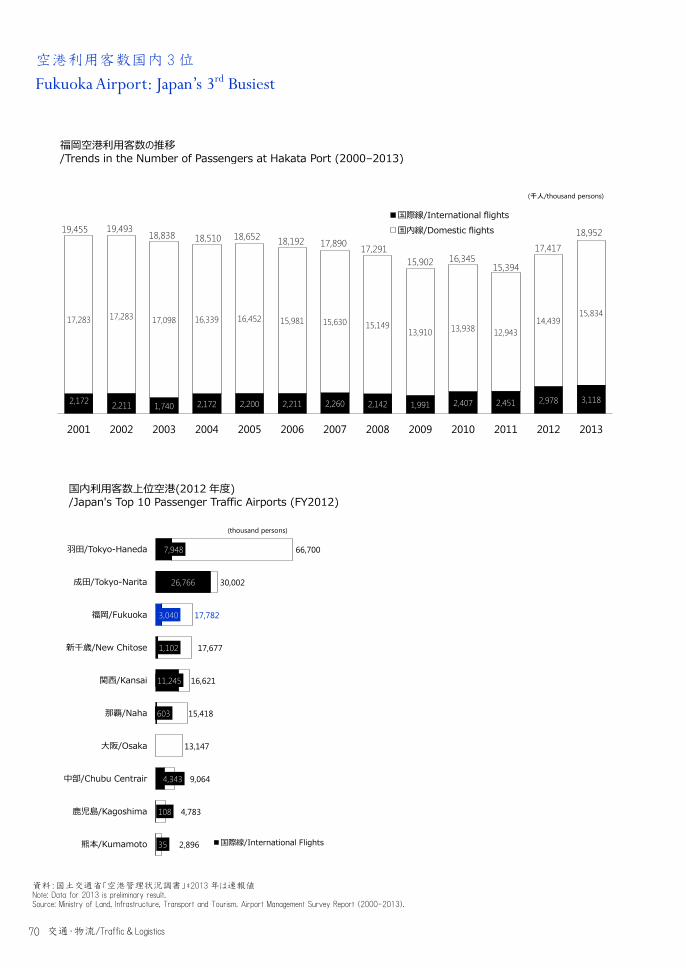
70
空港利用客数国内 3 位
Fukuoka Airport: Japan’s 3rd Busiest
2,172 2,211 1,740 2,172 2,200 2,211 2,260 2,142 1,991 2,407 2,451 2,978 3,118
17,283 17,283 17,098 16,339 16,452 15,981 15,630 15,14913,910 13,938 12,943
14,43915,834
19,455 19,49318,838 18,510 18,652 18,192 17,890 17,291
15,902 16,34515,394
17,417
18,952
2001 2002 2003 2004 2005 2006 2007 2008 2009 2010 2011 2012 2013
国際線/International flights国内線/Domestic flights
(千人/thousand persons)
国内利用客数上位空港(2012 年度) /Japan's Top 10 Passenger Traffic Airports (FY2012)
福岡空港利用客数の推移 /Trends in the Number of Passengers at Hakata Port (2000–2013)
資料:国土交通省「空港管理状況調書」*2013 年は速報値 Note: Data for 2013 is preliminary result. Source: Ministry of Land, Infrastructure, Transport and Tourism. Airport Management Survey Report (2000-2013).
7,948
26,766
3,040
1,102
11,245
603
4,343
108
35
66,700
30,002
17,782
17,677
16,621
15,418
13,147
9,064
4,783
2,896
羽田/Tokyo-Haneda
成田/Tokyo-Narita
福岡/Fukuoka
新千歳/New Chitose
関西/Kansai
那覇/Naha
大阪/Osaka
中部/Chubu Centrair
鹿児島/Kagoshima
熊本/Kumamoto 国際線/International Flights
(thousand persons)
交通・物流/Traffic&Logistics
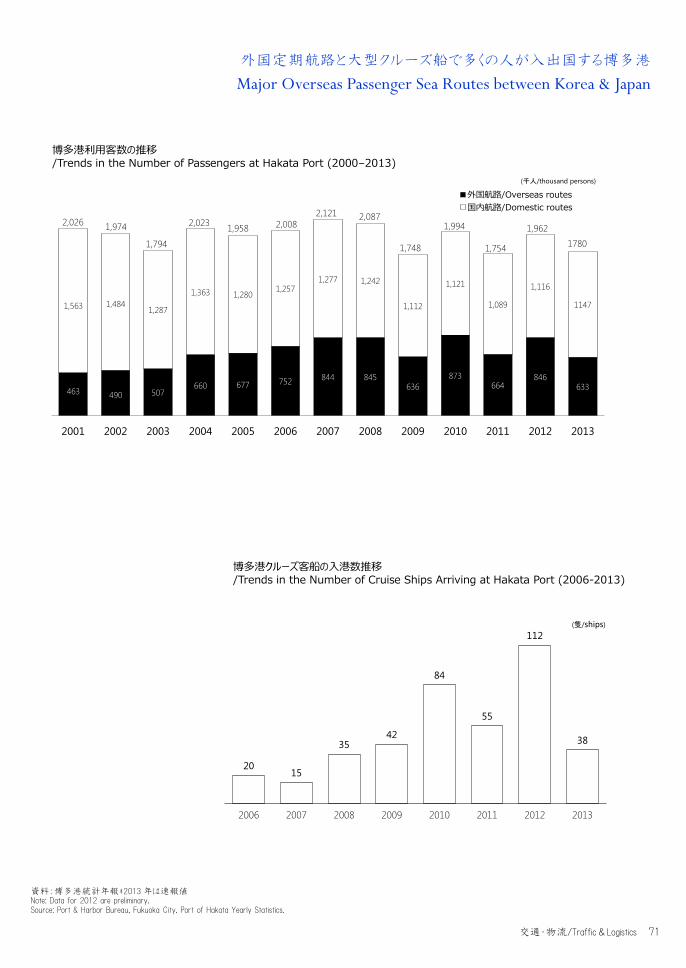
71
外国定期航路と大型クルーズ船で多くの人が入出国する博多港
Major Overseas Passenger Sea Routes between Korea & Japan
20 15
35 42
84
55
112
38
2006 2007 2008 2009 2010 2011 2012 2013
(隻/ships)
463 490 507660 677 752 844 845
636873
664846
633
1,563 1,4841,287
1,363 1,2801,257
1,277 1,242
1,112
1,121
1,089
1,116
1147
2,026 1,974
1,794
2,023 1,958 2,0082,121 2,087
1,748
1,994
1,754
1,962
1780
2001 2002 2003 2004 2005 2006 2007 2008 2009 2010 2011 2012 2013
外国航路/Overseas routes国内航路/Domestic routes
(千人/thousand persons)
博多港利用客数の推移 /Trends in the Number of Passengers at Hakata Port (2000–2013)
博多港クルーズ客船の入港数推移 /Trends in the Number of Cruise Ships Arriving at Hakata Port (2006-2013)
資料:博多港統計年報*2013 年は速報値 Note: Data for 2012 are preliminary. Source: Port & Harbor Bureau, Fukuoka City. Port of Hakata Yearly Statistics.
交通・物流/Traffic&Logistics
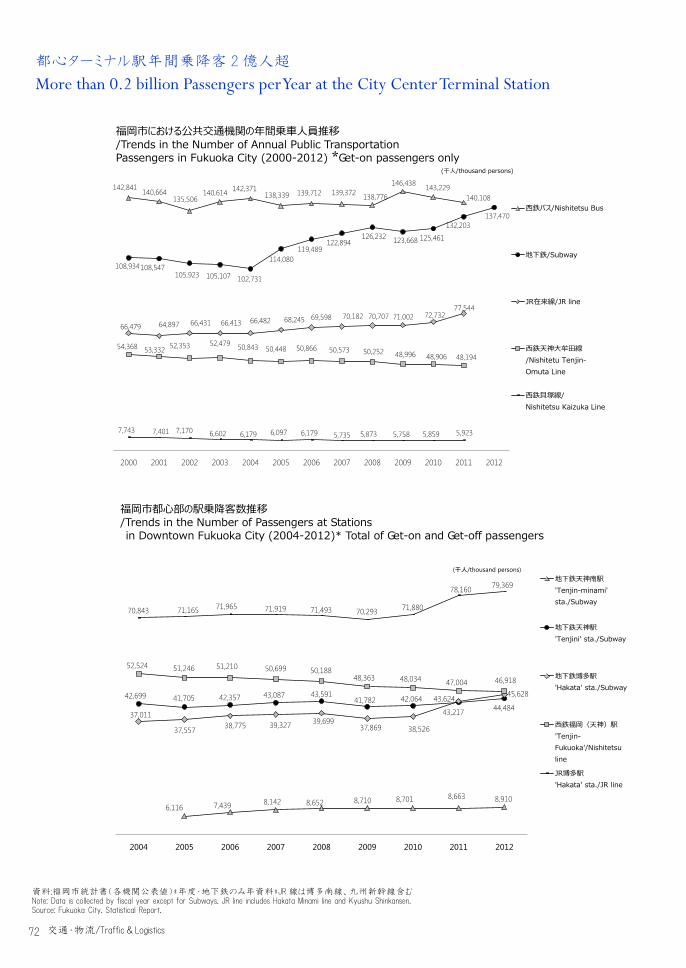
72
都心ターミナル駅年間乗降客 2 億人超
More than 0.2 billion Passengers per Year at the City Center Terminal Station
142,841140,664
135,506140,614 142,371
138,339 139,712 139,372 138,776
146,438 143,229140,108
108,934108,547105,923 105,107 102,731
114,080119,489
122,894126,232 123,668 125,461
132,203137,470
66,479 64,897 66,431 66,413 66,482 68,245 69,598 70,182 70,707 71,002 72,73277,544
54,368 53,332 52,353 52,479 50,843 50,448 50,866 50,573 50,252 48,996 48,906 48,194
7,743 7,401 7,170 6,602 6,179 6,097 6,179 5,735 5,873 5,758 5,859 5,923
2000 2001 2002 2003 2004 2005 2006 2007 2008 2009 2010 2011 2012
西鉄バス/Nishitetsu Bus
地下鉄/Subway
JR在来線/JR line
西鉄天神大牟田線/Nishitetu Tenjin-Omuta Line
西鉄貝塚線/Nishitetsu Kaizuka Line
(千人/thousand persons)
6,116 7,439 8,142 8,652 8,710 8,701 8,663 8,910
42,699 41,705 42,357 43,087 43,59141,782 42,064
43,217 44,48437,011
37,557 38,775 39,327 39,69937,869 38,526
43,624 45,628
52,524 51,246 51,210 50,699 50,18848,363 48,034 47,004 46,918
70,843 71,165 71,965 71,919 71,493 70,293 71,880
78,160 79,369
2004 2005 2006 2007 2008 2009 2010 2011 2012
地下鉄天神南駅'Tenjin-minami' sta./Subway
地下鉄天神駅'Tenjini' sta./Subway
地下鉄博多駅'Hakata' sta./Subway
西鉄福岡(天神)駅'Tenjin-Fukuoka'/Nishitetsu line
JR博多駅'Hakata' sta./JR line
(千人/thousand persons)
福岡市における公共交通機関の年間乗車人員推移 /Trends in the Number of Annual Public Transportation Passengers in Fukuoka City (2000-2012) *Get-on passengers only
福岡市都心部の駅乗降客数推移 /Trends in the Number of Passengers at Stations in Downtown Fukuoka City (2004-2012)* Total of Get-on and Get-off passengers
資料;福岡市統計書(各機関公表値)*年度・地下鉄のみ年資料*JR 線は博多南線、九州新幹線含む Note: Data is collected by fiscal year except for Subways. JR line includes Hakata Minami line and Kyushu Shinkansen. Source: Fukuoka City. Statistical Report.
交通・物流/Traffic&Logistics
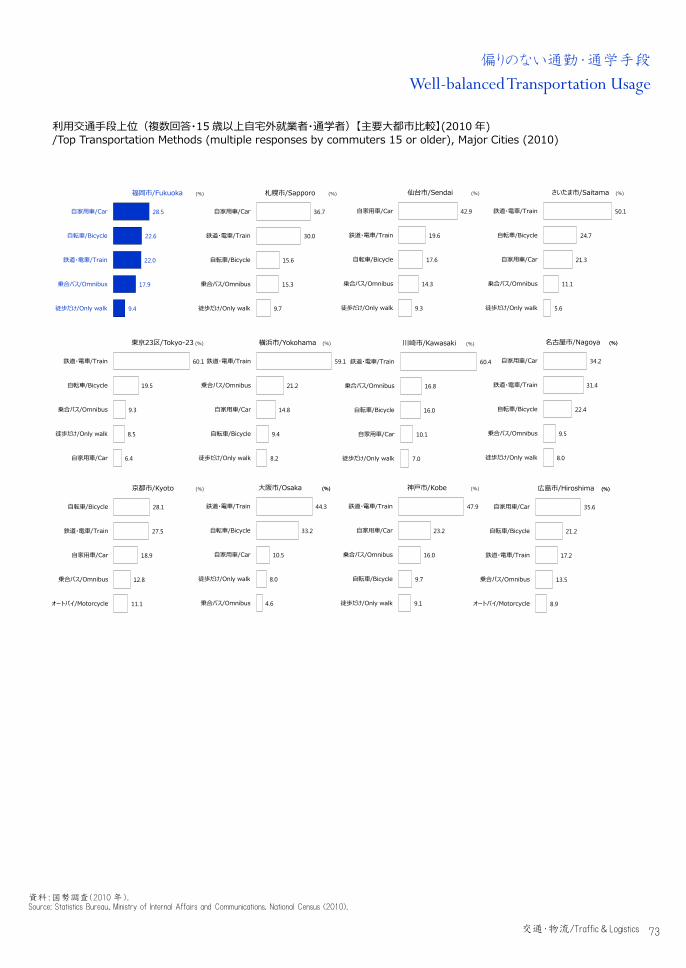
73
偏りのない通勤・通学手段
Well-balanced Transportation Usage
28.5
22.6
22.0
17.9
9.4
自家用車/Car
自転車/Bicycle
鉄道・電車/Train
乗合バス/Omnibus
徒歩だけ/Only walk
福岡市/Fukuoka (%)
36.7
30.0
15.6
15.3
9.7
自家用車/Car
鉄道・電車/Train
自転車/Bicycle
乗合バス/Omnibus
徒歩だけ/Only walk
札幌市/Sapporo (%)
42.9
19.6
17.6
14.3
9.3
自家用車/Car
鉄道・電車/Train
自転車/Bicycle
乗合バス/Omnibus
徒歩だけ/Only walk
仙台市/Sendai (%)
50.1
24.7
21.3
11.1
5.6
鉄道・電車/Train
自転車/Bicycle
自家用車/Car
乗合バス/Omnibus
徒歩だけ/Only walk
さいたま市/Saitama (%)
47.9
23.2
16.0
9.7
9.1
鉄道・電車/Train
自家用車/Car
乗合バス/Omnibus
自転車/Bicycle
徒歩だけ/Only walk
神戸市/Kobe (%)
60.1
19.5
9.3
8.5
6.4
鉄道・電車/Train
自転車/Bicycle
乗合バス/Omnibus
徒歩だけ/Only walk
自家用車/Car
東京23区/Tokyo-23 (%)
59.1
21.2
14.8
9.4
8.2
鉄道・電車/Train
乗合バス/Omnibus
自家用車/Car
自転車/Bicycle
徒歩だけ/Only walk
横浜市/Yokohama (%)
60.4
16.8
16.0
10.1
7.0
鉄道・電車/Train
乗合バス/Omnibus
自転車/Bicycle
自家用車/Car
徒歩だけ/Only walk
川崎市/Kawasaki (%)
34.2
31.4
22.4
9.5
8.0
自家用車/Car
鉄道・電車/Train
自転車/Bicycle
乗合バス/Omnibus
徒歩だけ/Only walk
名古屋市/Nagoya (%)(%)
44.3
33.2
10.5
8.0
4.6
鉄道・電車/Train
自転車/Bicycle
自家用車/Car
徒歩だけ/Only walk
乗合バス/Omnibus
大阪市/Osaka (%)(%)
28.1
27.5
18.9
12.8
11.1
自転車/Bicycle
鉄道・電車/Train
自家用車/Car
乗合バス/Omnibus
オートバイ/Motorcycle
京都市/Kyoto (%)
35.6
21.2
17.2
13.5
8.9
自家用車/Car
自転車/Bicycle
鉄道・電車/Train
乗合バス/Omnibus
オートバイ/Motorcycle
広島市/Hiroshima (%)(%)
利用交通手段上位(複数回答・15 歳以上自宅外就業者・通学者)【主要大都市比較】(2010 年) /Top Transportation Methods (multiple responses by commuters 15 or older), Major Cities (2010)
資料:国勢調査(2010 年). Source: Statistics Bureau, Ministry of Internal Affairs and Communications. National Census (2010).
交通・物流/Traffic&Logistics
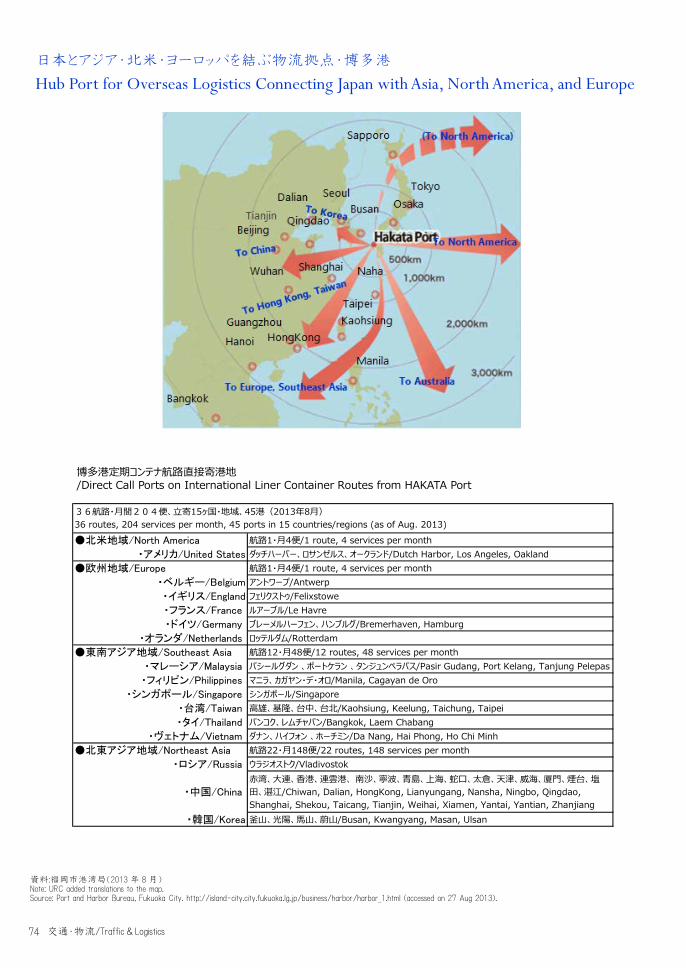
74
日本とアジア・北米・ヨーロッパを結ぶ物流拠点・博多港
Hub Port for Overseas Logistics Connecting Japan with Asia, North America, and Europe
●北米地域/North America 航路1・月4便/1 route, 4 services per month・アメリカ/United States ダッチハーバー、ロサンゼルス、オークランド/Dutch Harbor, Los Angeles, Oakland
●欧州地域/Europe 航路1・月4便/1 route, 4 services per month・ベルギー/Belgium アントワープ/Antwerp・イギリス/England フェリクストゥ/Felixstowe・フランス/France ルアーブル/Le Havre・ドイツ/Germany ブレーメルハーフェン、ハンブルグ/Bremerhaven, Hamburg
・オランダ/Netherlands ロッテルダム/Rotterdam●東南アジア地域/Southeast Asia 航路12・月48便/12 routes, 48 services per month
・マレーシア/Malaysia パシールグダン 、ポートケラン 、タンジュンペラパス/Pasir Gudang, Port Kelang, Tanjung Pelepas・フィリピン/Philippines マニラ、カガヤン・デ・オロ/Manila, Cagayan de Oro
・シンガポール/Singapore シンガポール/Singapore・台湾/Taiwan 高雄、基隆、台中、台北/Kaohsiung, Keelung, Taichung, Taipei・タイ/Thailand バンコク、レムチャバン/Bangkok, Laem Chabang
・ヴェトナム/Vietnam ダナン、ハイフォン 、ホーチミン/Da Nang, Hai Phong, Ho Chi Minh●北東アジア地域/Northeast Asia 航路22・月148便/22 routes, 148 services per month
・ロシア/Russia ウラジオストク/Vladivostok
・中国/China 赤湾、大連、香港、連雲港、 南沙、寧波、青島、上海、蛇口、太倉、天津、威海、厦門、煙台、塩田、湛江/Chiwan, Dalian, HongKong, Lianyungang, Nansha, Ningbo, Qingdao,Shanghai, Shekou, Taicang, Tianjin, Weihai, Xiamen, Yantai, Yantian, Zhanjiang
・韓国/Korea 釜山、光陽、馬山、蔚山/Busan, Kwangyang, Masan, Ulsan
36航路・月間204便、立寄15ヶ国・地域、45港(2013年8月)36 routes, 204 services per month, 45 ports in 15 countries/regions (as of Aug. 2013)
博多港定期コンテナ航路直接寄港地 /Direct Call Ports on International Liner Container Routes from HAKATA Port
資料:福岡市港湾局(2013 年 8 月) Note: URC added translations to the map. Source: Port and Harbor Bureau, Fukuoka City. http://island-city.city.fukuoka.lg.jp/business/harbor/harbor_1.html (accessed on 27 Aug 2013).
交通・物流/Traffic&Logistics
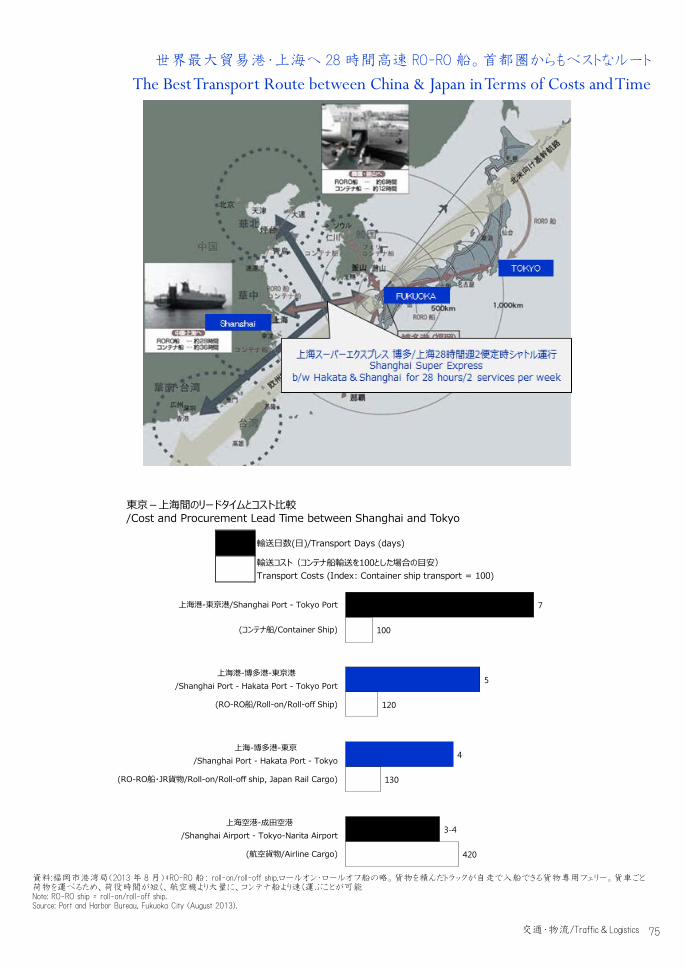
75
世界最大貿易港・上海へ 28 時間高速 RO-RO 船。首都圏からもベストなルート
The Best Transport Route between China & Japan in Terms of Costs and Time
東京-上海間のリードタイムとコスト比較 /Cost and Procurement Lead Time between Shanghai and Tokyo
資料:福岡市港湾局(2013 年 8 月)*RO-RO 船: roll-on/roll-off ship.ロールオン・ロールオフ船の略。貨物を積んだトラックが自走で入船できる貨物専用フェリー。貨車ごと荷物を運べるため、荷役時間が短く、航空機より大量に、コンテナ船より速く運ぶことが可能 Note: RO-RO ship = roll-on/roll-off ship. Source: Port and Harbor Bureau, Fukuoka City (August 2013).
7
100
5
120
4
130
3-4
420
上海港-東京港/Shanghai Port - Tokyo Port
(コンテナ船/Container Ship)
上海港-博多港-東京港/Shanghai Port - Hakata Port - Tokyo Port
(RO-RO船/Roll-on/Roll-off Ship)
上海-博多港-東京/Shanghai Port - Hakata Port - Tokyo
(RO-RO船・JR貨物/Roll-on/Roll-off ship, Japan Rail Cargo)
上海空港-成田空港/Shanghai Airport - Tokyo-Narita Airport
(航空貨物/Airline Cargo)
輸送日数(日)/Transport Days (days)
輸送コスト(コンテナ船輸送を100とした場合の目安)Transport Costs (Index: Container ship transport = 100)
交通・物流/Traffic&Logistics
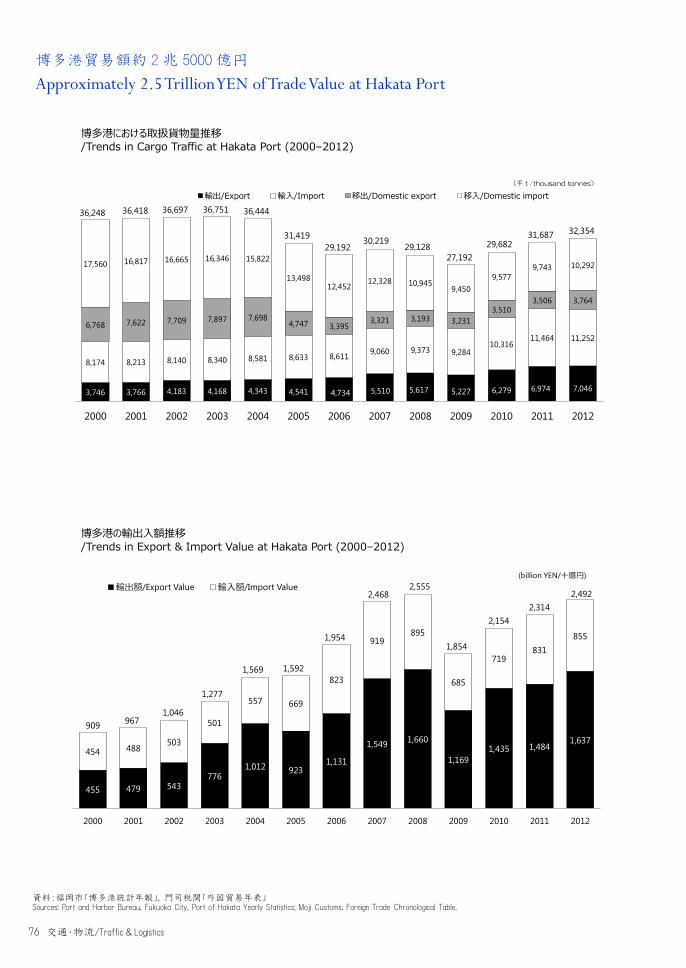
76
博多港貿易額約 2 兆 5000 億円 Approximately 2.5 Trillion YEN of Trade Value at Hakata Port
3,746 3,766 4,183 4,168 4,343 4,541 4,734 5,510 5,617 5,227 6,279 6,974 7,046
8,174 8,213 8,140 8,340 8,581 8,633 8,611 9,060 9,373 9,28410,316
11,464 11,2526,768 7,622 7,709 7,897 7,698
4,747 3,3953,321 3,193 3,231
3,5103,506 3,764
17,560 16,817 16,665 16,346 15,822
13,49812,452 12,328 10,945
9,4509,577
9,743 10,292
36,248 36,418 36,697 36,751 36,444
31,41929,192
30,21929,128
27,19229,682
31,687 32,354
2000 2001 2002 2003 2004 2005 2006 2007 2008 2009 2010 2011 2012
(千t/thousand tonnes)
輸出/Export 輸入/Import 移出/Domestic export 移入/Domestic import
455 479 543776
1,012 9231,131
1,549 1,660
1,1691,435 1,484
1,637454 488
503
501
557 669
823
919895
685
719831
855
909 9671,046
1,277
1,569 1,592
1,954
2,4682,555
1,854
2,1542,314
2,492
2000 2001 2002 2003 2004 2005 2006 2007 2008 2009 2010 2011 2012
(billion YEN/十億円)輸出額/Export Value 輸入額/Import Value
博多港における取扱貨物量推移 /Trends in Cargo Traffic at Hakata Port (2000–2012)
博多港の輸出入額推移 /Trends in Export & Import Value at Hakata Port (2000–2012)
資料:福岡市「博多港統計年報」, 門司税関「外国貿易年表」 Sources: Port and Harbor Bureau, Fukuoka City. Port of Hakata Yearly Statistics; Moji Customs. Foreign Trade Chronological Table.
交通・物流/Traffic&Logistics

77
福岡空港貿易額約 9000 億円
Approximately 900 Billion YEN of Trade Value at Fukuoka Airport
5632
50 56 61 61 60 57 50 43 53 48 48
215
159
176
215 200 200 202 207 207190
192 190 193
271
190
225
271260 260 262 264 257
232245 238 242
2000 2001 2002 2003 2004 2005 2006 2007 2008 2009 2010 2011 2012
(千t/thousand tonnes)国際線/International flights 国内線/Domestic flights
845 769932
720629
770 756 799 752
533 607 569 531
248243
283
286309
392539 520
451
293349
304 367
1,0931,013
1,214
1,006937
1,161
1,295 1,319
1,203
826
956873 898
2000 2001 2002 2003 2004 2005 2006 2007 2008 2009 2010 2011 2012
(十億円/billion YEN)輸出額/Export Value 輸入額/Import Value
福岡空港における取扱貨物量推移 /Trends in Cargo Traffic at Fukuoka Airport (2000–2012)
福岡空港の輸出入額推移 /Trends in Export & Import Value at Fukuoka Airport (2000–2012)
資料:国土交通省「大阪航空局空港管理状況調書」, 門司税関「外国貿易年表」 Sources: Ministry of Land, Infrastructure, Transport and Tourism. Osaka Regional Civil Aviation Bureau, Airport Management Survey Report; Moji Customs. Foreign Trade Chronological Table.
交通・物流/Traffic&Logistics
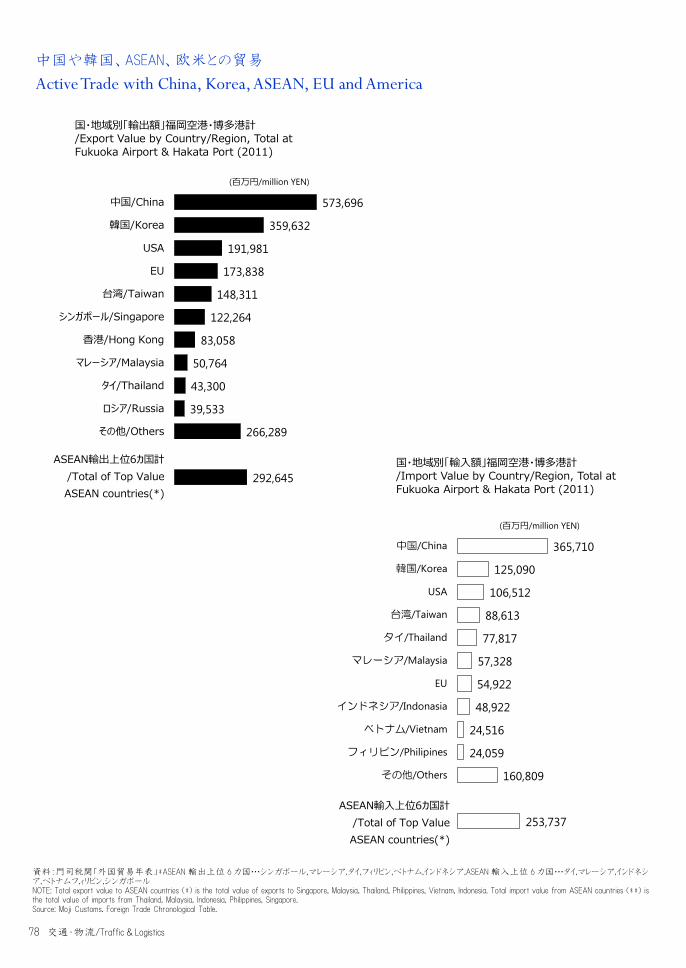
78
中国や韓国、ASEAN、欧米との貿易
Active Trade with China, Korea, ASEAN, EU and America
573,696
359,632
191,981
173,838
148,311
122,264
83,058
50,764
43,300
39,533
266,289
292,645
中国/China
韓国/Korea
USA
EU
台湾/Taiwan
シンガポール/Singapore
香港/Hong Kong
マレーシア/Malaysia
タイ/Thailand
ロシア/Russia
その他/Others
(百万円/million YEN)
ASEAN輸出上位6カ国計/Total of Top ValueASEAN countries(*)
365,710
125,090
106,512
88,613
77,817
57,328
54,922
48,922
24,516
24,059
160,809
253,737
中国/China
韓国/Korea
USA
台湾/Taiwan
タイ/Thailand
マレーシア/Malaysia
EU
インドネシア/Indonasia
ベトナム/Vietnam
フィリピン/Philipines
その他/Others
(百万円/million YEN)
ASEAN輸入上位6カ国計/Total of Top ValueASEAN countries(*)
国・地域別「輸出額」福岡空港・博多港計 /Export Value by Country/Region, Total at Fukuoka Airport & Hakata Port (2011)
国・地域別「輸入額」福岡空港・博多港計 /Import Value by Country/Region, Total at Fukuoka Airport & Hakata Port (2011)
資料:門司税関「外国貿易年表」*ASEAN 輸出上位 6 カ国…シンガポール,マレーシア,タイ,フィリピン,ベトナム,インドネシア,ASEAN 輸入上位 6 カ国…タイ,マレーシア,インドネシア,ベトナムフ,ィリピン,シンガポール NOTE: Total export value to ASEAN countries (*) is the total value of exports to Singapore, Malaysia, Thailand, Philippines, Vietnam, Indonesia. Total import value from ASEAN countries (**) is the total value of imports from Thailand, Malaysia, Indonesia, Philippines, Singapore. Source: Moji Customs. Foreign Trade Chronological Table. 交通・物流/Traffic&Logistics
79
都市の吸引力 Attractive Force
人や投資が集まり加速する都市の成長
The Attractive Force of an Urban City
07
80
グローバル経済において、対内投資が地域にもたらすメリットとして、資金や技術、ノウハウの移転などを通
じて地域企業の生産性向上が図られ、企業利益率の改善が期待されるほか、雇用面でも、質的、量的な
効果が期待されることは言うまでもありません。
また、事業や不動産に対する投資にかかる資金の調達が、過去には銀行など金融機関による融資や株
式発行による「間接金融」が中心だったものが、買い余力のある海外投資家や企業などの投資資金を呼び
込む「直接金融」の重要性が増しています。
こうした動きを踏まえ、国も、2011 年から対日投資促進プログラム(内閣府)による投資受入促進のための
取り組みを強化しており、今後の対内直接投資受入の拡大が期待されます。
福岡市は、2013 年、海外からの高額不動産投資が相次ぐなど、投資対象地域としての存在感を示しつ
つあります。国内では、東京と比較して物価が安い地方都市に、投資対象を探す目が移り、地方都市の中
では最も成長可能性のある都市として、福岡市の地域としての投資適格性が評価されたものと考えられま
す。
福岡市は、全国一の単身世帯比率、賃貸住宅世帯比率、マンション世帯比率で、それだけ投資対象と
なる居住用不動産物件が供給されやすい環境にあるといえます。このほか、商業・サービス業の集積による
オフィスビル、商業施設におけるテナント需要など、不動産投資先としてのさまざまな優位性を有しています。
投資と金融は切り離せない関係にありますが、福岡市は、九州の経済活動の中心として、地元金融機
関等に多くの資金が集まる状況にあるほか、投資機関、投資支援機関も多数立地しており、福岡・九州の
地域性を重視した投資支援機関があるのも特徴です。これら地域の金融機関や投資支援機関は、福岡市
の実情を詳細に把握しており、域外からの投資を呼び込む際に求められるさまざまな情報を有しています。
投資家や金融専門家は、常に投資先の情報を欲しており、投資対象地域に関する情報へのニーズは高
いものと考えられ、地域と域外の、専門家や投資家らの情報交換などの交流が促進される機会や場が増
えることで、さらに大きな事業開発や投資の可能性が広がります。
福岡市は、重要政策の中に「MICE 機能の強化」と「スタートアップ都市づくり」を掲げていますが、コンベン
ションや見本市はビジネスの相手や投資先を見つける場として、スタートアップは、ベンチャー起業家等に対
する資金を集めるために、域外の金融や投資関係機関、専門家の集積が進むことは、これらの政策を加速
させるためにも効果が大きいものと考えられます。
都市の吸引力/Attractive Force

81
In the global economy, inward investment brings productive improvement to local business through funding and transferring skills and know-how, and improvements in business profitability can be expected. It goes without saying that qualitative and quantitative impacts on employment can also be expected. Fundraising for investment in business or real estate assets has been made mainly by “indirect finance”, that is loans from financial institutions or stock issues, but “direct finance” that calls in investment capital from overseas investors or enterprises who have buying power, has been rising. Based on these trends, the national government has also focused on initiatives to encourage direct investment through the Inward Investment Promotion Program (Cabinet Office) since 2011, and the further expansion of inward direct investment can be expected. In Fukuoka City, high-priced real estate investments from abroad were made one after another in 2013, and the city is becoming a targeted region for investors. In Japan also, investors have started to look for investment opportunities in provincial cities where prices are relatively lower than in Tokyo. In this respect Fukuoka has the highest growth potential of the provincial cities of Japan, as well as high qualifications for investment. Fukuoka has the highest rate of single-person households, rental houses, and condominiums in Japan, which indicates that the city has an environment where residential real estate properties can easily be provided. Additionally, there are office buildings developed by the commerce and service sectors, as well as tenant demands at commercial facilities, which indicate that the city has a variety of advantages as a real estate investment outlet. Investment and finance are inseparable. As a center of economic activity in the Kyushu Region, Fukuoka is where a lot of capital is gathering in local financial institutions. Many investment institutions and investment support institutions are also located in Fukuoka, and these set high values on the local features of Fukuoka and the Kyushu Region. Local financial and investment support institutions grasp the conditions of Fukuoka in detail, and deliver a variety of necessary information when attracting investment from outside. Investors and financial specialists are always looking for this information. The need for information on the area of investment is considered to be high. An increase in opportunities or places which encourage financial specialists and investors in and outside Fukuoka to exchange information and communicate would expand the city’s potential for larger project developments or investment. Fukuoka initiative in promoting inward investment, including subsidies on site location, and the accumulation of financing and investment capital led mainly by the private sector, can accelerate economic development in the city. Fukuoka has set “Enforcement of MICE function” and “Development of Startup City” as key policies. Conventions and exhibitions function as places to find business partners or investment outlets to attract financial or investment specialists, while startup businesses create opportunities to raise funds from financial institutions or investment institutions. Further accumulation of these specialists and institutions would have a great impact on accelerating these policies.
都市の吸引力/Attractive Force

82
福岡の金融機関に集まる豊富な資金
Plenty of Funds Available to Financial Institutions in Fukuoka
19,564 15,474
41,745
29,133
預金額/Deposits
貸出額/Loans and bills discounted
九州/Kyushu region福岡県/Fukuoka prefecture
(十億円/billion YEN)
福岡県と九州の預金額・貸出金額 /The Amount of Deposits and Loans in Fukuoka Prefecture and Kyushu Region (September 2013)
福岡県の業態別「預金額」割合 /The Ratio of Deposit Amounts by Industry in Fukuoka Prefecture (March 2013)
福岡県の業態別「貸出額」割合 /The Ratio of Loan Amounts by Industry in Fukuoka Prefecture (March 2013)
資料:日本銀行 Source: Bank of Japan.
都市銀行・託銀行
/City bank, Trust bank
12.3
37.1
7.2
地方銀行/Regional
bank
63.8
26.5
59.0
第二地銀/2nd
Regionalbank
2.6
7.0
7.2
その他銀行
/Otherbank
信用金庫/Credit
association
6.4
14.4
7.1
信用組合/credit union
労働金庫/Loborbank
農協/AgriculturalCo-operatives
10.6
8.7
13.5
凡例/Legend
福岡県/Fukuoka pref.
全国/Japan
九州・沖縄/Kyushu,Okinawa
(%)
都市銀行・託銀行
/City bank, Trust bank
13.4
38.8
7.8
地方銀行/Regional
bank
70.4
31.4
64.5
第二地銀/2nd
Regionalbank
3.3
8.6
9.2
その他銀行
/Otherbank
信用金庫/Credit
association
4.9
12.0
6.4
信用組合/credit union
労働金庫/Loborbank
農協/AgriculturalCo-operatives
5.2
3.6
7.0
凡例/Legend
福岡県/Fukuoka pref.
全国/Japan
九州・沖縄/Kyushu,Okinawa
(%)
都市の吸引力/Attractive Force

83
金融機関・投資支援機関の集積
Accumulation of Financial and Investment Support Institutions
国内銀行等の総資産額上位 /Top Domestic Banks by Value of Total Assets (2013)
主な公的金融・投資支援機関/The main public financial and investment support organizations日本銀行福岡支店/Bunk of Japan Fukuoka branchJETRO福岡/ Japan External Trade Organization Fukuoka
福岡証券取引所/Fukuoka Stock Exchange
福岡市外国企業・投資誘致センター/New Industry & Investment Promotion Department, Economy, Visitor/Tourism & Culture Bureau Fukuoka City釜山・福岡経済協力事務所/Fukuoka and Busan economic cooperation office
(株)ドーガン・アドバイザーズ/DOGAN, Inc.
九州ベンチャーパートナーズ株式会社/Kyushu Venture Partners Co.,Ltd.
福岡リート投資法人/Fukuoka REIT Corporation
福岡・九州に特化した主な民間投資・支援機関/Major private investment and support organization that specializes in Fukuoka, Kyushu
2,709,402
2,049,810
1,718,045
941,615
498,101
438,388
407,798
351,366
155,618
153,409
89,827
(1)三菱UFJフィナンシャルグループ<東京都>/Mitsubishi UFJ Financial Group(Tokyo)
(2)みずほフィナンシャルグループ<東京都>/Mizuho Financial Group(Tokyo)
(3)三井住友フィナンシャルグループ<東京都>/Sumitomo Mitsui Financial Group(Tokyo)
(4)農林中央金庫<東京都>/Norinchukin Bank(Tokyo)
(5)りそなホールディングス<東京都>/Resona Holdings(Tokyo)
(6)野村ホールディングス<東京都>/Nomura Holdings(Tokyo)
(7)三井住友信託銀行<東京都>/Sumitomo Mitsui Trust Bank(Tokyo)
(8)信金中央金庫<東京都>/Shinkin Central Bank(Tokyo)
(9)横浜銀行※<横浜市>/Bank of Yokohama(Yokohama)
(10)ふくおかフィナンシャルグループ※<福岡市>/Fukuoka Financial Group(Fukuoka)
(20)西日本シティ銀行※<福岡市>Nishi-Nippon City Bank(Fukuoka)
(百万USドル/$mm)
資産資料:「The Banker」(英 Financial Times)*( )は国内順位 < >は本店・本社所在地,※は地方銀行,調査対象に「ゆうちょ銀行」は含まれないが総資産約 2 兆ドル(2012 年)は 3 位相当)、金融・投資機関資料:各機関概要 Note: The number in brackets is a domestic ranking. City name in brackets is the place where headquarters are located. A bank listed with an “※”is a regional bank. Japan Post Bank is not included in this list, but its amount of total assets is approximately 2 trillion dollars (2012), which is equivalent to No.3 in this ranking. Source for assets: Financial Times, The Banker; Source for financial and investment organizations: Summary Reports of each organization.
都市の吸引力/Attractive Force
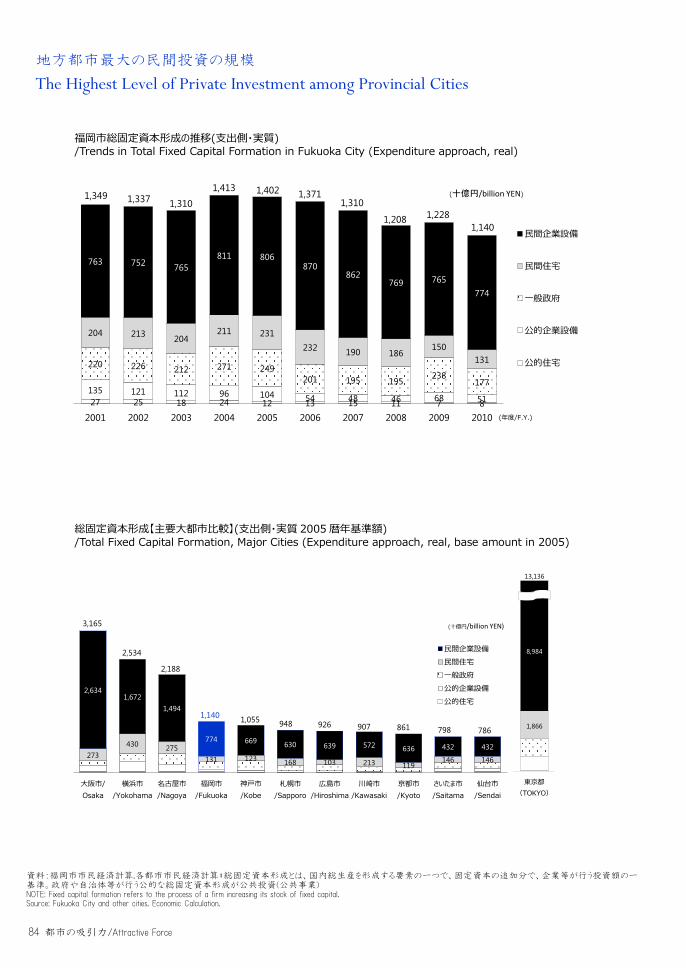
84
地方都市最大の民間投資の規模
The Highest Level of Private Investment among Provincial Cities
27 25 18 24 12 13 15 11 7 8135 121 112 96 104 54 48 46 68 51
220 226 212 271 249201 195 195 238
177
204 213 204211 231
232 190 186150
131
763 752 765811 806
870862
769 765774
1,349 1,337 1,3101,413 1,402 1,371
1,310
1,208 1,2281,140
2001 2002 2003 2004 2005 2006 2007 2008 2009 2010
民間企業設備
民間住宅
一般政府
公的企業設備
公的住宅
(十億円/billion YEN)
(年度/F.Y.)
273430 275
131 123 168 103 213 119146 146
2,6341,672
1,494
774 669 630 639 572 636 432 432
3,165
2,534
2,188
1,140 1,055 948 926 907 861 798 786
大阪市/Osaka
横浜市/Yokohama
名古屋市/Nagoya
福岡市/Fukuoka
神戸市/Kobe
札幌市/Sapporo
広島市/Hiroshima
川崎市/Kawasaki
京都市/Kyoto
さいたま市/Saitama
仙台市/Sendai
民間企業設備民間住宅一般政府公的企業設備公的住宅
(十億円/billion YEN)
940
東京都(TOKYO)
13,136
8,984
1,866
福岡市総固定資本形成の推移(支出側・実質) /Trends in Total Fixed Capital Formation in Fukuoka City (Expenditure approach, real)
総固定資本形成【主要大都市比較】(支出側・実質 2005 暦年基準額) /Total Fixed Capital Formation, Major Cities (Expenditure approach, real, base amount in 2005)
資料:福岡市市民経済計算,各都市市民経済計算*総固定資本形成とは、国内総生産を形成する要素の一つで、固定資本の追加分で、企業等が行う投資額の一基準。政府や自治体等が行う公的な総固定資本形成が公共投資(公共事業) NOTE: Fixed capital formation refers to the process of a firm increasing its stock of fixed capital. Source: Fukuoka City and other cities. Economic Calculation.
都市の吸引力/Attractive Force
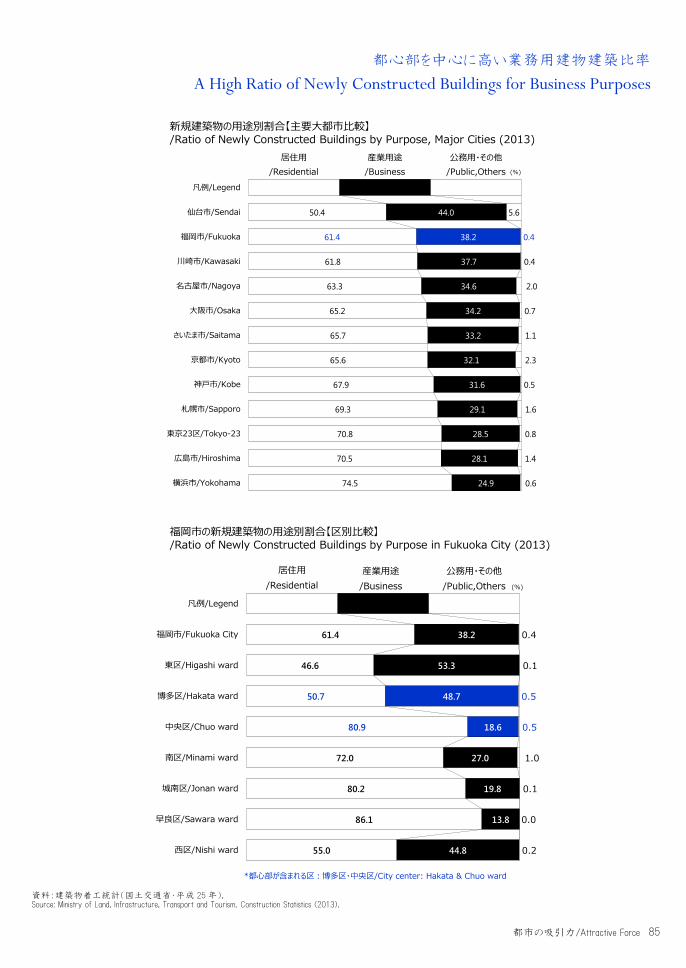
85
都心部を中心に高い業務用建物建築比率
A High Ratio of Newly Constructed Buildings for Business Purposes
居住用/Residential
50.4
61.4
61.8
63.3
65.2
65.7
65.6
67.9
69.3
70.8
70.5
74.5
産業用途/Business
44.0
38.2
37.7
34.6
34.2
33.2
32.1
31.6
29.1
28.5
28.1
24.9
公務用・その他/Public,Others
5.6
0.4
0.4
2.0
0.7
1.1
2.3
0.5
1.6
0.8
1.4
0.6
凡例/Legend
仙台市/Sendai
福岡市/Fukuoka
川崎市/Kawasaki
名古屋市/Nagoya
大阪市/Osaka
さいたま市/Saitama
京都市/Kyoto
神戸市/Kobe
札幌市/Sapporo
東京23区/Tokyo-23
広島市/Hiroshima
横浜市/Yokohama
(%)
居住用/Residential
61.4
46.6
50.7
80.9
72.0
80.2
86.1
55.0
産業用途/Business
38.2
53.3
48.7
18.6
27.0
19.8
13.8
44.8
公務用・その他/Public,Others
0.4
0.1
0.5
0.5
1.0
0.1
0.0
0.2
凡例/Legend
福岡市/Fukuoka City
東区/Higashi ward
博多区/Hakata ward
中央区/Chuo ward
南区/Minami ward
城南区/Jonan ward
早良区/Sawara ward
西区/Nishi ward
(%)
*都心部が含まれる区:博多区・中央区/City center: Hakata & Chuo ward
新規建築物の用途別割合【主要大都市比較】 /Ratio of Newly Constructed Buildings by Purpose, Major Cities (2013)
福岡市の新規建築物の用途別割合【区別比較】 /Ratio of Newly Constructed Buildings by Purpose in Fukuoka City (2013)
資料:建築物着工統計(国土交通省・平成 25 年), Source: Ministry of Land, Infrastructure, Transport and Tourism. Construction Statistics (2013).
都市の吸引力/Attractive Force

86
主要都市の中では安価なオフィス賃料
Low Office Rent Levels Compared with Other Major Cities in Japan
1,965 2,025 2,043 2,063 2,070 2,098 2,189 2,272 2,278 2,279 2,297 2,286
11.16 11.60
10.70 9.36
8.42 8.00 10.34
15.02 14.88
13.24 12.34
10.97
2002 2003 2004 2005 2006 2007 2008 2009 2010 2011 2012 2013
貸面積/Rental area(千㎡/thousand square meters)
空室率/vacancy rate(%)
2,4742,752
4,912
3,197 3,276 3,411
2,800
3,752
8.92
12.38
7.56
8.76 10.07 9.88
10.97
札幌市/Sapporo
仙台市/Sendai
東京/Tokyo
横浜/Yokohama
名古屋/Nagoya
大阪/Osaka
福岡/Fukuoka
福岡新築/New construction
in Fukuoka
平均賃料/Average rent(円/㎡,Yen per square meter) 空室率/vacancy rate(%)
福岡市のビジネスエリアにおける貸オフィス面積と空室率推移 /Trends in Rental Office Area and Vacancy Rate in the Business District of Fukuoka City
主要都市のビジネスエリアのオフィス賃料と空室率(2013) /Office Rent and Vacancy Rate in the Business District, Major Cities (2013)
資料: 三鬼商事㈱オフィスリポート*各年 10 月数値 Note: Figures are export values recorded in October each year. Source: Miki Shoji Co., Ltd. Office Report.
都市の吸引力/Attractive Force

87
安定したマンション需要
Steady Demand for Condominiums
75.5
72.0
71.8
70.0
63.7
62.7
61.5
60.1
58.2
54.4
51.5
50.2
23.3
26.5
26.8
22.9
33.4
35.9
36.0
38.0
40.6
43.2
47.1
44.6
1.2
1.5
1.4
7.0
2.9
1.3
2.5
2.0
1.2
2.4
1.5
5.2
凡例/LEGEND
福岡市/Fukuoka
東京23区/Tokyo-23
川崎市/Kawasaki
大阪市/Osaka
名古屋市/Nagoya
札幌市/Sapporo
神戸市/Kobe
横浜市/Yokohama
仙台市/Sendai
広島市/Hiroshima
さいたま市/Saitama
京都市/Kyoto
(%)
戸建/Detached houses
共同住宅/Condominiums
その他/Others
6.9
6.8
6.7
6.4
6.3
6.2
6.2
6.1
仙台市/Sendai
神戸市/Kobe
札幌市/Sapporo
政令指定都市平均/Major cities average
名古屋市/Nagoya
京都市/Kyoto
福岡市/Fukuoka
大阪市/Osaka
(%)
住宅建て方別世帯数比率【大都市比較】 /Private Households by Type of Building (2010)
主要政令指定都市賃貸マンション利回り /Yield of Rent Condominiums, Major Ordinance-designated Cities (June 2013)
資料:国勢調査(2010 年)*不明を除いた構成比, Mizuho Trust & Banking Co., Ltd. “Real Estate Market Report”. *写真は福岡市東区ネクサスワールドの居住用マンション。ネクサスワールド(香椎)1991〜1992 年に竣工。建築家・磯崎新のコーディネートにより国内外の建築家 6 名※が設計したマンション※スティーヴン・ホール,石山修武,レム・コールハース,マーク・マック,クリスチャン・ド・ポルザンパルク,オスカー・トゥスケ Sources: Statistics Bureau, Ministry of Internal Affairs and Communications. National Statistics (2010); Mizuho Trust & Banking Co., Ltd. Real Estate Market Report. Photos: Nexus World Residential Complex in Fukuoka City East Ward. Nexus World is consisted with the condominiums designed by following architects coordinated by Architect Arata Isozaki. Steven Hall, Steven Hall, Osamu Ishiyama, Rem Koolhaas, Mark Mack, Christian de Portzamparc, Oscar Tusquets.
都市の吸引力/Attractive Force
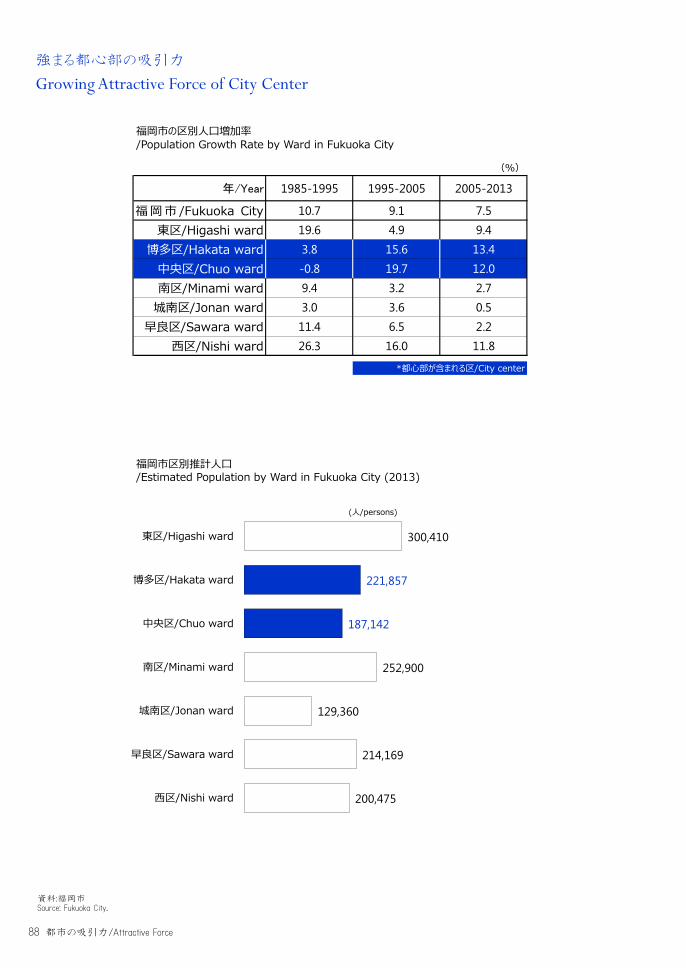
88
強まる都心部の吸引力
Growing Attractive Force of City Center
(%)
年/Year 1985-1995 1995-2005 2005-2013
福 岡 市 /Fukuoka City 10.7 9.1 7.5
東区/Higashi ward 19.6 4.9 9.4
博多区/Hakata ward 3.8 15.6 13.4
中央区/Chuo ward -0.8 19.7 12.0
南区/Minami ward 9.4 3.2 2.7
城南区/Jonan ward 3.0 3.6 0.5
早良区/Sawara ward 11.4 6.5 2.2
西区/Nishi ward 26.3 16.0 11.8
*都心部が含まれる区/City center
300,410
221,857
187,142
252,900
129,360
214,169
200,475
東区/Higashi ward
博多区/Hakata ward
中央区/Chuo ward
南区/Minami ward
城南区/Jonan ward
早良区/Sawara ward
西区/Nishi ward
(人/persons)
福岡市の区別人口増加率 /Population Growth Rate by Ward in Fukuoka City
福岡市区別推計人口 /Estimated Population by Ward in Fukuoka City (2013)
資料:福岡市 Source: Fukuoka City.
都市の吸引力/Attractive Force

89
都心部における小売業の高い販売効率
High Sales Productivity of the Retail Sector in the City Center
1,041
1,301 1,295
657819
637
福岡市/Fukuoka city
博多区/Hakata ward
中央区/Chuo ward
都市圏東部/Eastern metro.
都市圏南部/Southern metro.
都市圏西部/Western metro.
(千円/thousand YEN)
1,538 1,602 1,682 1,7351,503
2,023 1,9691,820
1,907
1,564
1997 2002 2004 2007 2012
売場面積/Floor space(千㎡/thousand square meters)
小売業販売額/Retail sales(十億円/billion YEN)
544
655
334368
64
429
630
362 343
69
448
580
379 374
72
457
615
394358
74
403
526
337 340
58
博多区/Hakata ward
中央区/Chuo ward
都市圏東部/Eastern metro.
都市圏南部/Southern metro.
都市圏西部/Western metro.
1999 2002 2004 2007 2012(十億円/billion YEN)
福岡市の小売業売場面積・販売額推移 /Trends in Retail Sales Area and Retail Sales in Fukuoka City (1997-2012)
年間販売額推移【博多区・中央区・都市圏】 /Trends in Annual Retail Sales in Hakata Ward, Chuo Ward, Fukuoka Metropolitan Area
1 ㎡あたり年間販売額(2012 年)【全市・博多区・中央区・都市圏比較】 /Annual Retail Sales per Square Meter in Fukuoka City, Hakata Ward, Chuo Ward, Fukuoka Metropolitan Area (2012)
資料:商業統計(1999~2007 年),平成 24 年経済センサス活動調査(2012 年) Source: Ministry of Economy, Trade and Industry. Census of Commerce (1999-2007); Statistics Bureau, Ministry of Internal Affairs and Communications. Economic Census for Business Activity (2012).
都市の吸引力/Attractive Force
90
MICE の中でも世界トップクラスの注目度と参加国を誇るオリンピック。2020 年の開催都市が東京に決まり、こ
れまで以上に、世界の目が日本に向けられます。
「O・MO・TE・NA・SHI(おもてなし)」という言葉が注目されましたが、MICE は地域の国際的な交流を促進するだけ
でなく、産業の振興に大きく寄与することから、世界の都市が MICE の誘致に力を入れています。来訪者の消費
による経済的な波及効果やビジネスチャンスの拡大など、大きな開催効果が地域にもたらされるだめです。
多様な MICE が開催され、より多くの海外からの来訪者を増やすことが、その効果を大きくします。
幅広い市民らの参加を募る、集客力のあるイベントも効果的ですが、分野を特化した一般には馴染みの薄い
ものでも、世界には常にイノベーションやビジネスチャンスを求める専門家や事業者が大勢いて、有益性の高い
コンベンションには積極的に参加します。
一過性のイベントに終わらず、地域経済、産業、教育分野などに、可視不可視を問わずさまざまな効果をも
たらす国際的な MICE の誘致を強化しなければなりません。
福岡市は、日本政府観光局基準の国際会議件数において、年間 252 件(2012 年)と東京に次ぐ国内第 2
位の件数を誇ります。一方で、福岡市の国際会議は、比較的中小規模のものが多く、国際的な基準でみると
存在感は高くなく、規模や外国人参加者数などに課題は残ります。
アジア各国・都市がMICE戦略を重要政策と位置付け、強化する中で、世界の中の日本、日本の中の福岡
市として、グローバルな MICE 戦略を実行していかねばなりません。
ネットワーキングやビジネスマッチングなど、海外の参加者にとって有益な MICE を開催するために、国際的な
誘致強化とともに、国内における人材やビジネスのネットワーキング環境を整えることが、海外に対する「おもてな
し」にもなります。
都市の魅力を訴求するだけでなく、国際機関・国際団体との関係強化や産業界、大学等との密接な連携
のもとに、国際会議開催の豊富な経験と実績をいかし、他の都市にない強みをいかした施策を強化していくこと
が重要です。
MICE とは、企業等の会議(Meeting)、企業等の行う報奨・研修旅行(Incentive Travel)、国際機関・団体、学会
等が行う国際会議(Convention)、展示会・見本市、イベント(Exhibition/Event)の頭文字のことで、多くの集客交
流が見込まれるビジネスイベントなどの総称です。
おもてなしのグローバル MICE 戦略
都市の吸引力/Attractive Force
91
Global MICE Strategies with the Spirit of Selfless Hospitality, "Omotenashi"
The Olympic Games is the world’s top MICE event in terms of the degree of attention and the number of participating countries. Because Tokyo has been chosen by the International Olympic Committee to host the 2020 Summer Olympic and Paralympic games, Japan will attract more international attention at that time than ever before. The Japanese term “O-Mo-Te-Na-Shi” was adopted in Tokyo’s presentation speech at the 125th Session of the International Olympic Committee in order to promote the traditional Japanese spirit of selfless hospitality. This means that hosting MICE is expected not only to encourage international exchange with the local community but also to stimulate the local economy. Because MICE events are considered to have a large impact on the local community from the economic ripple effect of visitor expenditure and an increase in business opportunities, many cities around the world are focusing on attracting MICE. The more diversified the MICE industry sector is, the more overseas visitors can be expected, which makes its effect larger. While a popular event with the ability to attract customers by calling out a wide range of citizen participation has an economic impact, an uncommon event specializing in a specific field can also be effective, because a large number of international specialists and entrepreneurs who are always seeking innovations or new business opportunities diligently participate in valuable and rare conventions and events. It is therefore necessary to attract international MICE events which may be one-off but also bring a variety of visible or invisible effects on the regional economy, local industries, and education. The Japan National Tourist Organization reports that Fukuoka City had 252 international meetings in 2012, the 2nd highest number in Japan following Tokyo. However, the size of most international meetings held in Fukuoka is considered to be relatively small, and the city falls out of the top rankings on this basis. The outstanding challenges are to increase the size of the meetings and the number of international participants. While many Asian countries and cities are focusing on their MICE strategy as an important political campaign, Fukuoka needs to commit to a MICE strategy that has a global point of view, not only as a city in Japan but also as a major city of the world, in line with the national government’s MICE strategy. To develop a beneficial MICE industry with networking and business matching opportunities for international participants, the city should not only focus on attracting international MICE events but also on improving the networking environment of talents and businesses in Japan, which will create the “O-Mo-Te-Na-Shi” for overseas visitors. It is important not only to promote the appealing points of the city but also to strengthen policies focusing on the city’s uniqueness, but a city with a rich experience and proven performance in hosting international meetings, as well as on building strong relationships with international organizations and close collaboration with business and universities.
MICE is an acronym for the Meetings, Incentive travels, Conventions and Exhibitions/Events industry, and is a type of tourism in which large groups of people are expected to be brought together for a particular purpose.
都市の吸引力/Attractive Force

92
A “Global MICE Strategic City” is a city where the government gives intensive support and encouragement for autonomous initiatives to develop a city with the ability to compete in the global MICE market.
「グローバル MICE 戦略都市」福岡市
Fukuoka: “Global MICE Strategic City”
グローバル MICE 戦略都市 /Global MICE Strategic City
グローバル MICE 戦略都市(国内 5 自治体) Global MICE Strategic City (5 municipalities)
グローバル MICE 強化都市(国内 2 自治体) Global MICE Enhancement City (2 municipalities)
「グローバル MICE 戦略都市」は、MICE の誘致において、海外競合
国・都市に打ち勝つ実力ある都市を育成するために、国が集中的な
支援を行うとともに、都市の自立的な取り組みを促すとしています。
資料:観光庁「グローバル MICE 戦略都市」 Source: Japan Tourism Agency. Global MICE Strategic City.
都市の吸引力/Attractive Force
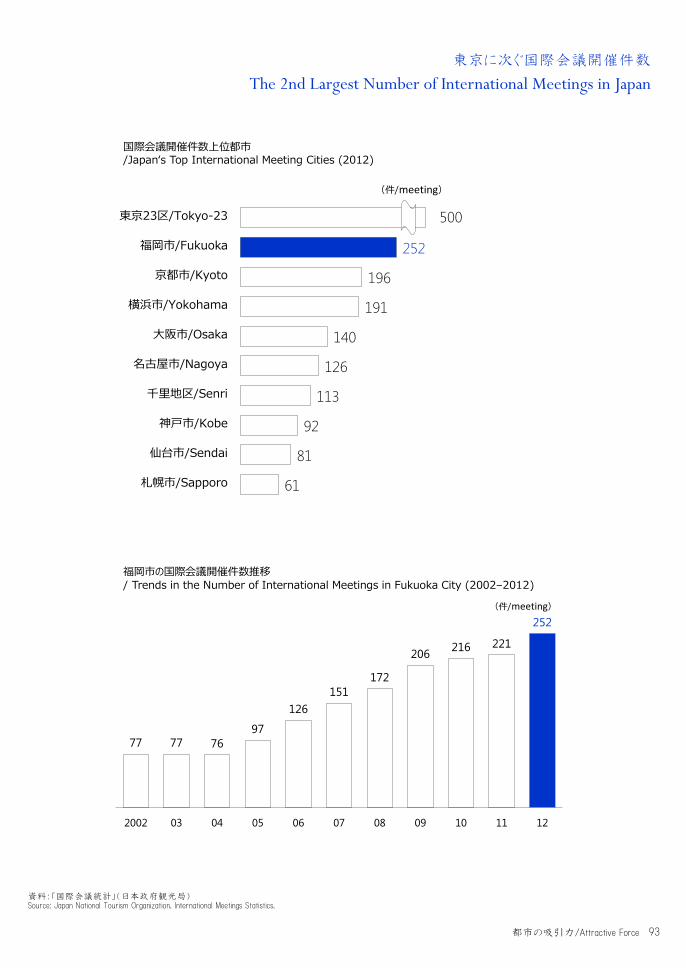
93
東京に次ぐ国際会議開催件数
The 2nd Largest Number of International Meetings in Japan
252
196
191
140
126
113
92
81
61
東京23区/Tokyo-23
福岡市/Fukuoka
京都市/Kyoto
横浜市/Yokohama
大阪市/Osaka
名古屋市/Nagoya
千里地区/Senri
神戸市/Kobe
仙台市/Sendai
札幌市/Sapporo
500
(件/meeting)
77 77 7697
126151
172
206 216 221
252
2002 03 04 05 06 07 08 09 10 11 12
(件/meeting)
国際会議開催件数上位都市 /Japan‘s Top International Meeting Cities (2012)
福岡市の国際会議開催件数推移 / Trends in the Number of International Meetings in Fukuoka City (2002–2012)
資料:「国際会議統計」(日本政府観光局) Source: Japan National Tourism Organization. International Meetings Statistics.
都市の吸引力/Attractive Force
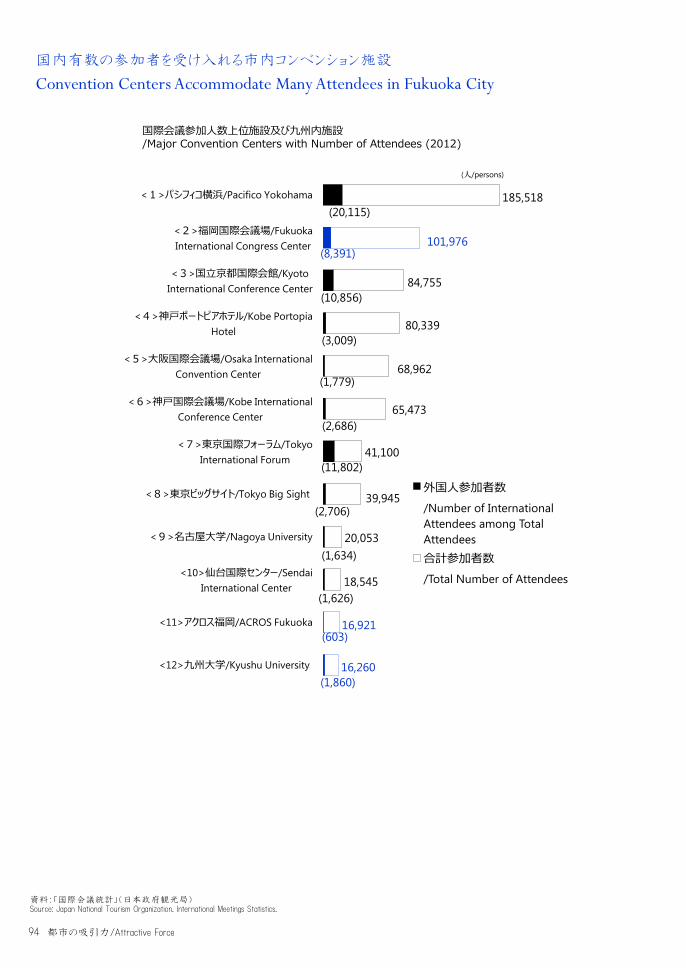
94
国内有数の参加者を受け入れる市内コンベンション施設
Convention Centers Accommodate Many Attendees in Fukuoka City
(20,115)
(8,391)
(10,856)
(3,009)
(1,779)
(2,686)
(11,802)
(2,706)
(1,634)
(1,626)
(603)
(1,860)
185,518
101,976
84,755
80,339
68,962
65,473
41,100
39,945
20,053
18,545
16,921
16,260
<1>パシフィコ横浜/Pacifico Yokohama
<2>福岡国際会議場/Fukuoka International Congress Center
<3>国立京都国際会館/Kyoto International Conference Center
<4>神戸ポートピアホテル/Kobe Portopia Hotel
<5>大阪国際会議場/Osaka International Convention Center
<6>神戸国際会議場/Kobe International Conference Center
<7>東京国際フォーラム/Tokyo International Forum
<8>東京ビッグサイト/Tokyo Big Sight
<9>名古屋大学/Nagoya University
<10>仙台国際センター/Sendai International Center
<11>アクロス福岡/ACROS Fukuoka
<12>九州大学/Kyushu University
外国人参加者数/Number of International Attendees among Total Attendees合計参加者数/Total Number of Attendees
(人/persons)
国際会議参加人数上位施設及び九州内施設 /Major Convention Centers with Number of Attendees (2012)
資料:「国際会議統計」(日本政府観光局) Source: Japan National Tourism Organization. International Meetings Statistics.
都市の吸引力/Attractive Force
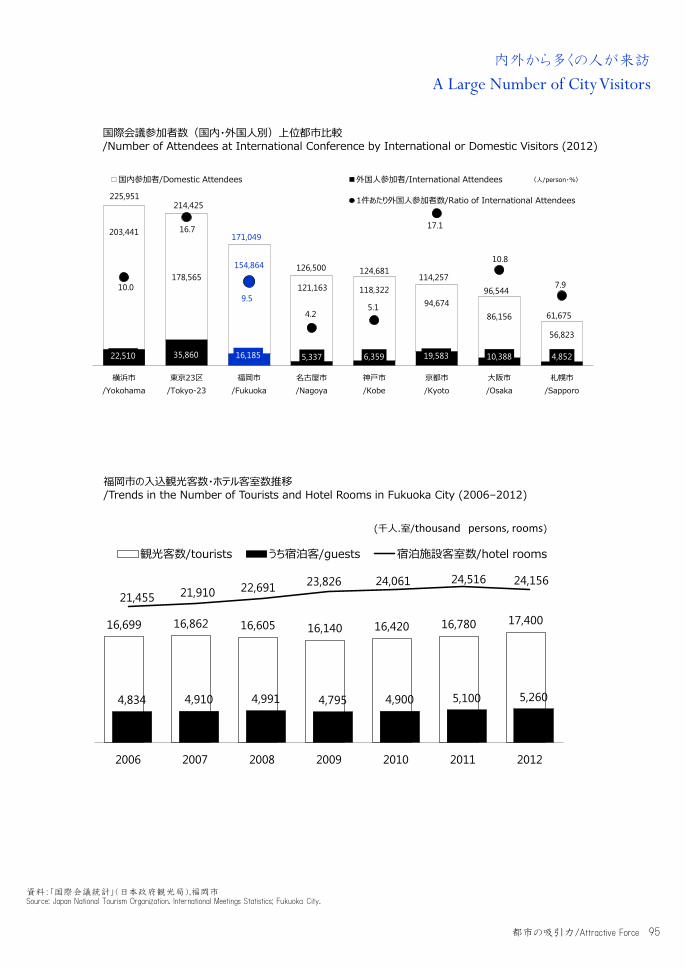
95
内外から多くの人が来訪
A Large Number of City Visitors
22,510 35,860 16,185 5,337 6,359 19,583 10,388 4,852
203,441
178,565154,864
121,163 118,32294,674
86,156
56,823
225,951214,425
171,049
126,500 124,681114,257
96,544
61,675
10.0
16.7
9.5
4.25.1
17.1
10.8
7.9
横浜市/Yokohama
東京23区/Tokyo-23
福岡市/Fukuoka
名古屋市/Nagoya
神戸市/Kobe
京都市/Kyoto
大阪市/Osaka
札幌市/Sapporo
国内参加者/Domestic Attendees 外国人参加者/International Attendees
1件あたり外国人参加者数/Ratio of International Attendees
(人/person・%)
16,699 16,862 16,605 16,140 16,420 16,780 17,400
4,834 4,910 4,991 4,795 4,900 5,100 5,260
21,455 21,910 22,691 23,826 24,061 24,516 24,156
2006 2007 2008 2009 2010 2011 2012
観光客数/tourists うち宿泊客/guests 宿泊施設客室数/hotel rooms
(千人.室/thousand persons, rooms)
福岡市の入込観光客数・ホテル客室数推移 /Trends in the Number of Tourists and Hotel Rooms in Fukuoka City (2006–2012)
国際会議参加者数(国内・外国人別)上位都市比較 /Number of Attendees at International Conference by International or Domestic Visitors (2012)
資料:「国際会議統計」(日本政府観光局),福岡市 Source: Japan National Tourism Organization. International Meetings Statistics; Fukuoka City.
都市の吸引力/Attractive Force

96
Fast FUTURE 社の発表している MICE 産業の将来動向分析レポート(“Convention 2020” The Future of
Exhibitions, Meetings and Events/Rohit Talwar,Tim Hancock)では、世界の顧客が、2020 年において会議及び展
示会へ出席を決定する際に影響を与える要因として、よりビジネスに直結する形での開催、有益性を重
視する傾向にあります。
開催都市の魅力は重要な要件ではありますが、コンベンションの質という側面から、一過性のイベント
で終わらせずに、商談やネットワーキングの輪が広がるような、その分野に携わる人々にとって有益性の
高い会議等を開催することで、大規模コンベンションで先行する都市との競争力を高めていくことは可能
です。
それが、古くから外交と国際貿易の地として栄えてきた福岡市のDNAであり、「おもてなし」です。
福岡は、1300 年以上前から、海外の要人らを迎え、‘おもてなし’する「コンベンション都市」でした。
福岡市で遺構が確認された「鴻臚館」は、外国からの使節らを迎える大宰府政庁の迎賓館兼宿泊
所として機能しました。鴻臚館のあった現在の福岡市の舞鶴公園から太宰府市まで、幅員 10mにもなる
一直線の官道が十数 km 続く、壮大な「外交ルート」でした。そして、鴻臚館は、外国の通商に携わる人
にも活用されていたようです。
時を経て現代、日中韓首脳会談の記念すべき第 1 回は、やはり福岡・太宰府の地で行われました。
福岡市は、古くから外交や外国貿易の拠点として、多くの会議や交渉、情報交換が行われてきた「コ
ンベンション都市」としての歴史があり、おもてなしの文化が根付いています。今も、福岡市の港エリアに
はコンベンション施設が集積し、国内外から多くの人が訪れています。
「グローバル MICE 戦略都市」 として、港エリアを中心とするコンベンション施設や、都心部などでの
「アフターコンベンション」の機能や魅力を充実して、福岡市のアイデンティティを未来に受け継いでいか
ねばなりません。
“Convention 2020” a strategic foresight study published by Fast FUTURE, notes that people expect benefits which directly links to business when making decision to attend conferences and exhibitions. The attractiveness of the host city is one of the important factors; however it is also important to host not only temporary events but also regular meetings with high profitability which enable attendees to have more business opportunities and networking. This will increase the competitiveness of the city against other cities that are promoted by hosting large-scale conventions. This is the DNA of Fukuoka, which has acted as a meeting place for foreign diplomats and international trade for many years, and is also in the spirit of “Omotenashi”. For more than 1300 years, Fukuoka has been a convention city, welcoming overseas guests and hosting them with the omotenashi spirit. “Korokan”, the remains of an ancient building in Fukuoka has been identified as a guest house of the Dazaifu regional government for foreign diplomats, and used to welcome imperial embassies and missions from overseas. An improved and maintained road called Kando, 10 meters in width and more than 10 kilometers in length was built directly from the current Maizuru Park in Fukuoka where the Korokan was located to Dazaifu City where the center of regional government was located. It was then a magnificent “diplomatic route”, and the Korokan was also used by people engaged in foreign trade. The first China-Japan-South Korea trilateral summit was also held in Dazaifu, Fukuoka in more modern times. Fukuoka has thus a long history as a hub city for foreign diplomats and foreign trade, and also as a convention city where numerous meetings, negotiations and communications have been held, and a culture of omotenashi has taken root in the city. Even now, convention centers are concentrated in the bay area of Fukuoka, where many people visit from inside and outside Japan. As a “global MICE strategic city”, Fukuoka needs to pass on this identity to the future by enriching the after-convention entertainment in the bay area convention centers, as well as in the city center.
都市の吸引力/Attractive Force

97
自然 NATURE
自然と共生する都市の進化
Evolution of City Coexisting with Nature
08
98
東日本大震災の記憶も新しいところですが、日本は地震が多く、過去にも度々大規模な地震災害にみまわ
れ、甚大な被害を受けてきました。一方で、被災の経験をいかし、地震に対する備えや減災の取り組みは、さま
ざまな分野で広がり、進化してきました。
自然と共生することは、ときに猛威をふるう自然災害に備え、人々の生活環境を維持、進化させることであり、
ビジネスなどの経済活動についても無縁ではありません。東日本大震災を機に、BCP(Business Continuity Planning;
事業継続計画)の策定が注目されるようになったのも、不測の事態に備え、リスクを回避するとともに、被害を最
小限に抑える=損失を最小限に抑えることを目的としたものです。
近い将来、日本は再び大規模な地震の発生が予想されており、特に、東京をはじめ太平洋沿岸に集中する
国内の主要大都市は、地震や津波による甚大な被害が予想されています。これらの都市が同時に都市機能
を麻痺すると、国家としての機能も停滞する危険があり、さまざまな機能の分散やバックアップ体制の強化が求
められています。
民間企業にとっても、経営資源の分散やバックアップによって、災害時の損失を抑えることが、株主や顧客、
従業員の利益を守るための、危機管理上の重要な経営課題となっています。
福岡市は、国内にあっては比較的地震や津波の影響が小さいと予想されており、都市の規模や基盤、人材
など、一定の集積があることから、バックアップ機能やリスクの回避先としては、国内で最も可能性の大きな大都
市であるといえます。
また、自然との共生は、生活の質を左右する重要な要素ですが、福岡市は、コンパクトな市街地を取り囲む
山と海に面したバランスの良い市域を有し、都心部などにおける高い利便性と、周辺部における良好な自然環
境のもと、高い生活の質による暮らしやすさが、世界的に高い評価を得ています。
世界的に人材の流動化が強まり、クリエイティブな産業に従事する人は、生活の質を重視して仕事と質の高
い生活を両立する都市に住む傾向にあり、世界経済の中心がアジア地域へシフトする中で、次代の付加価値
を生み出す人材の集積を図る上で、福岡市は大きなアドバンテージを持っています。
農業や漁業及びそれを素材とする食産業など、自然の恵みをいかした産業も根付いており、自然と共生する
社会づくりは、環境保全、防災対策に加えて、地域の付加価値づくりという面でも、大きな可能性を秘めていると
いえます。
福岡市は、急速に都市化が進み、市街地は拡大しましたが、自然環境の保全に努め、市街地においては
都市公園など創出系の自然を増やす取り組みを進めてきたほか、過去の大雨災害の被害などを教訓に、防災
面でも、自然との共生を念頭に、さまざまな取り組みが進められています。
福岡市は、自然との共生によって、経済活動を活性化し、新しい都市の進化の形を示すことが期待されま
す。福岡市における自然と共生する社会は、都市の進化とは相反するものでなく、新たな付加価値を生み出す
源泉でもあります。
自然/Nature
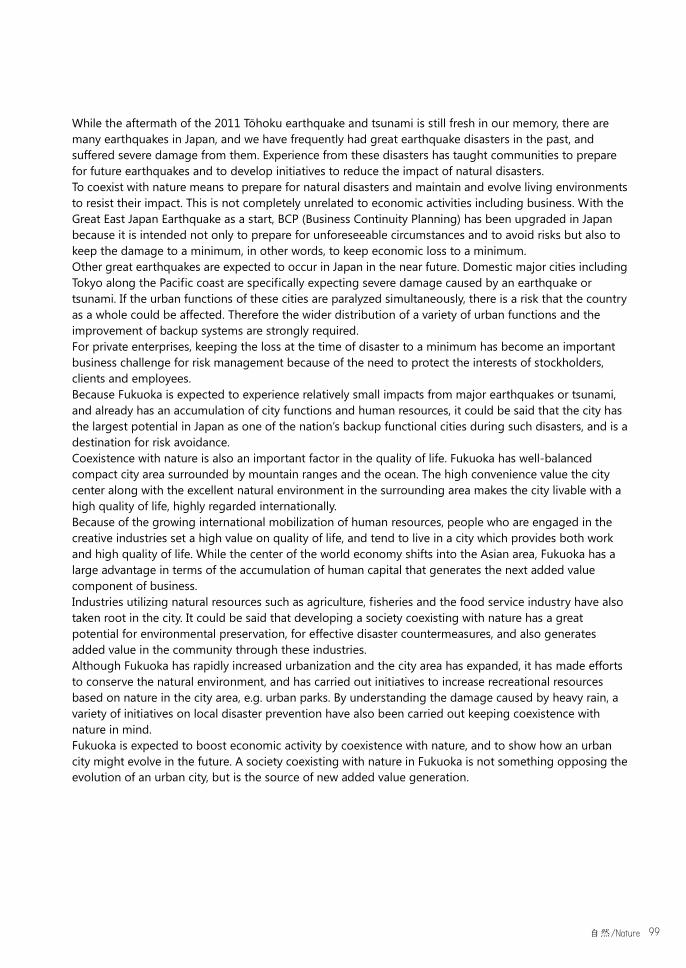
99
While the aftermath of the 2011 Tōhoku earthquake and tsunami is still fresh in our memory, there are many earthquakes in Japan, and we have frequently had great earthquake disasters in the past, and suffered severe damage from them. Experience from these disasters has taught communities to prepare for future earthquakes and to develop initiatives to reduce the impact of natural disasters. To coexist with nature means to prepare for natural disasters and maintain and evolve living environments to resist their impact. This is not completely unrelated to economic activities including business. With the Great East Japan Earthquake as a start, BCP (Business Continuity Planning) has been upgraded in Japan because it is intended not only to prepare for unforeseeable circumstances and to avoid risks but also to keep the damage to a minimum, in other words, to keep economic loss to a minimum. Other great earthquakes are expected to occur in Japan in the near future. Domestic major cities including Tokyo along the Pacific coast are specifically expecting severe damage caused by an earthquake or tsunami. If the urban functions of these cities are paralyzed simultaneously, there is a risk that the country as a whole could be affected. Therefore the wider distribution of a variety of urban functions and the improvement of backup systems are strongly required. For private enterprises, keeping the loss at the time of disaster to a minimum has become an important business challenge for risk management because of the need to protect the interests of stockholders, clients and employees. Because Fukuoka is expected to experience relatively small impacts from major earthquakes or tsunami, and already has an accumulation of city functions and human resources, it could be said that the city has the largest potential in Japan as one of the nation’s backup functional cities during such disasters, and is a destination for risk avoidance. Coexistence with nature is also an important factor in the quality of life. Fukuoka has well-balanced compact city area surrounded by mountain ranges and the ocean. The high convenience value the city center along with the excellent natural environment in the surrounding area makes the city livable with a high quality of life, highly regarded internationally. Because of the growing international mobilization of human resources, people who are engaged in the creative industries set a high value on quality of life, and tend to live in a city which provides both work and high quality of life. While the center of the world economy shifts into the Asian area, Fukuoka has a large advantage in terms of the accumulation of human capital that generates the next added value component of business. Industries utilizing natural resources such as agriculture, fisheries and the food service industry have also taken root in the city. It could be said that developing a society coexisting with nature has a great potential for environmental preservation, for effective disaster countermeasures, and also generates added value in the community through these industries. Although Fukuoka has rapidly increased urbanization and the city area has expanded, it has made efforts to conserve the natural environment, and has carried out initiatives to increase recreational resources based on nature in the city area, e.g. urban parks. By understanding the damage caused by heavy rain, a variety of initiatives on local disaster prevention have also been carried out keeping coexistence with nature in mind. Fukuoka is expected to boost economic activity by coexistence with nature, and to show how an urban city might evolve in the future. A society coexisting with nature in Fukuoka is not something opposing the evolution of an urban city, but is the source of new added value generation.
自然/Nature
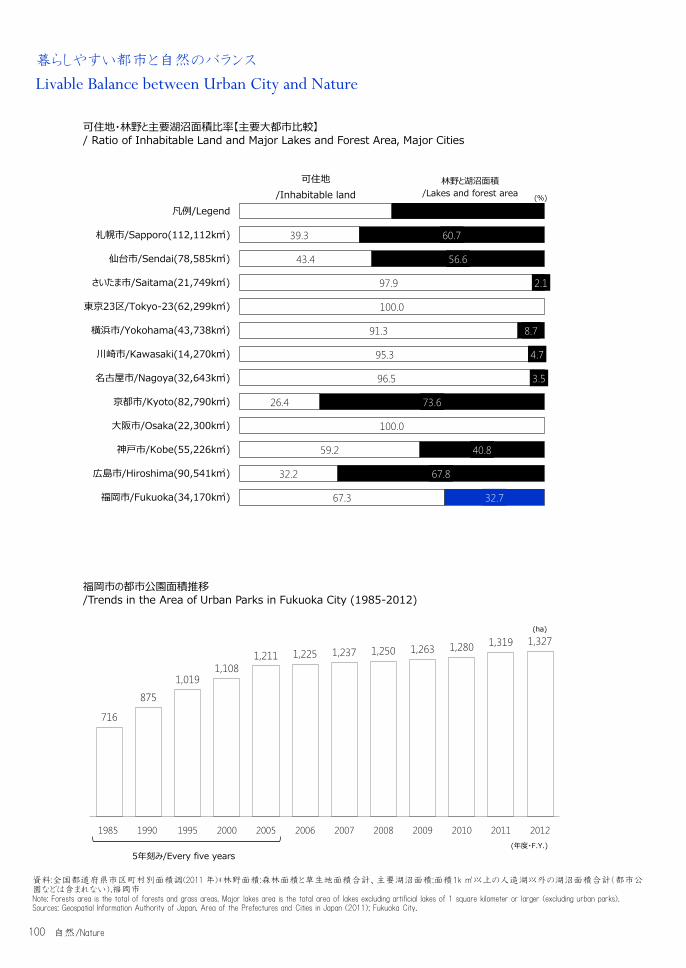
100
暮らしやすい都市と自然のバランス
Livable Balance between Urban City and Nature
716
875
1,0191,108
1,211 1,225 1,237 1,250 1,263 1,280 1,319 1,327
1985 1990 1995 2000 2005 2006 2007 2008 2009 2010 2011 2012
(ha)
5年刻み/Every five years(年度・F.Y.)
可住地/Inhabitable land
39.3
43.4
97.9
100.0
91.3
95.3
96.5
26.4
100.0
59.2
32.2
67.3
60.7
56.6
2.1
8.7
4.7
3.5
73.6
40.8
67.8
32.7
凡例/Legend
札幌市/Sapporo(112,112k㎡)
仙台市/Sendai(78,585k㎡)
さいたま市/Saitama(21,749k㎡)
東京23区/Tokyo-23(62,299k㎡)
横浜市/Yokohama(43,738k㎡)
川崎市/Kawasaki(14,270k㎡)
名古屋市/Nagoya(32,643k㎡)
京都市/Kyoto(82,790k㎡)
大阪市/Osaka(22,300k㎡)
神戸市/Kobe(55,226k㎡)
広島市/Hiroshima(90,541k㎡)
福岡市/Fukuoka(34,170k㎡)
(%)
林野と湖沼面積/Lakes and forest area
可住地・林野と主要湖沼面積比率【主要大都市比較】 / Ratio of Inhabitable Land and Major Lakes and Forest Area, Major Cities
福岡市の都市公園面積推移 /Trends in the Area of Urban Parks in Fukuoka City (1985-2012)
資料:全国都道府県市区町村別面積調(2011 年)*林野面積:森林面積と草生地面積合計、主要湖沼面積;面積1k ㎡以上の人造湖以外の湖沼面積合計(都市公園などは含まれない),福岡市 Note: Forests area is the total of forests and grass areas. Major lakes area is the total area of lakes excluding artificial lakes of 1 square kilometer or larger (excluding urban parks). Sources: Geospatial Information Authority of Japan. Area of the Prefectures and Cities in Japan (2011); Fukuoka City.
自然/Nature
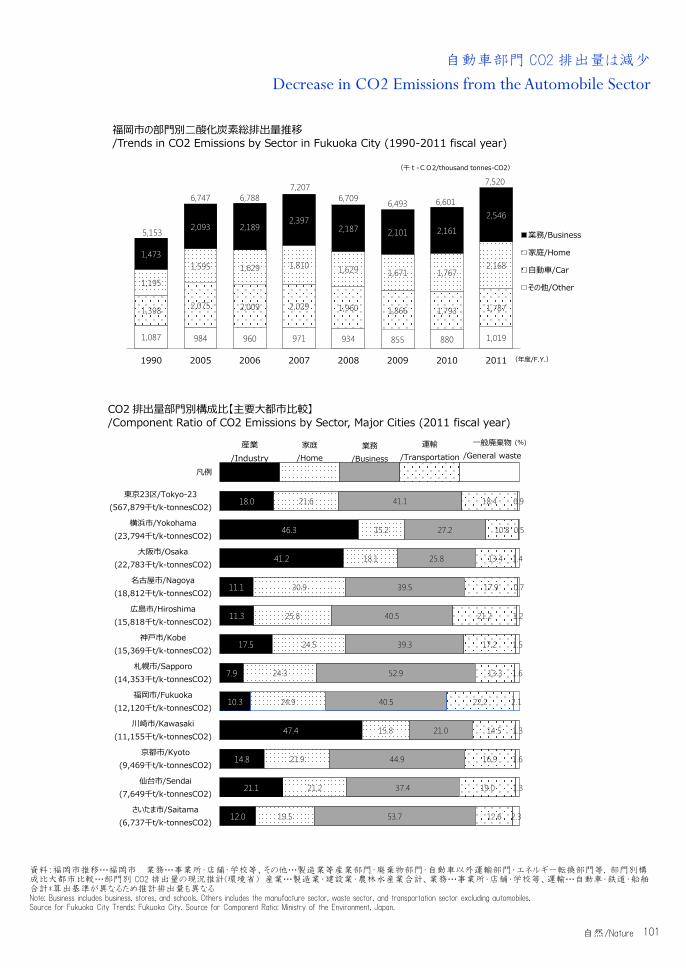
101
自動車部門 CO2 排出量は減少
Decrease in CO2 Emissions from the Automobile Sector
1,087 984 960 971 934 855 880 1,019
1,398 2,075 2,009 2,029 1,960 1,866 1,793 1,787
1,195
1,595 1,629 1,810 1,629 1,671 1,7672,168
1,473
2,093 2,1892,397
2,187 2,101 2,161
2,546
5,153
6,747 6,7887,207
6,709 6,493 6,601
7,520
1990 2005 2006 2007 2008 2009 2010 2011 (年度/F.Y.)
業務/Business
家庭/Home
自動車/Car
その他/Other
(千t-CO2/thousand tonnes-CO2)
産業/Industry
18.0
46.3
41.2
11.1
11.3
17.5
7.9
10.3
47.4
14.8
21.1
12.0
家庭/Home
21.6
15.2
18.1
30.9
25.8
24.5
24.3
24.9
15.8
21.9
21.2
19.5
業務/Business
41.1
27.2
25.8
39.5
40.5
39.3
52.9
40.5
21.0
44.9
37.4
53.7
運輸/Transportation
18.4
10.8
13.4
17.9
21.2
17.2
13.3
22.2
14.5
16.9
19.0
12.6
一般廃棄物/General waste
0.9
0.5
1.4
0.7
1.2
1.5
1.6
2.1
1.3
1.6
1.3
2.3
凡例
東京23区/Tokyo-23(567,879千t/k-tonnesCO2)
横浜市/Yokohama(23,794千t/k-tonnesCO2)
大阪市/Osaka(22,783千t/k-tonnesCO2)
名古屋市/Nagoya(18,812千t/k-tonnesCO2)
広島市/Hiroshima(15,818千t/k-tonnesCO2)
神戸市/Kobe(15,369千t/k-tonnesCO2)
札幌市/Sapporo(14,353千t/k-tonnesCO2)
福岡市/Fukuoka(12,120千t/k-tonnesCO2)
川崎市/Kawasaki(11,155千t/k-tonnesCO2)
京都市/Kyoto(9,469千t/k-tonnesCO2)
仙台市/Sendai(7,649千t/k-tonnesCO2)
さいたま市/Saitama(6,737千t/k-tonnesCO2)
(%)
福岡市の部門別二酸化炭素総排出量推移 /Trends in CO2 Emissions by Sector in Fukuoka City (1990-2011 fiscal year)
CO2 排出量部門別構成比【主要大都市比較】 /Component Ratio of CO2 Emissions by Sector, Major Cities (2011 fiscal year)
資料:福岡市推移…福岡市 業務…事業所・店舗・学校等、その他…製造業等産業部門・廃棄物部門・自動車以外運輸部門・エネルギー転換部門等, 部門別構成比大都市比較…部門別 CO2 排出量の現況推計(環境省) 産業…製造業・建設業・農林水産業合計、業務…事業所・店舗・学校等、運輸…自動車・鉄道・船舶合計*算出基準が異なるため推計排出量も異なる Note: Business includes business, stores, and schools. Others includes the manufacture sector, waste sector, and transportation sector excluding automobiles. Source for Fukuoka City Trends: Fukuoka City. Source for Component Ratio: Ministry of the Environment, Japan.
自然/Nature
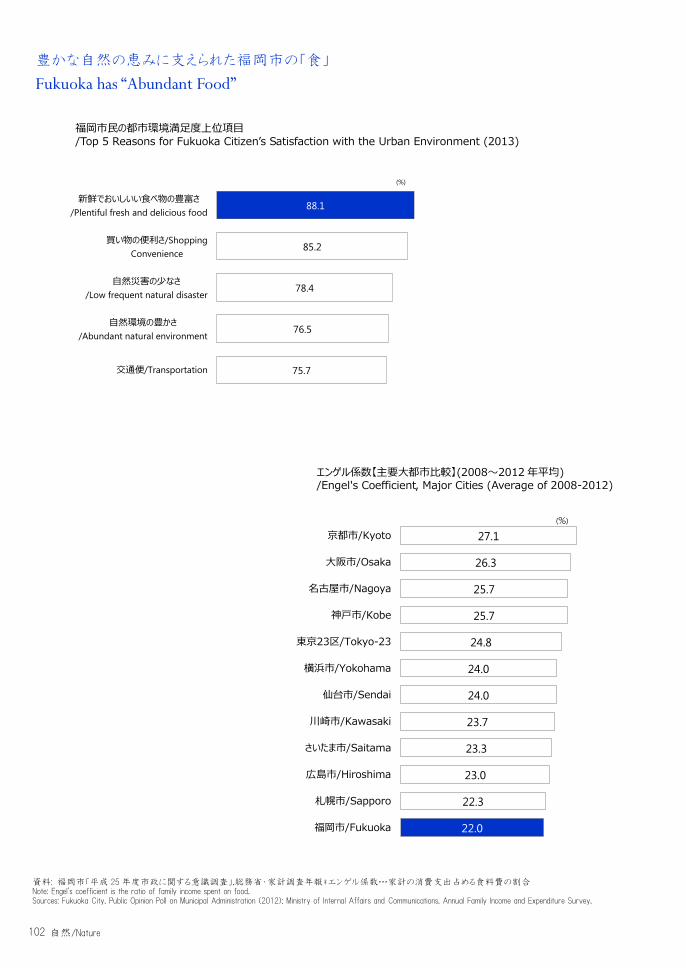
102
豊かな自然の恵みに支えられた福岡市の「食」
Fukuoka has “Abundant Food”
88.1
85.2
78.4
76.5
75.7
新鮮でおいしいい食べ物の豊富さ/Plentiful fresh and delicious food
買い物の便利さ/Shopping Convenience
自然災害の少なさ/Low frequent natural disaster
自然環境の豊かさ/Abundant natural environment
交通便/Transportation
(%)
27.1
26.3
25.7
25.7
24.8
24.0
24.0
23.7
23.3
23.0
22.3
22.0
京都市/Kyoto
大阪市/Osaka
名古屋市/Nagoya
神戸市/Kobe
東京23区/Tokyo-23
横浜市/Yokohama
仙台市/Sendai
川崎市/Kawasaki
さいたま市/Saitama
広島市/Hiroshima
札幌市/Sapporo
福岡市/Fukuoka
(%)
エンゲル係数【主要大都市比較】(2008~2012 年平均) /Engel's Coefficient, Major Cities (Average of 2008-2012)
福岡市民の都市環境満足度上位項目 /Top 5 Reasons for Fukuoka Citizen’s Satisfaction with the Urban Environment (2013)
資料: 福岡市「平成 25 年度市政に関する意識調査」,総務省・家計調査年報*エンゲル係数…家計の消費支出占める食料費の割合 Note: Engel's coefficient is the ratio of family income spent on food. Sources: Fukuoka City. Public Opinion Poll on Municipal Administration (2012); Ministry of Internal Affairs and Communications. Annual Family Income and Expenditure Survey.
自然/Nature
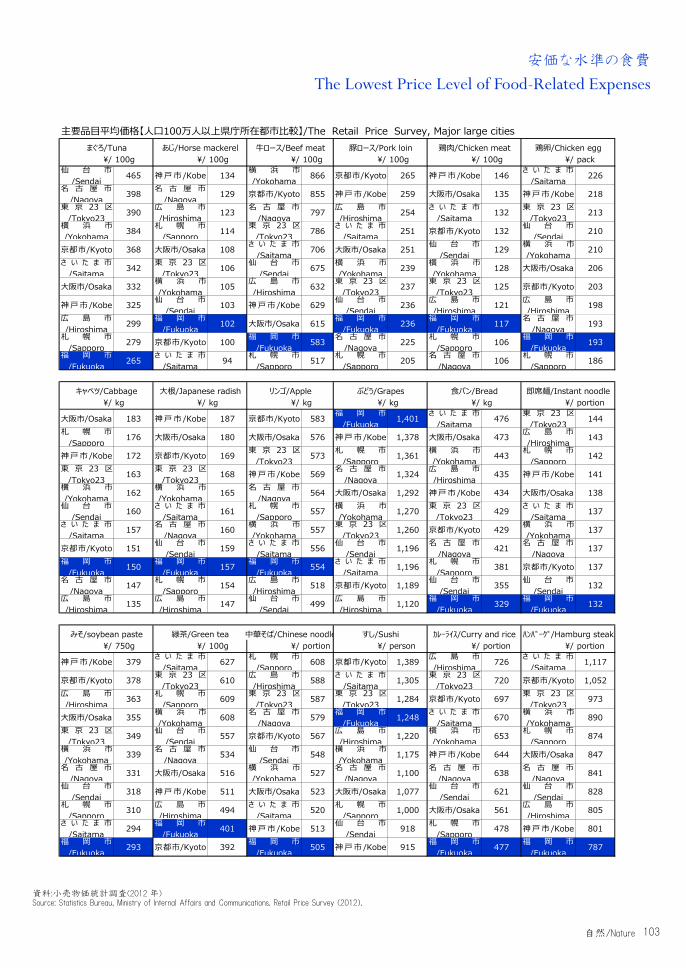
103
安価な水準の食費
The Lowest Price Level of Food-Related Expenses
主要品目平均価格【人口100万人以上県庁所在都市比較】/The Retail Price Survey, Major large citiesまぐろ/Tuna あじ/Horse mackerel 牛ロース/Beef meat 豚ロース/Pork loin 鶏肉/Chicken meat 鶏卵/Chicken egg
\/ 100g \/ 100g \/ 100g \/ 100g \/ 100g \/ pack仙 台 市
/Sendai 465 神 戸 市 /Kobe 134 横 浜 市/Yokohama 866 京都市/Kyoto 265 神 戸 市 /Kobe 146 さ い た ま 市
/Saitama 226名 古 屋 市
/Nagoya 398 名 古 屋 市/Nagoya 129 京都市/Kyoto 855 神 戸 市 /Kobe 259 大阪市/Osaka 135 神 戸 市 /Kobe 218
東 京 23 区/Tokyo23 390 広 島 市
/Hiroshima 123 名 古 屋 市/Nagoya 797 広 島 市
/Hiroshima 254 さ い た ま 市/Saitama 132 東 京 23 区
/Tokyo23 213横 浜 市/Yokohama 384 札 幌 市
/Sapporo 114 東 京 23 区/Tokyo23 786 さ い た ま 市
/Saitama 251 京都市/Kyoto 132 仙 台 市/Sendai 210
京都市/Kyoto 368 大阪市/Osaka 108 さ い た ま 市/Saitama 706 大阪市/Osaka 251 仙 台 市
/Sendai 129 横 浜 市/Yokohama 210
さ い た ま 市/Saitama 342 東 京 23 区
/Tokyo23 106 仙 台 市/Sendai 675 横 浜 市
/Yokohama 239 横 浜 市/Yokohama 128 大阪市/Osaka 206
大阪市/Osaka 332 横 浜 市/Yokohama 105 広 島 市
/Hiroshima 632 東 京 23 区/Tokyo23 237 東 京 23 区
/Tokyo23 125 京都市/Kyoto 203
神 戸 市 /Kobe 325 仙 台 市/Sendai 103 神 戸 市 /Kobe 629 仙 台 市
/Sendai 236 広 島 市/Hiroshima 121 広 島 市
/Hiroshima 198広 島 市/Hiroshima 299 福 岡 市
/Fukuoka 102 大阪市/Osaka 615 福 岡 市/Fukuoka 236 福 岡 市
/Fukuoka 117 名 古 屋 市/Nagoya 193
札 幌 市/Sapporo 279 京都市/Kyoto 100 福 岡 市
/Fukuoka 583 名 古 屋 市/Nagoya 225 札 幌 市
/Sapporo 106 福 岡 市/Fukuoka 193
福 岡 市/Fukuoka 265 さ い た ま 市
/Saitama 94 札 幌 市/Sapporo 517 札 幌 市
/Sapporo 205 名 古 屋 市/Nagoya 106 札 幌 市
/Sapporo 186
キャベツ/Cabbage 大根/Japanese radish リンゴ/Apple ぶどう/Grapes 食パン/Bread 即席麺/Instant noodle\/ kg \/ kg \/ kg \/ kg \/ kg \/ portion
大阪市/Osaka 183 神 戸 市 /Kobe 187 京都市/Kyoto 583 福 岡 市/Fukuoka 1,401 さ い た ま 市
/Saitama 476 東 京 23 区/Tokyo23 144
札 幌 市/Sapporo 176 大阪市/Osaka 180 大阪市/Osaka 576 神 戸 市 /Kobe 1,378 大阪市/Osaka 473 広 島 市
/Hiroshima 143
神 戸 市 /Kobe 172 京都市/Kyoto 169 東 京 23 区/Tokyo23 573 札 幌 市
/Sapporo 1,361 横 浜 市/Yokohama 443 札 幌 市
/Sapporo 142東 京 23 区
/Tokyo23 163 東 京 23 区/Tokyo23 168 神 戸 市 /Kobe 569 名 古 屋 市
/Nagoya 1,324 広 島 市/Hiroshima 435 神 戸 市 /Kobe 141
横 浜 市/Yokohama 162 横 浜 市
/Yokohama 165 名 古 屋 市/Nagoya 564 大阪市/Osaka 1,292 神 戸 市 /Kobe 434 大阪市/Osaka 138
仙 台 市/Sendai 160 さ い た ま 市
/Saitama 161 札 幌 市/Sapporo 557 横 浜 市
/Yokohama 1,270 東 京 23 区/Tokyo23 429 さ い た ま 市
/Saitama 137さ い た ま 市
/Saitama 157 名 古 屋 市/Nagoya 160 横 浜 市
/Yokohama 557 東 京 23 区/Tokyo23 1,260 京都市/Kyoto 429 横 浜 市
/Yokohama 137
京都市/Kyoto 151 仙 台 市/Sendai 159 さ い た ま 市
/Saitama 556 仙 台 市/Sendai 1,196 名 古 屋 市
/Nagoya 421 名 古 屋 市/Nagoya 137
福 岡 市/Fukuoka 150 福 岡 市
/Fukuoka 157 福 岡 市/Fukuoka 554 さ い た ま 市
/Saitama 1,196 札 幌 市/Sapporo 381 京都市/Kyoto 137
名 古 屋 市/Nagoya 147 札 幌 市
/Sapporo 154 広 島 市/Hiroshima 518 京都市/Kyoto 1,189 仙 台 市
/Sendai 355 仙 台 市/Sendai 132
広 島 市/Hiroshima 135 広 島 市
/Hiroshima 147 仙 台 市/Sendai 499 広 島 市
/Hiroshima 1,120 福 岡 市/Fukuoka 329 福 岡 市
/Fukuoka 132
みそ/soybean paste 緑茶/Green tea 中華そば/Chinese noodle すし/Sushi カレーライス/Curry and rice ハンバーグ/Hamburg steak\/ 750g \/ 100g \/ portion \/ person \/ portion \/ portion
神 戸 市 /Kobe 379 さ い た ま 市/Saitama 627 札 幌 市
/Sapporo 608 京都市/Kyoto 1,389 広 島 市/Hiroshima 726 さ い た ま 市
/Saitama 1,117
京都市/Kyoto 378 東 京 23 区/Tokyo23 610 広 島 市
/Hiroshima 588 さ い た ま 市/Saitama 1,305 東 京 23 区
/Tokyo23 720 京都市/Kyoto 1,052広 島 市/Hiroshima 363 札 幌 市
/Sapporo 609 東 京 23 区/Tokyo23 587 東 京 23 区
/Tokyo23 1,284 京都市/Kyoto 697 東 京 23 区/Tokyo23 973
大阪市/Osaka 355 横 浜 市/Yokohama 608 名 古 屋 市
/Nagoya 579 福 岡 市/Fukuoka 1,248 さ い た ま 市
/Saitama 670 横 浜 市/Yokohama 890
東 京 23 区/Tokyo23 349 仙 台 市
/Sendai 557 京都市/Kyoto 567 広 島 市/Hiroshima 1,220 横 浜 市
/Yokohama 653 札 幌 市/Sapporo 874
横 浜 市/Yokohama 339 名 古 屋 市
/Nagoya 534 仙 台 市/Sendai 548 横 浜 市
/Yokohama 1,175 神 戸 市 /Kobe 644 大阪市/Osaka 847名 古 屋 市
/Nagoya 331 大阪市/Osaka 516 横 浜 市/Yokohama 527 名 古 屋 市
/Nagoya 1,100 名 古 屋 市/Nagoya 638 名 古 屋 市
/Nagoya 841仙 台 市
/Sendai 318 神 戸 市 /Kobe 511 大阪市/Osaka 523 大阪市/Osaka 1,077 仙 台 市/Sendai 621 仙 台 市
/Sendai 828札 幌 市
/Sapporo 310 広 島 市/Hiroshima 494 さ い た ま 市
/Saitama 520 札 幌 市/Sapporo 1,000 大阪市/Osaka 561 広 島 市
/Hiroshima 805さ い た ま 市
/Saitama 294 福 岡 市/Fukuoka 401 神 戸 市 /Kobe 513 仙 台 市
/Sendai 918 札 幌 市/Sapporo 478 神 戸 市 /Kobe 801
福 岡 市/Fukuoka 293 京都市/Kyoto 392 福 岡 市
/Fukuoka 505 神 戸 市 /Kobe 915 福 岡 市/Fukuoka 477 福 岡 市
/Fukuoka 787
資料:小売物価統計調査(2012 年) Source: Statistics Bureau, Ministry of Internal Affairs and Communications. Retail Price Survey (2012).
自然/Nature
104
グローバルな「食」関連企業が世界で存在感を
高める一方で、日本の消費者は、安全な「食」へ
特に高い関心を示し、国産志向が強く、地産地消
という言葉が広がるなど、素材や産地を付加価値
として重視する傾向があります。
こうした背景から、グローバルな「食」の標準化と
は異なる価値観で、国内では今も各地域の食文
化に基づく「食」にかかわる産業とローカルな物流
体系が成り立っており、その中でも、福岡市は、九
州の多彩な食材に支えられて、それを生かす多くの
人たちの手によって、魅力的で多様な食文化を育
んできました。
「食」にかかわる産業は、農林水産業はもちろ
ん、加工製造、さまざまなサービス分野などが含ま
れ、ここ福岡市でも古くから多くの関連産業・企業
が栄えてきました。
さらに、生産地における IT を駆使した生産管理
や物流の革新、医療やバイオテクノロジーとの結び
つきなど、関連する産業分野の裾野は大きく広がり
つつあります。
この福岡市の恵まれた「食」を、より多くの価値を
生み出す次代の産業の柱として育てていかねばな
りません。それは「食」のグローバル企業を生み出す
ことに限らず、付加価値の高い「食」を創造するチ
ャレンジの支援や、その魅力で国内外の多くの人を
呼び込むなど、 「食」が本来持つ地域性をいかし
ながら、福岡ならではの価値を高め、発信していくこ
とまで含みます。
福岡市は、産地と大消費地の両面併せ持つ強
みがあります。「食」にかかわる分野には、 アントレ
プレナーシップを持つ人が多く、 起業・開業が盛ん
です。
「食」の市民満足度が高いのも、このような背
景、強みによるものと考えられますが、市民だけで
なく、観光客の食事やアフターコンベンションなど、
福岡市を訪れる人にも、その満足度を共有してもら
う機会を増やしていくことが必要です。
食の強みをいかす福岡らしい価値の創造
Value Creation with Food Assets in Fukuoka
While multi-national “food” related enterprises raise their presence in the world, Japanese consumers show their strong interest in food safety and strongly prefer products made in Japan. The movement of “local production for local consumption” has spread out all over Japan, and Japanese consumers tend to focus on the type of ingredients or the place of production as the added value of the products. This background has led Japan to establish an industry related to food based on regional culture and local distribution systems; a different sense of values in food from many parts of the world. Fukuoka has created an attractive and diversified food culture supported by many people who make the best use of the variety of food ingredients from all over the Kyushu Region. The industry related to food not only includes agriculture, forestry and fishery industries but also the processing industry and other service sectors. In Fukuoka, businesses in these industries have been a major economic activity for a long while. The range of related industries is also expanding, for example, production control with IT, innovations in distribution systems, food-related medical services, and biotechnology. Further growth in the industry based on abundant food in Fukuoka needs to be developed as a pillar of the next generation of important economic sectors. To develop the food industry, it is necessary to increase the value of produce, products and services and to promote these in the market. The required development includes not only generating a global food supply chain, but also developing high value-added local food products and attracting many producers and consumers into Fukuoka. Fukuoka has an advantage of being a place of both production and consumption. In the food related sector, there are many entrepreneurial people, and there are many business entries and exits as well. The reason why citizen satisfaction with the food industry is high can be seen in these backgrounds and advantages. What is needed in the future is to increase opportunities to share the citizen satisfaction with food with visitors to Fukuoka on sightseeing and business trips.
自然/Nature
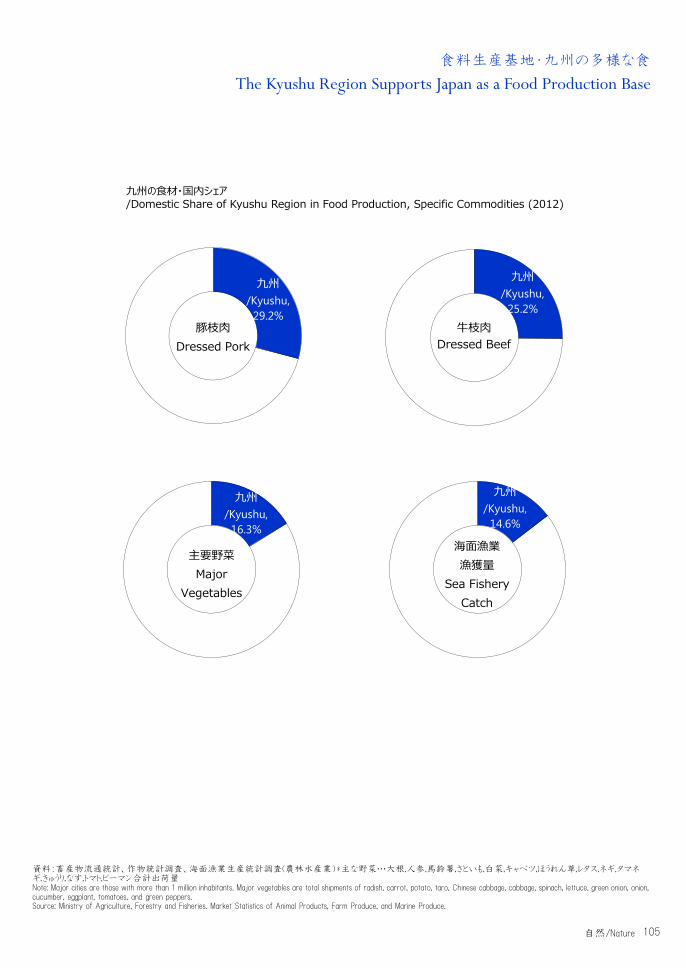
105
食料生産基地・九州の多様な食
The Kyushu Region Supports Japan as a Food Production Base
九州/Kyushu,
16.3%
主要野菜Major
Vegetables
九州/Kyushu,
14.6%
海面漁業漁獲量
Sea Fishery Catch
九州/Kyushu,
29.2%豚枝肉
Dressed Pork
九州/Kyushu,
25.2%
牛枝肉Dressed Beef
九州の食材・国内シェア /Domestic Share of Kyushu Region in Food Production, Specific Commodities (2012)
資料:畜産物流通統計、作物統計調査、海面漁業生産統計調査(農林水産業)*主な野菜…大根,人参,馬鈴薯,さといも,白菜,キャベツ,ほうれん草,レタス,ネギ,タマネギ,きゅうり,なす,トマト,ピーマン合計出荷量 Note: Major cities are those with more than 1 million inhabitants. Major vegetables are total shipments of radish, carrot, potato, taro, Chinese cabbage, cabbage, spinach, lettuce, green onion, onion, cucumber, eggplant, tomatoes, and green peppers. Source: Ministry of Agriculture, Forestry and Fisheries. Market Statistics of Animal Products, Farm Produce, and Marine Produce.
自然/Nature

106
福岡市に集まる新鮮な九州の食材
Food Ingredients from all over the Kyushu Region are Found in Fukuoka City
16,749
13,361
12,749
2,767
1,616
1,570
949
874
30,587
(20.6)
(16.4)
(15.7)
(3.4)
(2.0)
(1.9)
(1.2)
(1.1)
対馬/Tsushima
福岡/Fukuoka
長崎/Nagasaki
鹿児島/Kagoshima
佐賀/Saga
五島/Goto
壱岐/Iki
東シナ海/East China Sea
その他/Others
(t.)
福岡市中央卸売市場「野菜」産地別取扱量 /“Vegetable” Traffic, by Production District at the Fukuoka City Central Wholesale Market
福岡市中央卸売市場「果実」産地別取扱量 /“Fruit” Traffic, by Production District at the Fukuoka City Central Wholesale Market
福岡市中央卸売市場「生鮮水産物」産地別取扱量 / Fresh Marine Products Traffic, by Production Place at the Fukuoka City Central Wholesale Market
資料:福岡市農林水産局中央卸売市場青果市場(2011 年) Source: Central Wholesale Market fruit and vegetable market, Agriculture, Forestry and Fisheries Bureau, Fukuoka City (2011).
40,362
29,240
28,746
23,457
21,052
17,912
15,813
14,615
11,173
7,192
6,387
4,143
2,463
2,207
1,257
6,138
(17.4)
(12.6)
(12.4)
(10.1)
(9.1)
(7.7)
(6.8)
(6.3)
(4.8)
(3.1)
(2.8)
(1.8)
(1.1)
(1.0)
(0.5)
(2.6)
福岡県/Fukuoka PREF.
熊本県/Kumamoto PREF.
北海道/Hokkaido
長崎県/Nagaraki PREF.
長野県/Nagano PREF.
佐賀県/Saga PREF.
大分県/Oita PREF.
鹿児島県/Kagoshima PREF.
宮崎県/Miyazaki PREF.
中国/China
群馬県/Gunnma PREF.
青森県/Aomori PREF.
アメリカ/USA
ニュージーランド/New Zealand
中南米/Central&South America
その他/Others
(t.)
( )内は構成比・%(#) = component ratio (%)
18,690
11,703
6,060
4,835
3,533
2,811
2,339
2,105
1,883
1,769
1,058
833
592
393
376
4,239
(29.6)
(18.5)
(9.6)
(7.6)
(5.6)
(4.4)
(3.7)
(3.3)
(3.0)
(2.8)
(1.7)
(1.3)
(0.9)
(0.6)
(0.6)
(6.7)
フィリピン/Philippines
福岡県/Fukuoka PREF.
青森県/Aomori PREF.
熊本県/Kumamoto PREF.
佐賀県/Saga PREF.
長野県/Nagano PREF.
アメリカ/USA
大分県/Oita PREF.
中南米/Central&South America
長崎県/Nagasaki PREF.
ニュージーランド/New Zealand
愛媛県/Ehime PREF.
福島県/Fukushima PREF.
山口県/Yamaguchi PREF.
南アフリカ/South Africa
その他/ Others
(t.)
自然/Nature
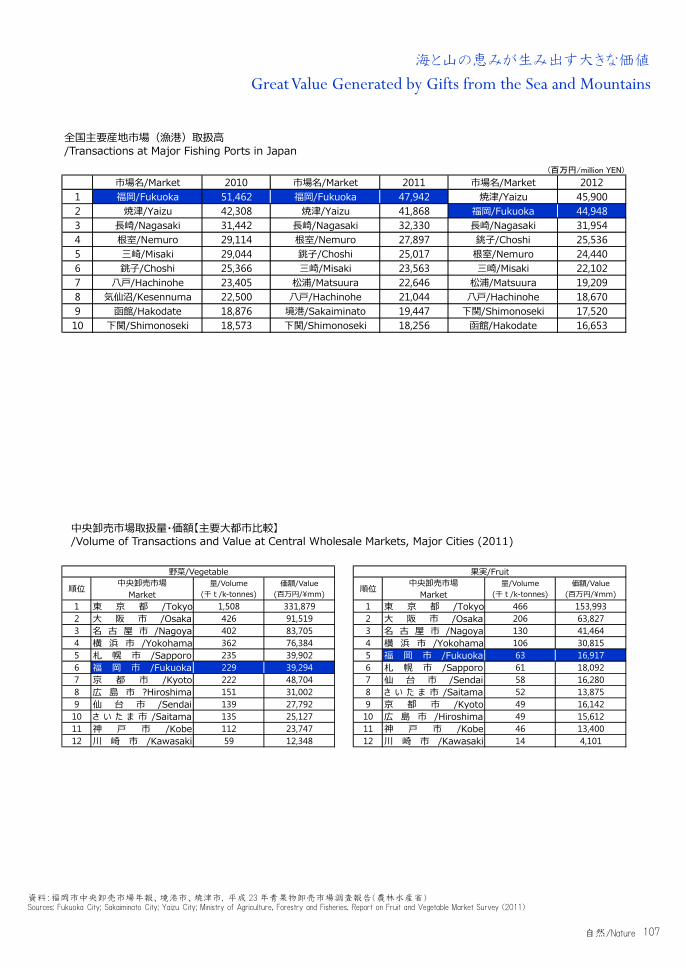
107
海と山の恵みが生み出す大きな価値
Great Value Generated by Gifts from the Sea and Mountains
野菜/Vegetable 果実/Fruit
順位 中央卸売市場Market
量/Volume(千t/k-tonnes)
価額/Value(百万円/\mm) 順位 中央卸売市場
Market量/Volume
(千t/k-tonnes)価額/Value
(百万円/\mm)1 東 京 都 /Tokyo 1,508 331,879 1 東 京 都 /Tokyo 466 153,9932 大 阪 市 /Osaka 426 91,519 2 大 阪 市 /Osaka 206 63,8273 名 古 屋 市 /Nagoya 402 83,705 3 名 古 屋 市 /Nagoya 130 41,4644 横 浜 市 /Yokohama 362 76,384 4 横 浜 市 /Yokohama 106 30,8155 札 幌 市 /Sapporo 235 39,902 5 福 岡 市 /Fukuoka 63 16,9176 福 岡 市 /Fukuoka 229 39,294 6 札 幌 市 /Sapporo 61 18,0927 京 都 市 /Kyoto 222 48,704 7 仙 台 市 /Sendai 58 16,2808 広 島 市 ?Hiroshima 151 31,002 8 さ い た ま 市 /Saitama 52 13,8759 仙 台 市 /Sendai 139 27,792 9 京 都 市 /Kyoto 49 16,14210 さ い た ま 市 /Saitama 135 25,127 10 広 島 市 /Hiroshima 49 15,61211 神 戸 市 /Kobe 112 23,747 11 神 戸 市 /Kobe 46 13,40012 川 崎 市 /Kawasaki 59 12,348 12 川 崎 市 /Kawasaki 14 4,101
(百万円/million YEN)
市場名/Market 2010 市場名/Market 2011 市場名/Market 20121 福岡/Fukuoka 51,462 福岡/Fukuoka 47,942 焼津/Yaizu 45,9002 焼津/Yaizu 42,308 焼津/Yaizu 41,868 福岡/Fukuoka 44,9483 長崎/Nagasaki 31,442 長崎/Nagasaki 32,330 長崎/Nagasaki 31,9544 根室/Nemuro 29,114 根室/Nemuro 27,897 銚子/Choshi 25,5365 三崎/Misaki 29,044 銚子/Choshi 25,017 根室/Nemuro 24,4406 銚子/Choshi 25,366 三崎/Misaki 23,563 三崎/Misaki 22,1027 八戸/Hachinohe 23,405 松浦/Matsuura 22,646 松浦/Matsuura 19,2098 気仙沼/Kesennuma 22,500 八戸/Hachinohe 21,044 八戸/Hachinohe 18,6709 函館/Hakodate 18,876 境港/Sakaiminato 19,447 下関/Shimonoseki 17,52010 下関/Shimonoseki 18,573 下関/Shimonoseki 18,256 函館/Hakodate 16,653
全国主要産地市場(漁港)取扱高 /Transactions at Major Fishing Ports in Japan
中央卸売市場取扱量・価額【主要大都市比較】 /Volume of Transactions and Value at Central Wholesale Markets, Major Cities (2011)
資料:福岡市中央卸売市場年報、境港市、焼津市, 平成 23 年青果物卸売市場調査報告(農林水産省) Sources: Fukuoka City; Sakaiminato City; Yaizu City; Ministry of Agriculture, Forestry and Fisheries. Report on Fruit and Vegetable Market Survey (2011)
自然/Nature
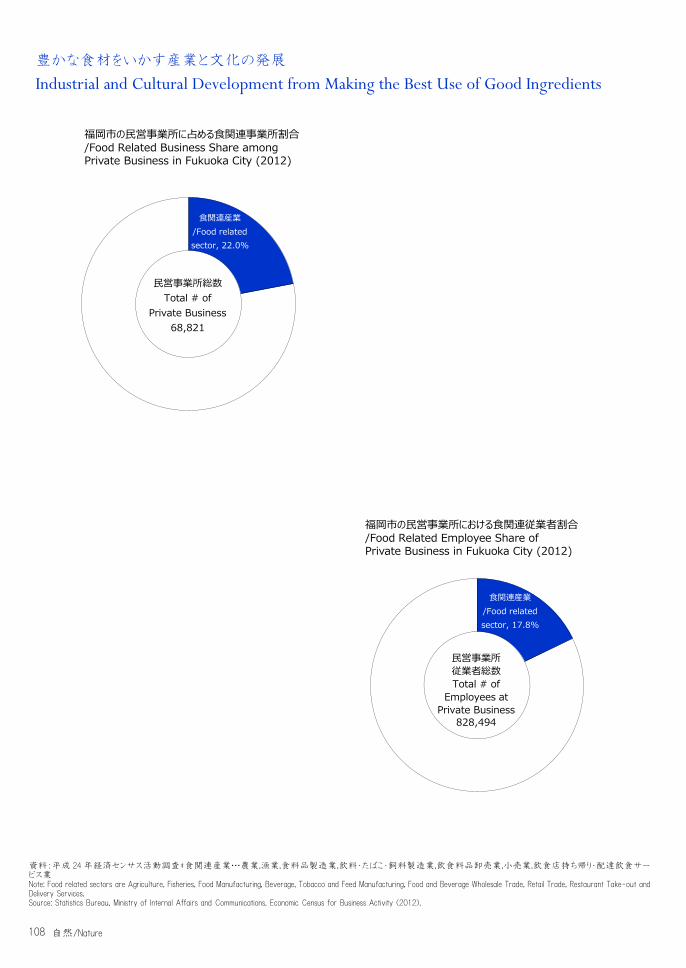
108
豊かな食材をいかす産業と文化の発展
Industrial and Cultural Development from Making the Best Use of Good Ingredients
食関連産業/Food related sector, 22.0%
民営事業所総数Total # of
Private Business68,821
食関連産業/Food related sector, 17.8%
民営事業所従業者総数Total # of
Employees at Private Business
828,494
福岡市の民営事業所に占める食関連事業所割合 /Food Related Business Share among Private Business in Fukuoka City (2012)
福岡市の民営事業所における食関連従業者割合 /Food Related Employee Share of Private Business in Fukuoka City (2012)
資料:平成 24 年経済センサス活動調査*食関連産業…農業,漁業,食料品製造業,飲料・たばこ・飼料製造業,飲食料品卸売業,小売業,飲食店持ち帰り・配達飲食サービス業 Note: Food related sectors are Agriculture, Fisheries, Food Manufacturing, Beverage, Tobacco and Feed Manufacturing, Food and Beverage Wholesale Trade, Retail Trade, Restaurant Take-out and Delivery Services. Source: Statistics Bureau, Ministry of Internal Affairs and Communications. Economic Census for Business Activity (2012).
自然/Nature
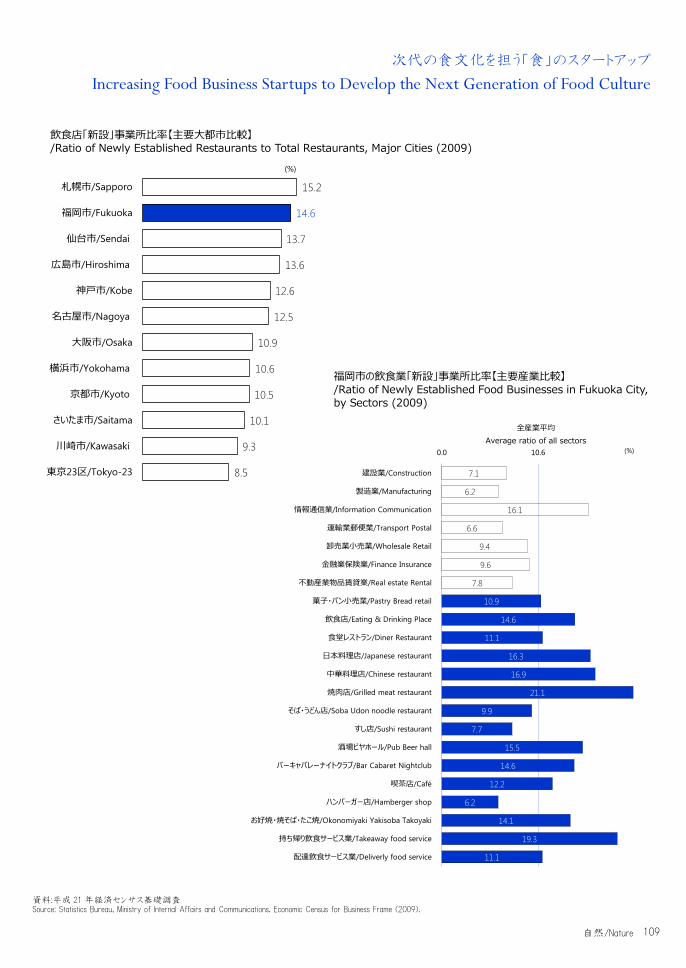
109
次代の食文化を担う「食」のスタートアップ
Increasing Food Business Startups to Develop the Next Generation of Food Culture
7.1
6.2
16.1
6.6
9.4
9.6
7.8
10.9
14.6
11.1
16.3
16.9
21.1
9.9
7.7
15.5
14.6
12.2
6.2
14.1
19.3
11.1
0.0 10.6
建設業/Construction
製造業/Manufacturing
情報通信業/Information Communication
運輸業郵便業/Transport Postal
卸売業小売業/Wholesale Retail
金融業保険業/Finance Insurance
不動産業物品賃貸業/Real estate Rental
菓子・パン小売業/Pastry Bread retail
飲食店/Eating & Drinking Place
食堂レストラン/Diner Restaurant
日本料理店/Japanese restaurant
中華料理店/Chinese restaurant
焼肉店/Grilled meat restaurant
そば・うどん店/Soba Udon noodle restaurant
すし店/Sushi restaurant
酒場ビヤホール/Pub Beer hall
バーキャバレーナイトクラブ/Bar Cabaret Nightclub
喫茶店/Café
ハンバーガー店/Hamberger shop
お好焼・焼そば・たこ焼/Okonomiyaki Yakisoba Takoyaki
持ち帰り飲食サービス業/Takeaway food service
配達飲食サービス業/Deliverly food service
全産業平均Average ratio of all sectors
(%)
15.2
14.6
13.7
13.6
12.6
12.5
10.9
10.6
10.5
10.1
9.3
8.5
札幌市/Sapporo
福岡市/Fukuoka
仙台市/Sendai
広島市/Hiroshima
神戸市/Kobe
名古屋市/Nagoya
大阪市/Osaka
横浜市/Yokohama
京都市/Kyoto
さいたま市/Saitama
川崎市/Kawasaki
東京23区/Tokyo-23
(%)
福岡市の飲食業「新設」事業所比率【主要産業比較】 /Ratio of Newly Established Food Businesses in Fukuoka City, by Sectors (2009)
飲食店「新設」事業所比率【主要大都市比較】 /Ratio of Newly Established Restaurants to Total Restaurants, Major Cities (2009)
資料:平成 21 年経済センサス基礎調査 Source: Statistics Bureau, Ministry of Internal Affairs and Communications. Economic Census for Business Frame (2009).
自然/Nature

110

111
未来に向けて
Going Forward
メッセージ Message
112
福岡を取巻く環境は目まぐるしく変化し続けています。
2013 年度だけを見ても、富士山の世界文化遺産への登録、2020 年の東京五輪・パラリンピック開催決
定、 JR 九州の「ななつ星in九州」の運行開始など、日本や九州を浮揚させる明るいニュースが沢山ありまし
た。
一方で、東アジア、中東、中央アジアなどの政情不安、世界各地で頻発する災害、国内外の不透明な
経済見通しなど、課題も山積しています。
そのような中、人口が 150 万人を突破した福岡市では、新しい総合計画が策定され、観光庁より「グロー
バル MICE 戦略都市」に指定され、国家戦略特区に申請するなど、持続的な成長に向けた歩みを進めてい
ます。
都市の定点観測に基づくコミュニケーションが重要になっています。
社会の変化がますます速くなっている今日、成長に向けた地域戦略の進捗を評価し、必要に応じて見直
していくことが不可欠です。
そのため、データによる都市の定点観測の重要性は増しており、当研究所のみならず様々な関係者が、
福岡を観測し、それを基にコミュニケーションを深めていくことが重要です。
コミュニケーション・ツールの一例として『Fukuoka Facts』をご紹介します。
『Fukuoka Facts データでわかるイイトコ福岡』 (http://facts.city.fukuoka.lg.jp/)
URC 情報戦略室も参画しているこの取り組みでは、 『Fukuoka Growth』の内容の一部が、クリエイティブの力
によって素晴らしいコミュニケーション・ツールに昇華されました。
その結果、自治体が持つデータを、街の宣伝・広告活動に繋げる優れた取り組みとして産官学組織「オ
ープンデータ流通推進コンソーシアム」から「日本マイクロソフト賞」をいただきました。このように、データが地
域を考える人々のコミュニケーション・ツールになって行くことが、私たち URC 情報戦略室の願いです。
『Fukuoka Growth』の今後。
世界地図上の福岡の位置を明確に定める一助になることを目指して、2013 年 6 月の創刊から 9 ヶ月間、
ほぼ隔週ペースで発行して参りました。
これまでに目を通して下さったり、データ収集や分析のご協力下さった皆様に、心からお礼申し上げます。
これからも、Fukuoka を、そして URC 情報戦略室を、よろしくお願いします。
4 月以降は、さらに進化した形で、定期的に情報の発信・提供を行う予定です。
『Fukuoka Growth2013-2014』を活用ください。
『Fukuoka Growth2013-2014』は、これまで発行した『Fukuoka Growth』を再編集、再構成したものです。データ
でみる福岡市の成長ポテンシャルの確認はもちろん、英語併記となっておりますので、海外を含む他の地域
へ、福岡市の魅力や成長力を紹介、PR するツールとしても、ぜひご活用ください。
2014 年 3 月
公益財団法人福岡アジア都市研究所
情報戦略室長 後藤 太一
発刊に寄せて

113
Message
Fukuoka is determined to grow in a sustainable way in the rapidly changing world. There have been many recent positives in Japan and Kyushu, such as, Mt. Fuji being named a World Heritage Site, Tokyo being chosen to host the 2020 Olympic and Paralympic Games, and the cruise train “Seven Stars in Kyushu” beginning operations. Conversely, there has been increasing uncertainty related to political instability in East Asia, the Middle East and Central Asia, frequent natural disasters, and the prospects for the national and global economy. Fukuoka, whose population exceeds 1.5 million, has steadily moved ahead toward sustainable growth by adopting a new Development Master Plan, being designated as a “Global MICE Strategic City” by the National Tourism Agency, and by applying for status as a “National Strategic Economic Growth Area.”
Communication based upon regular monitoring of the city’s economy and society has become more important.
As changes in society have been increasingly become faster and larger, the growth strategy of a city should be frequently revised based upon regular assessment of its progress. Monitoring of the city has therefore become more important as a base for policy communication amongst a variety of stakeholders in Fukuoka.
“Fukuoka Facts” is a good tool for such communication.
Fukuoka Facts – Data about the Best of Fukuoka – can be found at http://facts.city.fukuoka.lg.jp/en/. “Fukuoka Growth” has provided integral contents for Fukuoka Facts, while creative communication designers have provided excellent user interfaces for this. Fukuoka Facts honorably received a Microsoft Japan Award from the Open Data Distribution Promotion Consortium as an excellent initiative of city sales through utilizing public statistical data.
The future of “Fukuoka Growth”
Fukuoka Growth has been published since June 2013 approximately every two weeks, aiming to help the region clearly position itself on the global map. We are very grateful to our readers and contributors. We appreciate your continuing interest in Fukuoka and support for the Fukuoka Asian Urban Research Center. From April, we are going to publish and provide the information in an improved format regularly.
Please use “Fukuoka Growth 2013–2014” to the best effect.
This book contains the reedited and rearranged contents of the Fukuoka Growth reports we have published for the past 9 months. It points out the growth potential of Fukuoka and backs these up with data, and is written in both Japanese and English. We hope the book will help to introduce the charms and growth potential of Fukuoka as a tool for city sales to other cities in Japan as well as to the world.
March 2014 Taichi GOTO
Head of Information and Strategy Office Fukuoka Asian Urban Research Center
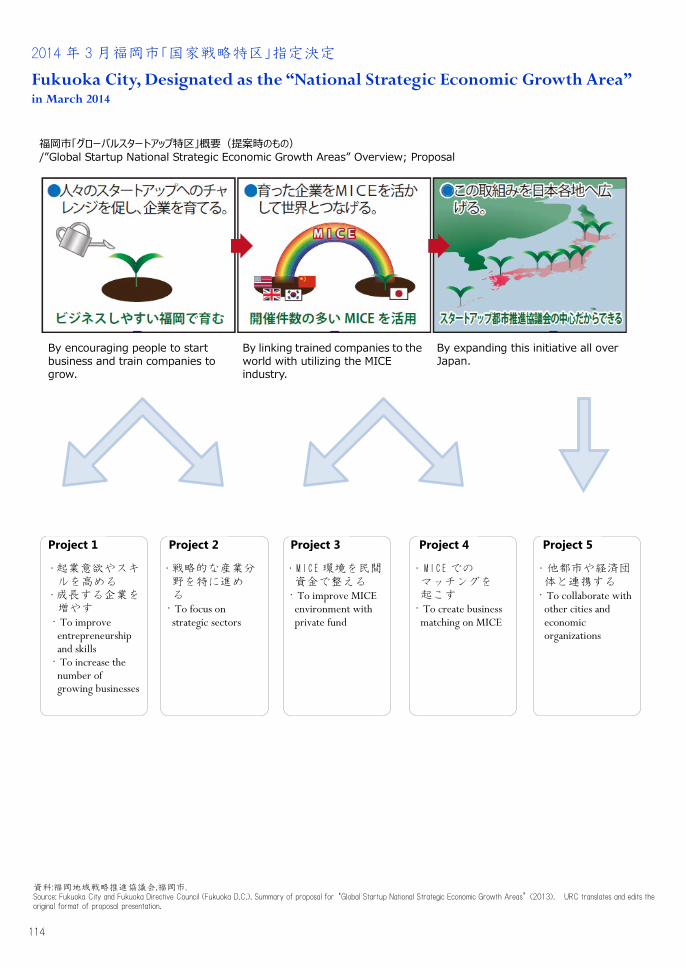
114
2014 年 3 月福岡市「国家戦略特区」指定決定
Fukuoka City, Designated as the “National Strategic Economic Growth Area”
福岡市「グローバルスタートアップ特区」概要(提案時のもの) /”Global Startup National Strategic Economic Growth Areas” Overview; Proposal
By encouraging people to start business and train companies to grow.
By linking trained companies to the world with utilizing the MICE industry.
By expanding this initiative all over Japan.
・起業意欲やスキルを高める
・成長する企業を増やす
・To improve entrepreneurship and skills
・To increase the number of growing businesses
Project 1
・戦略的な産業分野を特に進める
・To focus on strategic sectors
・MICE 環境を民間資金で整える
・To improve MICE environment with private fund
・MICE での マッチングを 起こす
・To create business matching on MICE
・他都市や経済団体と連携する
・To collaborate with other cities and economic organizations
Project 2 Project 3 Project 4 Project 5
資料:福岡地域戦略推進協議会,福岡市. Source: Fukuoka City and Fukuoka Directive Council (Fukuoka D.C.). Summary of proposal for ‘Global Startup National Strategic Economic Growth Areas’ (2013). URC translates and edits the original format of proposal presentation.
in March 2014

115
http://urc.or.jp
http://www.city.fukuoka.lg.jp
http://facts.city.fukuoka.lg.jp
http://fukuoka-dc.jpn.com
公益財団法人福岡アジア都市研究所は、都市政策を研究し、アジアの視点を取り入れ
ながら、将来の都市戦略を提言する研究機関です。
The Fukuoka Asian Urban Research Center is a research institute dedicated to the study of urban policy and to propose urban strategies for the future extending its perspective of research and study further to the Asian region with cooperation and coordination of various quarters of society.
116
企画・編集・データ作成・執筆・写真
研究主査
Planning, data analysis, writing, editing, photography Researcher
Fukuoka Growth 2013-2014
2014 年 3 月
公益財団法人 福岡アジア都市研究所
情報戦略室 〒810-0001 福岡市中央区天神 1 丁目 10-1
電話 092-733-5686
http://urc.or.jp/
総合監修・執筆・写真
情報戦略室室長
General supervision, writing, photography Head of Information and Strategy Office
英文・表紙デザイン・写真
研究員
English, book cover design, photography Researcher
畠山 尚久
Naohisa HATAKEYAMA
後藤 太一
Taichi GOTO
山田 美里
Misato YAMADA
