gis-3d analysis of susceptibility landslide disaster in upstream area of jeneberang river watershed,...
TRANSCRIPT

International Journal of Innovative Research in Advanced Engineering (IJIRAE) ISSN: 2349-2763 Issue 08, Volume 3 (August 2016) www.ijirae.com
_________________________________________________________________________________________________ IJIRAE: Impact Factor Value – SJIF: Innospace, Morocco (2015): 3.361 | PIF: 2.469 | Jour Info: 4.085 |
Index Copernicus 2014 = 6.57 © 2014- 16, IJIRAE- All Rights Reserved Page -1
GIS-3D Analysis of Susceptibility Landslide Disaster in Upstream Area of Jeneberang River Watershed, South
Sulawesi, Indonesia
Yoenus Osman*, Ramli Rahim**, Saleh Pallu**, Sumbangan Baja** *Doctorate Program of Civil Engineering, Hasanuddin University, South Sulawesi, 90111 Indonesia
**Professor, Hasanuddin University, South Sulawesi, 90111 Indonesia
Abstract: The assessment of landslide hazard and risk has become a topic of major interest for both geoscientists and engineering professionals as well as for local communities and administrations in many parts of the world. Recently, Geographic Information Systems (GIS), with their excellent spatial data processing capacity, have attracted great attention in natural disaster assessment. In this paper, an assessment of landslide hazard at Upper Area of Jeneberang Watershed has been studied using GIS technology. By simulating the potential landslide according the minimum safety factor value using GIS, it can be expected that great contribution as a basic decision making for many prevention works before future landslide occurs at upstream area of Jeneberang River Watershead, South Sulawesi, Indonesia
Keywords: Geographic Information Systems (GIS), three-dimensional slope stability, landslide hazards, deterministic model, slope unit, Jeneberang River Watershed
I. INTRODUCTION
Geographic Information Systems (GIS) is a system of hardware and software for data capture, input, manipulation, transformation, visualization, combination, query, analysis, modeling and output. GIS provides strong functions in spatially distributed data processing and analysis. GIS in conjunction with remote sensing can be used to identify hazards [1,2]. The information required for landslide hazards assessment includes the location and properties of faults, surface geology, terrain slope, underground water and landslide occurrences. Similarly, topology data is required for flood and sediment flow assessment analysis. In addition, new hazard layers can be generated within a GIS by combining hazard layers. For example, a landslide hazard layer can be generated by overlaying elevation, surface geology, underground water layer and landslide inventory data [3]. The information retrieved by querying the GIS database serves as inputs for the risk assessment models. These risk assessment models can run both deterministic as well as probabilistic risk assessment [4]. Deterministic risk assessment involves defining a disaster event and computing the damage associated with that event, whereas probabilistic risk assessment computes damages for different events, accounting for the probability of each event. The resulting loss patterns over regions and their associated uncertainties that are computed through this risk assessment can be mapped and again used for querying information through GIS applications. GIS technology provides a powerful tool for displaying outputs and permits users to observe the geographic distribution of impacts from different peril scenarios and assumptions and allows the user to perform a quick graphical sensitivity analysis of the factors affecting the risk potential [5]. A GIS-based software system creates the ideal framework to integrate the various component of the model [6].
II. LANDSLIDE HAZARDS ASSESSMENT USING GIS TECHNOLOGY
It has been estimated that nearly 600 people are killed every year worldwide as a consequence of slope failure. As regards the economic damage in many developing countries, natural catastrophes account for 1-2% of the gross national product [7]. While landslides have a significant impact, their importance is often under-estimated as the landslide damage is considered simply as a result of the triggering processes and is thus included in the reports of other phenomena such as heavy rain, earthquakes, floods etc.

International Journal of Innovative Research in Advanced Engineering (IJIRAE) ISSN: 2349-2763 Issue 08, Volume 3 (August 2016) www.ijirae.com
_________________________________________________________________________________________________ IJIRAE: Impact Factor Value – SJIF: Innospace, Morocco (2015): 3.361 | PIF: 2.469 | Jour Info: 4.085 |
Index Copernicus 2014 = 6.57 © 2014- 16, IJIRAE- All Rights Reserved Page -2
At the same time, GIS can easily and effectively analyze slope stability if a GIS-based geotechnical analysis model can be developed. The geotechnical model, which is deterministic or probabilistic, has been widely employed in civil engineering and engineering geology for slope stability analysis, and even for landslide hazard mapping, especially since the introduction of GIS. A deterministic approach was traditionally considered to be sufficient for both homogenous and non-homogenous slopes. The index of stability is a widely used safety factor, based on the appropriate geotechnical model and on physical and mechanical parameters[8]. The calculation of the safety factor requires geometrical data, data on shear strength parameters and information on pore water pressure. Correct results depend on the reliability of the data and on the appropriateness of the model. Though the input data will be greatly influential on the safety factor, a reliable deterministic model is more important for obtaining reliable results. Landslide is a three-dimensional (3D) phenomenon. However, 3D stability analysis is rarely done in the stability analysis of landslides [9]. That is due to the availability of two-dimensional (2D) software, requirement of less data and simplicity in the analysis method. Moreover, there is no agreement in the assignment of shear strength (c and) during stability analysis. Some neglects the value of c whereas the others either estimate it with respect to average depth or according to the linearly interpolated result of the shear envelope [10].
In deterministic distributed modeling, the spatial distribution of the input parameters should be assessed by interpretation of aerial photos and satellite images, fieldwork, and laboratory analysis [11]. The next step is to enter the data into a GIS. The most frequently used method is to digitize the data and convert it to a raster format. Because of its simple data structure and easy integration with remote sensing data, the raster format is widely used in spatial analysis, simulation and modeling. In a raster-based GIS, an area is subdivided into cells or pixels. Each cell or pixel can be treated as a homogeneous area with one or more attribute values. The spatial distribution of the input parameters is represented as maps which give for each pixel the value of the parameters necessary in the deterministic calculations, such as soil strength, soil density, soil depth, depth of the groundwater table, surface topography and seismic acceleration [12].
Slope stability models calculate the safety factor for a slope in two or three dimensions. Since an area consists of many slopes, the use of these models to obtain the spatial distribution of safety factors is very time-consuming, as each slope has to be analyzed separately. To overcome the problem of data conversion, deterministic model calculations can be performed within the GIS. The disadvantage of this approach is, however, that only simple models can be easily applied due to limitations with respect to the use of complex algorithms, iteration procedures and the third dimension in the conventional, two-dimensional GIS. Currently, only infinite slope models, which allow for the calculation of the safety factor for each pixel individually, are applied inside such GIS systems. It has been considered that, only when more sophisticated, three-dimensional GIS systems are used, can this problem be solved satisfactorily.
From a survey of recent applications of GIS to slope stability analysis, it is found that most research concentrates on using a statistical method to quantify the relationship between slope failure and influential factors, while GIS performs regional data preparation and processing. Little research has been conducted into the integration of GIS and the deterministic model for slope stability [13,14].
III. GIS BASED DATA MODEL FOR 3D SLOPE STABILITY ANALYSIS
Hovland [10] appears to have been the first to analyze a three-dimensional slope using the column method. Hovland’s method is an extension of an assumption associated with the two-dimensional ordinary method. In other words, all intercolumn forces acting on the base of each column are derived as components of the weight of the column. The solutions indicated that the three-dimensional analysis of a slope gave a factor of safety that was generally much higher than that of the two-dimensional analysis. All of the methods mentioned above have used the column method. These methods either neglect the intercolumn forces or make assumptions that have not been fully verified. The applicability of these methods has been based on experience gained using 2D analysis, and the accuracy of the 3D methods has not been independently studied.
Landslides have fixed relations to the geological and geomorphologic aspects of the study area. So in this research, the slope unit is taken as the object of study. The slope unit, that is, the portion of land surface that contains a set of ground conditions that differ from the adjacent units, possesses an explicit topographical (break line, stream, aspect and slope) and geological form. Since a clear physical relationship exists between landslides and the fundamental morphological elements of a hilly or mountain region, namely drainage and dividing lines, the slope unit technique seems most appropriate for landslide hazard assessment. Slope units are basically divided by geomorphological, geological and hydraulic conditions. The appropriate size of a slope unit should be dependant on the average size of the landslide bodies present in the study area. Since it is virtually impossible to consistently draw dividing lines on topographic maps covering large regions, an automatic computer procedure is required. In this study, a GIS-based watershed analysis tool has been used to divide the slope unit automatically.
International Journal of Innovative Research in Advanced Engineering (IJIRAE) ISSN: 2349-2763 Issue 08, Volume 3 (August 2016) www.ijirae.com
_________________________________________________________________________________________________ IJIRAE: Impact Factor Value – SJIF: Innospace, Morocco (2015): 3.361 | PIF: 2.469 | Jour Info: 4.085 |
Index Copernicus 2014 = 6.57 © 2014- 16, IJIRAE- All Rights Reserved Page -3
Using the functions of GIS spatial analysis, the following parameters or data are available with respect to each pixel or polygon (the whole study area is divided into pixels or polygons):
a. Topographical parameters (such as elevation, inclination, and slope) with respect to each pixel; b. Spatial distribution and size parameters of landslide (suspect critical slip surface and its confines); c. Mechanical parameters for each pixel or polygon; d. Groundwater conditions. By inputting these parameters into the deterministic model of slope stability, the value of the safety factor or the
probability of failure can be obtained. Based on Hovland’s [10] model, a GIS grid-based 3D model, in which pore groundwater pressure is considered, and in which all input data can be easily given in a grid-based form, will be proposed in detail.
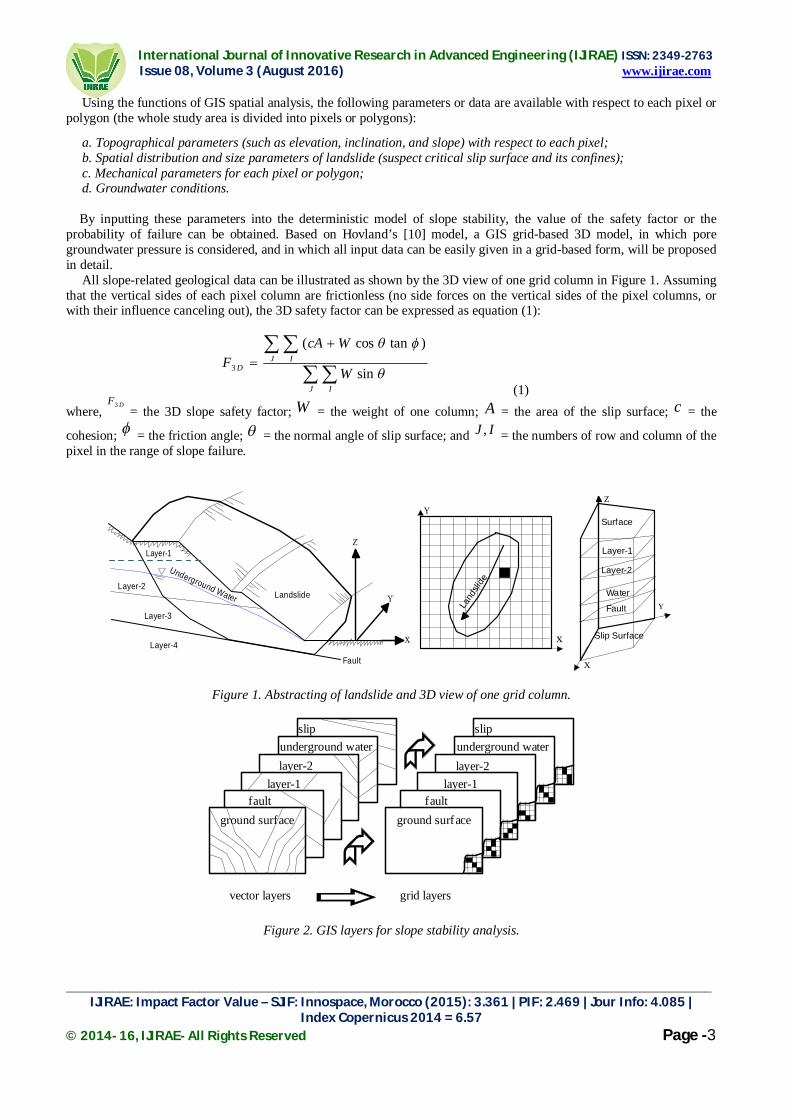
All slope-related geological data can be illustrated as shown by the 3D view of one grid column in Figure 1. Assuming that the vertical sides of each pixel column are frictionless (no side forces on the vertical sides of the pixel columns, or with their influence canceling out), the 3D safety factor can be expressed as equation (1):
J I
J ID W
WcAF
sin
)tancos(3
(1) where,
DF3 = the 3D slope safety factor; W = the weight of one column; A = the area of the slip surface; c = the
cohesion; = the friction angle; = the normal angle of slip surface; and IJ , = the numbers of row and column of the pixel in the range of slope failure.
Land
slide
x
Surface
Layer-1
Layer-2
Water
Fault
Slip Surface
X
Y
Z
Layer-1
Layer-2
Layer-3
Underground Water Landslide
Layer-4
Fault
'
'
X
Figure 1. Abstracting of landslide and 3D view of one grid column.
ground surfacefault
underground waterlayer-2
layer-1
slip
ground surfacefault
underground waterlayer-2
layer-1
slip
grid layersvector layers
Figure 2. GIS layers for slope stability analysis.
International Journal of Innovative Research in Advanced Engineering (IJIRAE) ISSN: 2349-2763 Issue 08, Volume 3 (August 2016) www.ijirae.com
_________________________________________________________________________________________________ IJIRAE: Impact Factor Value – SJIF: Innospace, Morocco (2015): 3.361 | PIF: 2.469 | Jour Info: 4.085 |
Index Copernicus 2014 = 6.57 © 2014- 16, IJIRAE- All Rights Reserved Page -4
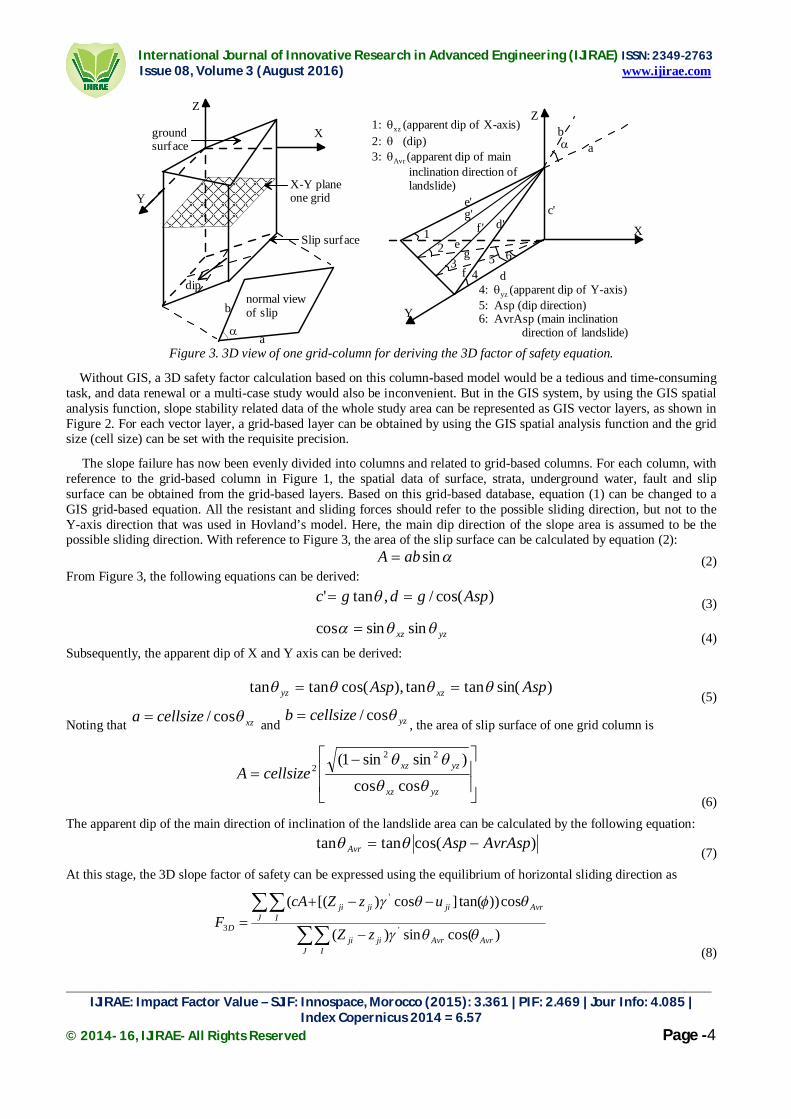
Slip surface
1: xz (apparent dip of X-axis)2: (dip)3: Avr (apparent dip of main inclination direction of landslide)
4: yz (apparent dip of Y-axis) 5: Asp (dip direction)6: AvrAsp (main inclination direction of landslide)
12
34
65
c'e'g'
f ' d'
dfg
e
ab
Z
X
Y
dip
a
b
normal viewof slip
X
Y
Z
X-Y planeone grid
groundsurface
Figure 3. 3D view of one grid-column for deriving the 3D factor of safety equation.
Without GIS, a 3D safety factor calculation based on this column-based model would be a tedious and time-consuming task, and data renewal or a multi-case study would also be inconvenient. But in the GIS system, by using the GIS spatial analysis function, slope stability related data of the whole study area can be represented as GIS vector layers, as shown in Figure 2. For each vector layer, a grid-based layer can be obtained by using the GIS spatial analysis function and the grid size (cell size) can be set with the requisite precision.
The slope failure has now been evenly divided into columns and related to grid-based columns. For each column, with reference to the grid-based column in Figure 1, the spatial data of surface, strata, underground water, fault and slip surface can be obtained from the grid-based layers. Based on this grid-based database, equation (1) can be changed to a GIS grid-based equation. All the resistant and sliding forces should refer to the possible sliding direction, but not to the Y-axis direction that was used in Hovland’s model. Here, the main dip direction of the slope area is assumed to be the possible sliding direction. With reference to Figure 3, the area of the slip surface can be calculated by equation (2):
sinabA (2) From Figure 3, the following equations can be derived:
)cos(/,tan' Aspgdgc (3)
yzxz sinsincos (4)
Subsequently, the apparent dip of X and Y axis can be derived:
)sin(tantan),cos(tantan AspAsp xzyz
(5)
Noting that xzcellsizea cos/ and yzcellsizeb cos/, the area of slip surface of one grid column is
yzxz
yzxzcellsizeA
coscos
)sinsin1( 222
(6)
The apparent dip of the main direction of inclination of the landslide area can be calculated by the following equation:
)cos(tantan AvrAspAspAvr
(7)
At this stage, the 3D slope factor of safety can be expressed using the equilibrium of horizontal sliding direction as
J IAvrAvrjiji
J IAvrjijiji
D zZ
uzZcAF
)cos(sin)(
cos))tan(]cos)[((
'
'
3
(8)

International Journal of Innovative Research in Advanced Engineering (IJIRAE) ISSN: 2349-2763 Issue 08, Volume 3 (August 2016) www.ijirae.com
_________________________________________________________________________________________________ IJIRAE: Impact Factor Value – SJIF: Innospace, Morocco (2015): 3.361 | PIF: 2.469 | Jour Info: 4.085 |
Index Copernicus 2014 = 6.57 © 2014- 16, IJIRAE- All Rights Reserved Page -5
where, for each grid, jiji zZ ,= the elevations of ground-surface and slip-surface; jiu
= the pore water pressure on the
slip-surface; and ' = the unit weight.
The slip surface is obtained by detailed geotechnical investigation, but generally speaking, the detail of a slip surface is uncertain, so, in slope stability analysis, it is important, for hazard evaluation, to identify the critical slip surface. To detect the 3D critical slip, the search is performed by means of a minimization of the 3D safety factor (which is calculated by equation (8)), using the Monte Carlo random simulation method. The initial slip surface is assumed as the lower part of an ellipsoid slip and the slip surface will change according to differing layer strengths and conditions of discontinuous surface. Finally, the critical slip surface will be obtained, and consequently, a relative minimization of the 3D safety factor can be achieved. The initial slip surface is assumed as the lower part of an ellipsoid, and the direction of inclination of the ellipsoid is set to be the same as the main direction of inclination (dip) of the study area. The inclination angle of the ellipsoid is basically set as the main inclination angle of the study area with changes in certain fluctuations. The main direction of inclination and the main inclination angle are determined by the main value of all pixels in the slope failure area. The Z value (elevation) of point “B” of the slip surface is determined by the solution of equations of line AB and ellipsoid (see Figure 4).
A
B
Assumed Slip
EllipsoidGround Surface Line
Slope
(X0,Y0,Z0)
Figure 4. Getting the Z value of slip surface.
Layer for 3D analysis (Digital elevation model,
slope, aspect, etc.)
Geomechanical parameters
Slip surfacesMonte Carlo simulation
3D safety factor (SF) calculation
Convert to grid point
Grid layers
Slope Hazard by Minimum 3D SF
Figure 5. Computational processes for minimum 3D factor of safety.
The whole study area (or slope failure range) can be evenly divided into small rectangular meshes that are the same as the GIS grid-based pixels. For numerical calculation of this grid-based 3D slope stability analysis, all of the above calculation procedures are programmed by Visual Basic (using GIS components). In this program, Visual Basic and ESRI’s MapObjects are employed. Figure 5 illustrates all computational processes.

International Journal of Innovative Research in Advanced Engineering (IJIRAE) ISSN: 2349-2763 Issue 08, Volume 3 (August 2016) www.ijirae.com
_________________________________________________________________________________________________ IJIRAE: Impact Factor Value – SJIF: Innospace, Morocco (2015): 3.361 | PIF: 2.469 | Jour Info: 4.085 |
Index Copernicus 2014 = 6.57 © 2014- 16, IJIRAE- All Rights Reserved Page -6
IV. 3D LANDSLIDE HAZARD ASSESSMENT AT MT. BAWAKARAENG CALDERA, JENEBERANG WATERSHIED, SOUTH SULAWESI
On March 26, 2004, the inner side of the caldera wall at Mt. Bawakaraeng (elevation: 2,830 m) collapsed on a large-scale in the Province of South Sulawesi on Sulawesi Island in the Republic of Indonesia. Two collapse areas are found at the source section of the landslide: one is a collapse with a width of 500 m that occurred near Mt. Bawakaraeng (Collapse A); the other is a huge collapse at the ridge of Mt. Sarongan, which occurred in a horseshoe shape for a horizontal length of about 1,300 m (Collapse B). The relative height of the failure slope in both collapses is about 700 m. It is presumed that the thickness of failed bedrock in Collapse A was approximately 150 m. In the case of Collapse B, considering from the fact that the summit of Mt. Bawakaraeng before the landslide was situated inside the caldera with a horizontal length of 400 m, it is inferred that the thickness of failed bedrock was about 400 m at the largest, and about 200 m on average (the average value is a little larger than that of Collapse A). From this, the amount of collapsed soil is estimated to be approximately 53 million m3 in Collapse A and about 182 million m3 in Collapse B, amounting to 235 million m3 in total.
4.1 DATA SOURCE AND PREPARATION
The study area was analyzed using the GIS software. The data available for this study include topography, engineering geology and satellite image of land use. The 1:25,000 map of contour was converted into the digital data. Contour lines are in the interval of 25 m in 1:25,000 scale of topographic map. Elevation data were obtained from the digital elevation model (DEM) with a resolution of 5 x 5 m derived from the 1:25,000 scale digital contour map of the area. The three-dimensional view of digital elevation of top of Mt. Bawakaraeng is shown in Figure 6. Three data layers are derived from these elevation data namely slope gradient, slope aspect and Three Irregular Networks (TIN) elevation data model. Proximity to drainage line is calculated using distance function in GIS spatial analysis and also catchments area were generated from DEM using Hydrologic analysis tool. These drainage network data is very valuable to calculate the flow rate of water and even if its sediment deposits assessment caused by debris flow for further analysis.
Figure 6. 3D view of digital elevation model and past slope failure units.
4.2 SLOPE GRADIENT ANALYSIS
Slope gradient has a great influence on the landslide phenomena. On a slope of uniform, isotropic material increased slope gradient correlates with increased likelihood of failure. However, variations in soil thickness and strength are two factors which vary over a wide range for both failure and non failure sites. To quantify the relative frequency of landslides on the different slope gradients, it is necessary to consider a distribution of the slope gradient categories using the available digital elevation model. The slope condition in the watershed is divided into less than 15o, 15o~25o, 25o~35o, 35o~45o and greater than 45o.
4.3 SLOPE ASPECT ANALYSIS Moisture retention and vegetation is reflected by slope aspect, which in turn may affect soil strength and susceptibility to landslides. If rainfall has a pronounced directional component by influence of a prevailing wind, the amount of rainfall falling on a slope may vary depending on its aspect. The slope gradient and slope aspect map is shown in Figure 7(a-b). 4.4 FACTOR OF SAFETY AND ROLE OF WATER
This is often expressed as the safety factor, Fs, the ratio of shear strength to shear stress. Fs = Shear Strength/Shear Stress. If the safety factor becomes less than 1.0, slope failure is expected. According Hoek [16], the factor of safety >1.3 for “temporary” slope with minimal risk of damage and factor of safety >1.5 for “permanent” slopes with no significant risk of damage.

International Journal of Innovative Research in Advanced Engineering (IJIRAE) ISSN: 2349-2763 Issue 08, Volume 3 (August 2016) www.ijirae.com
_________________________________________________________________________________________________ IJIRAE: Impact Factor Value – SJIF: Innospace, Morocco (2015): 3.361 | PIF: 2.469 | Jour Info: 4.085 |
Index Copernicus 2014 = 6.57 © 2014- 16, IJIRAE- All Rights Reserved Page -7
µ
0 1,500 3,000750 Meters
Legend
Slope Model
<VALUE>
0 - 15
151 - 25
25 - 35
35 - 45
>45
Text
Figure 7(a). Map of slope gradient.
µ
0 1,500 3,000750 Meters
Legend
Aspect Model
<VALUE>
0 - 71
71 - 143
143 - 215
215 - 287
287 - 360
Text
Figure 7(b). Map of slope aspect.
Another aspect of water that affects slope stability is fluid pressure. In some cases fluid pressure can build in such a way that water can support the weight of the overlying rock mass. When this occurs, friction is reduced, and thus the shear strength holding the material on the slope is also reduced, resulting in slope failure. Dry unconsolidated grains will form a pile with a slope angle determined by the angle of repose. The angle of repose is the steepest angle at which a pile of unconsolidated grains remains stable, and is controlled by the frictional contact between the grains. In general, for dry materials the angle of repose increases with increasing grain size, but usually lies between about 30 o and 37o [16].
4.5 SLOPE STABILITY ANALYSIS The sample study area for the landslide hazard assessment is about 40 km2 in an area located in the caldera wall at Mt. Bawakaraeng.
Legend
Slope Unit
Jeneberang_river
Sediment Damage Area
0 800 1,600400 Meters
µ2
9
1
4
3
12
10
215
20
11
1617
6
15
18
14
87
13
19
22
24
23
25
Figure 8. Slope unit numbers and sediment damage area caused by past landslides.
International Journal of Innovative Research in Advanced Engineering (IJIRAE) ISSN: 2349-2763 Issue 08, Volume 3 (August 2016) www.ijirae.com
_________________________________________________________________________________________________ IJIRAE: Impact Factor Value – SJIF: Innospace, Morocco (2015): 3.361 | PIF: 2.469 | Jour Info: 4.085 |
Index Copernicus 2014 = 6.57 © 2014- 16, IJIRAE- All Rights Reserved Page -8
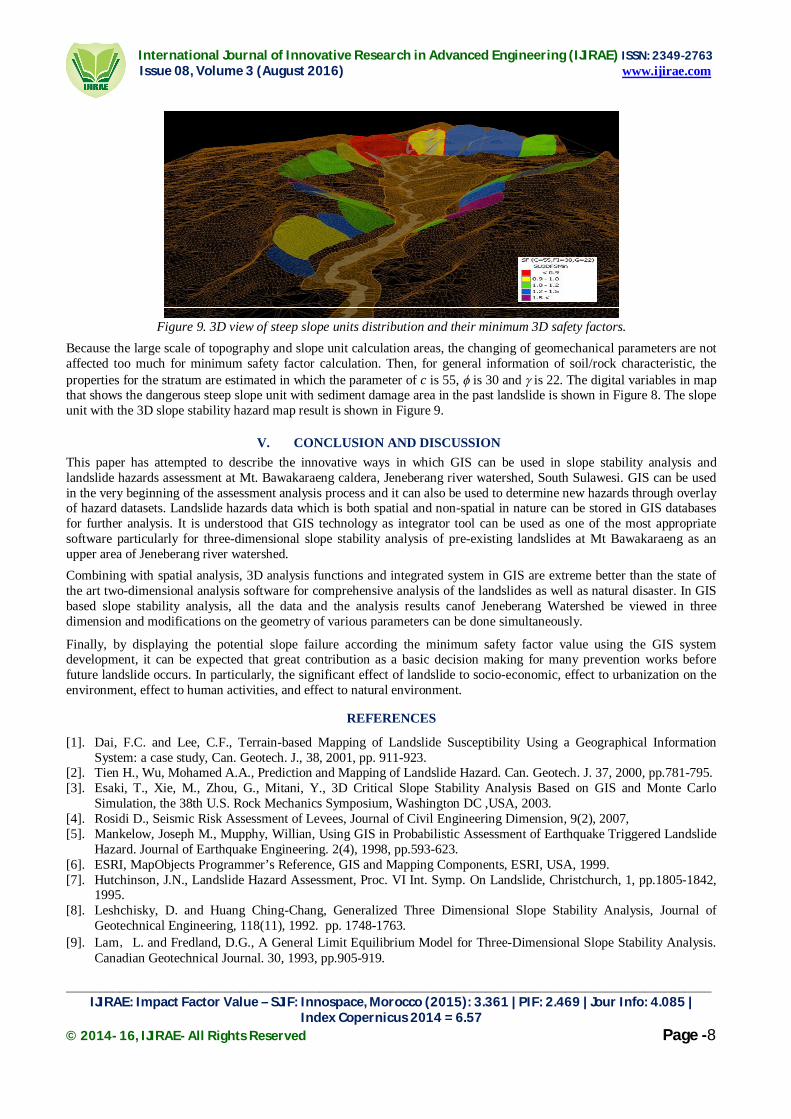
Figure 9. 3D view of steep slope units distribution and their minimum 3D safety factors.
Because the large scale of topography and slope unit calculation areas, the changing of geomechanical parameters are not affected too much for minimum safety factor calculation. Then, for general information of soil/rock characteristic, the properties for the stratum are estimated in which the parameter of c is 55, is 30 and is 22. The digital variables in map that shows the dangerous steep slope unit with sediment damage area in the past landslide is shown in Figure 8. The slope unit with the 3D slope stability hazard map result is shown in Figure 9.
V. CONCLUSION AND DISCUSSION
This paper has attempted to describe the innovative ways in which GIS can be used in slope stability analysis and landslide hazards assessment at Mt. Bawakaraeng caldera, Jeneberang river watershed, South Sulawesi. GIS can be used in the very beginning of the assessment analysis process and it can also be used to determine new hazards through overlay of hazard datasets. Landslide hazards data which is both spatial and non-spatial in nature can be stored in GIS databases for further analysis. It is understood that GIS technology as integrator tool can be used as one of the most appropriate software particularly for three-dimensional slope stability analysis of pre-existing landslides at Mt Bawakaraeng as an upper area of Jeneberang river watershed.
Combining with spatial analysis, 3D analysis functions and integrated system in GIS are extreme better than the state of the art two-dimensional analysis software for comprehensive analysis of the landslides as well as natural disaster. In GIS based slope stability analysis, all the data and the analysis results canof Jeneberang Watershed be viewed in three dimension and modifications on the geometry of various parameters can be done simultaneously.
Finally, by displaying the potential slope failure according the minimum safety factor value using the GIS system development, it can be expected that great contribution as a basic decision making for many prevention works before future landslide occurs. In particularly, the significant effect of landslide to socio-economic, effect to urbanization on the environment, effect to human activities, and effect to natural environment.
REFERENCES
[1]. Dai, F.C. and Lee, C.F., Terrain-based Mapping of Landslide Susceptibility Using a Geographical Information System: a case study, Can. Geotech. J., 38, 2001, pp. 911-923.
[2]. Tien H., Wu, Mohamed A.A., Prediction and Mapping of Landslide Hazard. Can. Geotech. J. 37, 2000, pp.781-795. [3]. Esaki, T., Xie, M., Zhou, G., Mitani, Y., 3D Critical Slope Stability Analysis Based on GIS and Monte Carlo
Simulation, the 38th U.S. Rock Mechanics Symposium, Washington DC ,USA, 2003. [4]. Rosidi D., Seismic Risk Assessment of Levees, Journal of Civil Engineering Dimension, 9(2), 2007, [5]. Mankelow, Joseph M., Mupphy, Willian, Using GIS in Probabilistic Assessment of Earthquake Triggered Landslide
Hazard. Journal of Earthquake Engineering. 2(4), 1998, pp.593-623. [6]. ESRI, MapObjects Programmer’s Reference, GIS and Mapping Components, ESRI, USA, 1999. [7]. Hutchinson, J.N., Landslide Hazard Assessment, Proc. VI Int. Symp. On Landslide, Christchurch, 1, pp.1805-1842,
1995. [8]. Leshchisky, D. and Huang Ching-Chang, Generalized Three Dimensional Slope Stability Analysis, Journal of
Geotechnical Engineering, 118(11), 1992. pp. 1748-1763. [9]. Lam,L. and Fredland, D.G., A General Limit Equilibrium Model for Three-Dimensional Slope Stability Analysis.
Canadian Geotechnical Journal. 30, 1993, pp.905-919.

International Journal of Innovative Research in Advanced Engineering (IJIRAE) ISSN: 2349-2763 Issue 08, Volume 3 (August 2016) www.ijirae.com
_________________________________________________________________________________________________ IJIRAE: Impact Factor Value – SJIF: Innospace, Morocco (2015): 3.361 | PIF: 2.469 | Jour Info: 4.085 |
Index Copernicus 2014 = 6.57 © 2014- 16, IJIRAE- All Rights Reserved Page -9
[10]. Hovland, H.J., Three-dimensional Slope Stability Analysis Method. Journal of the Geotechnical Engineering, Division Proceedings of the American Society of Civil Engineers, 103(GT9), 1977, pp.971-986.
[11]. Terlien, M.T.J., Van Asch, T.W.J., Van Westen, C.J., Deterministic Modelling in GIS-Based Landslide Hazard Assessment. Geographical Information Systems in Assessing Natural Hazards, Dordrecht, The Netherlands, pp.57–77, 1995.
[12]. Van Westen, C.J., GIS in Landslide Hazard Assessment, A View, With Example From the Colombia Andes, Mountain Environment & GIS, Taylor & Francis, 1998.
[13]. Van Westen, C.J., Application of Geographic Information Systems to Landslide Hazard Zonation. International Institute for Aerospace Survey and Earth Sciences, Publication, p.15, 1993.
[14]. Van Westen, C.J., Rengers, N., Terlien, M.T.J., Soeters, R., Prediction of the Occurrence of Slope Instability Phenomena Through GIS-based Hazard Zonation. Geologische Rundschau, 86, 1997, pp.404–414.
[15]. Janbu, N., Slope Stability Computers, The Embankment Dam Engineering, John Wiley & Sons, New York, pp. 47-86, 1973.
[16]. Evert H., Development of Rock Engineering. Course of Notes by Evert Hoek, 2001.