gis return on investment
TRANSCRIPT
Greg Babinski, MA, GISP King County GIS Center Finance & Marketing Manager URISA Past-President URISA GIS Management Institute Founding Chair FHWA GIS in Transportation Webinar November 5, 2015
Microsoft
Gates Foundation
Boeing
Paccar
Nordstrom's
Amazon
Starbucks
Port of Seattle
Weyerhaeuser
Univ. of Washington
Skype
Global Innovation Exchange
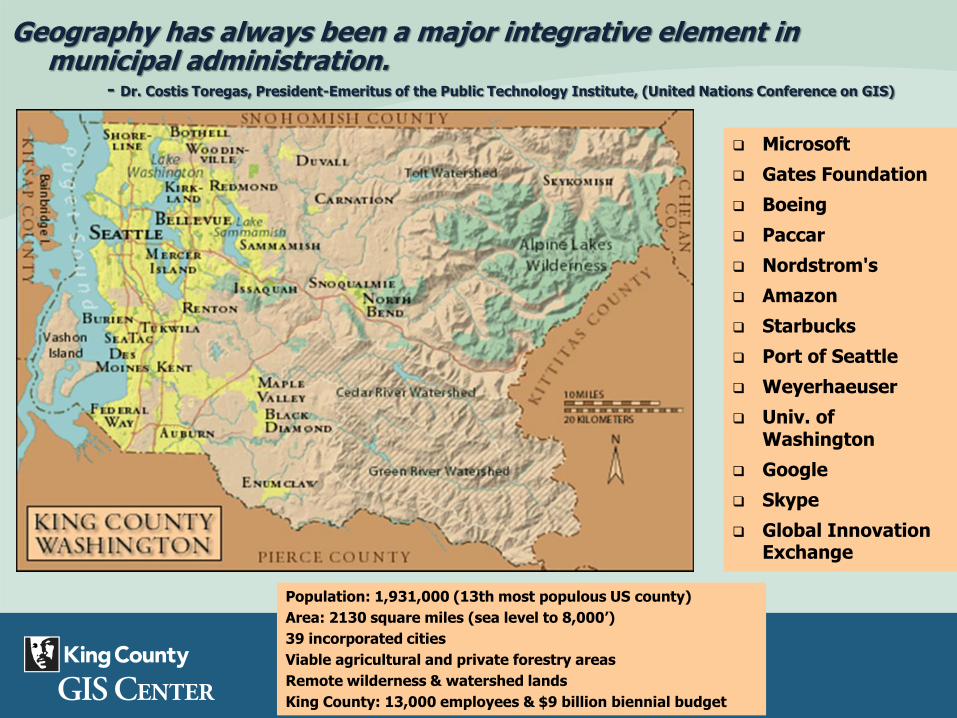
Geography has always been a major integrative element in municipal administration.
- Dr. Costis Toregas, President-Emeritus of the Public Technology Institute, (United Nations Conference on GIS)
Population: 1,931,000 (13th most populous US county)
Area: 2130 square miles (sea level to 8,000’)
39 incorporated cities
Viable agricultural and private forestry areas
Remote wilderness & watershed lands
King County: 13,000 employees & $9 billion biennial budget
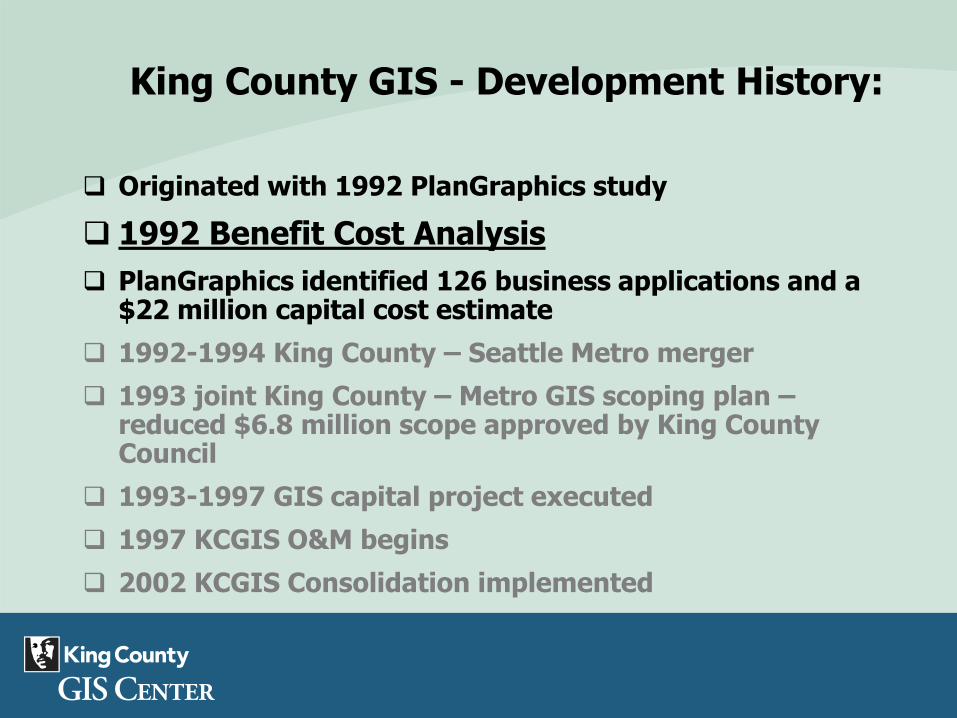
King County GIS - Development History:
Originated with 1992 PlanGraphics study
1992 Benefit Cost Analysis
PlanGraphics identified 126 business applications and a $22 million capital cost estimate
1992-1994 King County – Seattle Metro merger
1993 joint King County – Metro GIS scoping plan – reduced $6.8 million scope approved by King County Council
1993-1997 GIS capital project executed
1997 KCGIS O&M begins
2002 KCGIS Consolidation implemented
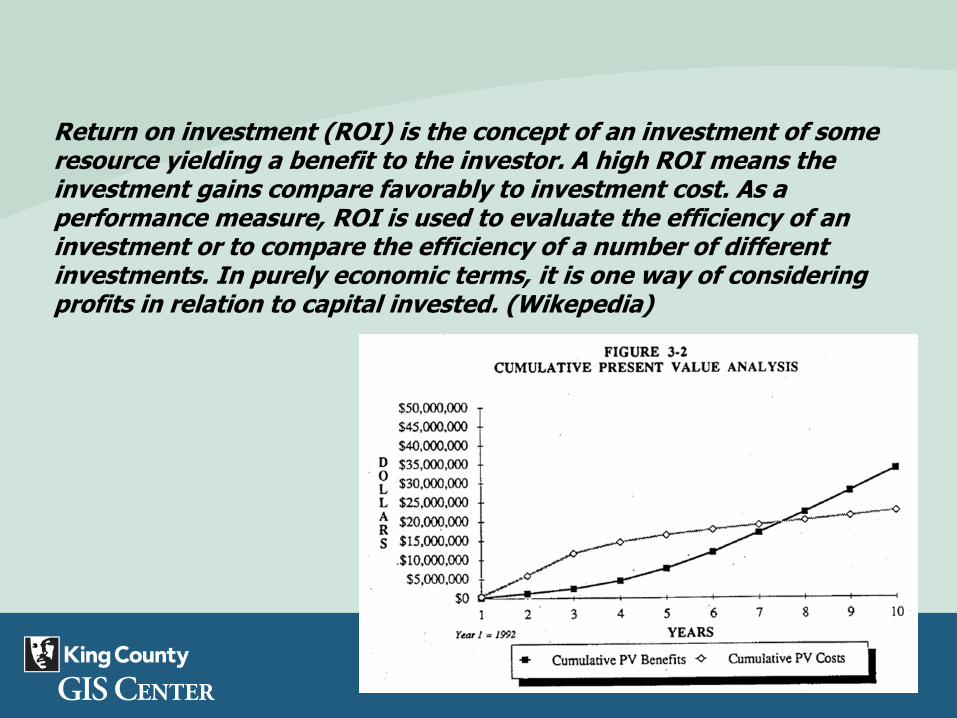
Return on investment (ROI) is the concept of an investment of some resource yielding a benefit to the investor. A high ROI means the investment gains compare favorably to investment cost. As a performance measure, ROI is used to evaluate the efficiency of an investment or to compare the efficiency of a number of different investments. In purely economic terms, it is one way of considering profits in relation to capital invested. (Wikepedia)
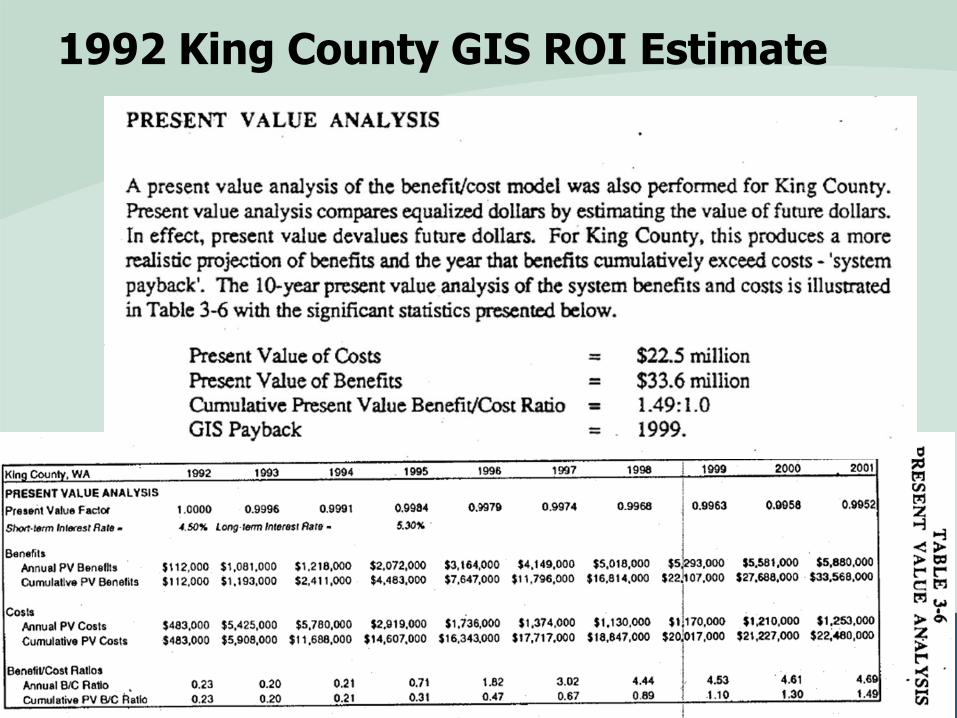
1992 King County GIS ROI Estimate
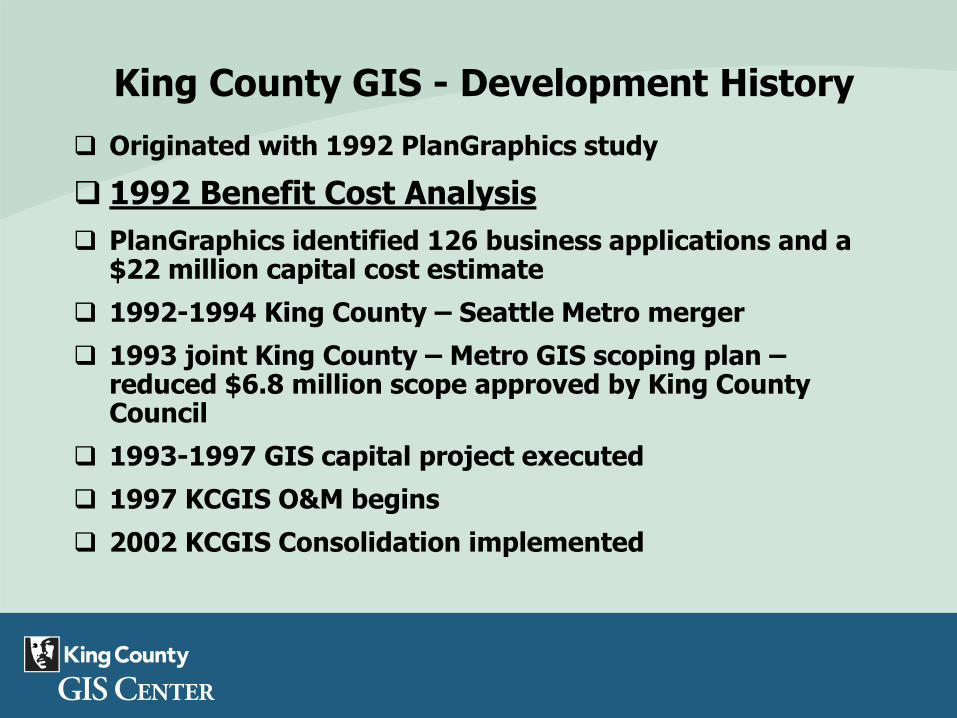
King County GIS - Development History
Originated with 1992 PlanGraphics study
1992 Benefit Cost Analysis
PlanGraphics identified 126 business applications and a $22 million capital cost estimate
1992-1994 King County – Seattle Metro merger
1993 joint King County – Metro GIS scoping plan – reduced $6.8 million scope approved by King County Council
1993-1997 GIS capital project executed
1997 KCGIS O&M begins
2002 KCGIS Consolidation implemented
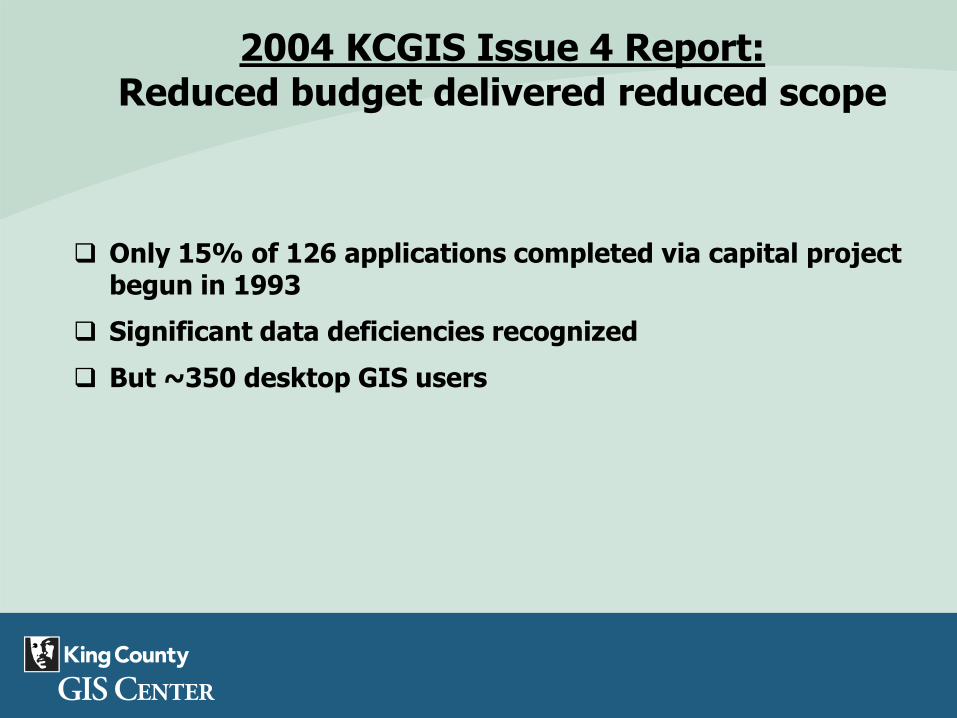
2004 KCGIS Issue 4 Report: Reduced budget delivered reduced scope
Only 15% of 126 applications completed via capital project begun in 1993
Significant data deficiencies recognized
But ~350 desktop GIS users

2010 KCGIS State of Development:
~480 desktop GIS users
100,000 annual internal web based GIS user sessions (~500 web mapping users)
2.2 million annual external web based GIS user sessions
50 GIS professionals
GIS use expanded from 12 to 35 county departments and offices
But where are we really on the optimal development of GIS in King County?
What was (is) our ROI?
Why had no-one asked about our ROI for 18 years?
GIS ROI (2010)
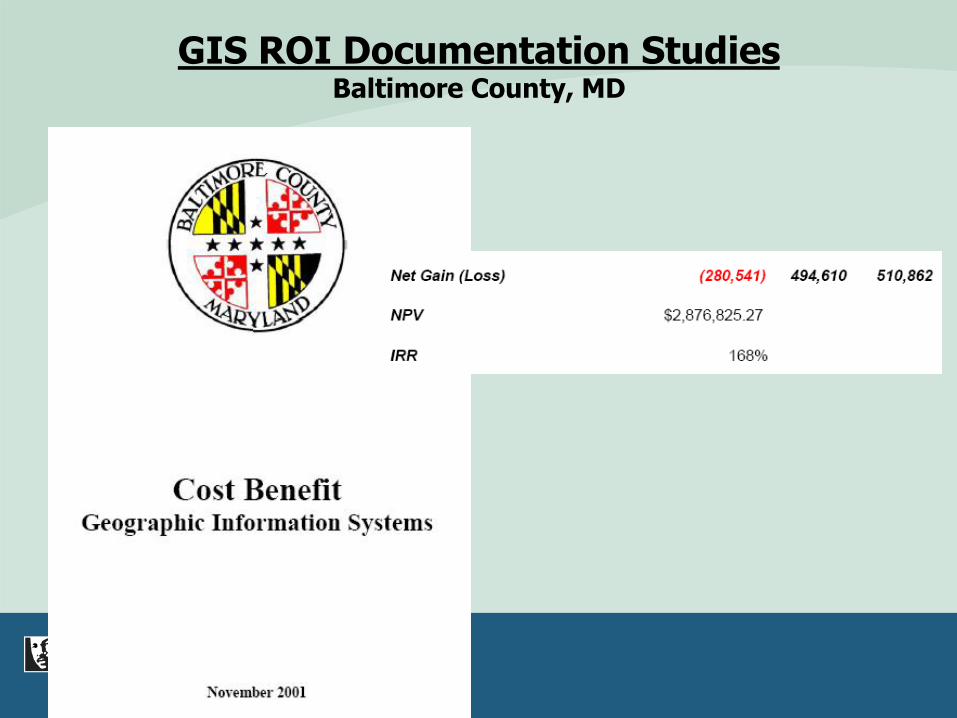
GIS ROI Documentation Studies Baltimore County, MD
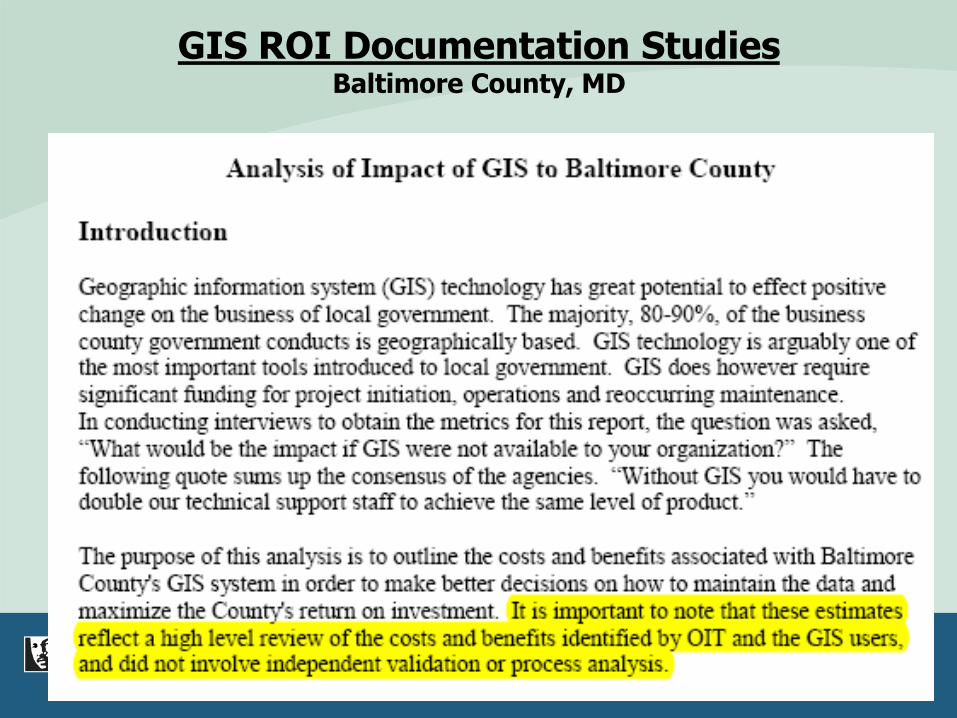
GIS ROI Documentation Studies Baltimore County, MD
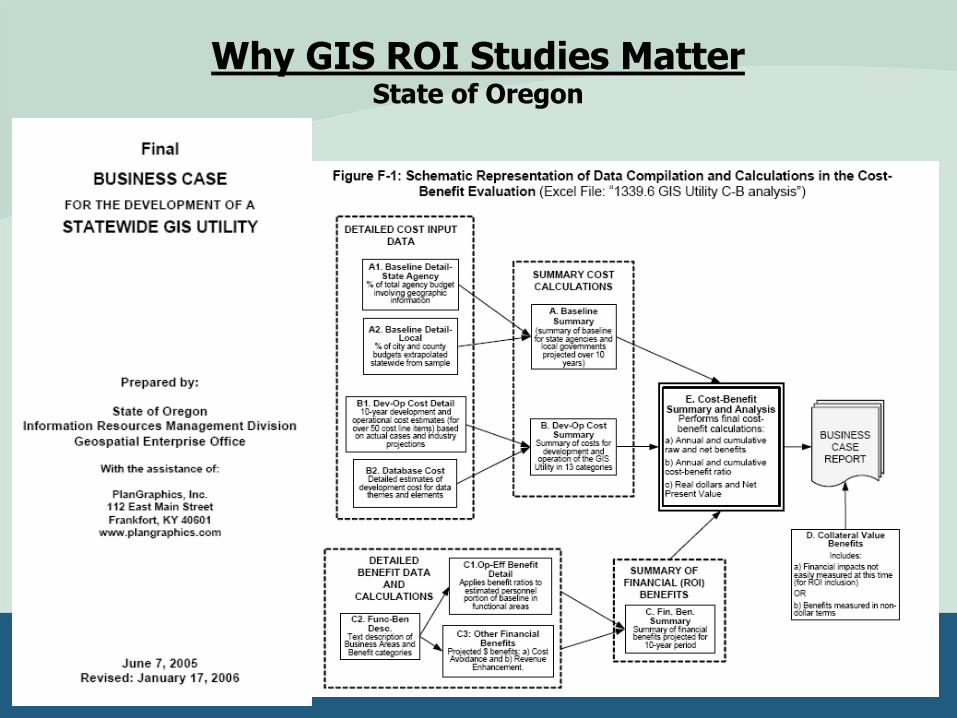
Why GIS ROI Studies Matter State of Oregon
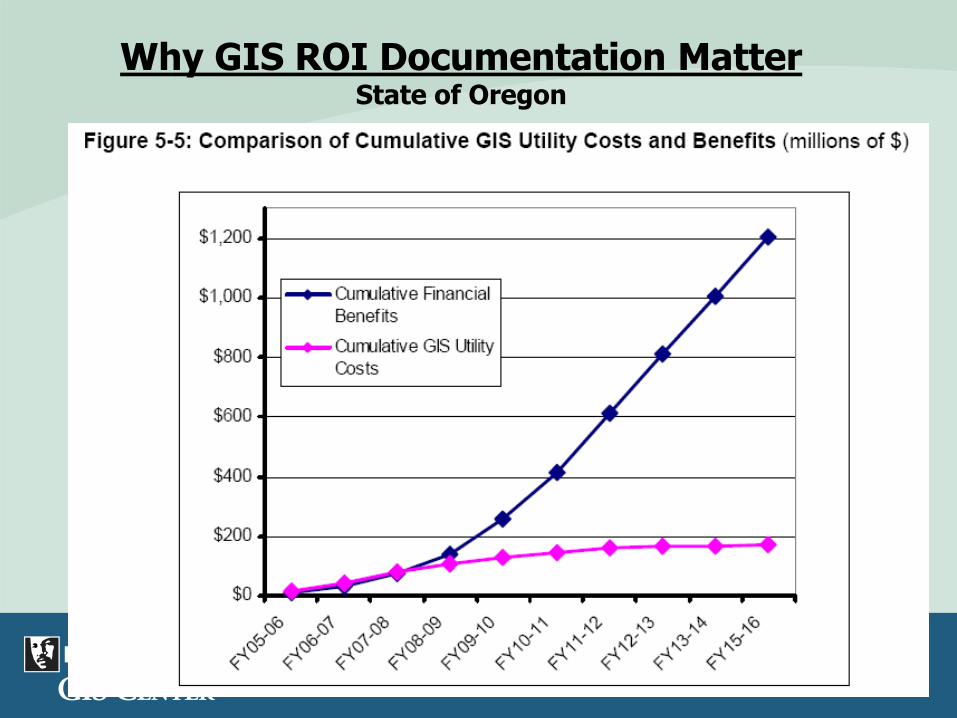
Why GIS ROI Documentation Matter State of Oregon
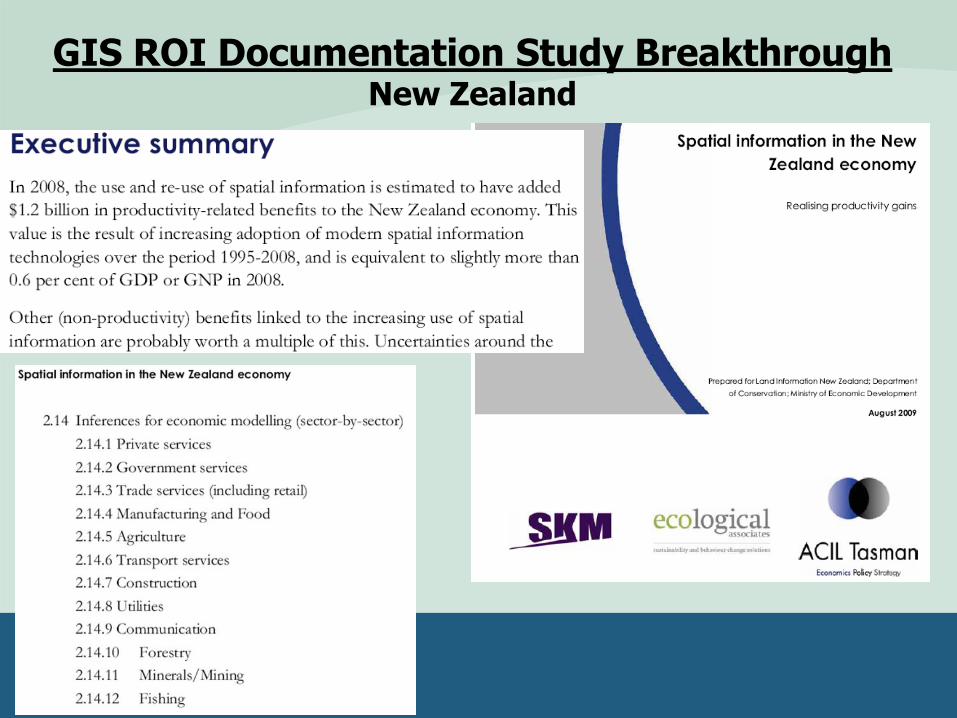
GIS ROI Documentation Study Breakthrough New Zealand
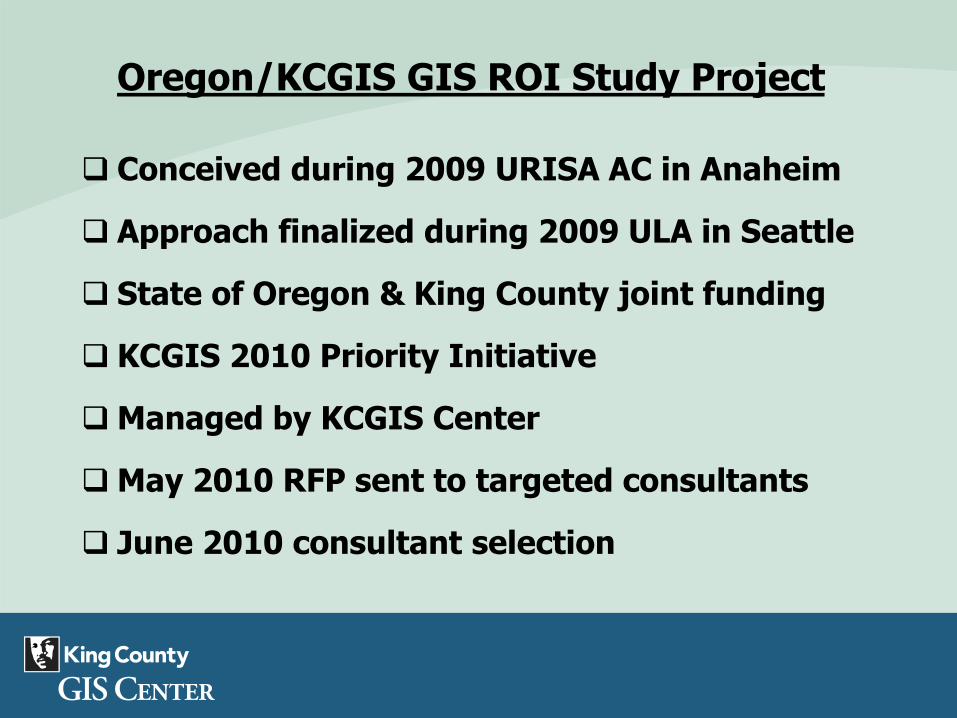
Oregon/KCGIS GIS ROI Study Project
Conceived during 2009 URISA AC in Anaheim
Approach finalized during 2009 ULA in Seattle
State of Oregon & King County joint funding
KCGIS 2010 Priority Initiative
Managed by KCGIS Center
May 2010 RFP sent to targeted consultants
June 2010 consultant selection
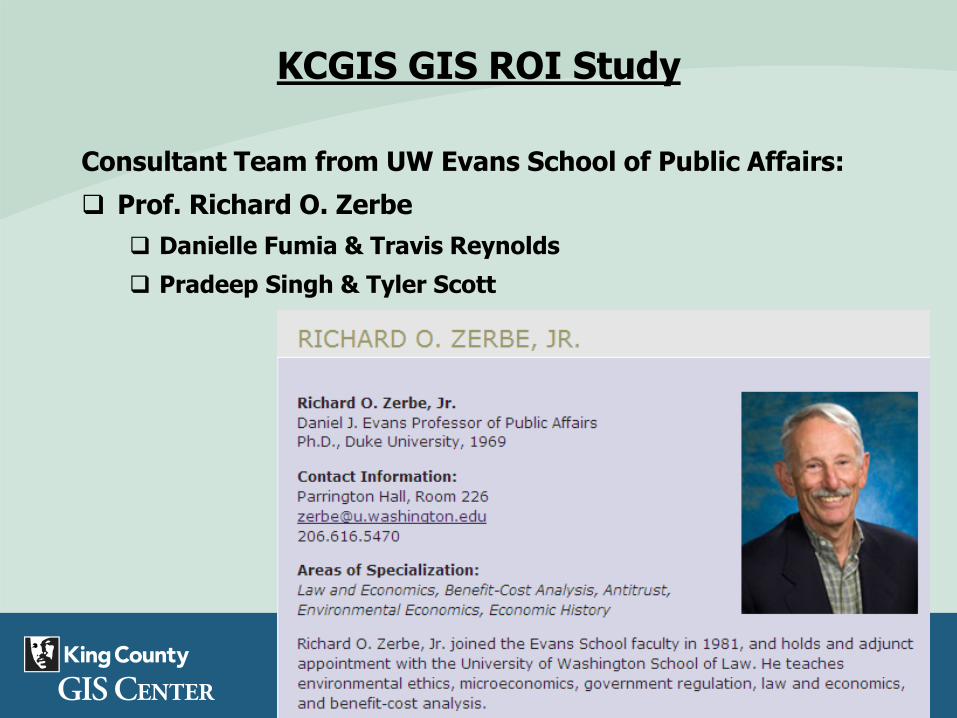
KCGIS GIS ROI Study
Consultant Team from UW Evans School of Public Affairs:
Prof. Richard O. Zerbe
Danielle Fumia & Travis Reynolds
Pradeep Singh & Tyler Scott
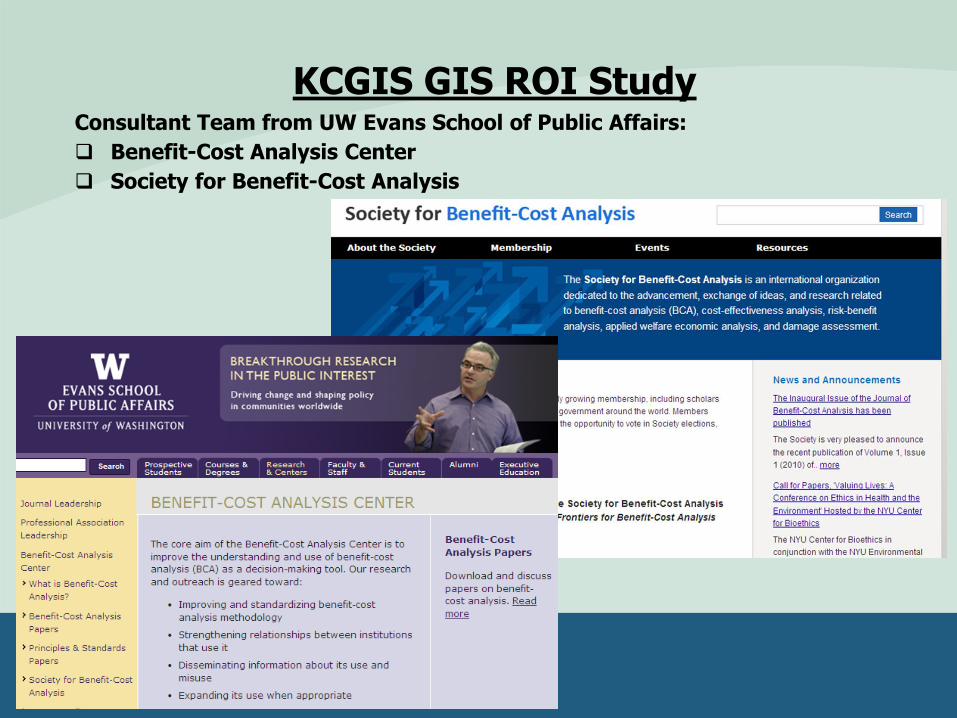
KCGIS GIS ROI Study Consultant Team from UW Evans School of Public Affairs:
Benefit-Cost Analysis Center
Society for Benefit-Cost Analysis
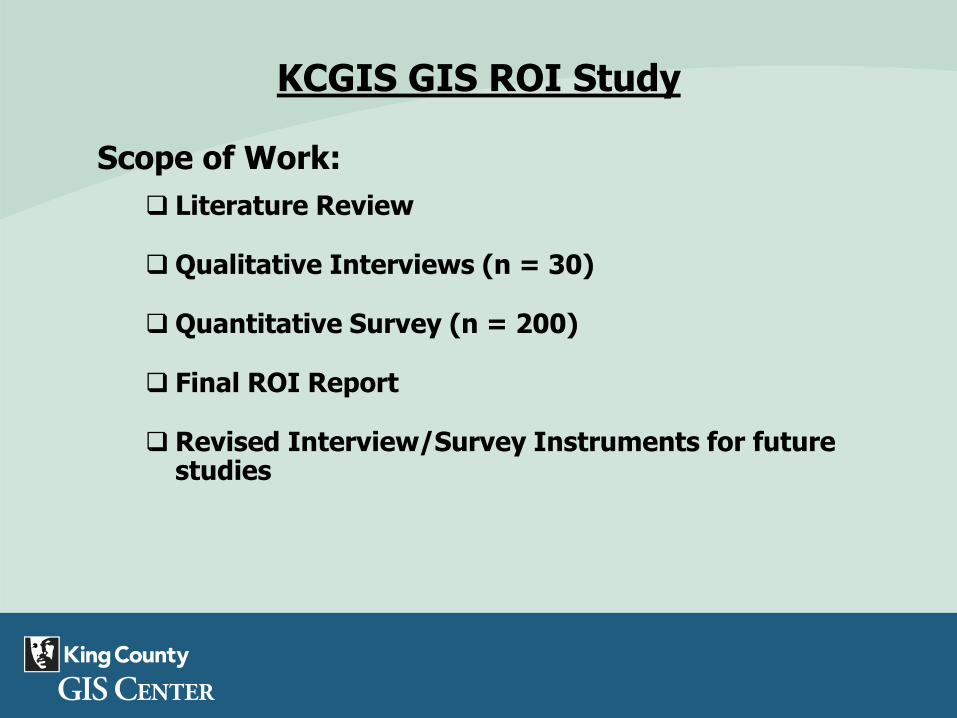
KCGIS GIS ROI Study
Scope of Work:
Literature Review
Qualitative Interviews (n = 30)
Quantitative Survey (n = 200)
Final ROI Report
Revised Interview/Survey Instruments for future studies
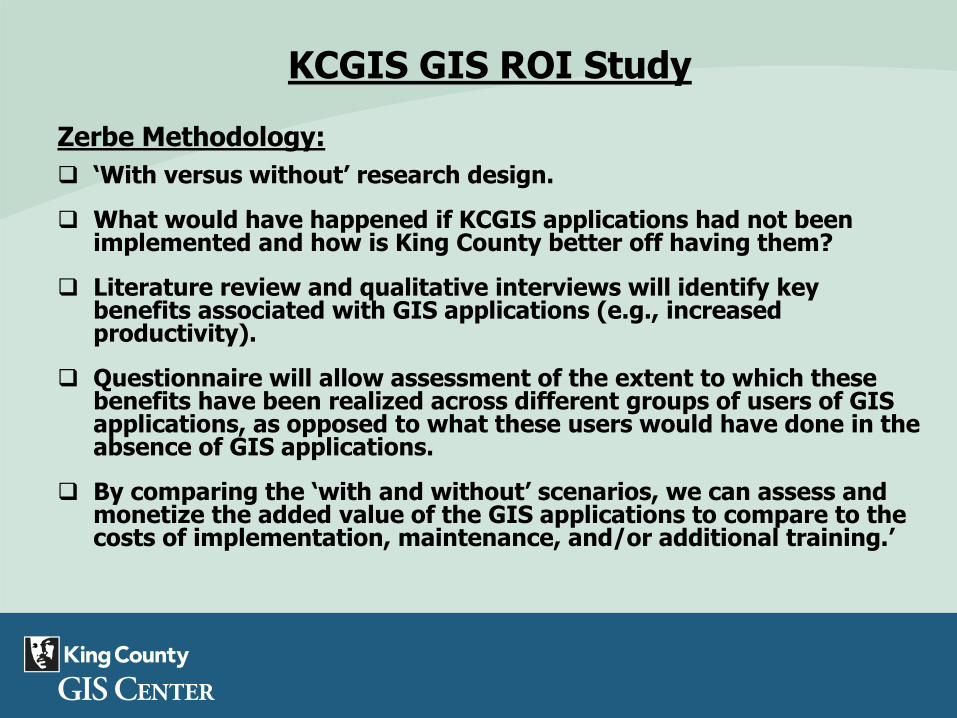
Zerbe Methodology:
‘With versus without’ research design.
What would have happened if KCGIS applications had not been implemented and how is King County better off having them?
Literature review and qualitative interviews will identify key benefits associated with GIS applications (e.g., increased productivity).
Questionnaire will allow assessment of the extent to which these benefits have been realized across different groups of users of GIS applications, as opposed to what these users would have done in the absence of GIS applications.
By comparing the ‘with and without’ scenarios, we can assess and monetize the added value of the GIS applications to compare to the costs of implementation, maintenance, and/or additional training.’
KCGIS GIS ROI Study
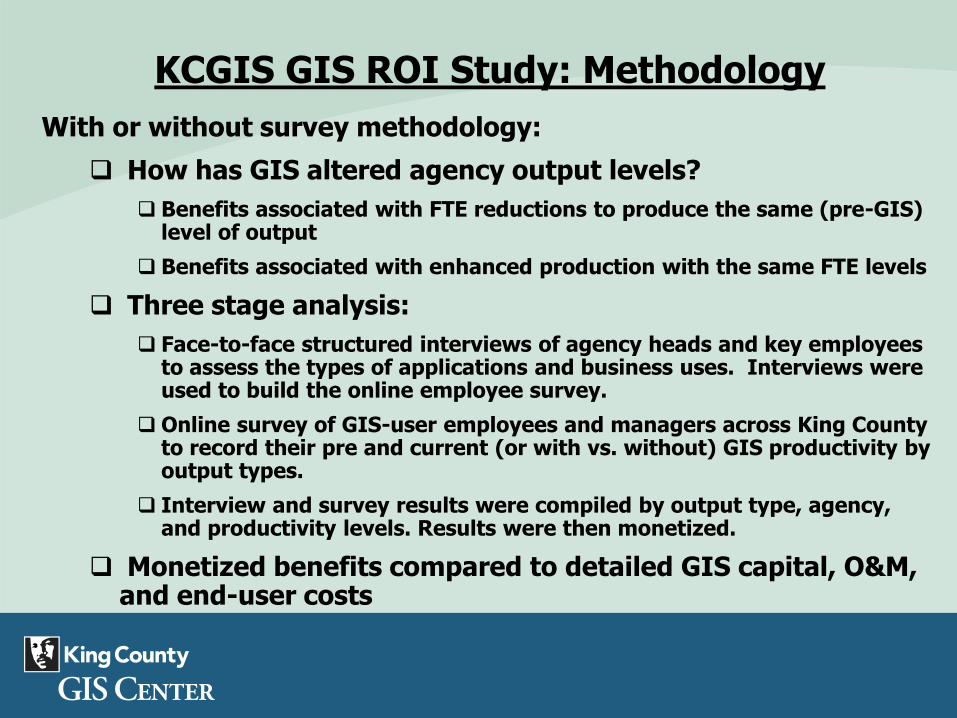
With or without survey methodology:
How has GIS altered agency output levels?
Benefits associated with FTE reductions to produce the same (pre-GIS) level of output
Benefits associated with enhanced production with the same FTE levels
Three stage analysis:
Face-to-face structured interviews of agency heads and key employees to assess the types of applications and business uses. Interviews were used to build the online employee survey.
Online survey of GIS-user employees and managers across King County to record their pre and current (or with vs. without) GIS productivity by output types.
Interview and survey results were compiled by output type, agency, and productivity levels. Results were then monetized.
Monetized benefits compared to detailed GIS capital, O&M, and end-user costs
KCGIS GIS ROI Study: Methodology
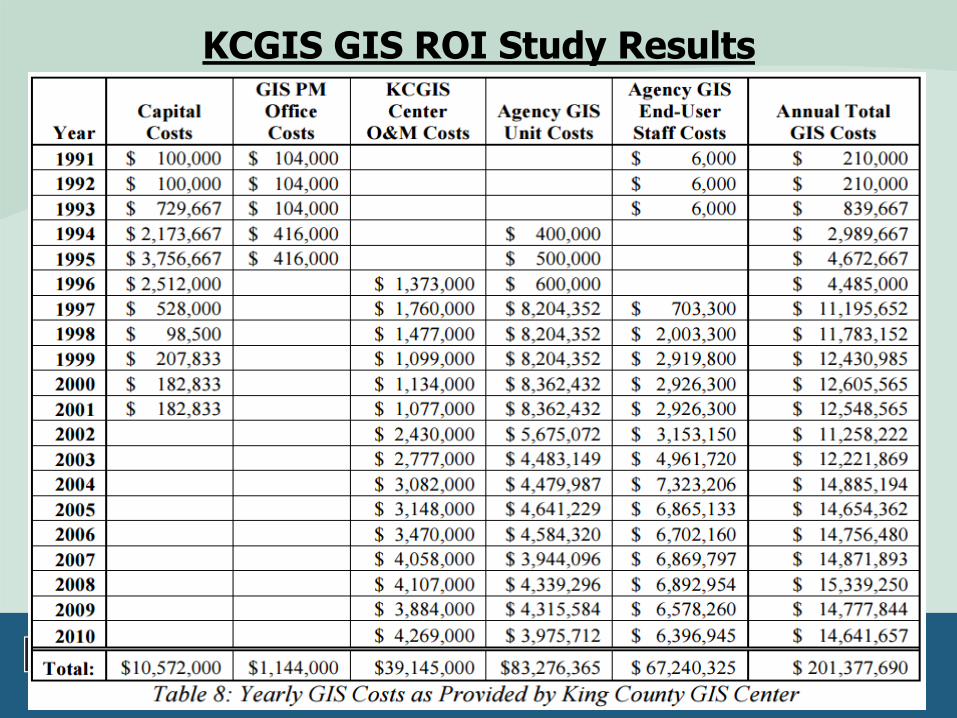
KCGIS GIS ROI Study Results
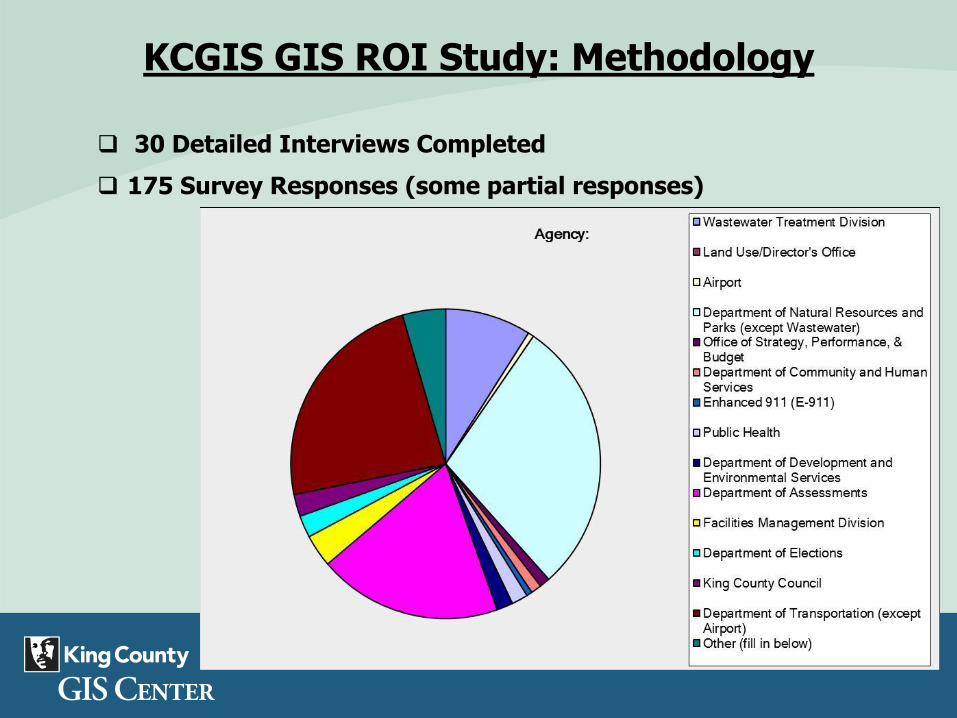
30 Detailed Interviews Completed
175 Survey Responses (some partial responses)
KCGIS GIS ROI Study: Methodology
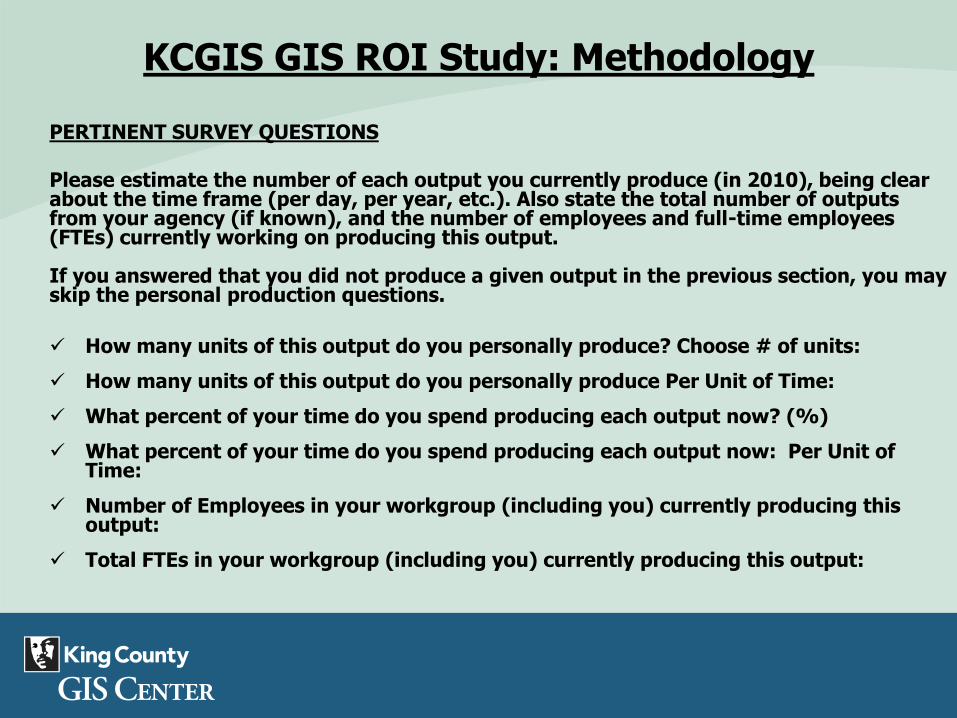
PERTINENT SURVEY QUESTIONS Please estimate the number of each output you currently produce (in 2010), being clear about the time frame (per day, per year, etc.). Also state the total number of outputs from your agency (if known), and the number of employees and full-time employees (FTEs) currently working on producing this output. If you answered that you did not produce a given output in the previous section, you may skip the personal production questions.
How many units of this output do you personally produce? Choose # of units:
How many units of this output do you personally produce Per Unit of Time:
What percent of your time do you spend producing each output now? (%)
What percent of your time do you spend producing each output now: Per Unit of Time:
Number of Employees in your workgroup (including you) currently producing this output:
Total FTEs in your workgroup (including you) currently producing this output:
KCGIS GIS ROI Study: Methodology
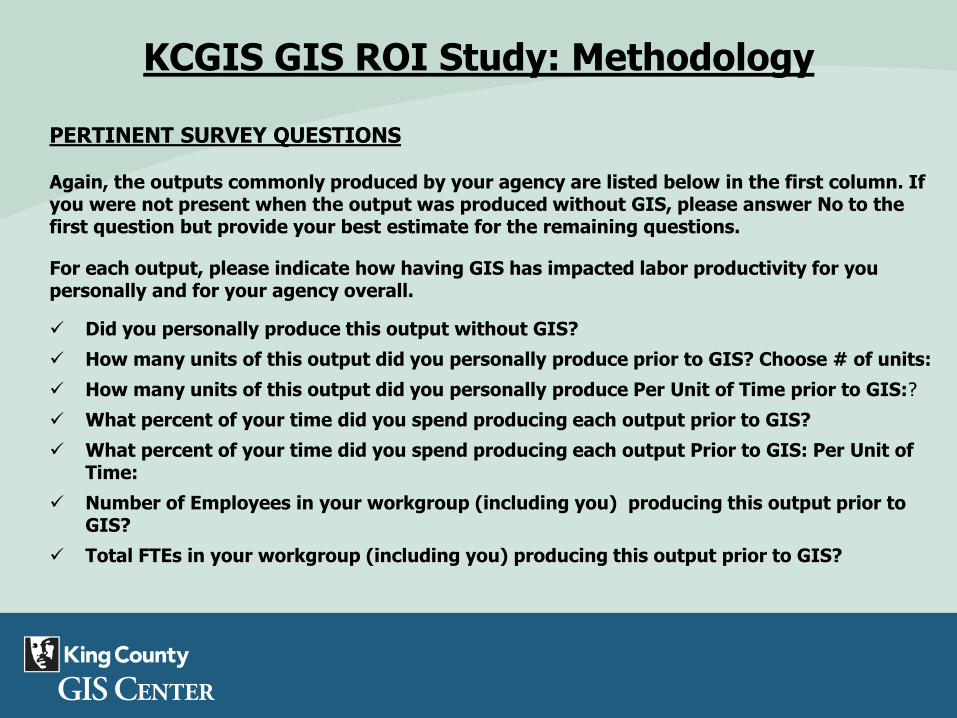
PERTINENT SURVEY QUESTIONS
Again, the outputs commonly produced by your agency are listed below in the first column. If you were not present when the output was produced without GIS, please answer No to the first question but provide your best estimate for the remaining questions.
For each output, please indicate how having GIS has impacted labor productivity for you personally and for your agency overall.
Did you personally produce this output without GIS?
How many units of this output did you personally produce prior to GIS? Choose # of units:
How many units of this output did you personally produce Per Unit of Time prior to GIS:?
What percent of your time did you spend producing each output prior to GIS?
What percent of your time did you spend producing each output Prior to GIS: Per Unit of Time:
Number of Employees in your workgroup (including you) producing this output prior to GIS?
Total FTEs in your workgroup (including you) producing this output prior to GIS?
KCGIS GIS ROI Study: Methodology
KCGIS GIS ROI Study Results
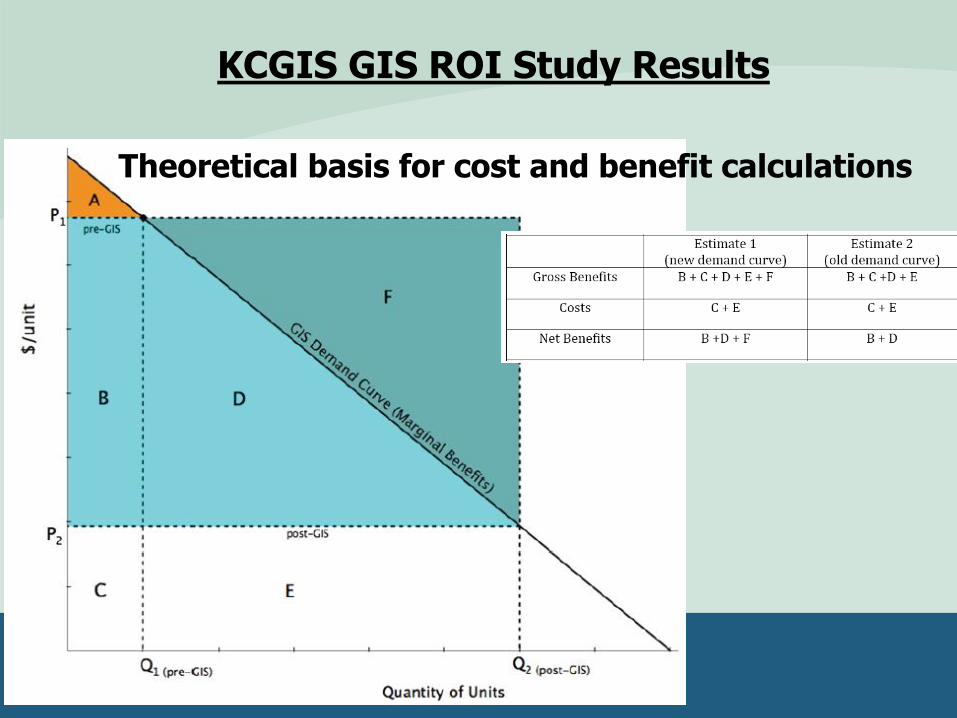
Theoretical basis for cost and benefit calculations
KCGIS GIS ROI Study Results
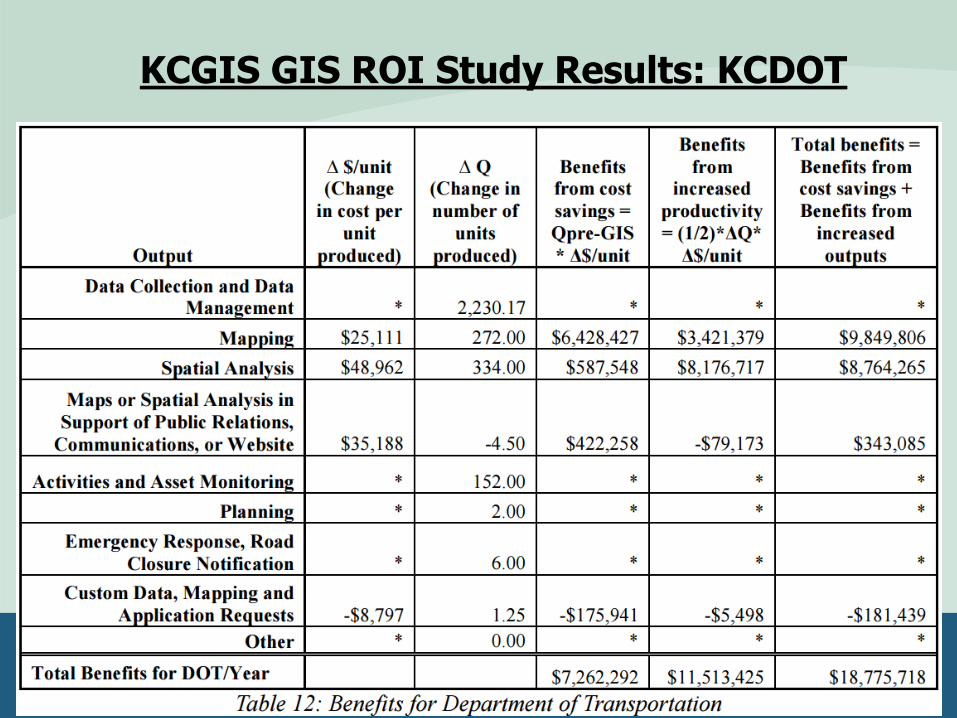
KCGIS GIS ROI Study Results: KCDOT
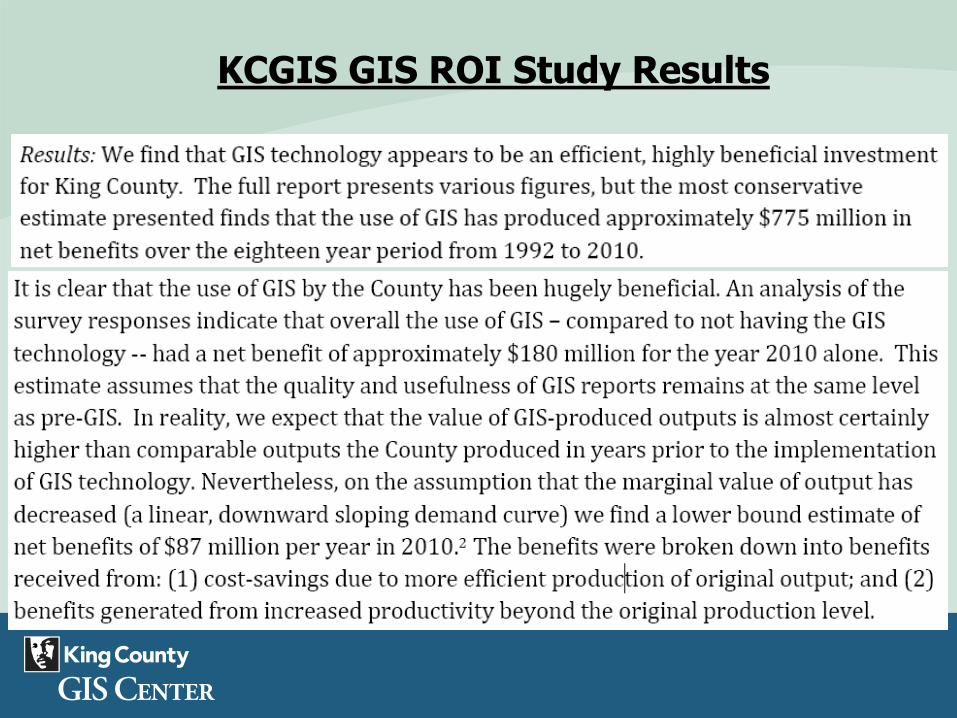
“The most conservative estimate presented finds that the use of GIS has produced
approximately $775 million in net benefits over the eighteen year period from 1992 to
2010….
…a reasonable estimate of total gains is between $180 million and $87 million in
2010.”
KCGIS GIS ROI Study Results
Some Further Questions:
At what stage is King County in the total potential business use of GIS?
Are the KCGIS results ‘good’?
How do we know?
Do we need similar studies of other large counties?
Do we need similar surveys of mid-sized cities, where GIS funding is often in jeopardy?
Are government agency officials not now compelled to pursue full GIS development?
KCGIS GIS ROI Study
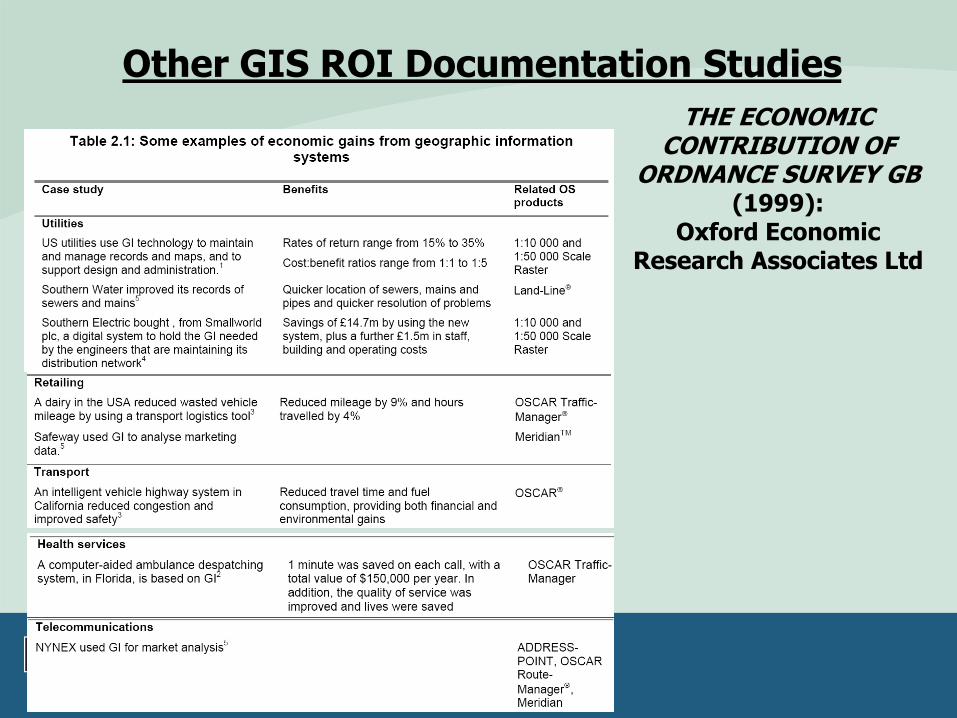
THE ECONOMIC CONTRIBUTION OF
ORDNANCE SURVEY GB (1999):
Oxford Economic Research Associates Ltd
Other GIS ROI Documentation Studies
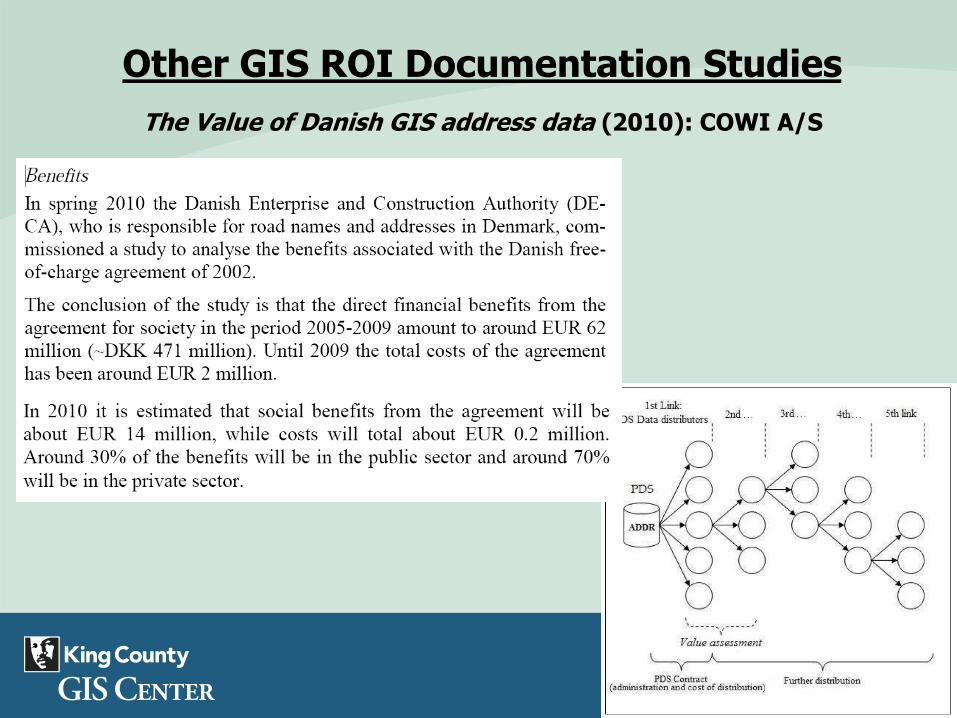
The Value of Danish GIS address data (2010): COWI A/S
Other GIS ROI Documentation Studies
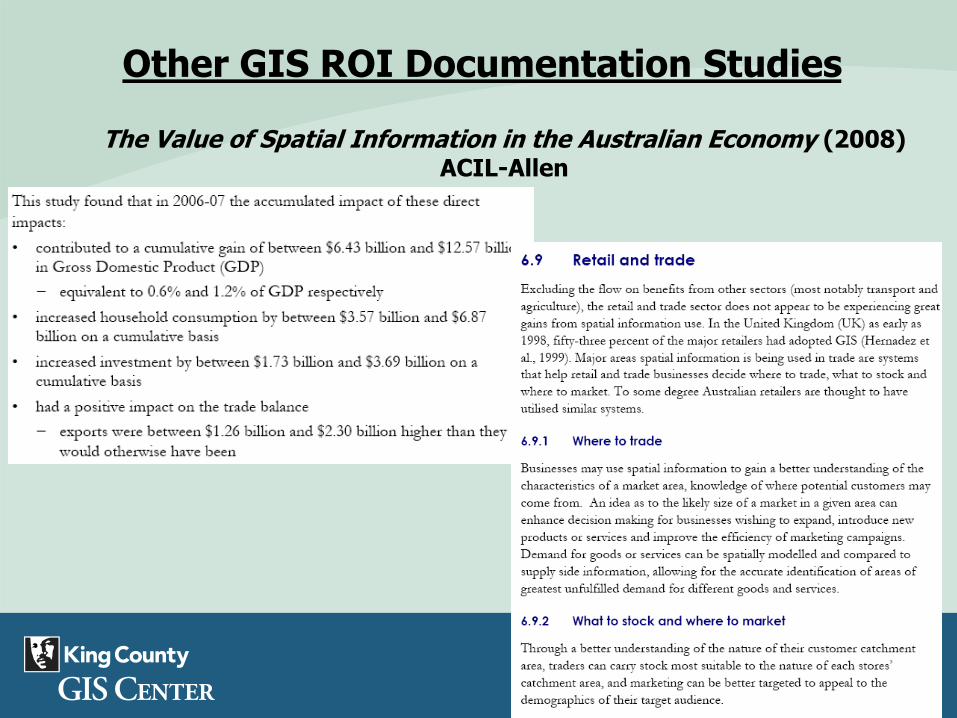
The Value of Spatial Information in the Australian Economy (2008) ACIL-Allen
Other GIS ROI Documentation Studies
Other GIS ROI Documentation Studies
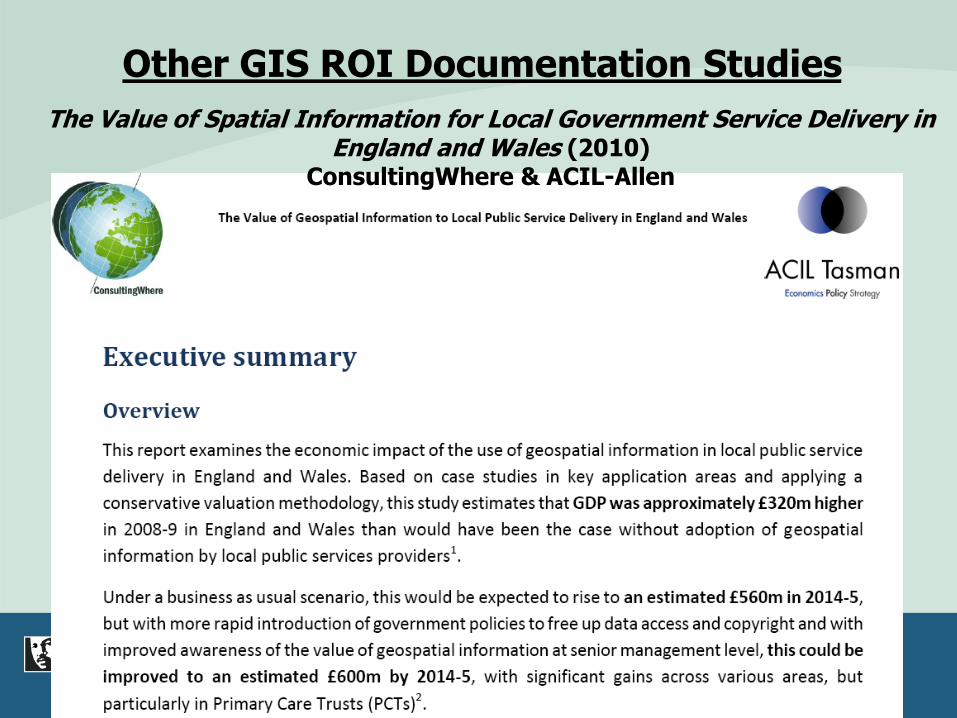
The Value of Spatial Information for Local Government Service Delivery in England and Wales (2010)
ConsultingWhere & ACIL-Allen
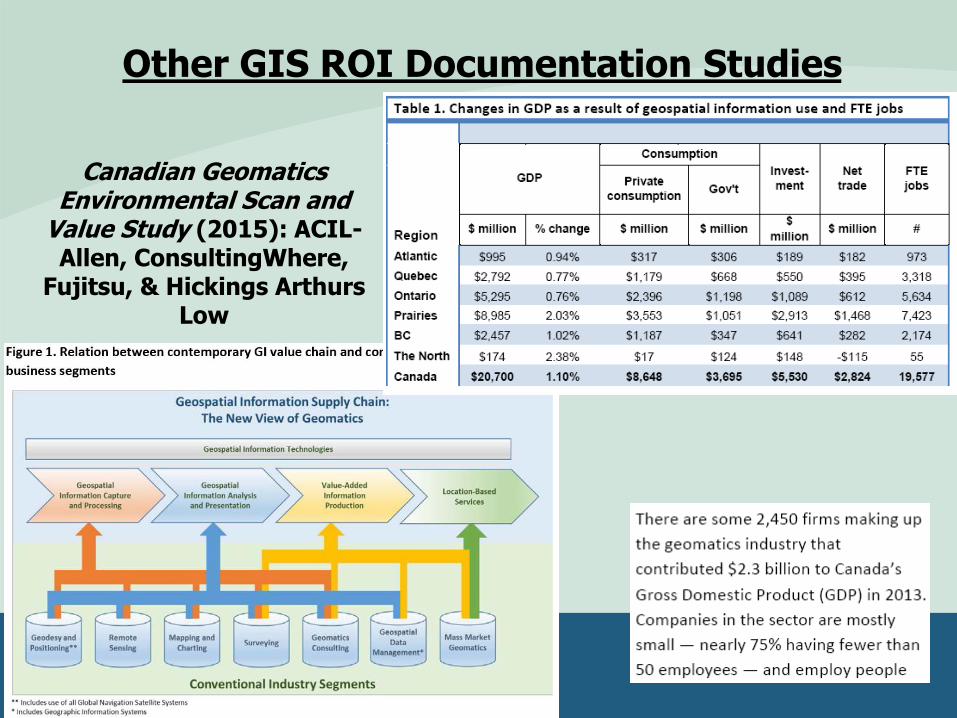
Canadian Geomatics Environmental Scan and
Value Study (2015): ACIL-Allen, ConsultingWhere,
Fujitsu, & Hickings Arthurs Low
Other GIS ROI Documentation Studies
36
www.metrokc.gov/gis
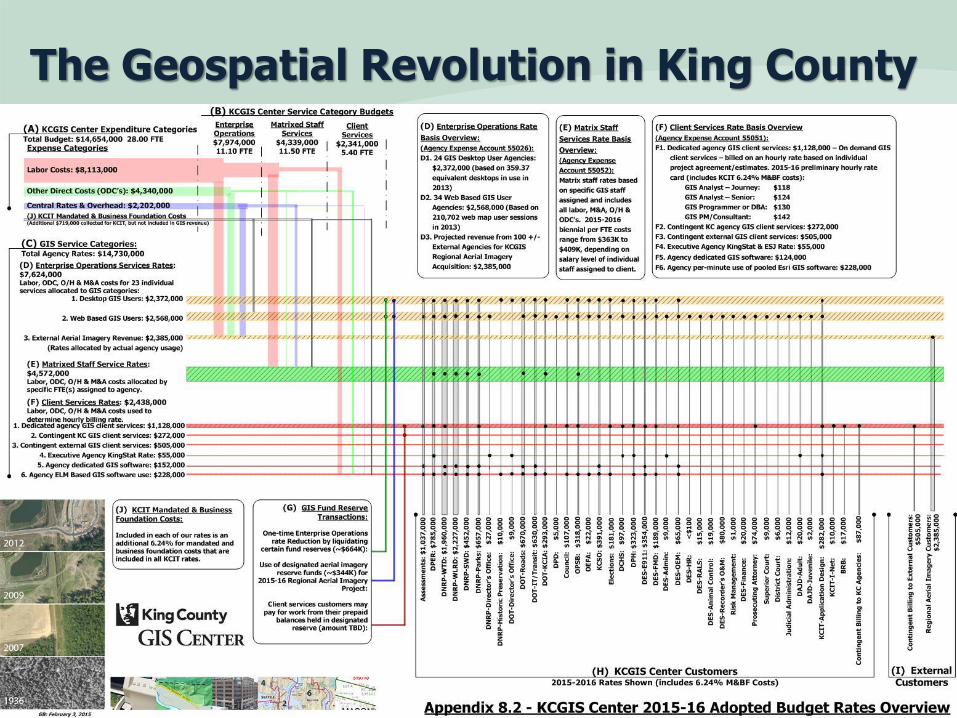
The Geospatial Revolution in King County
37
www.metrokc.gov/gis
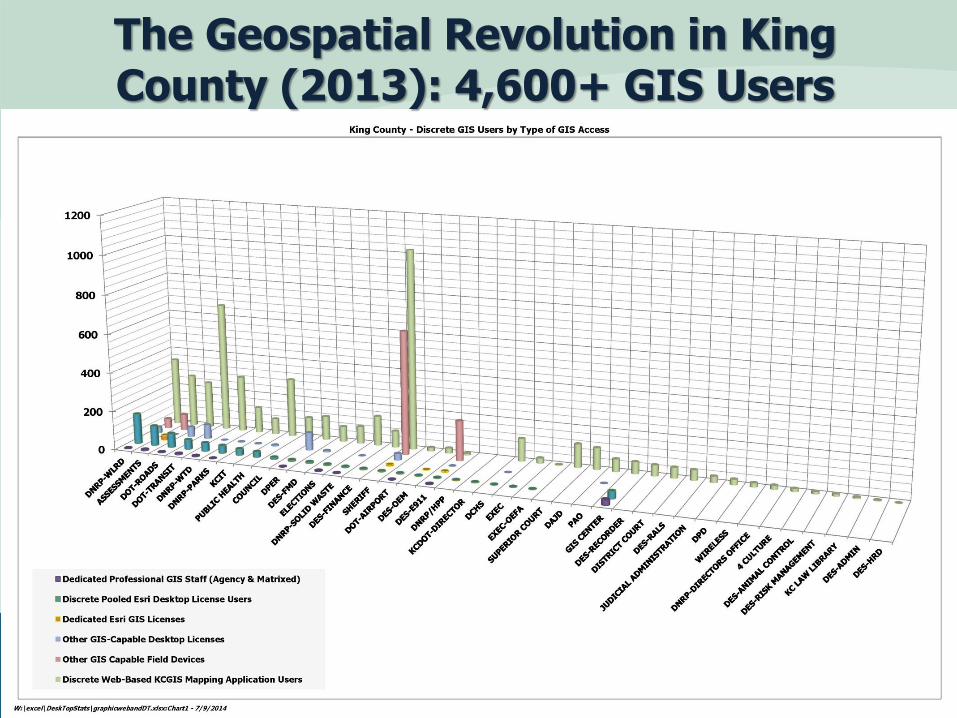
The Geospatial Revolution in King County (2013): 4,600+ GIS Users
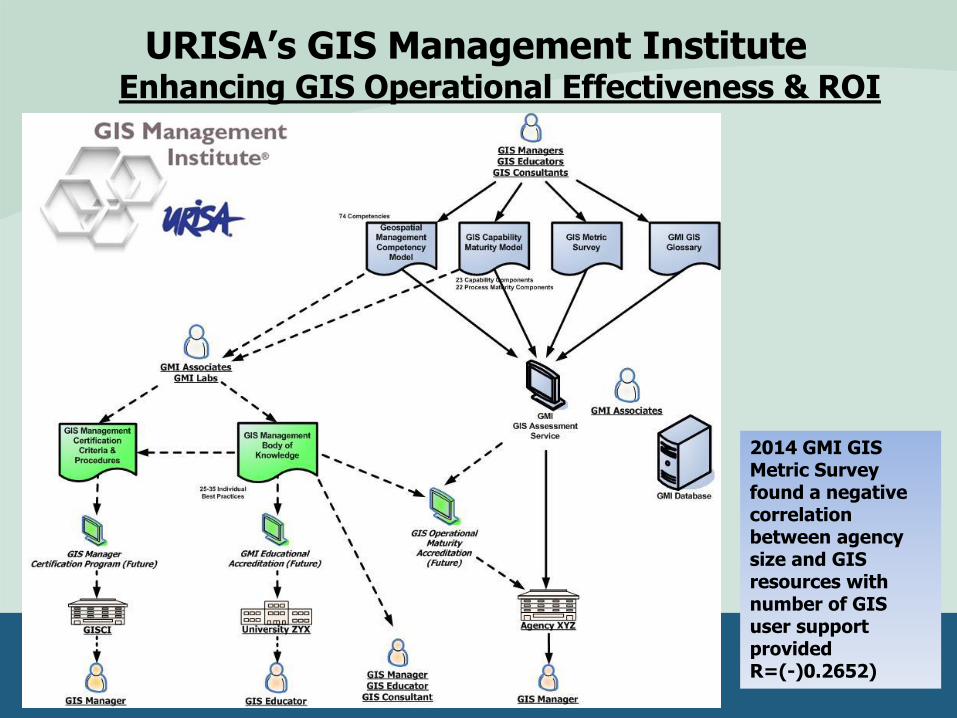
URISA’s GIS Management Institute Enhancing GIS Operational Effectiveness & ROI
2014 GMI GIS Metric Survey found a negative correlation between agency size and GIS resources with number of GIS user support provided R=(-)0.2652)
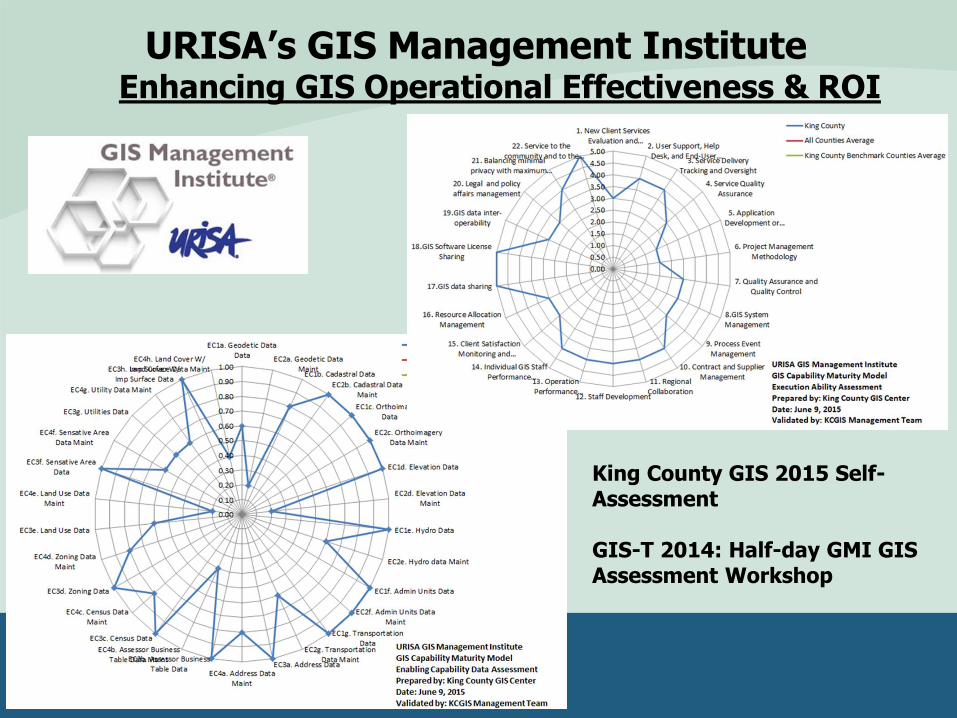
URISA’s GIS Management Institute Enhancing GIS Operational Effectiveness & ROI
King County GIS 2015 Self-Assessment GIS-T 2014: Half-day GMI GIS Assessment Workshop
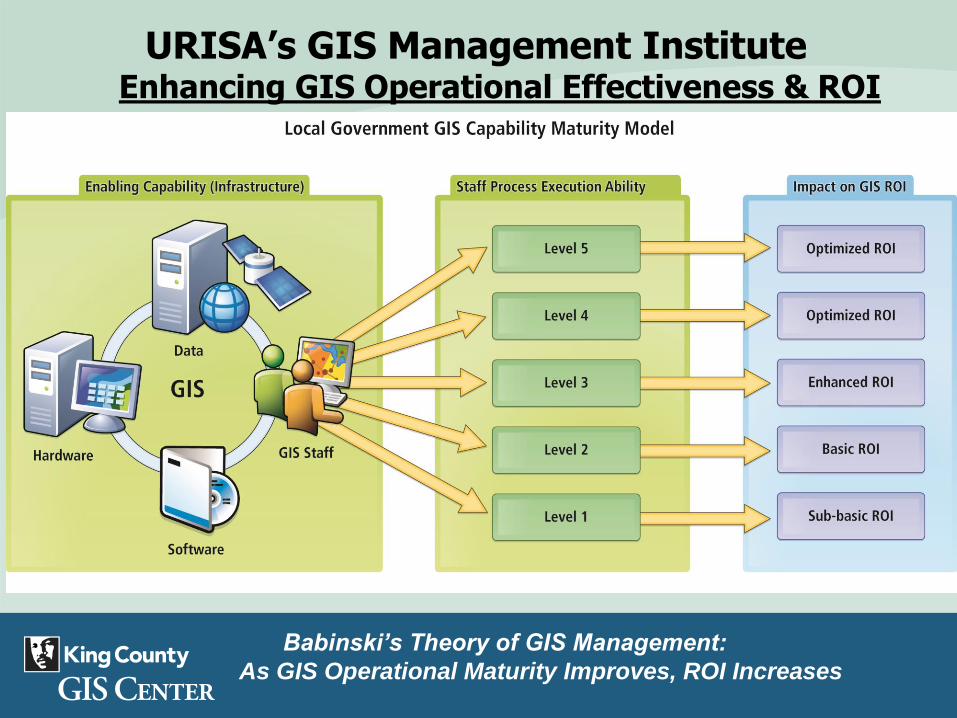
URISA’s GIS Management Institute Enhancing GIS Operational Effectiveness & ROI
Babinski’s Theory of GIS Management:
As GIS Operational Maturity Improves, ROI Increases
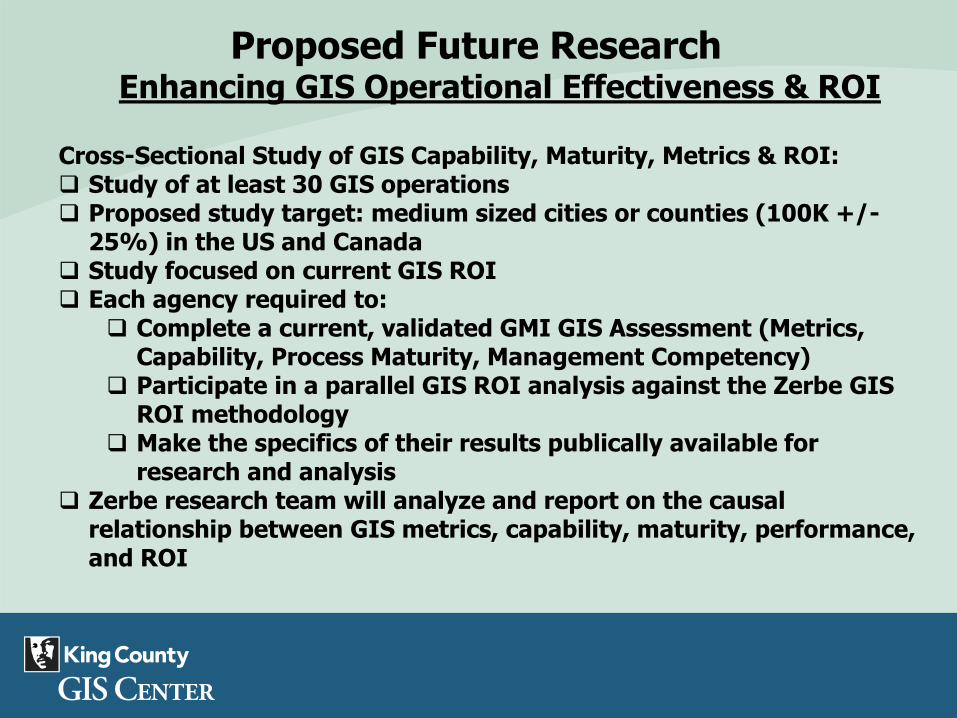
Proposed Future Research Enhancing GIS Operational Effectiveness & ROI
Cross-Sectional Study of GIS Capability, Maturity, Metrics & ROI: Study of at least 30 GIS operations Proposed study target: medium sized cities or counties (100K +/-
25%) in the US and Canada Study focused on current GIS ROI Each agency required to:
Complete a current, validated GMI GIS Assessment (Metrics, Capability, Process Maturity, Management Competency)
Participate in a parallel GIS ROI analysis against the Zerbe GIS ROI methodology
Make the specifics of their results publically available for research and analysis
Zerbe research team will analyze and report on the causal relationship between GIS metrics, capability, maturity, performance, and ROI
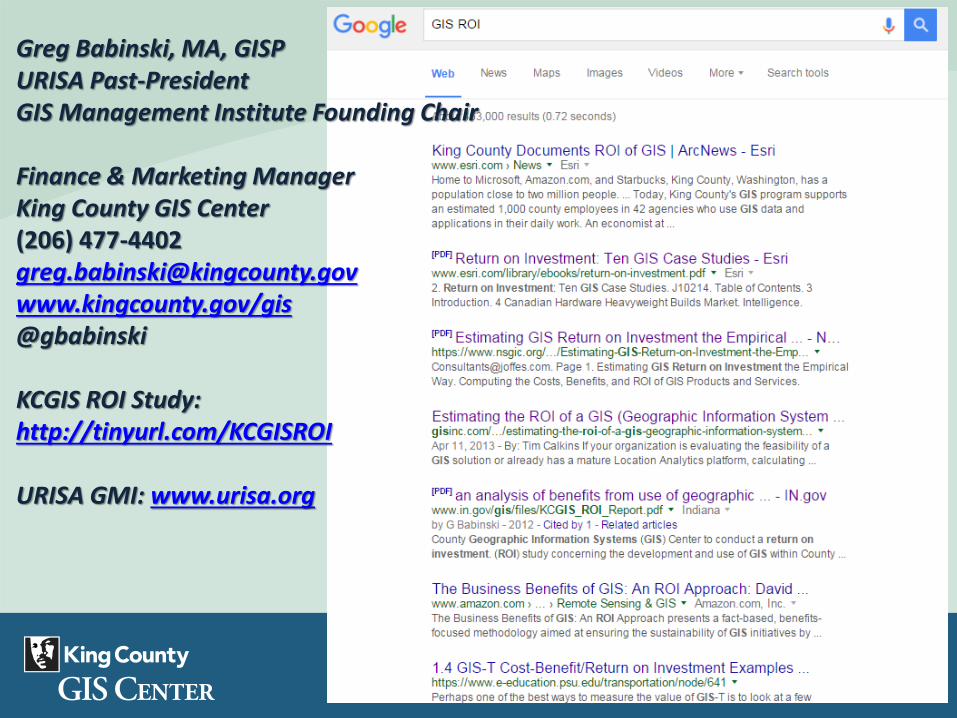
Greg Babinski, MA, GISP URISA Past-President GIS Management Institute Founding Chair Finance & Marketing Manager King County GIS Center (206) 477-4402 [email protected] www.kingcounty.gov/gis @gbabinski KCGIS ROI Study: http://tinyurl.com/KCGISROI URISA GMI: www.urisa.org