global energi 2008
TRANSCRIPT

8/8/2019 Global Energi 2008
http://slidepdf.com/reader/full/global-energi-2008 1/59
World-wide energy needs
³There is enough for everybody's need -
but not for everybody's greed´
Mahatma Gandhi

8/8/2019 Global Energi 2008
http://slidepdf.com/reader/full/global-energi-2008 2/59
Institutt for elkraftteknikk NTNU 2
Global energy flow (TW)
M å n e - o gp l a n e t -
b e v e g e l s e r
P l a n t e r
F o s s i l eb r e n s l e r
U r a n G e o t e r m i s kv a r m e
S o l l y s1 7 8 . 0 0 0
R e f l e k t e r ts o l l y s
5 3 . 0 0 0
V a r m e -s t r å l i ng
8 3 . 0 0 0
4 1 . 0 0 0
E lv e r 5
3
T i d e v a n n
V in d , b ø lg e r, h av s trø m m e r 3 70
1 0 0F o to s y n te s e N e d b ry t in g 3 5
V a r m e -ta pK j e r n e k r a f t
0 ,5U t t a k 7 , 5
F ø l b a r v a rm e
i lu f t, v a n no g jo r d
I s , v a n nd a m p
K o n d e n s e r i n g
F r y s i n g
F o r d a m p i n gS m e l tin g

8/8/2019 Global Energi 2008
http://slidepdf.com/reader/full/global-energi-2008 3/59
Institutt for elkraftteknikk NTNU 3
Energy Recourses
Non Renewable: ± Oil (included NLG, ́ Natural Gas Liquids´)
Conventional
Unconventional (oil shale, tare sand) ± Natural gas:
Conventional
Unconventional
± Coal:
Hard coal
Lignite (brown coal)
(Peat)
± Nuclear Fuel
Uranium
Thorium

8/8/2019 Global Energi 2008
http://slidepdf.com/reader/full/global-energi-2008 4/59
Institutt for elkraftteknikk NTNU 4
Energy Recourses (cont.)
Renewable ± Hydro power
± Peat ?
± Wood
± Other biomass
± Solar energy
Thermal
Electrical
± Geothermal
± Wind
± Waves ± Tidal energy
± Salt gradients
± OTEC (Ocean Thermal Energy Conversion)

8/8/2019 Global Energi 2008
http://slidepdf.com/reader/full/global-energi-2008 5/59
Institutt for elkraftteknikk NTNU 5
Energy resources. Billion toe.(Source: IIASA, WEC)
Consumption
1850-1990 1990
Reserve Resource Total Additional
(Uncertain)
Oil
Conventional
Unconventional
90 3,2 150
193
145
332
295
525 1900Natural gas
Conventional
Unconventional
41 1,7 141
192
279
258
420
450 400
Coal 125 2,2 606 2794 3400 3000
Total fossil 256 7,0 1282 3808 5090 5300
Uranium
In FBR
17 0,5 57
3390
203
12150
260 150

8/8/2019 Global Energi 2008
http://slidepdf.com/reader/full/global-energi-2008 6/59
Institutt for elkraftteknikk NTNU 6
Energy resources.
Static life time (Years).(Source: IIASA, WEC)
Based on reserve Resourcesincluded
OilConventional
Unconventional
46
107
92
256
Natural gas
Conventional
Unconventional
83
192
247
511Coal 175 1545
Total fossil 183 727
Uranium
In FBR
114
6780

8/8/2019 Global Energi 2008
http://slidepdf.com/reader/full/global-energi-2008 7/59
Institutt for elkraftteknikk NTNU 7
Oil
Sourc : B
8/8/2019 Global Energi 2008
http://slidepdf.com/reader/full/global-energi-2008 8/59
Institutt for elkraftteknikk NTNU 8
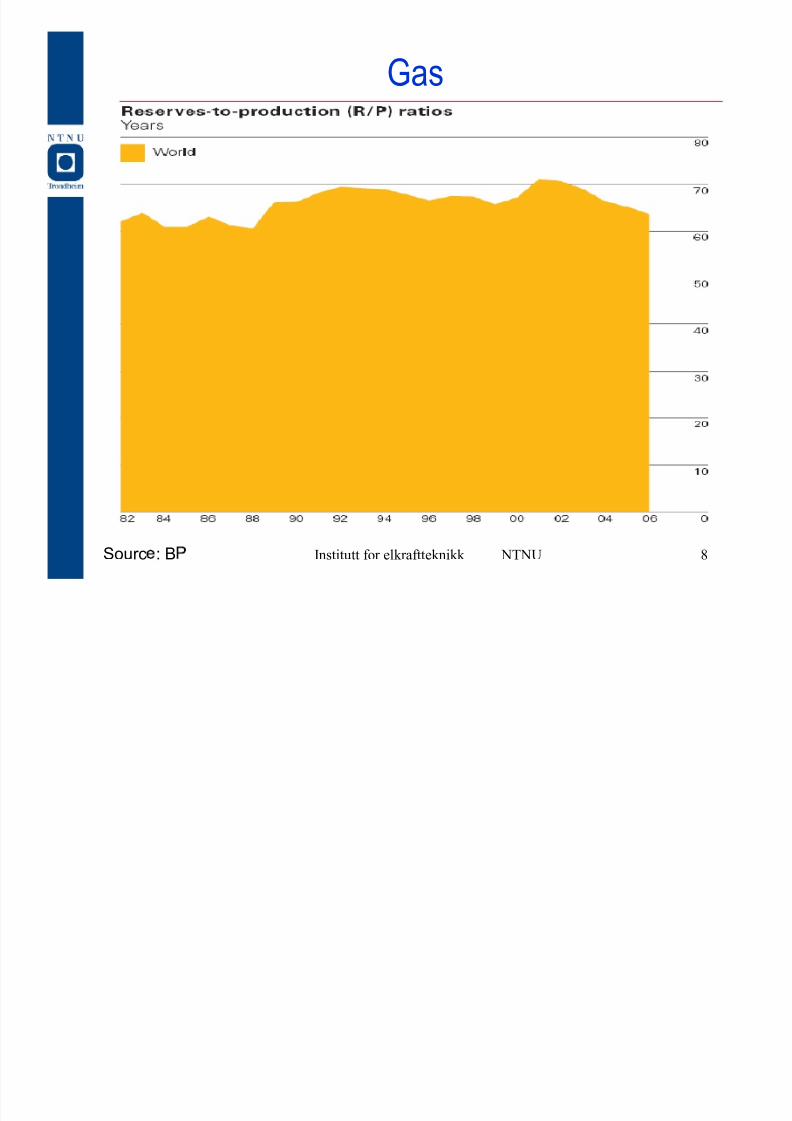
Gas
Sourc : B

8/8/2019 Global Energi 2008
http://slidepdf.com/reader/full/global-energi-2008 9/59
Institutt for elkraftteknikk NTNU 9
Oil reserves
Middle East
64 %Oceania
0 %
Africa
7 %
North America
8 %
South America
8 %
Asia
6 %
Europe
7 %

8/8/2019 Global Energi 2008
http://slidepdf.com/reader/full/global-energi-2008 10/59
Institutt for elkraftteknikk NTNU 10
Natural gas
Africa7 %
South
America
4 %
Asia11 %
North
America
6 %
Oceania
1 %
Middle East
34 %Europe
37 %

8/8/2019 Global Energi 2008
http://slidepdf.com/reader/full/global-energi-2008 11/59
Institutt for elkraftteknikk NTNU 11
Static life time for oil (years)
0
10
20
30
40
50
60
70
80
90
100
M i d d l e
E a s t
O c e a n i a
A f r i c a
N o r t h
A m e r i c a
S o u t h
A m e r i c a
A s i a
E u r o p e
W o r l d

8/8/2019 Global Energi 2008
http://slidepdf.com/reader/full/global-energi-2008 12/59
Institutt for elkraftteknikk NTNU 12
Coal
North America
26 %
South America
2 % Asia
25 %
Europe
32 %
Africa
6 %
Oceania
9 %
Middle East
0 %Middle East
Oceania
Africa
North America
South America
Asia
Europe

8/8/2019 Global Energi 2008
http://slidepdf.com/reader/full/global-energi-2008 13/59
Institutt for elkraftteknikk NTNU 13

8/8/2019 Global Energi 2008
http://slidepdf.com/reader/full/global-energi-2008 14/59
Institutt for elkraftteknikk NTNU 14

8/8/2019 Global Energi 2008
http://slidepdf.com/reader/full/global-energi-2008 15/59
Institutt for elkraftteknikk NTNU 15

8/8/2019 Global Energi 2008
http://slidepdf.com/reader/full/global-energi-2008 16/59
Institutt for elkraftteknikk NTNU 16

8/8/2019 Global Energi 2008
http://slidepdf.com/reader/full/global-energi-2008 17/59
Institutt for elkraftteknikk NTNU 17

8/8/2019 Global Energi 2008
http://slidepdf.com/reader/full/global-energi-2008 18/59
Institutt for elkraftteknikk NTNU 18

8/8/2019 Global Energi 2008
http://slidepdf.com/reader/full/global-energi-2008 19/59
Institutt for elkraftteknikk NTNU 19

8/8/2019 Global Energi 2008
http://slidepdf.com/reader/full/global-energi-2008 20/59
Institutt for elkraftteknikk NTNU 20
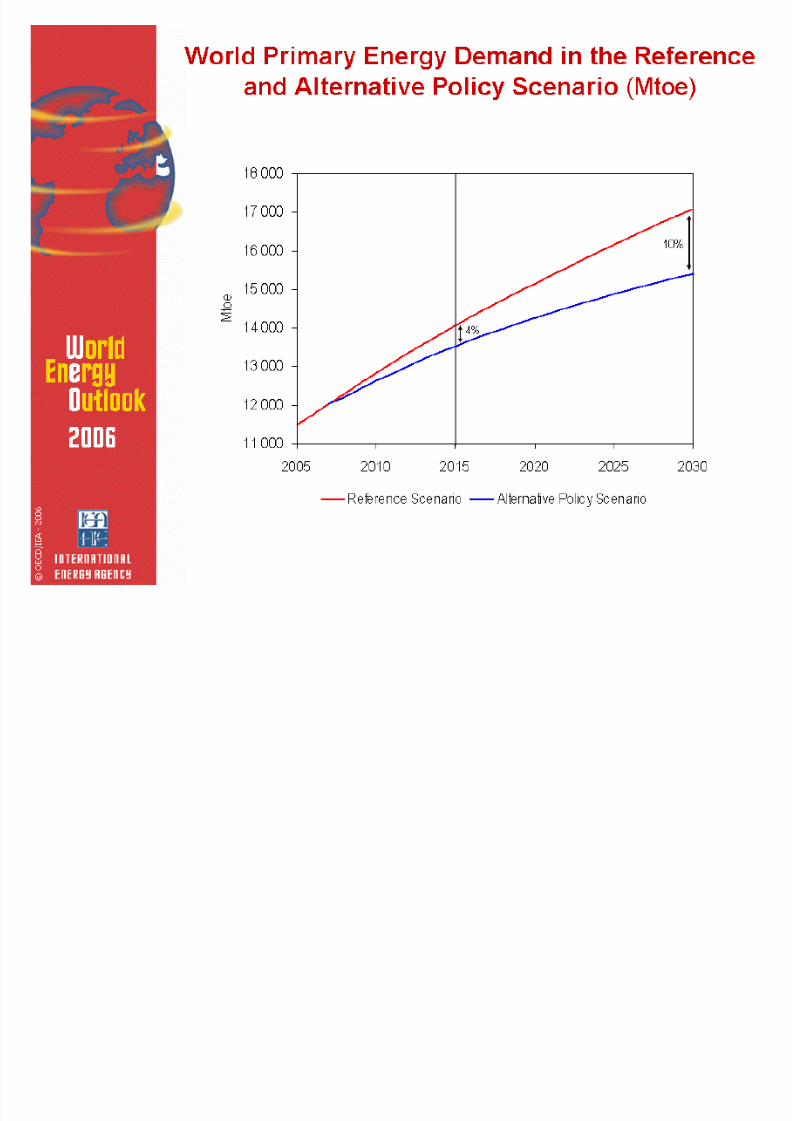
IE A/OECD: ³World Energy Outlook´
2006 Edition
Total energy intensity will decrease in all countries
Electricity intensity will increase in developing
countries, stabilise or decrease the rest of the world

8/8/2019 Global Energi 2008
http://slidepdf.com/reader/full/global-energi-2008 21/59
Institutt for elkraftteknikk NTNU 21
8/8/2019 Global Energi 2008
http://slidepdf.com/reader/full/global-energi-2008 22/59
Institutt for elkraftteknikk NTNU 22

8/8/2019 Global Energi 2008
http://slidepdf.com/reader/full/global-energi-2008 23/59
Institutt for elkraftteknikk NTNU 23

8/8/2019 Global Energi 2008
http://slidepdf.com/reader/full/global-energi-2008 24/59
Institutt for elkraftteknikk NTNU 24

8/8/2019 Global Energi 2008
http://slidepdf.com/reader/full/global-energi-2008 25/59
Institutt for elkraftteknikk NTNU 25

8/8/2019 Global Energi 2008
http://slidepdf.com/reader/full/global-energi-2008 26/59
Institutt for elkraftteknikk NTNU 26
Global primary energy use5 0
40
30
2 0
10
0
185 0 190 0 195 0 2 00 0 2 05 0 210 0
12
8
4
0
1850 1900 1950 2000 2050 2100
Gt e
W at [b s]
B
C
Source: IIASA, WEC

8/8/2019 Global Energi 2008
http://slidepdf.com/reader/full/global-energi-2008 27/59
Institutt for elkraftteknikk NTNU 27

8/8/2019 Global Energi 2008
http://slidepdf.com/reader/full/global-energi-2008 28/59
Institutt for elkraftteknikk NTNU 28
IIASA Global
perspectives 1998
Evolution of primary
energy shares
Green Scenarios

8/8/2019 Global Energi 2008
http://slidepdf.com/reader/full/global-energi-2008 29/59
Institutt for elkraftteknikk NTNU 29
0
25000
50000
75000
100000
1990 2010 2030 2050 2070 2090
Other
H r
ear
at. Gas
Oil
Coal
0
25000
50000
75000
100000
1990 2010 2030 2050 2070 2090
Other s
H r o
Nuclear
Nat. Gas
Oil
Coal
0
25000
50000
75000
100000
1990 2010 2030 2050 2070 2090
Other s
H r o
Nuclear
Nat. Gas
Oil
Coal
Global power productionIIASA: Scenario A2, A1, B, C1
TWh/year
TWh/year TWh/year
A2
B C1
0
25000
50000
75000
100000
1 99 0 2 01 0 2 03 0 2 05 0 2 07 0 2 09 0
Ot r s
r
N c r
N t. G s
O
A1
TWh/year

8/8/2019 Global Energi 2008
http://slidepdf.com/reader/full/global-energi-2008 30/59
Institutt for elkraftteknikk NTNU 30
World electricity generationIIASA: Scenario A1
0
25000
50000
75000
100000
1990 2010 2030 2050 2070 2090
Others
Hydro
Nuclear
Nat. Gas
Oil
Coal
TWh/year

8/8/2019 Global Energi 2008
http://slidepdf.com/reader/full/global-energi-2008 31/59
Institutt for elkraftteknikk NTNU 31
World electricity generationIIASA: Scenario A2
0
25000
50000
75000
100000
1990 2010 2030 2050 2070 2090
Others
HydroNuclear
Nat. Gas
Oil
Coal
TWh/year

8/8/2019 Global Energi 2008
http://slidepdf.com/reader/full/global-energi-2008 32/59
Institutt for elkraftteknikk NTNU 32
World electricity generation
IIASA: Scenario A3
0
25000
50000
75000
100000
1990 2010 2030 2050 2070 2090
Others
HydroNuclear
Nat. Gas
Oil
Coal
TWh/year

8/8/2019 Global Energi 2008
http://slidepdf.com/reader/full/global-energi-2008 33/59
Institutt for elkraftteknikk NTNU 33
World electricity generation
IIASA: Scenario B
0
25000
50000
75000
100000
1990 2010 2030 2050 2070 2090
Other s
roNuclear
Nat. Gas
Oil
Coal
TWh/year

8/8/2019 Global Energi 2008
http://slidepdf.com/reader/full/global-energi-2008 34/59
Institutt for elkraftteknikk NTNU 34
World electricity generation
IIASA: Scenario C1
0
25000
50000
75000
100000
1990 2010 2030 2050 2070 2090
he s
Hyd o
Nu ea
Na as
l
Coal
TWh/year

8/8/2019 Global Energi 2008
http://slidepdf.com/reader/full/global-energi-2008 35/59
Institutt for elkraftteknikk NTNU 35
0
25000
50000
75000
100000
1990 2010 2030 2050 2070 2090
Othe s
H d o
Nuclea
N t. s
Oil
l
World electricity generation
IIASA: Scenario C2TWh/year

8/8/2019 Global Energi 2008
http://slidepdf.com/reader/full/global-energi-2008 36/59
Institutt for elkraftteknikk NTNU 36

8/8/2019 Global Energi 2008
http://slidepdf.com/reader/full/global-energi-2008 37/59
Institutt for elkraftteknikk NTNU 37

8/8/2019 Global Energi 2008
http://slidepdf.com/reader/full/global-energi-2008 38/59
Institutt for elkraftteknikk NTNU 38
CO2-concentration 1959-2004, from Mauna Loa, Hawaii.

8/8/2019 Global Energi 2008
http://slidepdf.com/reader/full/global-energi-2008 39/59
Institutt for elkraftteknikk NTNU 39

8/8/2019 Global Energi 2008
http://slidepdf.com/reader/full/global-energi-2008 40/59
Institutt for elkraftteknikk NTNU 40

8/8/2019 Global Energi 2008
http://slidepdf.com/reader/full/global-energi-2008 41/59
Institutt for elkraftteknikk NTNU 41

8/8/2019 Global Energi 2008
http://slidepdf.com/reader/full/global-energi-2008 42/59
Institutt for elkraftteknikk NTNU 42
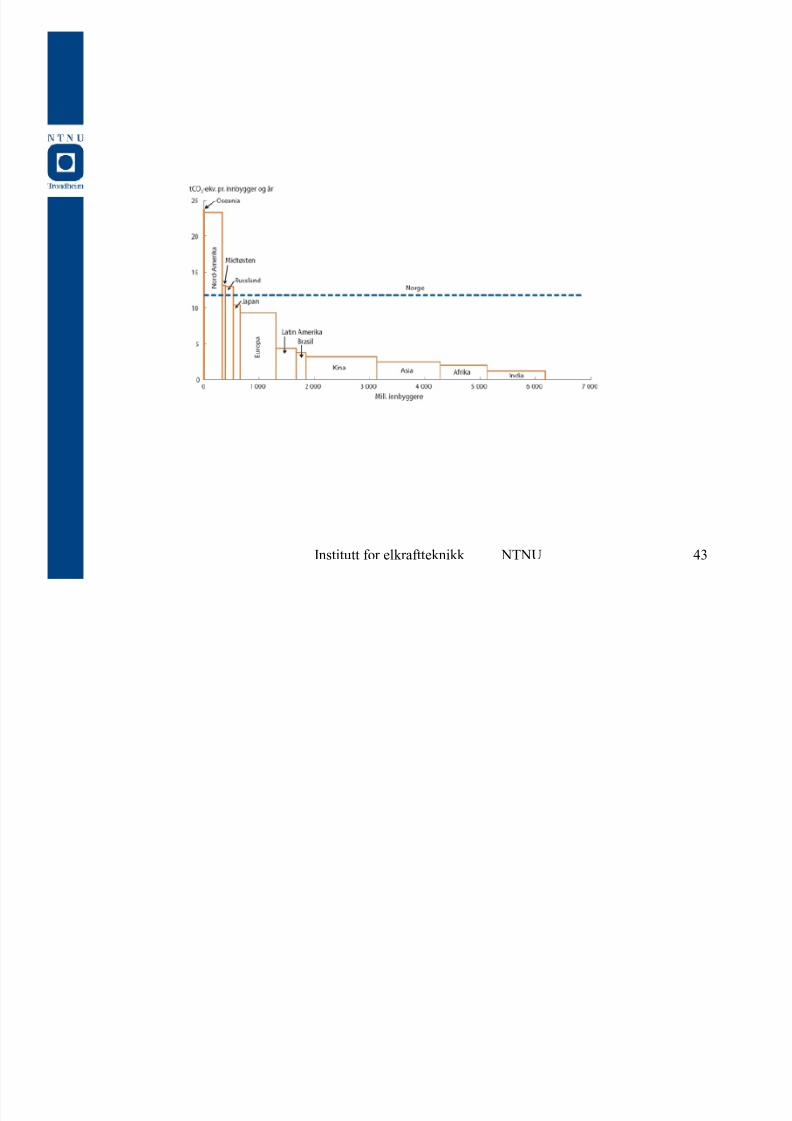
Contribution to GHG emmision
8/8/2019 Global Energi 2008
http://slidepdf.com/reader/full/global-energi-2008 43/59
Institutt for elkraftteknikk NTNU 43

8/8/2019 Global Energi 2008
http://slidepdf.com/reader/full/global-energi-2008 44/59
Green Paper: NOU 2006:18
A Climate Friendly Norway
TheThe Report from Norway¶s Low EmissionsCommission
Mandate:
Show how national emissions in Norwaycan be reduced by 50 - 80 % by 2050.
Appointed by the Government 11. March 2005
Professor Jørgen Randers, Oslo (chair)
Exec. direktor Eli Arnstad, Enova
Professor Ola Flåten, Univ. Of Tromsø
Direktor Alvhild Hedstein, Ecolabeling
Direktor Hanne Lekva, StatoilDirektor Lasse Nord, Hydro
Konserndirektør Sverre Aam, Sintef

8/8/2019 Global Energi 2008
http://slidepdf.com/reader/full/global-energi-2008 45/59
Institutt for elkraftteknikk NTNU 45
Why « Norway?
The rich countries have a large responsibilityfor today¶s situation.
Reasonable that they should lead the way.
If not rich Norway, who then?
Other progressive countries have started.
Early mover opportunities.
´All´ countries are small.
N w y

8/8/2019 Global Energi 2008
http://slidepdf.com/reader/full/global-energi-2008 46/59
Institutt for elkraftteknikk NTNU 46
Greenhouse gas emissions in the past and in theCommission¶s reference path, 1990±2050
Elect city ction
Oil and gas activities
Process industr y
Transpor tation
Heating
Agriculture, waste
Mt O2-eq. per year

8/8/2019 Global Energi 2008
http://slidepdf.com/reader/full/global-energi-2008 47/59
Institutt for elkraftteknikk NTNU 47
Greenhouse gas emissions in the past, in the reference path, andin the proposed low-emission path 1990±2050
Mt O2-eq. per year
-CO2 capture and storage f rom gas- or coal-f ired
power plants,
new renewable energy
-Electrif ication of off shore activities
-CO2 capture and storage f rom industr y, process
improvements
-Biof uels, low- and zero-emission vehicles and
ships
-Improved energy eff iciency and biomass
-Methane capture
Ref erence path
Low-emission path

8/8/2019 Global Energi 2008
http://slidepdf.com/reader/full/global-energi-2008 48/59
Institutt for elkraftteknikk NTNU 48
BNP
1 200
1 700
2 200
2 700
3 200
1995 2010 2025 2040 2055
M r d
1 9 9 9
- k r
R f r n b n n
L v pp b n n
Effect on GDPRef er ence ath
Low emissions ath
Bill.Bill.

8/8/2019 Global Energi 2008
http://slidepdf.com/reader/full/global-energi-2008 49/59
Institutt for elkraftteknikk NTNU 49
The Commission¶smain conclusion
It is necessary, doable and not
unreasonably expensive to reduce
Norway¶s GHG emissions by two thirdsby the year 2050.
Norge can without significant
renunciations become a climate friendly
country by the mid century.
Norway should establish the formal goal
of reducing GHG emissions from
Norwegian territory by two thirds by2050.
8/8/2019 Global Energi 2008
http://slidepdf.com/reader/full/global-energi-2008 50/59
Institutt for elkraftteknikk NTNU 50

8/8/2019 Global Energi 2008
http://slidepdf.com/reader/full/global-energi-2008 51/59
Institutt for elkraftteknikk NTNU 51
World generation mix 1995
TWh (%) GW (%)*
Coal 4949 (37) 1193 (38)
Hydro 2496 (19) 725 (23)
Gas 1932 (15) 465 (15)
Nuclear 2337 (18) 368 (12)Oil 1315 (10) 317 (10)
Other 129 (<1) 31 (<1)
Geothermal
Totalt:
42 (<1)
13200 (100)
10 (<1)
3109 (100)
* Estimated.

8/8/2019 Global Energi 2008
http://slidepdf.com/reader/full/global-energi-2008 52/59
Institutt for elkraftteknikk NTNU 52
Expected new capacity 1996 - 2005
(Source: TMI Handbook 1997)
GW Andel
Coal 205 30,8%Hydro 149 22,4%Gas 129 19,4%
Nuclear 65 9,8%
Oil 49 7,4%LNG 29 4,4%
Waste heat 24 3,6%Other 12 1,8%
Geothermal 3 0,5%

8/8/2019 Global Energi 2008
http://slidepdf.com/reader/full/global-energi-2008 53/59
Institutt for elkraftteknikk NTNU 53
Global hydro resources (TWh/år)Theoretical potential: 39 000 TWh/year ( Norway: 600 )Technically exploitable: 14 000 TWh/year ( Norway: 178 )
Developed (1996): 2 500 TWh/year ( Norway: 114 )Source: WEC
0
1000
2000
30004000
5000
M i d d l e
E a s t
O c e a n i a
A f r i c a
N o r t h
A m e r i c a
S o u t h
A m e r i c a
A s i a
E u r o p e
Teknisk potensiale
Utbygd

8/8/2019 Global Energi 2008
http://slidepdf.com/reader/full/global-energi-2008 54/59
Institutt for elkraftteknikk NTNU 54
Renewable GenerationCosts
1950 1975 2000 2025 2050
Gas turbinesGas turbines
2233
5
Cost pr. kWh
11
22
Solar electricity
Solar heat
Etanol/metanol
f rom biof uel
El f rom biof uel
Wind power
33
4
5
44
11
Source: Sydkr aft

8/8/2019 Global Energi 2008
http://slidepdf.com/reader/full/global-energi-2008 55/59
Institutt for elkraftteknikk NTNU 55
Wind power. World capacity
0
2000
4000
000
000
10000
12000
14000
16000
198319841985198619871988198919901991199219931994199519961997199819992000
År
M
W
Other
China
India
USAEU

8/8/2019 Global Energi 2008
http://slidepdf.com/reader/full/global-energi-2008 56/59
Institutt for elkraftteknikk NTNU 56
Other renewables OECD (-)2000/2010/2020/2030
0
100
200
300
400
500
600
700
Bio Vi eo Sol Ha0
100
200
300
400
500
600
700
Bio Vi eo Sol Ha
Ref er e ce sce ar io Alter ati sce ar io
TWh/year TWh/ year
Source: IEA, World Energy Outlook 2002
8/8/2019 Global Energi 2008
http://slidepdf.com/reader/full/global-energi-2008 57/59
Institutt for elkraftteknikk NTNU 57
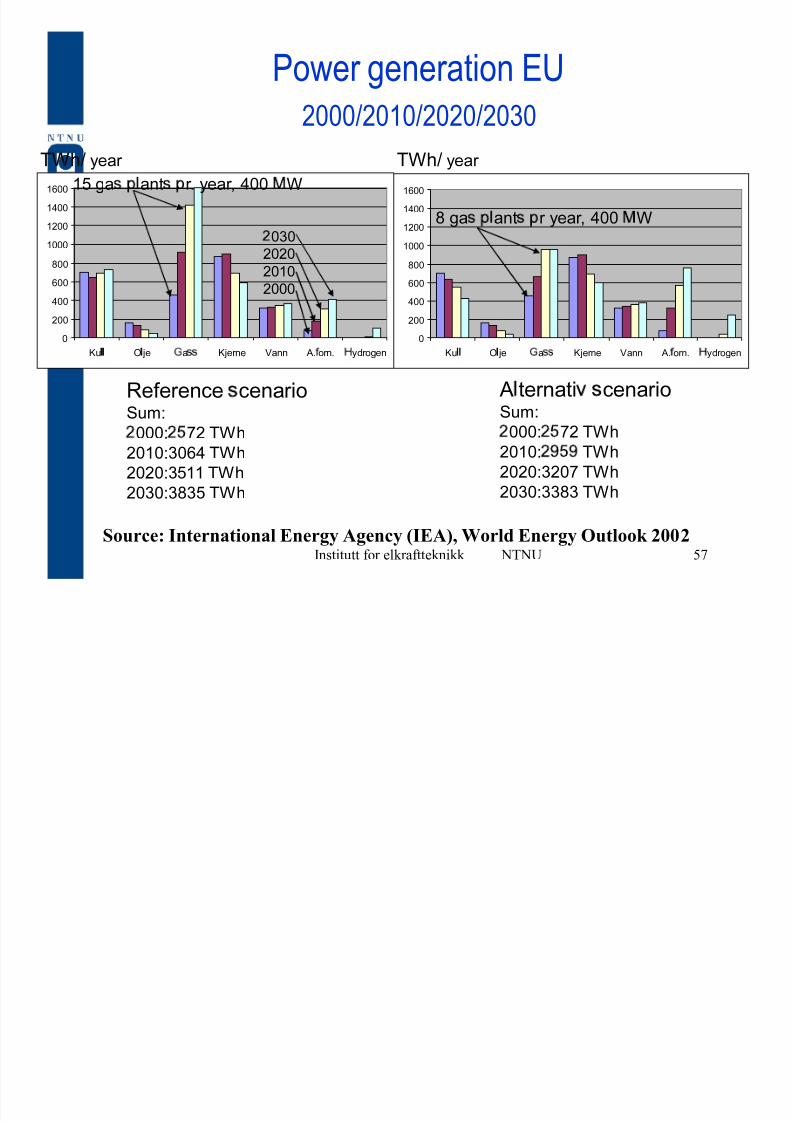
Power generation EU2000/2010/2020/2030
0
200
400
600
800
1000
1200
1400
1600
Ku
O
je ¡ a¢ ¢
K jer ne Vann A.£
or n. ¤ ydr ogen
0
200
400
600
800
1000
1200
1400
1600
Ku¥ ¥
O¥
je¦
a§ §
K jer ne Vann A. ̈
or n. © ydr ogen
TWh/ year TWh/ year
Refer ence cenar ioSum:
000: 72 TWh
2010:3064 TWh
2020:3511 TWh
2030:3835 TWh
A ter nati cenar ioSum:
000: 72 TWh
2010: TWh
2020:3207 TWh
2030:3383 TWh
Source: International Energy Agency (IEA), World Energy Outlook 2002
8 ga ant r year , 400 W
15 ga ant r. year , 400 W
030
2020
2010
2000

8/8/2019 Global Energi 2008
http://slidepdf.com/reader/full/global-energi-2008 58/59
Institutt for elkraftteknikk NTNU 58
Other renewables EU2000/2010/2020/2030
0
50
100
150
200
250
300
350
400
B o eo o a
0
50
100
150
200
250
300
350
400
B o eo o a
Ref er a sesce ar A ter at t sce ar
TWh/ year TWh/ year
Source: IEA, World Energy Outlook 2002
2030
2020
2010
2000

8/8/2019 Global Energi 2008
http://slidepdf.com/reader/full/global-energi-2008 59/59
i f lk f k ikk
Kraftproduksjon i dagens EU-landa)2000 b)IE A 2030 reference scenario c)2030 alternativ scenario
0
200
400
600
800
1000
1200
1400
1600
Kjerne Kull Gass Vann Olje Bio Vind H2 sol
Alternativ scenario
Ref erence scenarioData f or 2000
TWh/ year Sum generation:a) 2572 TWh
b) 3834
c) 3383
Source: International Energy Agency (IEA), World Energy Outlook 2002