h.-m. huang s.-d. liu national steel corporation, 12261 market st., livonia, mi 48150 s. jiang...
Post on 19-Dec-2015
215 views
TRANSCRIPT

Stress and Strain Histories ofMultiple Bending-UnbendingSpringback Process
H.-M. Huang
S.-D. Liu
National Steel Corporation,
12261 Market St.,
Livonia, MI 48150
S. Jiang
DaimlerChrysler Corporation,
800 Chrysler Dr.,
Auburn Hills, MI 48326
Daniel Morgan21 Sept 2009

Introduction
Understand the springback phenomenon and to develop a numerical simulation technique for more accurate prediction of the springback process.
○ springback often translates into costly iterative redesign, remanufacture of tooling and longer tryout times.
○ Traditional mild steel ‘‘rules of thumb’’ is insufficient when it comes to high strength steels.

References:

Experimentation & Simulation
Draw Bead Test Usually used for
determining the coefficient of friction between steel sheet and a deep drawing tool in order to determine the ideal lubricant for the forming process.

Modified Draw Bead Experiment Setup
A light gauge, hot dipped galvanneal (HDGA) high strength steel (HSS) was studied
The male and female tool radii equaled 6.5 mm The test samples were pulled through the drawbead
under different drawbead setup conditions (die gaps equivalent to integer multiple of metal thicknesses)

Modified Draw Bead Experiment Analysis Two premarked lines (points) with a distance of 102 mm and
the mid-point between them were used to measure the curvature of the sample after springback
The springback curvatures of the samples, after being removed from the DBS, were recorded and analyzed using a CAD software package
The data of the corresponding restraining (pulling) and the clamping (die holding) forces during forming were collected by the data acquisition system and used to compare with the simulation results
An ultrasonic thickness measuring device was used to evaluate the thickness strain after forming

Simulation Models:The implicit FEM (Finite Element Method) code
Abaqus/Standard was used to simulate the draw bead forming process
Both Shell and Solid Models were used○ Nonlinear Isotropic Hardening○ Nonlinear Kinematic Hardening*○ Combined Nonlinear Isotropic/Kinematic
To account for the Bauschinger effect.
*The evolution of the kinematic hardening component is defined in the rate form as:
Where: α and σ are the backstress and stress tensorsε is the equivalent plastic strainγ determines the rate at which the kinematic hardening modulus decreases with increasing plastic deformationσ˚ is the size of the elastic range

The successive expansion after initial yield is determined by the hardening parameter β
Where Ck, Ci, and Ct, are the kinematic, the isotropic, and the total hardening moduli, respectively.
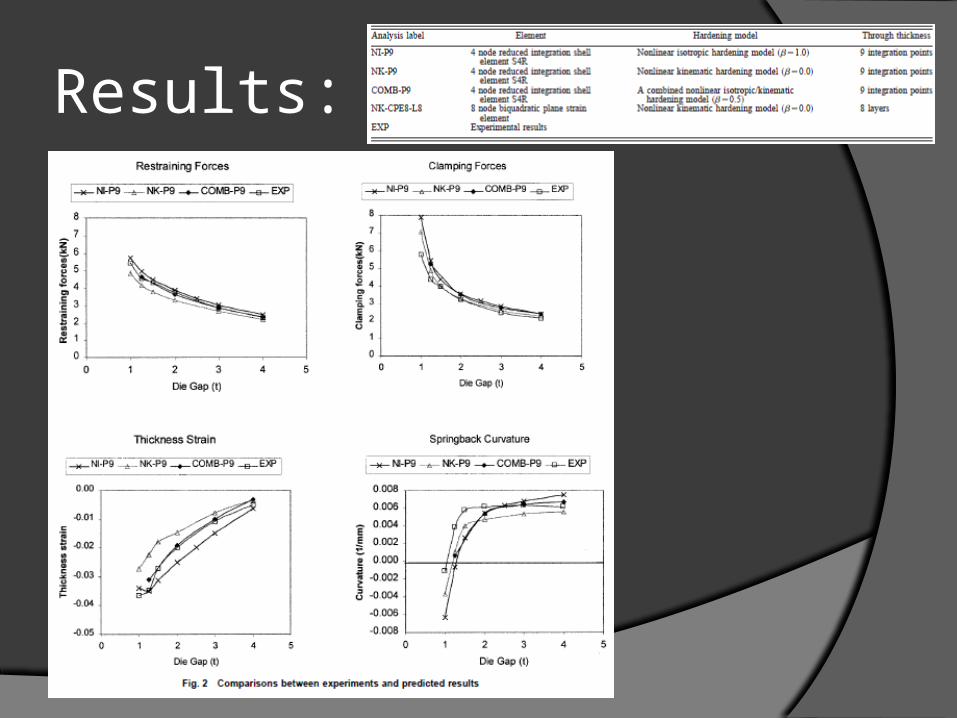
Results:

•During the springback process, the strain gradients through the thickness increase at die gap 1t but decrease at the larger die gaps. This represents a change in the curvature from negative to positive as die gap increases.
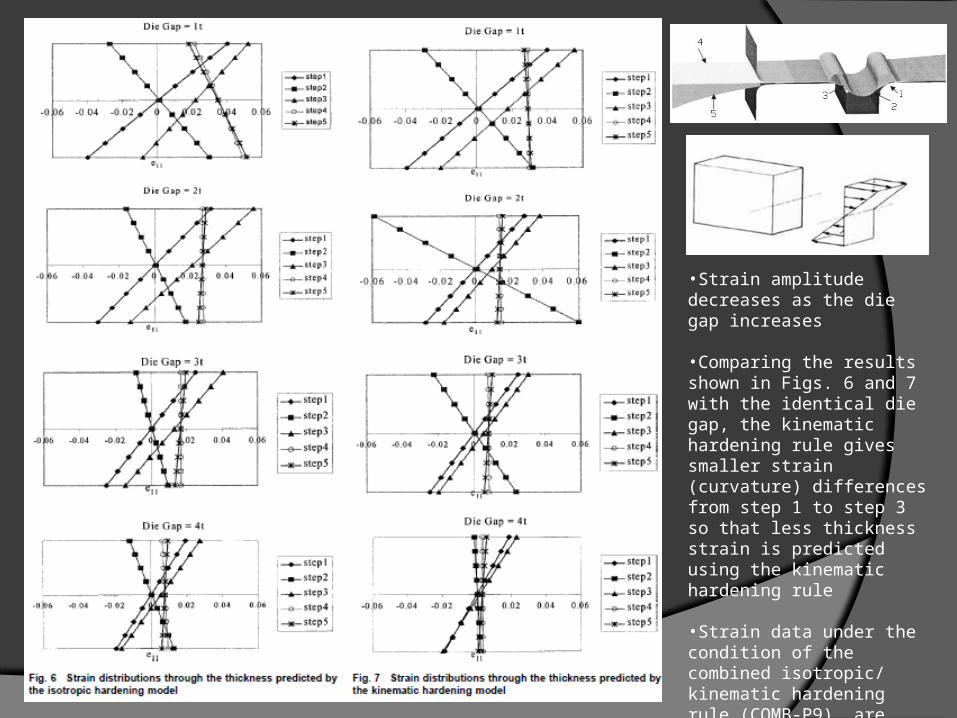
•Strain amplitude decreases as the die gap increases
•Comparing the results shown in Figs. 6 and 7 with the identical die gap, the kinematic hardening rule gives smaller strain (curvature) differences from step 1 to step 3 so that less thickness strain is predicted using the kinematic hardening rule
•Strain data under the condition of the combined isotropic/ kinematic hardening rule (COMB-P9), are found in general between the isotropic and the kinematic hardening rules.

•This data shows that the stress at the middle surface increases from step 1 to step 3 which indicates that the material experiences membrane stretching.
•At die gap 1t, the higher nonlinearity in the stress distribution through the thickness at step 4 indicates that an element with more integration points or a solid element may be needed to improve simulation results
•Except the stress at themiddle surface, Fig. 8 shows that the stress magnitude at step 3 is larger than that at step 1 predicted by the isotropic hardening model. However, the stress magnitudes at steps 1 and 3 predicted by the kinematic hardening model are almost identical, as shown in Fig. 9. This may explain why the kinematic hardening model predicts lower forces and less sensitivity to die gap in springback curvature (see Fig. 2)

Comparison Between Shell & Solid Elements
•Compared to the stress & strain distributions based on the shell element, a certain degree of nonlinearity is observed in the strain distributions predicted by the solid element as shown
•The difference between the shell and the solid elements increases as the sheet curvature increases
•In general, the strain histories predicted by the shell and solid elements are similar. The strain magnitudes during and after the springback processes predicted by the solidelement are larger than those predicted by the shell element.

Conclusions The implicit FEM code Abaqus/Standard was successfully
used to predict the forming and springback processes of sheet metal subjected to multiple bending-unbending cycles.
Very good agreements were obtained in loads, thickness strains and springback curvatures between the experimentally measured and the numerically predicted results.
Comparisons with experimental data indicate the hardening model has a very large effect on prediction accuracies in forces, thickness strains and springback curvature.
Compared with the results using a solid element, very high accuracies are obtained in the predicted stresses and strains using the shell element.

Can it be used?
Automotive companies are using HSS sheet metal more often now for reducing weight, greater formability, and weldability Help shorten design lead times and decrease
manufacturing costs
Is this simulation adaptable to different types of material?
Keep it