ibc-12-76 zink
TRANSCRIPT

Minnesota DOT’s New Software for Bridge Inspection and Management JENNIFER L. ZINK, P.E., Minnesota Department of Transportation – Bridge Office, Oakdale, Minnesota IBC-12-76 KEYWORDS: Inspection, bridges, database, maintenance, technology, asset management ABSTRACT: The Minnesota Department of Transportation has recently implemented a new software system called SIMS – Structure Information Management System. The system is used for inspection and management of its 20,000+ bridges. It reduces the amount of clerical work by allowing data entry in the field and integrates modules for structure management and maintenance. SIMS is a complete repository for all structure data. This paper discusses the process leading to implementation and features of the application itself.
INTRODUCTION There are over 20,000 bridges in Minnesota. Of these bridges, almost 5,000 are owned by the state and the remainder is owned by its 87 counties, townships, cities, and other local entities. Counties and cities are mandated to ensure that the inspections of these structures are performed to federal standards, known as the National Bridge Inspection Standards – NBIS [1], as is the state. Further regulations are also imposed by the state of Minnesota in respect to inspection frequency, inspection jurisdiction, and inspector qualifications [2, 3]. To accomplish this, agencies must employ their own inspection staff in-house or hire qualified private consulting firms with inspection expertise to perform inspections and generate detailed reports on each bridge. Typically the state, counties, and larger cities employ their own inspection staff. Additionally, each bridge owner must report to the state on the basic inspection details required by the Federal Highways Administration (FHWA) for the annual National Bridge Inventory (NBI) submission. The Minnesota Department of Transportation (MnDOT) Bridge Office is responsible for storing and managing all bridge inspection data statewide. Prior to 2011, the Bridge Office tracked data in the AASHTOWare Pontis [4] application for routine bridge inspections, which are regularly scheduled inspections not to exceed 24 months that consist of observations and/or
measurements needed to determine the physical and functional condition of the bridge, that identifies any changes from initial or previously recorded conditions, and that ensures the structure continues to satisfy present service requirements. Pontis is a comprehensive bridge management system developed as a tool to assist in the task of managing bridge data (Figure 1). Pontis stores bridge inventory and inspection data, formulates network-wide preservation and improvement policies for use in evaluating the needs of each bridge in the network, and makes recommendations for what projects to include in an agency’s capital plan for deriving the maximum benefit from limited funds.
Figure 1 – AASHTOWare Pontis Screenshot

Data was entered into Pontis by MnDOT, county, and city inspectors either remotely through web interface or by manual means – recording on paper and sending into the Bridge Office. Pontis does not have the full capability to track all bridge data such as photos, design plans, or load ratings. It also does not track data gathered during other bridge inspection types. Data for fracture critical, special, underwater and other types of inspections were stored by other means. Pontis also does not track ancillary structure data such as overhead signs and high mast light poles. It does not identify, prioritize, or track maintenance tasks resulting from inspections. Agencies employed multiple and varied methods to document and track maintenance related data, including Excel spreadsheets and programs developed in Microsoft Access as seen in Figure 2 below. As such, the system did not adequately store, manage, or communicate all structure information collectively for inspectors, engineers, and maintenance personnel in Minnesota.
Figure 2 – e-Bridge Screenshot
NEEDS
As such, the needs identified include:
Address recommendations made by the State Auditor in the report, “Minnesota Office of Legislative Audit Evaluation Report – State Highways and Bridges February 2008.” [5] Recommendation that MNDOT, “Should establish standard procedures for documenting, communicating, and following up on bridge inspectors’ maintenance recommendations.”
Address the State Auditor recommendation to have a unified system for managing bridge maintenance. The MnDOT Districts currently employ multiple and varied means to document and track maintenance related data, including Excel spreadsheets, a program developed in Microsoft Access and an Oracle application.
Aid in compliance with FHWA regulations;
specifically, “Code of Federal Regulations Section 650.315 [6]: Inventory (b) For routine, in-depth, fracture critical member, underwater, damage and special inspections enter the SI&A data into the State or Federal agency inventory within 90 days of the date of inspection for State or Federal agency bridges and within 180 days of the date of inspection for all other bridges.”
Improve inspection documentation, timeliness, and accuracy.
Provide a unified system to store and retrieve all data gathered during bridge and structure inspections remotely from the inspection site.
Provide a bridge inspector with all of the resources at their fingertips as they are performing bridge inspections.
Record inspections of bridges, high mast light poles, overhead sign structures, and other ancillary structures in the state.
Align with MnDOT’s key focus area of, “Safeguard What Exists - Preserve Critical Infrastructure.” [7]
Align with MnDOT’s Strategic Vision of, “Safety - Promote and maintain a safe, reliable and modern transportation system.” [7]
Additional business goals identified in regards to cost savings and customer service include:
Reduce manual or duplicate entry of structure and inspection data
Spend less time manipulating data and preparing reports
Reduce the time to perform, enter and review a structure inspection
Reduce the time that it takes to manage and communicate maintenance recommendations
The needs to address are easily identifiable in lieu of a significant bridge failure such as the 35W bridge, as it then forces agencies to look at their current practices. However, it does not fully explain why the practices did not work in the first place. In order to explain this, the State’s communication network in respect to bridge inspection findings, maintenance, and engineering was investigated and analyzed. BRIDGE COMMUNICATION NETWORK ANALYSIS USING NODEXL - To analyze the state’s bridge communication network, a program was utilized that analyzes social media networks. NodeXL is a free program template for Excel 2007 that analyzes and visualizes social media networks [8]. Social media networks are communication venues such as e-mail, texting, blogs, and wikis with the intent to share

knowledge. Voluminous user data, attachments, and network connections between users consume the way people communicate and ultimately create complex social networks. Comprehending how these social media networks develop, transform, fail, or thrive is a rising concern to researchers and business professionals. By applying network analysis to social business systems, one can identify potential problems and avenues to resolve them.
Figure 3 – NodeXL Sample Screenshot
Network relationships are represented as an edge list in NodeXL, which contains pairs of vertices that are connected in the network (Figure 3). A person may enter their own edge list in the Edges worksheet tab or one can be imported from an existing data source such as a company e-mail network. It is important to note that entry of two vertices (i.e. columns Vertex 1 and Vertex 2) is necessary to make a connection. Once an edge list is entered, a graph of the data is shown by clicking the Show Graph button in the program. The graph shows the network of relationships between the vertices of the edge list. The vertices can also be arranged in the graph pane. There are several automatic layouts offered by the program. The default layout is called Fruchterman-Reingold. Other layout types include circle, spiral, and grid. Manual layout is also an option. The vertices can be clicked and dragged in the graph pane to create arrangements that emphasize a more orderly display. Experimenting with different layouts can reveal important patterns and/or relationships. Since social networks tend to be large, graph output will be cluttered. Visual design changes can make the network displays more meaningful. Vertex colors and sizes can be changed. Descriptive information about the data set can also be added along with text labels. There is a filtering tool that can riddle out vertices and edges to focus on certain sections only. NodeXL can
also identify vertices that are clusters of some specified group, such as inspection employees as opposed to maintenance employees. Clusters can be created manually or identified automatically by the program. Once a cluster is identified, then visual design changes can be applied. Like the filter feature, clusters can also be hidden with just a click of the computer mouse. Although tools and processes to analyze social networks are just beginning to evolve, NodeXL is an easy program to use, but it does take some advanced knowledge of Excel. The online tutorial however, is helpful in getting started. Even though it is free of cost, NodeXL can only be used with Microsoft Excel 2007 and 2010. Earlier versions of Excel will not run the program. Other implications of NodeXL include the ability of the user to identify meaningful information in the data sets and to customize them accordingly. Much time can be spent trying to visualize and graph data in a meaningful manner. The NodeXL program was utilized for the social network display of interactions between engineers, bridge inspectors, and bridge maintenance workers in the Minnesota Department of Transportation. The goal was to pinpoint any visual gaps in communication from engineers to inspectors and inspectors to maintenance workers. Other key players involve Central and District Bridge Engineers, bridge load ratings personnel, bridge designers, and bridge data management personnel. All are vital in how inspection findings are evaluated and then distributed to others for further analysis and/or bridge maintenance work orders. The communication networks were developed through individual observances of personnel and through District organizational charts. After entering the key personnel and communication connections (i.e. edge lists) into the program, the data was graphed into different layouts. Much time was spent on visually reorganizing the data to show meaningful communication gaps, or silo effects [9]. Clusters were created to show inspection and maintenance personnel separately. Figure 4 portrays communication that existed between the MnDOT Bridge Office and the Districts prior to 2011. This figure illustrates the silo effects of each District to itself, depicted by the ovals, with only one connection to the Bridge Office.

Figure 4 – NodeXL MnDOT District Silo Effect
Not only is there disconnect between the Districts, but there is also separation between engineers, inspectors, and maintenance crews. Figure 5 shows the same personnel as in Figure 4, but also shows which nodes are engineers, inspectors, and maintenance personnel. It shows a distinct surplus of engineers compared to inspectors and maintenance staff.
Figure 5 – NodeXL District Engineers, Inspectors, and Maintenance
To better visualize the communication breakdown between key personnel in regards to inspection, engineering, and maintenance, an alternate layout was chosen as shown in Figure 6. This graph shows the silo effect that exists between engineers, inspection, and maintenance in the Districts, as depicted by the ovals. It is also worthy to note that each District is not structured the same. Some Districts have better communication networks than others.
Figure 6 – NodeXL Inspection and Maintenance Silo Effect
The graphs ultimately show a distinct breakdown of communication between inspection, maintenance, and engineers in the Districts with the Bridge Office. It shows that inspection findings are not directly given to the bridge maintenance crews. Another significant finding is that typically one engineer is connected to the State Bridge Engineer to relay important information to other personnel. If that connection is absent either permanently or temporarily by means of illness or turnover, then there is no direct communication line to that District or section. The result of the bridge network graphs is explained by the structural organizational dimensions of MnDOT [10]. Organizations as large as MnDOT are traditionally hierarchal in nature with one line of communication connecting each employee level. Hierarchal organizations are centralized in their decision making, political in nature, and have clear reporting lines with different levels of superiority as depicted in Figure 7. They can be highly efficient organizations but can also lack leadership strength since personnel are often promoted by length of service and not necessarily by quality of work.
Figure 7 – Hierarchal Organization The complete opposite of a hierarchal organization is a horizontal one. A horizontal organization is typically comprised of task forces, project managers, and teams with main lines of communication between all

members of the organization (Figure 8). It is considered a learning organization. However, it can be difficult to implement since there is a non-traditional lack of authority or superiority. People are always rewarded for quality of work and not length of service.
Figure 8 – Horizontal Organization A combination of the two organizational structures is the most practical on the road to change. The silos that exist in the bridge network due to the hierarchal nature of MnDOT inhibit efficient communication between inspectors, engineers, and maintenance personnel. The goal is then to take this information, and explore communicative solutions to restructure the organizational system creating more connections without reinventing the organizational structure of MnDOT (Figure 9).
Figure 9 – Ideal Connections
OBJECTIVE
The problems identified have been recognized by MnDOT due to the bridge inspection program investigations and recommendations made by the State Auditor in lieu of the 35W bridge collapse. As a result, a project is currently underway at MnDOT to address these inspection program problems and recommendations. The project involves a collaborative effort of bridge inspection, bridge management, and information technology staff. The purpose of this project was to implement a bridge inspection system as part of MnDOT’s effort to ensure the availability of timely inspection data for bridges and structures in Minnesota. The new system provides electronic field data collection capabilities to inspectors, streamlining the inspection process and increasing data integrity by eliminating the current delay between data collection, data entry, and report generation. Types of additional data that are tracked include load ratings, maintenance work orders, and inspection related items such as narrative descriptions, photos and design plans. This project provides a link between all bridge data, and also provides a means of tracking ancillary structure data such as overhead signs and high mast light poles. This project also provides a means to identify, prioritize, and track maintenance tasks resulting from inspections. The system also must interface with the AASHTOWare Pontis application, previously used by the Bridge Office to track data from routine bridge inspections, performed by MnDOT, County, City inspectors, and consultants but now is used for solely modeling and forecast capabilities. In today’s fast-paced society, managers and decision-makers need accurate data in a usable format instantly. A web-centric system is one that is internet-based and compatible with different data formats used in engineering today through the use of smart browsers and/or servers. It has the ability to manage, store, and communicate data in seconds. MnDOT undertook research and analysis including current system failures and their cause or causes (as denoted by the NodeXL social media network analysis), analysis to substantiate or refute all possible solutions to the problems, potential vendor questionnaires and on-site demonstrations, benefit/risk investigation, return of investment analysis, system implementation plan, and future work. Before immersing into the research and analysis, understanding of web-centric systems is necessary.

Many characteristics differentiate a web-centric, or automated, system from the traditional paper-based inspection system [11, 12]. Ownership of the data, or information, is central and independent of the people who possess and employ it. Information is universally accessible via the internet as opposed to data stored in numerous physical locations with different people. Furthermore, data based in a web-centric system is always available. Customized reports are readily obtainable by query. New participants can also be easily incorporated through any internet connection. There is no software to install on client computers or extensive training involved. An ideal development model first explicitly defines what the process is supposed to do or accomplish that the current process does not. For example, a web-centric/automated system is ideal when there are no consistent applications of technology for dispersed information between different organizations or sections, such as disconnect between inspection recommendations and follow-up actions based on those recommendations. To visualize and standardize such processes, data flow diagrams are typically used by illustrating the interactive steps between people and/or tasks. Once the process is defined, the next step is to define how each task is implemented whether by way of web servers, pen-based computers, or a combination thereof. A pilot, or sample, project is then recommended to evaluate the system created. This enables evaluation and correction of any problems prior to full system implementation. Because web-centric systems typically involve newer technologies, equipment and start-up costs can be significant. Integrating different web-based formats can also be a formidable and time-consuming task. Many people need to be involved to successfully implement the system. Top management support is essential. Furthermore, security concerns are always a factor with sensitive information displayed over the internet. Precautions are necessary to ensure that data is secure and not able to be tampered with. Even ten years ago during the infancy of the World Wide Web, web-centric systems were researched and discussed as potential solutions to a growing network of people, information, and the transfer of that information between people. Obvious benefits in time, accuracy, and money are probable. Today, technology has vastly improved but unfortunately, the engineering community has not evolved in comparison. There is so much scattered data out in cyber space.
Problems have started to arise with storage, security, and non-compatible formatting. Along with the explosion of digital data, paper-based data is still used. There are also scores of historical data not yet incorporated into digital availability. As a result, numerous forms of information are created and kept in multiple systems and formats. Many current systems, such as field inspection and reporting, are subdued by endless information processing. Public service and effective communication are ultimately compromised by this hindrance. Now is the time for the engineering community to hone in on web-centric technologies.
POTENTIAL SOLUTIONS The following solutions were considered by MnDOT for a structure management system: 1 – Modify the Pontis system 2 – Develop a new system 3 – Acquire and customize a commercial system 4 – Acquire and customize a system from another agency 5 – Do Nothing The selected option: #3 – Acquire and customize a commercial system A survey was developed and sent to other state transportation departments to determine the current status of bridge inspection and maintenance tracking systems. Most states still utilize Pontis by AASHTOWare, but with limited success. Many of these states are in the initial phases of investigating other potential products that are more comprehensive and web-centric, as communication gaps (silos) are likewise present. Pontis currently does not provide a comprehensive system for both inspection and maintenance data. Modification of Pontis to meet these objectives is uncertain due to current software implications, time, and cost. Furthermore, the present environment within the Minnesota Department of Transportation does not have the means to scope, design, develop and build a comprehensive bridge inspection and maintenance system. Only two states declared comprehensive systems at the time that encompass both inspection and maintenance, one of which used a vendor product. The Illinois Department of Transportation has a system developed internally that is not available to other states. The Wisconsin Department of Transportation also has a system developed for their agency by a computer software vendor that is maintained internally and free of charge to other agencies, but it does not include a maintenance tracking module. However,

total customization of another agency-owned system would require extensive resources. SWOT ANALYSIS - In order to substantiate the selected solution, a SWOT analysis [13] was utilized to verify the choice made. A SWOT analysis is a tactical planning technique used to assess the Strengths, Weaknesses, Opportunities, and Threats involved in a project endeavor. It involves identifying the internal and external aspects that are positive and negative to achieving the objective of the project. The objective here is to implement a web-centric/automated bridge inspection system to ensure the availability of timely inspection data for bridges and structures in Minnesota. A number of free templates are available to create a SWOT analysis [14]. The input consists of the strengths/weaknesses of MnDOT internal factors and threats/opportunities of potential external commercial systems as shown in Figure 10. Internal MnDOT factors evaluated include people and skills, resources, innovation, current systems, and finances. External system factors evaluated include financing, product complexity, technology, and consumers. The weights assigned to strengths/weaknesses and opportunities/threats range from -10 to 10, with -10 being a clear weakness or threat and 10 being a sound strength or opportunity. Obviously, some factors are not clearly on one end of the spectrum or the other. Therefore, moderate values of 5 and -5 are employed. Each factor was ranked based on problems noted by the State Auditor and the research of potential systems to remedy these problems.
Figure 10 – SWOT Table
In regards to communication, the opportunities for better communication through a web-centric system (external) can be depicted by improving existing processes and external customer service. The current bridge network system (internal) communication silos are exhibited by qualities of the Pontis system, bridge filing, and maintenance tracking. Based on the weighted values in the SWOT Table, Figure 11 shows the average internal factors (vertical axis) graphed against the external factors (horizontal axis). The yellow circle indicates current inspection
system characteristics in relation to the option chosen. The green circle, which is located in the upper right-hand corner of the chart, is the ideal inspection system traits. The blue arrow is the strategic direction towards the ideal situation over time – depicted by the concentric circles. The chart ultimately shows that the system was weak with little opportunity, and as a result, was no longer functioning at the appropriate level in regards to timely inspection data and bridge information overall.
Figure 11 – SWOT Chart
Individual SWOT analyses were completed for the other potential solutions as well; however, acquiring a commercial system and customizing it is more beneficial than the other options as shown graphically in the comparison chart below (Figure 12). The selected option, depicted by the yellow circle, has the shortest line to the ideal situation. This means that the combination of strengths and opportunities outweighs the weaknesses and threats of the other 4 options.
Figure 12 – SWOT Comparison
RESEARCH AND STUDY

Once the solution was chosen to acquire and customize an entirely new bridge management system, the question evolved, “What systems are available that will meet the needs and close the communication silos of the MnDOT bridge network?” As a result, research was conducted to solicit information from other agencies that use different systems than Pontis. Since bridge inspection automation is a relatively new field, only three potential companies were found at the time. A detailed questionnaire on data collection and bridge management systems were sent to each company. Out of the four questionnaires sent, two were returned. Based on knowledge known about the individual companies and the completed questionnaires, a comparison chart was developed to evaluate the current Pontis system against the other systems as shown in Figure 13.
Figure 13 – Inspection System Comparison
Through the survey, it was revealed that the Wisconsin Department of Transportation (Wis/DOT) has a program internally developed by a software consultant customized to their requirements. Wis/DOT, along with the other companies solicited, was petitioned to demonstrate their systems to MnDOT bridge inspectors, engineers, and maintenance staff. AVAILABLE SYSTEMS - A brief overview of three systems is given below based on the returned questionnaires and onsite demonstrations. InspectTech [15] InspectTech provides secure software solutions for structure inspection and management. The core software is customizable to customer needs. It allows incorporation of pictures, sketches, manuals, plans, etc. It can be integrated with business processes and programs and provides continual training and support. The product can incorporate all types of structures, such as bridges, culverts, overhead sign structures,
tunnels, retaining walls, sound walls, guard rail, and high mast lighting. Typical customers include state departments of transportation, numerous counties and consultants, transit authorities, and the U.S. armed forces. Main customers are those with large bridge inventories. Other DOTs utilize this product for their bridge inventory. A teleconference took place with other DOTs to obtain their perspective of the product. Overall, the perception was favorable. InspectTech provides two software packages; one for inspection and one for bridge management. The inspection software runs on a laptop in the field and through the internet in the office. It can be customized to any agency’s needs. It is Pontis-element ready and produces formatted reports. Other data such as pictures and sketches can be loaded directly into the program. The manager software handles all bridge data such as the inspection data, maintenance needs and work orders, cost estimates, inspection scheduling, photos and manuals accessible to inspectors, engineers, and maintenance staff. There is even a GIS module to plot bridge locations on a map to aid in inspection scheduling efforts. Total cost is $200,000 - $800,000 depending on customization with an annual maintenance fee of $30,000. An onsite demonstration took place at the MnDOT Bridge Office in March 2009. Advitam [16] Advitam provides solutions for inspection, monitoring, and management of structures. Customers include the City of New York, South Carolina DOT, Canada, and Greece to name a few. Although this company provides services to large agencies, it caters mainly to large specialized bridges and not an entire state bridge inventory. The largest amount of structures managed for any one agency at that time was around 2,100. The software contains applications for structure inventory, inspection, maintenance work and repairs, reporting, and analysis. It is an infrastructure management database system that provides mobile site-inspection via tablet PC or a hand-held PDA device, AutoCAD interface that allows the user to store, retrieve, and update drawings and defects of bridge components, comprehensive bridge inventory, condition rating, deterioration analysis ability, and multiple reporting abilities. The software has a built in Quality Control Function as the inspector must accept rating data for every element and known defect. The system allows the inspector to visually verify that all components had been inspected and verified. The software also has a
procedure for documenting changes in known defects over time. When linked to a CAD drawing, the attributes of the defects can be directly entered into the database from the drawing. This system would be useful for both complex bridge inspections such as large segmental box girder bridges, fracture critical bridges, and for routine inspections. Advitam also has bridge management and structural health monitoring systems. Total cost with customization is around $300,000 with an annual maintenance fee of $30,000. A demonstration took place at the MnDOT Bridge Office in April 2009. Wisconsin DOT Highway Structures Information System (HSI) HSI is a comprehensive asset management system that incorporates over 19,000 structures. This system has similar abilities to that of InspectTech and Advitam. It is Pontis ready, has the ability to attach photos, incorporates a quality control effort, and can map bridge locations using Google maps. Inspectors can utilize the program in the field by checking out bridges onto a laptop from the office. All local agencies, consultants, and contractors use the system. At this time, only inspection data and bridge plans are in this system. It is the state’s goal for the system to incorporate all structure data such as design plans, shop drawings, reports, ratings, and photos. The initial cost to develop this system was $500,000 with additional yearly maintenance around $75,000 to $90,000. This system is available free to other states in its current format; however, it is highly probable that a surmountable effort to customize the system would be needed to meet MnDOT’s objectives. An onsite demonstration was held at the MnDOT Bridge Office in March 2009.
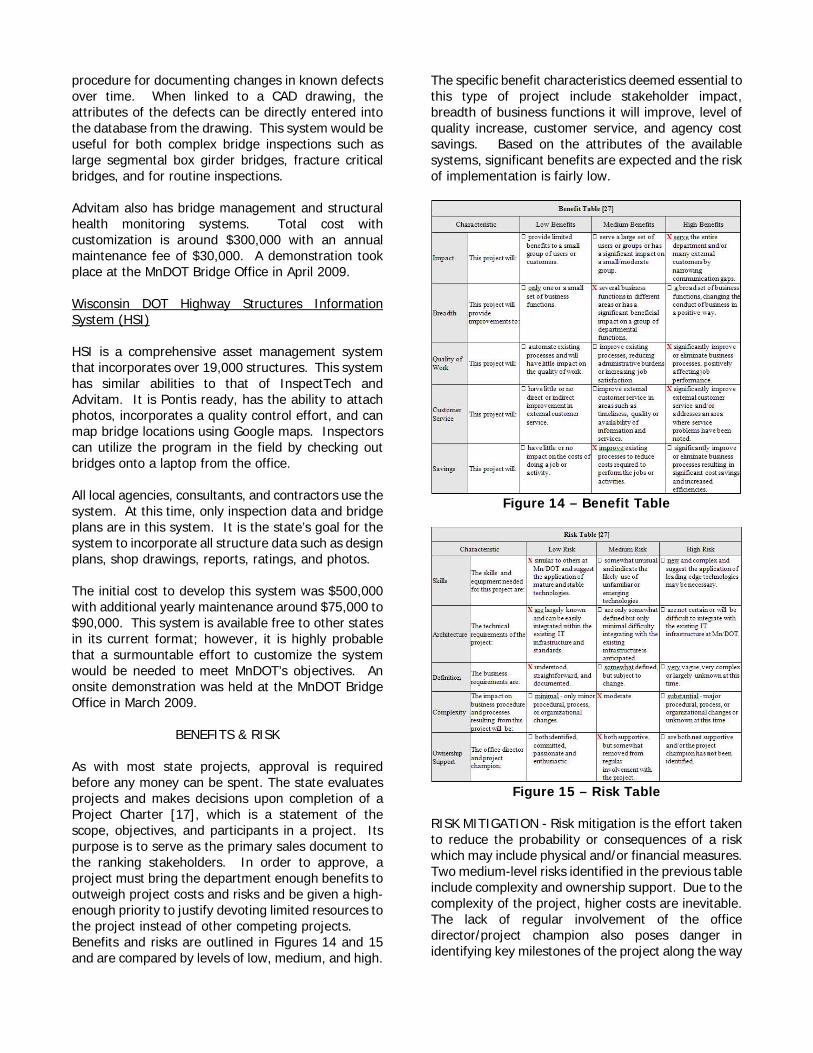
BENEFITS & RISK As with most state projects, approval is required before any money can be spent. The state evaluates projects and makes decisions upon completion of a Project Charter [17], which is a statement of the scope, objectives, and participants in a project. Its purpose is to serve as the primary sales document to the ranking stakeholders. In order to approve, a project must bring the department enough benefits to outweigh project costs and risks and be given a high-enough priority to justify devoting limited resources to the project instead of other competing projects. Benefits and risks are outlined in Figures 14 and 15 and are compared by levels of low, medium, and high.
The specific benefit characteristics deemed essential to this type of project include stakeholder impact, breadth of business functions it will improve, level of quality increase, customer service, and agency cost savings. Based on the attributes of the available systems, significant benefits are expected and the risk of implementation is fairly low.
Figure 14 – Benefit Table
Figure 15 – Risk Table
RISK MITIGATION - Risk mitigation is the effort taken to reduce the probability or consequences of a risk which may include physical and/or financial measures. Two medium-level risks identified in the previous table include complexity and ownership support. Due to the complexity of the project, higher costs are inevitable. The lack of regular involvement of the office director/project champion also poses danger in identifying key milestones of the project along the way

to upper management, of who hold the approval to funding. The explicit risk is that the Engineering Services Division will not have the funds approved from IT Development to allocate to the project in the timeline in which it is needed. Mitigation would be to seek funds from elsewhere in the department. A less overt scenario of the project complexity is that more staff and time is required to implement this project. Therefore, a possible risk is that the Office of Information & Technology Services doesn’t have the resources to devote to the project in the timeframe in which they are needed. Mitigation would be to delay the project to a time that better fits with staff availability. Likewise, the Bridge Office staff may not have the time to devote to the project in the timeframe in which it is needed. Mitigation would be to delay the project to a time that better fits with staff availability or staff would be augmented.
RETURN ON INVESTMENT Return on investment is a quantity used to help make project selection decisions. It is typically calculated by dividing the cumulative annual costs of the project by the tangible benefits. A return on investment was calculated for this proposed project. Cost inputs include vendor software, hardware, consulting and state personnel labor costs, estimated training (both initial and annual), and annual software maintenance fees. Vendor software cost determined for this project is the highest estimate provided by the most probable available systems. These software costs refer to statewide unlimited user licenses for both office computer and field laptop versions. The hardware costs are based on typical server hardware costs and on the purchase of 50 fully rugged Panasonic Toughbook laptops at $3,700 a piece for inspection staff. Currently, there are a total of 86 certified inspectors working for MnDOT in the Districts. Inspection teams are typically comprised of 2 inspectors; therefore, an estimate of 50 laptops is the assumed need. Roughly 2000 hours were projected for consultant customization of the product and 2000 hours spent by MnDOT staff to implement the system. Other costs include training hours accumulated during project initialization and yearly updates thereafter. The tangible benefits/savings were calculated by MnDOT statewide labor reports for hours invested by inspection staff on bridge inspections, reports, and reviews for the 2008 calendar year. Typical state employee wage assumed is $50/hour, which includes both salary and fringe benefits. Based on historical consultant project costs performed for the state,
consultant wage assumed is $100/hour, which also includes both salary and fringe benefits. Once the amount of hours was determined for each employee, percentages of time saved were applied based on a Return of Investment analysis completed by the Pennsylvania Department of Transportation (PennDOT) in 2005. PennDOT compared field and office hours spent in one District on inspections in 2001 and 2003 to the hours using InspectTech for the same 124 bridges. The estimated time savings in inspection-related office duties, such as report writing and review, was up to 60%. Time savings in inspection-related field duties was up to 15%. As a result, a total of 21,798 hours was charged by MnDOT employees to field inspections and 14,791 hours to report writing, data entry, and review in 2008. When applying 15% savings to 21,798 hours, the calculated value is 3,270 hours. When applying 60% savings to 14,791 hours, the calculated value is 8,875 hours. In order to correct for inefficient transfer of time based on the assumption that an hour saved is not an additional hour worked, a correction factor of 0.75 was applied to the total hours saved as indicated below in the Adjusted Hours Saved row. ROI SUMMARY TABLE - The summary table in Figure 17 shows that the total savings is cumulative benefits minus cumulative costs. As expected at project initiation, there are no benefits and only costs. However, due to the projected time savings, the system is expected to pay for itself in about 2.5 years!
Figure 17 – Return of Investment
SIMS IMPLEMENTATION & FEATURES

Since there is a substantial positive return of investment, MnDOT invested in the product from InspectTech. To first evaluate the benefits of using inspection software, a pilot project began in early 2010. The new system, named SIMS (Structure Information Management System) was used to generate key parts of routine documentation and reports generated for five Minnesota fracture critical bridges. The software was customized by InspectTech to support direct generation of the primary sections in the MnDOT inspection report format. Overall, the system provided a platform to integrate information from disparate sources/files into a unified format in a single, easily usable, and accessible location. The total fixed cost for completing the pilot project was $30,000 and covered the cost of software customization, unlimited usage (for scope and duration of the pilot), support, and all travel and training expenses incurred by InspectTech. Upon successful completion of the pilot project, full implementation of SIMS was then planned into phases. PHASE I: INSPECTION MODULE – Complete implementation of the inspection module included integration of the current electronic data from Pontis into SIMS, provide training to applicable users statewide, identify and fix any data or programming errors utilizing the pilot project data, integrate data from SIMS back into Pontis for modeling capabilities, and incorporate bridge documentation into SIMS such as photos, load ratings, bridge plans, etc. Among these items, specific inspection input forms and reports were created and customized to state needs. A sample screenshot of the typical inspection input form is shown in Figure 18. The timeline to create and implement Phase I was April 2010 to April 2011. Input of inspection data into SIMS began with the 2011 inspection season.
Figure 18 – SIMS Inspection Input
PHASE II: MAINTENANCE MODULE – The
maintenance module of SIMS is directly linked to the inspection module. Users are able to add/edit maintenance tasks within an inspection based directly on inspection data and assign priority level to the tasks – see Figure 19. Like the inspection module, users are also able to add photos and other documents in relation to a maintenance task. Reporting abilities are available by individual bridge, by area or owner of bridges, by maintenance tasks, and by priority. Creation of the maintenance module began in late 2011 and is currently ongoing at this time.
Figure 19 – SIMS Maintenance Input
PHASE III: 3D INSPECTION MODULE – Larger structures contain multitudes of inspection documentation. Viewing this information can be cumbersome. In order to view this information in a meaningful way, a 3D inspection module is planned for 2012 on major structures in Minnesota. This module breaks down the bridge into specific element members by 3D mapping, allowing data to be categorized and easily searchable – see Figure 20.
Figure 20 – 3D Inspections
PHASE IV: ANCILLARY STRUCTURES – Future work includes inspection and maintenance tracking of ancillary structures such as retaining walls, light poles, radio towers, and overhead signs. This phase is projected to begin in 2013 at the earliest.
CONCLUSION

Pontis, previously utilized in Minnesota to gather bridge data, did not adequately store, manage, and communicate all structure information collectively. It did not have the full capability to track all bridge data such as photos, design plans, load ratings, etc. It also did not track data gathered during other types of bridge inspections or that of ancillary structures such as overhead signs and high mast light poles. It did not identify, prioritize, and track maintenance tasks resulting from inspections. Agencies employed multiple and varied methods to document and track maintenance data, such as Excel spreadsheets. The collection of inspection data itself is time consuming. Traditional bridge inspection in the field is paper-based. Due to aging infrastructure, more time is needed to quantify and record defects to establish maintenance needs. This leads to significant increases in data. When coupled with the practice of data re-entry in the office, the result is a loss of efficiency, input errors, data redundancy, and communication breakdowns between engineering, inspection, and maintenance. The silos that exist in a state bridge network due to hierarchal nature inhibit efficient communication between inspectors, engineers, and maintenance personnel. A web-centric/automated system provides the solution to conform these silos without reinventing the state organizational structure and is expected to improve the accuracy and efficiency of data collection and asset management.
REFERENCES
1. National Bridge Inspection Standards. Retrieved 2009 from http://www.fhwa.dot.gov/bridge/nbis.htm.
2. 2009 Minnesota Statutes Chapter 165. Bridges. Minnesota Office of the Revisor of Statutes. Retrieved 2009 from https://www.revisor.mn.gov/statutes/?id=165.
3. Minnesota Administrative Rules Chapter 8810 Bridge Inspection and Inventory. Minnesota Office of the Revisor of Statutes. Retrieved 2009 from https://www.revisor.mn.gov/rules/?id=8810&view=chapter.
4. AASHTOWare. Retrieved 2009 from
http://www.aashtoware.org/.
5. Evaluation Report Summary/February 2008. Minnesota Office of Legislative Auditor. Retrieved 2009 from
http://www.auditor.leg.state.mn.us/ped/pedrep/trunkhwysum.pdf.
6. Code of Federal Regulations. Retrieved 2009
from http://www.fhwa.dot.gov/legsregs.
7. Minnesota Department of Transportation Strategic Vision. Retrieved 2009 from http://www.dot.state.mn.us/strategicvision/vision.html.
8. NodeXL: Network Overview, Discovery and
Exploration for Excel. Retrieved 2009 from http://www.codeplex.com/NodeXL/.
9. Bronczyk, Andy (2009). Temperature
Organizational Network Analysis [PowerPoint Slides]. Retrieved 2009 from http://www2.webvista.umn.edu/webct.
10. Gupta, Ashim. Structural Dimensions of an
Organization. Retrieved 2009 from http://practical-management.com/Organization-Development/Structural-Dimensions-of-an-Organization.html.
11. Elzarka, Bell, and Floyd. (1999). Automated Data
Acquisition for Bridge Inspection. Journal of Bridge Engineering, 4.4, 258-262.Retrieved February 2, 2009, from ASCE, http://pubs.asce.org/copyright.
12. Hammand, A. and Hu, Y. (2005). Location-Based
Mobile Bridge Inspection-Support System, 1st CSCE Specialty Conference on Infrastructure Technologies, Management and Policy, Toronto (10 pages).
13. SWOT Analysis. Retrieved 2009 from
http://en.wikipedia.org/wiki/SWOT_analysis.
14. Inghenia SWOT Tool. Retrieved 2009 from http://www.inghenia.com/gadgets/swot/swot en.php.
15. InspectTech. Retrieved 2009 from
http://www.inspecttech.com/.
16. Advitam. Retrieved 2009 from http://www.advitam-group.com/.
17. Project Charter (v 2007.4). MnDOT Office of
Decision Support, Enterprise Portfolio Management (12 pages).